Article

Simultaneous Determination of Vitamin E and Vitamin K in Food Supplements Using Adsorptive Stripping Square-Wave Voltammetry at Glassy Carbon Electrode

1
Department of Biological and Biochemical Sciences, Faculty of Chemical Technology, University of Pardubice, Studentská 573, 53210 Pardubice, Czech Republic
2
Department of Chemistry, Faculty of Mathematics and Natural Sciences, University of Prishtina, St. Mother Teresa, 10000 Prishtina, Kosovo
3
Department of Analytical Chemistry, Faculty of Chemical Technology, University of Pardubice, Studentská 573, 53210 Pardubice, Czech Republic
*
Author to whom correspondence should be addressed.
Appl. Sci. 2020, 10(14), 4759; https://doi.org/10.3390/app10144759
Submission received: 2 June 2020 / Revised: 7 July 2020 / Accepted: 8 July 2020 / Published: 10 July 2020
(This article belongs to the Special Issue Applications of Enzymatic Electrochemical Biosensors)

Abstract

:
A new voltammetric method for the simultaneous determination of vitamin E and vitamin K present in different types of commercially available food supplements has been developed. This electroanalytical method is based on the ex situ adsorptive accumulation of these biologically active compounds onto the surface of a solid glassy carbon electrode (GCE) with subsequent electrochemical detection by square-wave adsorptive stripping voltammetry in 0.01-mol L−1 HNO3 containing 0.1-mol L−1 KCl at pH 2.08. Due to reversible electrochemical reactions of phylloquinone, a subsequent voltammetric detection of both vitamins in anodic mode can be performed. Since individual forms of vitamins E and K usually exhibit nearly identical electrochemical behavior, it is therefore impossible to distinguish individual forms (quinones and tocopherols) and determine their molar concentrations in this way. Thus, the values of vitamin content were expressed as mass equivalent of phylloquinone and α-tocopherol as they are the most biologically active forms. Despite the high sensitivity, relatively short linear ranges were obtained due to the interaction (competition) of both vitamins during adsorption onto the freshly polished surface of the GCE from a 50% aqueous–acetonitrile mixture. The obtained results showed that the voltammetric approach is a very simple and low-cost analytical method that can be used in analyses of food supplements.

1. Introduction

Vitamin E and K belong to a group of fat-soluble vitamins [1,2,3,4], which are classified as non-polar organic compounds [5]. Vitamin E (VE), known as the most active lipophilic antioxidant, exists as four tocopherol and tocotrienol isomers [3,4,6,7] whose sources include vegetable oils, nuts and seeds of plants [8,9]. Vitamin K present in green plants (phylloquinone; VK1) and produced by bacteria (menaquinone; VK2) [10,11,12,13,14], is widely used in the diet for its anti-hemorrhagic properties [11,12].
VE is essential in the protection of fatty acid chains in the lipoprotein bilayer in the cytoplasmic membrane [3,4], because it preferentially reacts with peroxy radicals to form harmless oxidation products which are reduced back by the reduction properties of ascorbic acid (vitamin C) [15]. Due to VE’s significant physiological effects, avitaminosis may contribute to an increased risk of developing several serious diseases of civilization, such as fertility disorder [16], cardiovascular diseases (heart attack and stroke) [1], Alzheimer’s disease [17] and renal impairment [18].
VK is essential for the carboxylation reaction of glutamic acid, which is known to be a precursor of blood-clotting factors [19]. Its deficiency results in a deactivation of prothrombin, causing hemorrhage [20], prosthetic valve failure [21] and bone formation disorders [11].
From all of the above information, it is evident that analysis of the presence and levels of these vitamins is justified, especially for food quality control. For Czech legislation based on that from the European Union, the reference analytical method used for the determination of VE and VK in foodstuffs is high-performance liquid chromatography (HPLC) in either normal-phase or reversed-phase systems [22,23,24,25] with spectrophotometric detection, known as ČSN EN 12822 (560055) and ČSN EN 14148 (560053), respectively. Moreover, it is worth mentioning that a recently investigated electrochemical detection method for both vitamins could be potentially used [1,2], however, this electrochemical detection has not been implemented for the simultaneous determination of VE and VK.
Several scientific papers suggest that there is a real chance to simultaneously determine VE and VK in various foodstuffs using adsorptive stripping voltammetry (AdSV) [2]. Principally, all the lipophilic vitamins present in a sample can be accumulated onto the nonpolar surface of a freshly polished glassy carbon electrode (GCE) from an optimum aqueous–organic mixture, and after applying a negative deposition potential over a period of time (electrochemical reduction of phylloquinone to phyllohydroquinone; H2VK1), they can be anodically oxidized sequentially in one step according to their different standard redox potentials [4]. Compared to the standard HPLC method, its relatively high sensitivity and fast and easy sample preparation for analysis can be seen as a great advantage. However, AdSV is unable to recognize individual vitamin forms due to overlap of their peak current signals. Hence, a sum of individual forms is usually expressed as the concentration equivalent of the most biologically active form [1].
In this study, a simple and rapid AdSV procedure is presented with square-wave voltammetry (SWV) as an electroanalytical technique for the simultaneous determination of VE and VK in commercial food supplements. The developed analytical method is based on an adsorptive accumulation of these biologically active compounds onto the surface of a GCE with subsequent electrochemical detection using SWV in 0.01-mol L−1 HNO3 containing 0.1-mol L−1 KCl (pH 2.08). Special attention is paid to the optimization of all working conditions, such as the content of MeCN in the accumulation medium, the effect of ionic strength (presence of salt), the accumulation time during adsorption, speed of stirring (effect of mass transport), the interaction of analytes (simultaneous calibration) and the working parameters of electrochemical detection mediated by SWV. Finally, the presented square-wave adsorptive stripping voltammetry (SWAdSV) method is assessed in terms of analytical parameters, namely the calibration range, limit of detection, precision (repeatability), accuracy (recovery) and feasibility of using the standard addition method in a real analysis.

2. Materials and Methods

2.1. Reagents and Chemicals

Analytical standards of (+)-α-tocopherol (α-TOH), γ-tocopherol (γ-TOH), δ-tocopherol (δ-TOH), phylloquinone (VK1), menaquinone (VK2) and menadione (VK3) together with pure acetonitrile (MeCN) were purchased from Sigma-Aldrich (St. Louis, MO, USA). All other chemicals were of analytical grade purity from Lach-Ner, Ltd. (Neratovice, Czech Republic): hexane for the cleaning surface of the GCE, 65% nitric acid, 35% hydrochloric acid, 96% sulfuric acid, 68% perchloric acid, glacial acetic acid and potassium chloride for the preparation of the aqueous detection medium. Ultrapure water (ρ = 18.3 MΩ cm) obtained with a Milli-Q® water purification system from Merck (Darmstadt, Germany) was used for the preparation of all solutions.

2.2. Pretreatment of Glassy Carbon Electrode

Before each measurement, a solid GCE (type 6.1204.300) with a surface diameter of 3 mm from Metrohm (Herrisau, Switzerland) had to be polished using a water dispersion of Al2O3 powder (particle size of 0.3 µm) for 30 s. After this treatment, the electrode was dried with wood pulp paper, then immersed in 95% hexane and ultrasonicated for 5 min. All these cleaning steps were necessary since it was known that the targeted analytes (or their electrode reactions products) remain on the GCE surface due to their high abilities to be adsorbed [1,2]. Before each voltammetric analysis, a baseline measurement was done to checked whether the surface of the GCE was appropriately renewed.

2.3. Apparatus

All voltammetric measurements were performed in a conventional electrochemical glass cell with a three-electrode system consisting of a GCE (working), a silver chloride electrode with 3.0-mol L−1 KCl (reference) and a platinum wire (counter electrode) all from Metrohm (Prague, Czech Republic). These electrodes were connected to a potentiostat/galvanostat (type Autolab/PGSTAT101) from Metrohm (Prague, Czech Republic) operated with NOVA 1.11 software.

2.4. Sample Preparation for Voltammetric Analysis

Two different food supplements commercially available in Czech pharmacies, namely VITAMIN K2 MK 7 + D3 FORTE (Sample 1) and VITAMARIN 90 cps (sea fish oil from Engraulis japonicus) (Sample 2), were analyzed to verify the developed analytical method. The simultaneous voltammetric determination of vitamin E and K enables the analysis of two different food supplements (containing only one investigated lipophilic vitamin), which can minimize chemical consumption and significantly reduce analysis time. Therefore, one tablet of Sample 1 containing 100 µg VK and one capsule of Sample 2 containing 2.5 mg vitamin E were dissolved with 50% MeCN in 100-mL voltammetric flasks using ultrasonication for 20 min. For voltammetric analysis, 6-mL of Sample 1 solution, 1 mL of Sample 2 solution, and 4 mL of 50% MeCN were mixed in an accumulation glass cell.

2.5. Methods

2.5.1. Square-Wave Adsorptive Stripping Voltammetry

Generally, ex situ adsorptive stripping voltammetry (AdSV)—utilizing the adsorption of lipophilic analytes onto a nonpolar electrode surface (a freshly polished GCE)—is divided into two steps, which guarantees higher selectivity than with AdSV in situ mode [26,27]. In this study, the adsorption of analytes started when the GCE was immersed into a continuously stirred (400 rpm) 10 mL of 50% MeCN for 300 s. Electrochemical detection using SWV as the electroanalytical technique was performed in 10 mL of 0.01-mol L−1 HNO3 containing 0.1-mol L−1 KCl (pH 2.08) with the following working parameters: deposition potential (Edep) −0.1 V, deposition time (tdep) of 60 s, equilibrium time (teq) 5 s, potential range from −0.1 to +0.8 V, potential step (Estep) 5 mV, potential amplitude (Eampl) 30 mV and frequency (f) 80 Hz. The method of standard addition was used for evaluating VK1 and VE content, where three additions of 2 μL of 0.01-mol L−1 stock solutions of VK1 and VE were subsequently added to the mixed solution of food supplements. Each analysis was repeated at least eight times (n = 8). Unless stated otherwise, all changes in the experimental conditions are described in the legends of the corresponding figures.

2.5.2. High-Performance Liquid Chromatography

A liquid chromatograph, consisting of a degasser of mobile phase DG 3014 from Ecom (Prague, Czech Republic), pump Spectra System P2000, autosampler Spectra Series AS100 and detector Spectra System UV3000, all from Thermo Separation Products (Waltham, MA, USA), was coupled with a commercial Kinetex™ PFP 100 Å column (150 × 3 mm, the particle size of 2.6 µm) from Chromservis Ltd. (Prague, Czech Republic). The detection wavelength was set to 246 nm. A mixture of water/methanol (10/90 v/v) was used as the mobile phase at a flow rate of 0.3 mL min−1 with isocratic elution at a temperature of 40 °C. For a sample volume of 10 µL, the direct comparison approach was used for the determination of lipophilic vitamins in the food supplements.
The gelatin capsule of fish oil was pierced with a needle, and the total content was transferred using a syringe into 10 mL of pure methanol. Five pills of a food supplement containing VK2 was dissolved in 10 mL hexane. After filtration through a folded filter paper, the hexane was evaporated with nitrogen at 40 °C. The resulting residue was dissolved in 1 mL methanol. The resulting sample solutions were spiked with 10 mg L−1 standards of α-TOH and VK1 to verify the recovery of the sample preparation.

2.6. Statistical Evaluation

The final results evaluated from eight repetitions are presented as confidence intervals x ± st1−α, where x is the arithmetic mean, s the standard deviation and t1-α the critical value of Student’s t-distribution (2.365) for a given number of determinations (two-sided distribution) at a significance level α of 0.05 (95% probability). The feasibility of using the standard addition method was determined by testing the significance of intercepts of the corresponding calibration curves using the statistical software QC Expert version 2.5 from TriloByte Statistical Software (Pardubice, Czech Republic).

3. Results and Discussion

The results are described within four main sections: the optimization of adsorption, optimization of subsequent voltammetric detection, analytical performance of the developed voltammetric method and analysis of food supplements. In comparison with direct voltammetric approaches, the presented SWAdSV method requires much more optimization. Nevertheless, the results showed that this voltammetric method is significantly more selective and sensitive, which is consistent with the literature [28].

3.1. Optimization of Adsorption

An adsorptive accumulation of lipophilic vitamins onto the freshly renewed surface of GCE (nonpolar substrate) was already used as a non-electroplating step (a non-electrolytic preconcentration) in the development of electroanalytical stripping methods [2,26], unfortunately not for their simultaneous voltammetric determination. The efficiency of adsorptive accumulation (the sensitivity of the final voltammetric method) usually depends on several factors that must be optimized. Among these factors are the selection of the water–organic solvent mixture, the presence of salts, stirring speed of the magnetic stirrer bar and accumulation time.

3.1.1. Effect of Organic Solvent Content

Since VE and VK1 are fat-soluble compounds, they are soluble in low-polar organic solvents and relevant aqueous mixtures. Generally, polar aprotic organic solvents with a simple linear structure, good solvation properties and sufficiently high boiling point while maintaining the same physical conditions during adsorption are preferred. Moreover, it is well known that the presence of water in MeCN enables the formation of hydrogen bonds [29] that provide interactions to increase the adsorption of vitamins onto the electrode surface. The effect of MeCN content on the peak current responses of lipophilic vitamins was investigated from 30% to 80% (v/v) at a stirring rate of 300 rpm for 300 s. No significant increase in both vitamins peak current responses was observed for a MeCN content higher than 50% (v/v), and therefore 50% aqueous–acetonitrile mixture was accepted as the optimum.

3.1.2. Effect of Ionic Strength

Another parameter tested in this research was the effect of ionic strength on peak current response. The presence of 0, 0.0001-, 0.001-, 0.01- and 0.1-mol L−1 KCl in 50% MeCN was investigated. No statistically significant increase in peak heights was found. Based on the obtained results, we did not use an excess of salt in further experiments.

3.1.3. Speed of Stirring

The stirring speed of the magnetic bar affects the rate of lipophilic vitamin transport to the electrode surface where these analytes are adsorbed. Here, it was observed that setting the rate of the magnetic stirrer higher than 400 rpm did not cause any significant increase in peak current responses. Therefore, the above-mentioned value was considered to be the optimum for subsequent measurements.

3.1.4. Accumulation Time

Fundamentally, adsorption of the nonpolar analyte onto a nonpolar solid substrate (working electrode) is an equilibrium process. Curves characterizing the dependencies of accumulation time on peak current responses have the typical shape of adsorption isotherms [30] that express the variation in the amount of analyte adsorbed by the adsorbent within the time period at a constant temperature. As is shown in Figure 1, peak heights increased with increasing accumulation (adsorption) time up to 300 s. For longer accumulation periods, no significant increase in peaks intensity (saturation) was found based on the comparison of standard deviation values (error bars). For this reason, the value of 300 s was chosen as the optimum to achieve the equilibrium.

3.2. Optimization of Subsequent Voltammetric Detection

From a chemical point of view, H2VK1 and α-TOH are phenolic compounds, and thus they can be considered to be weak organic acids [31,32]. Therefore, it can be assumed that the pH of the working (detection) medium has a fundamental influence on the position and height of the oxidation peaks. The electrochemical reduction of adsorbed VK1 to H2VK1 had to be optimized to achieve the maximum current yield of the electrode reaction.
SWV is a commonly used pulse voltammetry technique that exhibits a greater capacity to discriminate the influence of capacitive current. Essentially, the size of the potential amplitude affects this discrimination, and the frequency determines the scan rate (ν). Therefore, it was clear that these two working parameters can significantly influence the final sensitivity of the developed voltammetric method.

3.2.1. Effect of Detection Media

In the literature, the highest peak currents were recorded at carbon-based electrodes in aqueous solutions of strong inorganic acids [1,2,33,34]. Here, 0.005-mol L−1 dibasic (H2SO4) and 0.01-mol L−1 monobasic (HCl, HNO3 and HClO4) strong mineral acids, always containing 0.1-mol L−1 KCl to increase the electric conductivity, were tested as a potential detection medium. Slightly higher current responses of VK1 and α-TOH were obtained for 0.01-mol L−1 HNO3 in the presence of 0.1-mol L−1 KCl. As a result, this aqueous solution of HNO3 was chosen as optimal.

3.2.2. Effect of Square-Wave Voltammetry Working Parameters

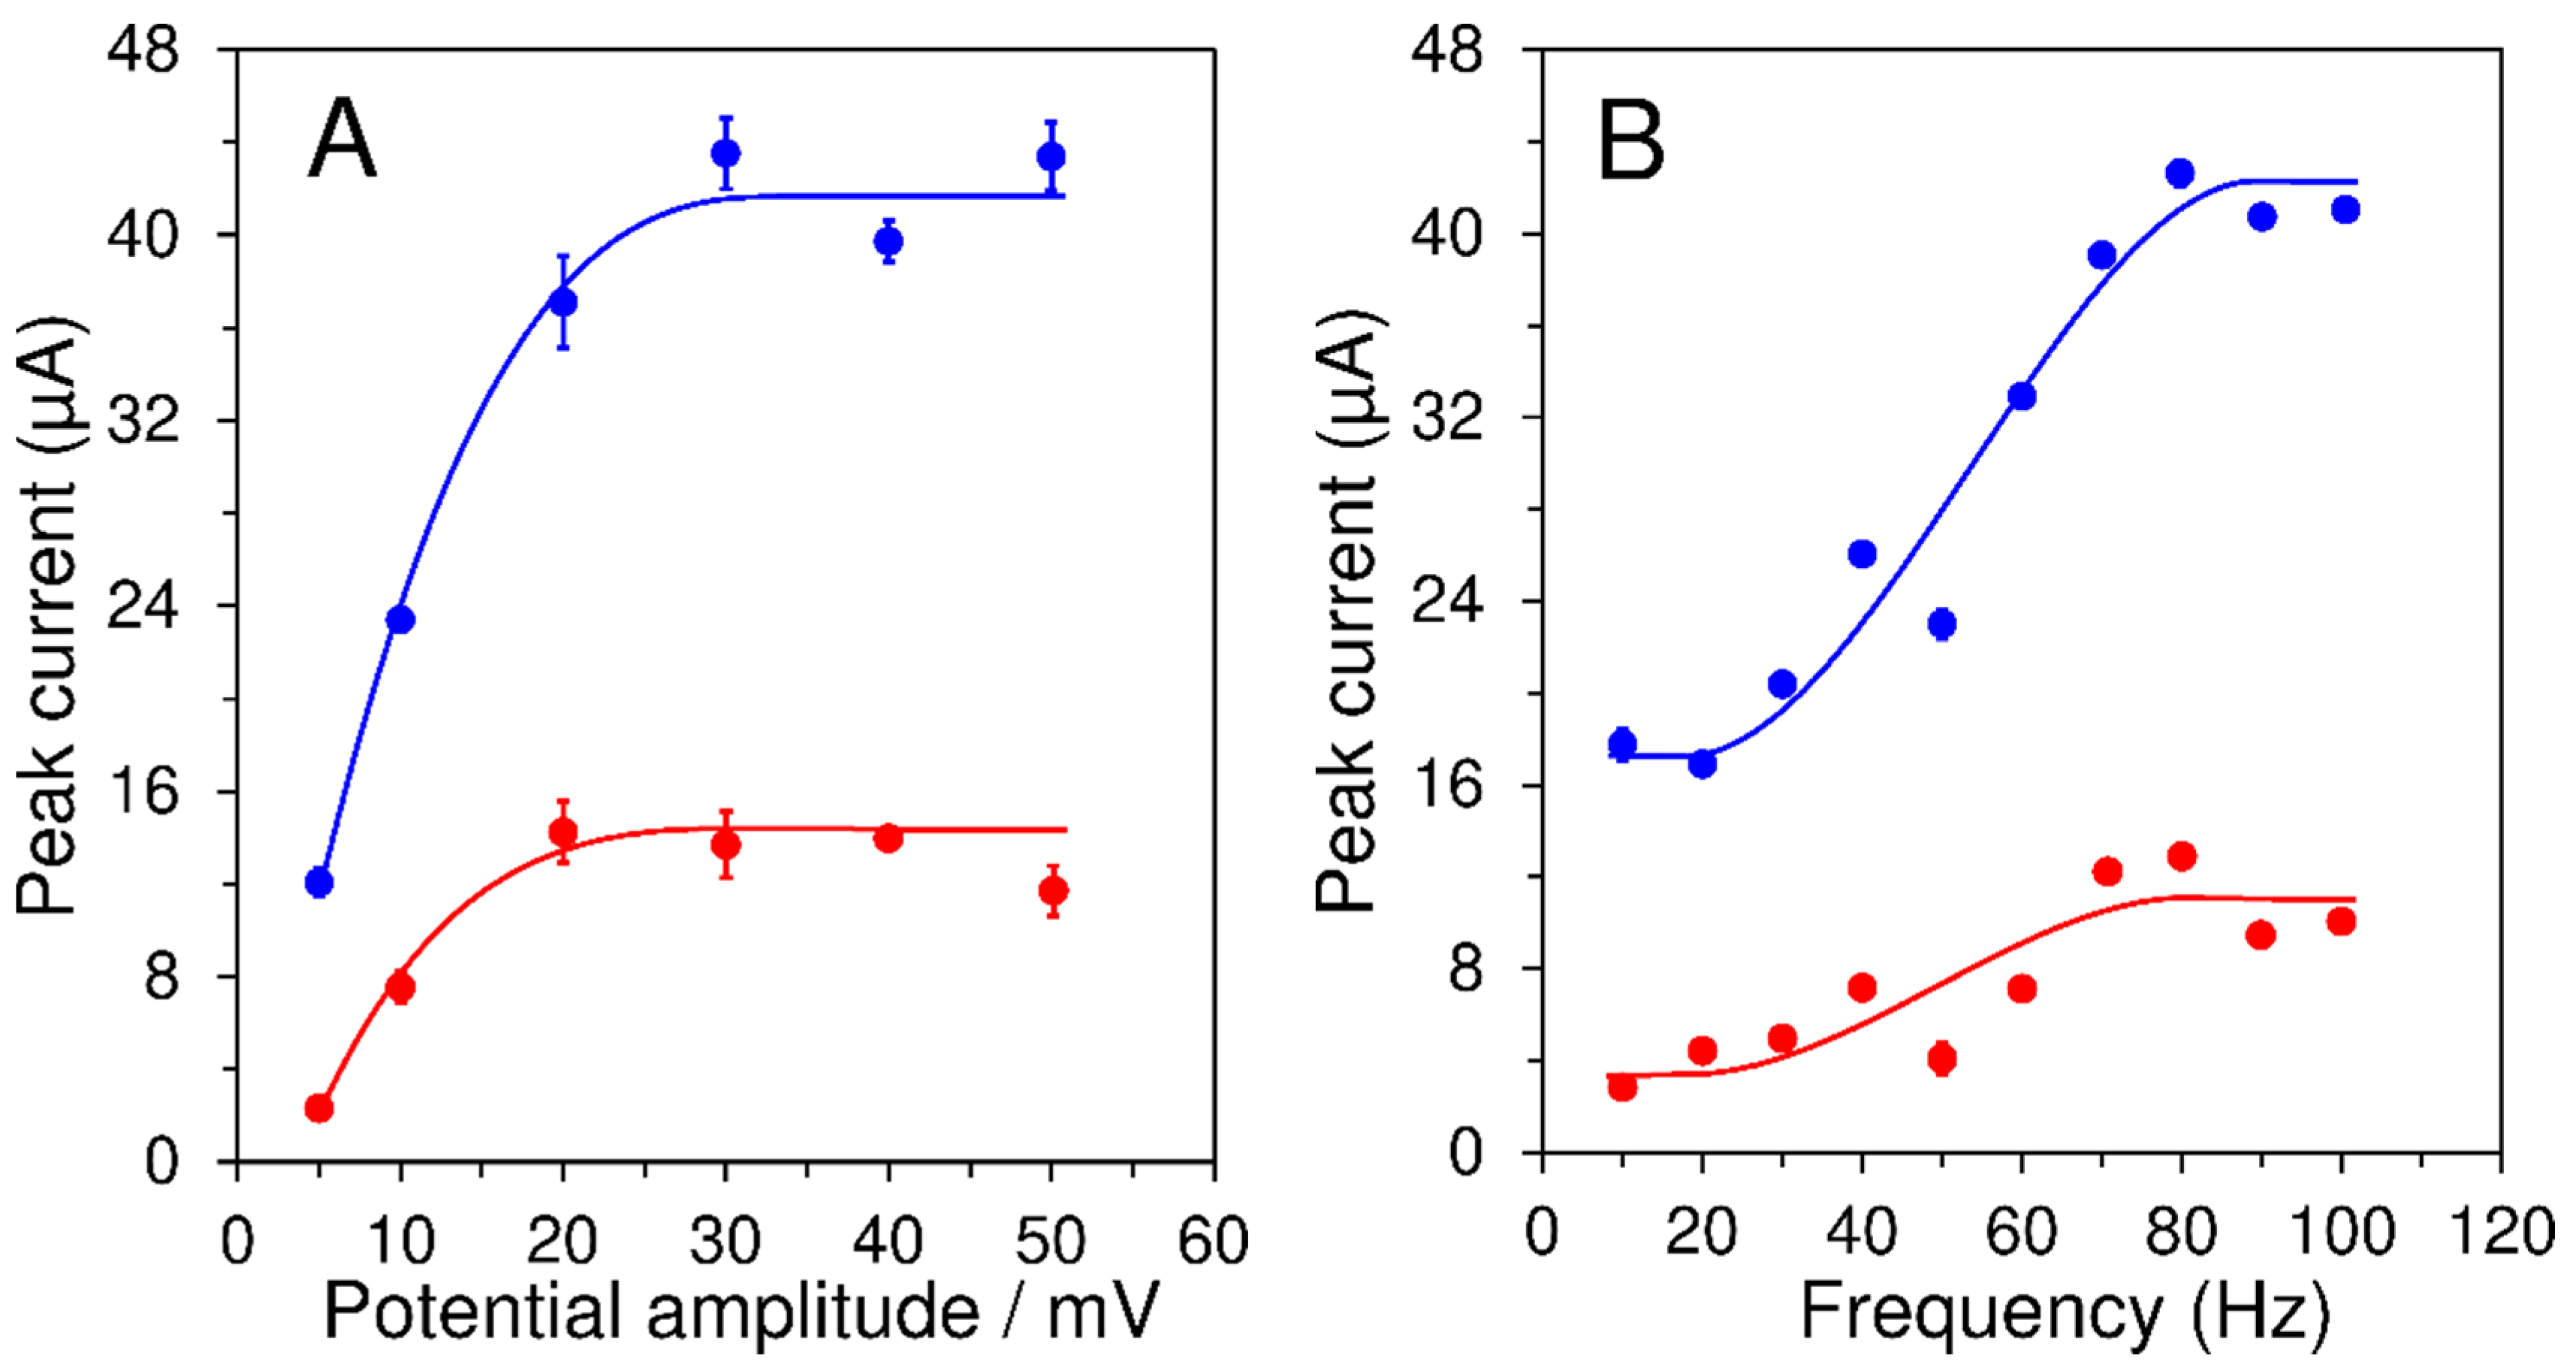
From previously reported papers, it is known that applying a potential of −0.1 V for 60 s is sufficient to reduce VK1 to H2VK1 [2,33]. Hence, it was necessary to determine the optimal working parameters of SWV. At the constant potential step of 5 mV, an effect of other two working parameters for α-TOH and VK1 peak current responses was investigated: potential amplitude from 5 to 50 mV and frequency from 5 to 100 Hz (Figure 2).

3.2.3. Memory Effect

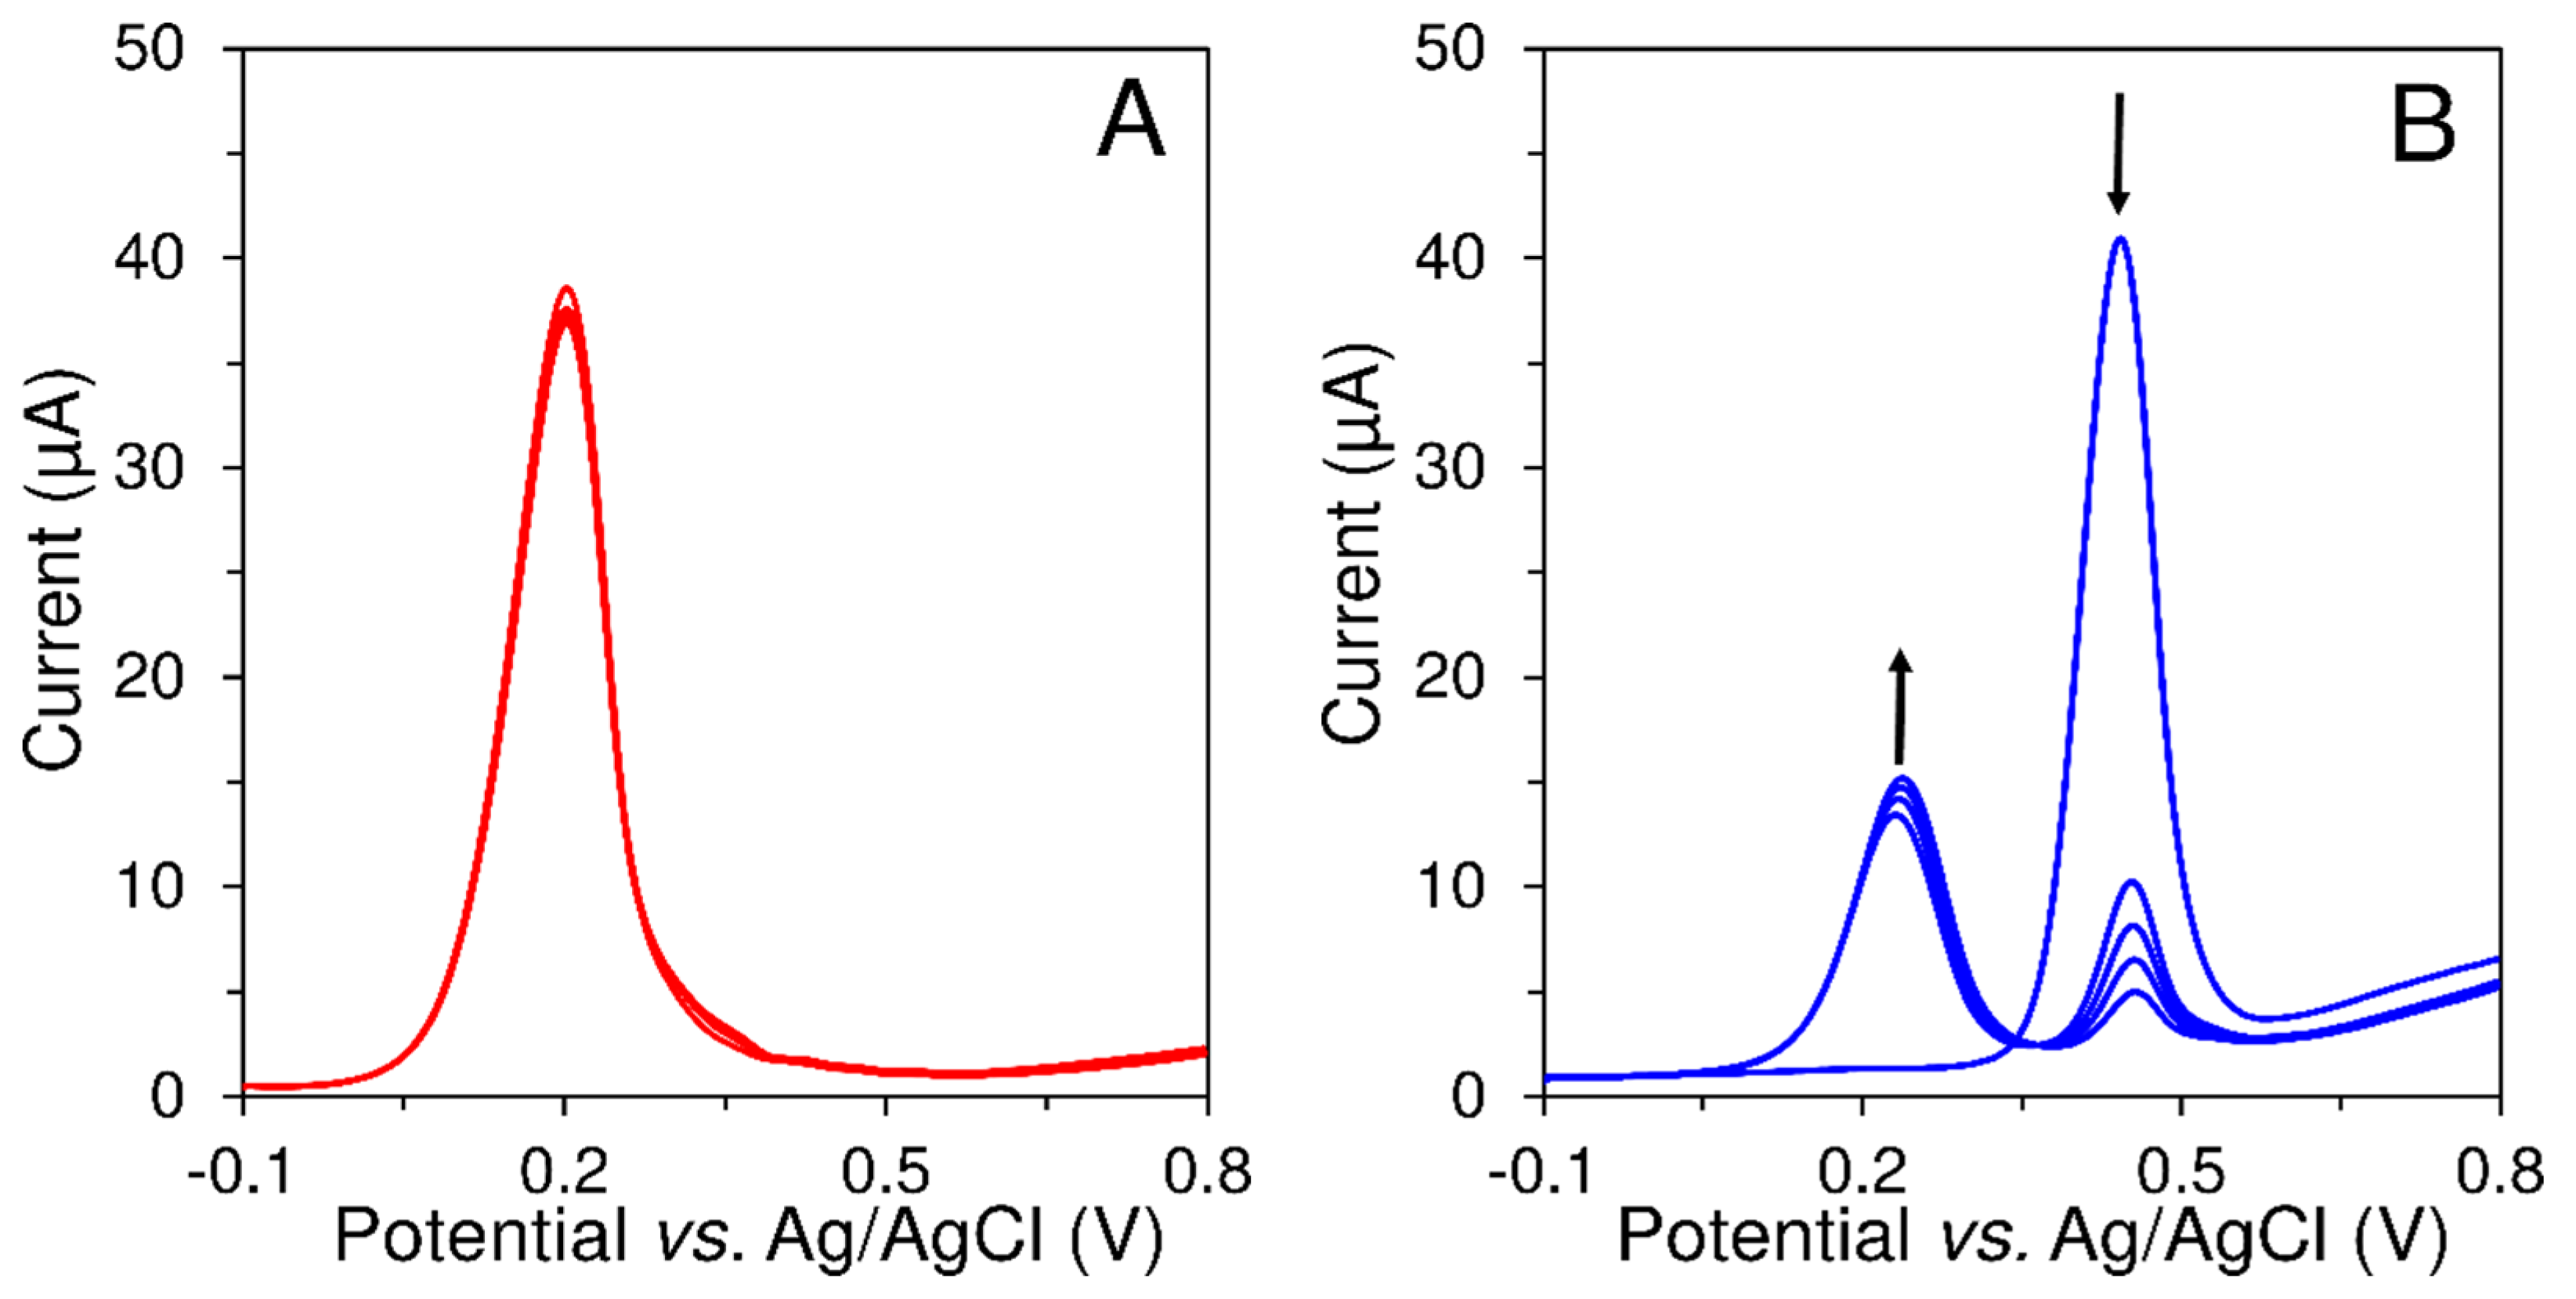
Generally, one of the main criteria affecting the precision of analytical methods is the repeatability of measurements. To be more specific, the previous measurement should not affect the next one. This negative phenomenon is usually referred to as the memory effect. In this study, each vitamin was accumulated separately and their voltammetric detection was repeated five times (Figure 3). Due to the reversible electrochemical behavior of VK1 with the precipitation of two electrons and protons (hydroquinone/benzoquinone redox couple), no change was observed in the oxidation peak of H2VK1 at +0.202 V (see Figure 3A). In contrast, α-TOH is anodically oxidized at +0.444 V to form a dienone cation [31,35] which nucleophilically reacts with water to form α-tocohydroquinone (α-TQ). This α-TQ is subsequently electrochemically reduced by applying a negative deposition potential (−0.1 V) for 60 s to form α-tocohydroquinone (α-TQH2). In the subsequent measurements, the α-TQH2 is anodically oxidized at +0.247 V with the precipitation of two electrons and protons (α-TQ/α-TQH2 redox couple), as shown in Figure 3B.
It was evident that an imperfectly renewed GCE surface significantly affects the analysis of real samples, especially the overlapping of anodic peaks of H2VK1 and α-TQH2. For this reason, a blank measurement with a freshly polished GCE was included before each analysis.

3.3. Analytical Performance of the Developed Voltammetric Method

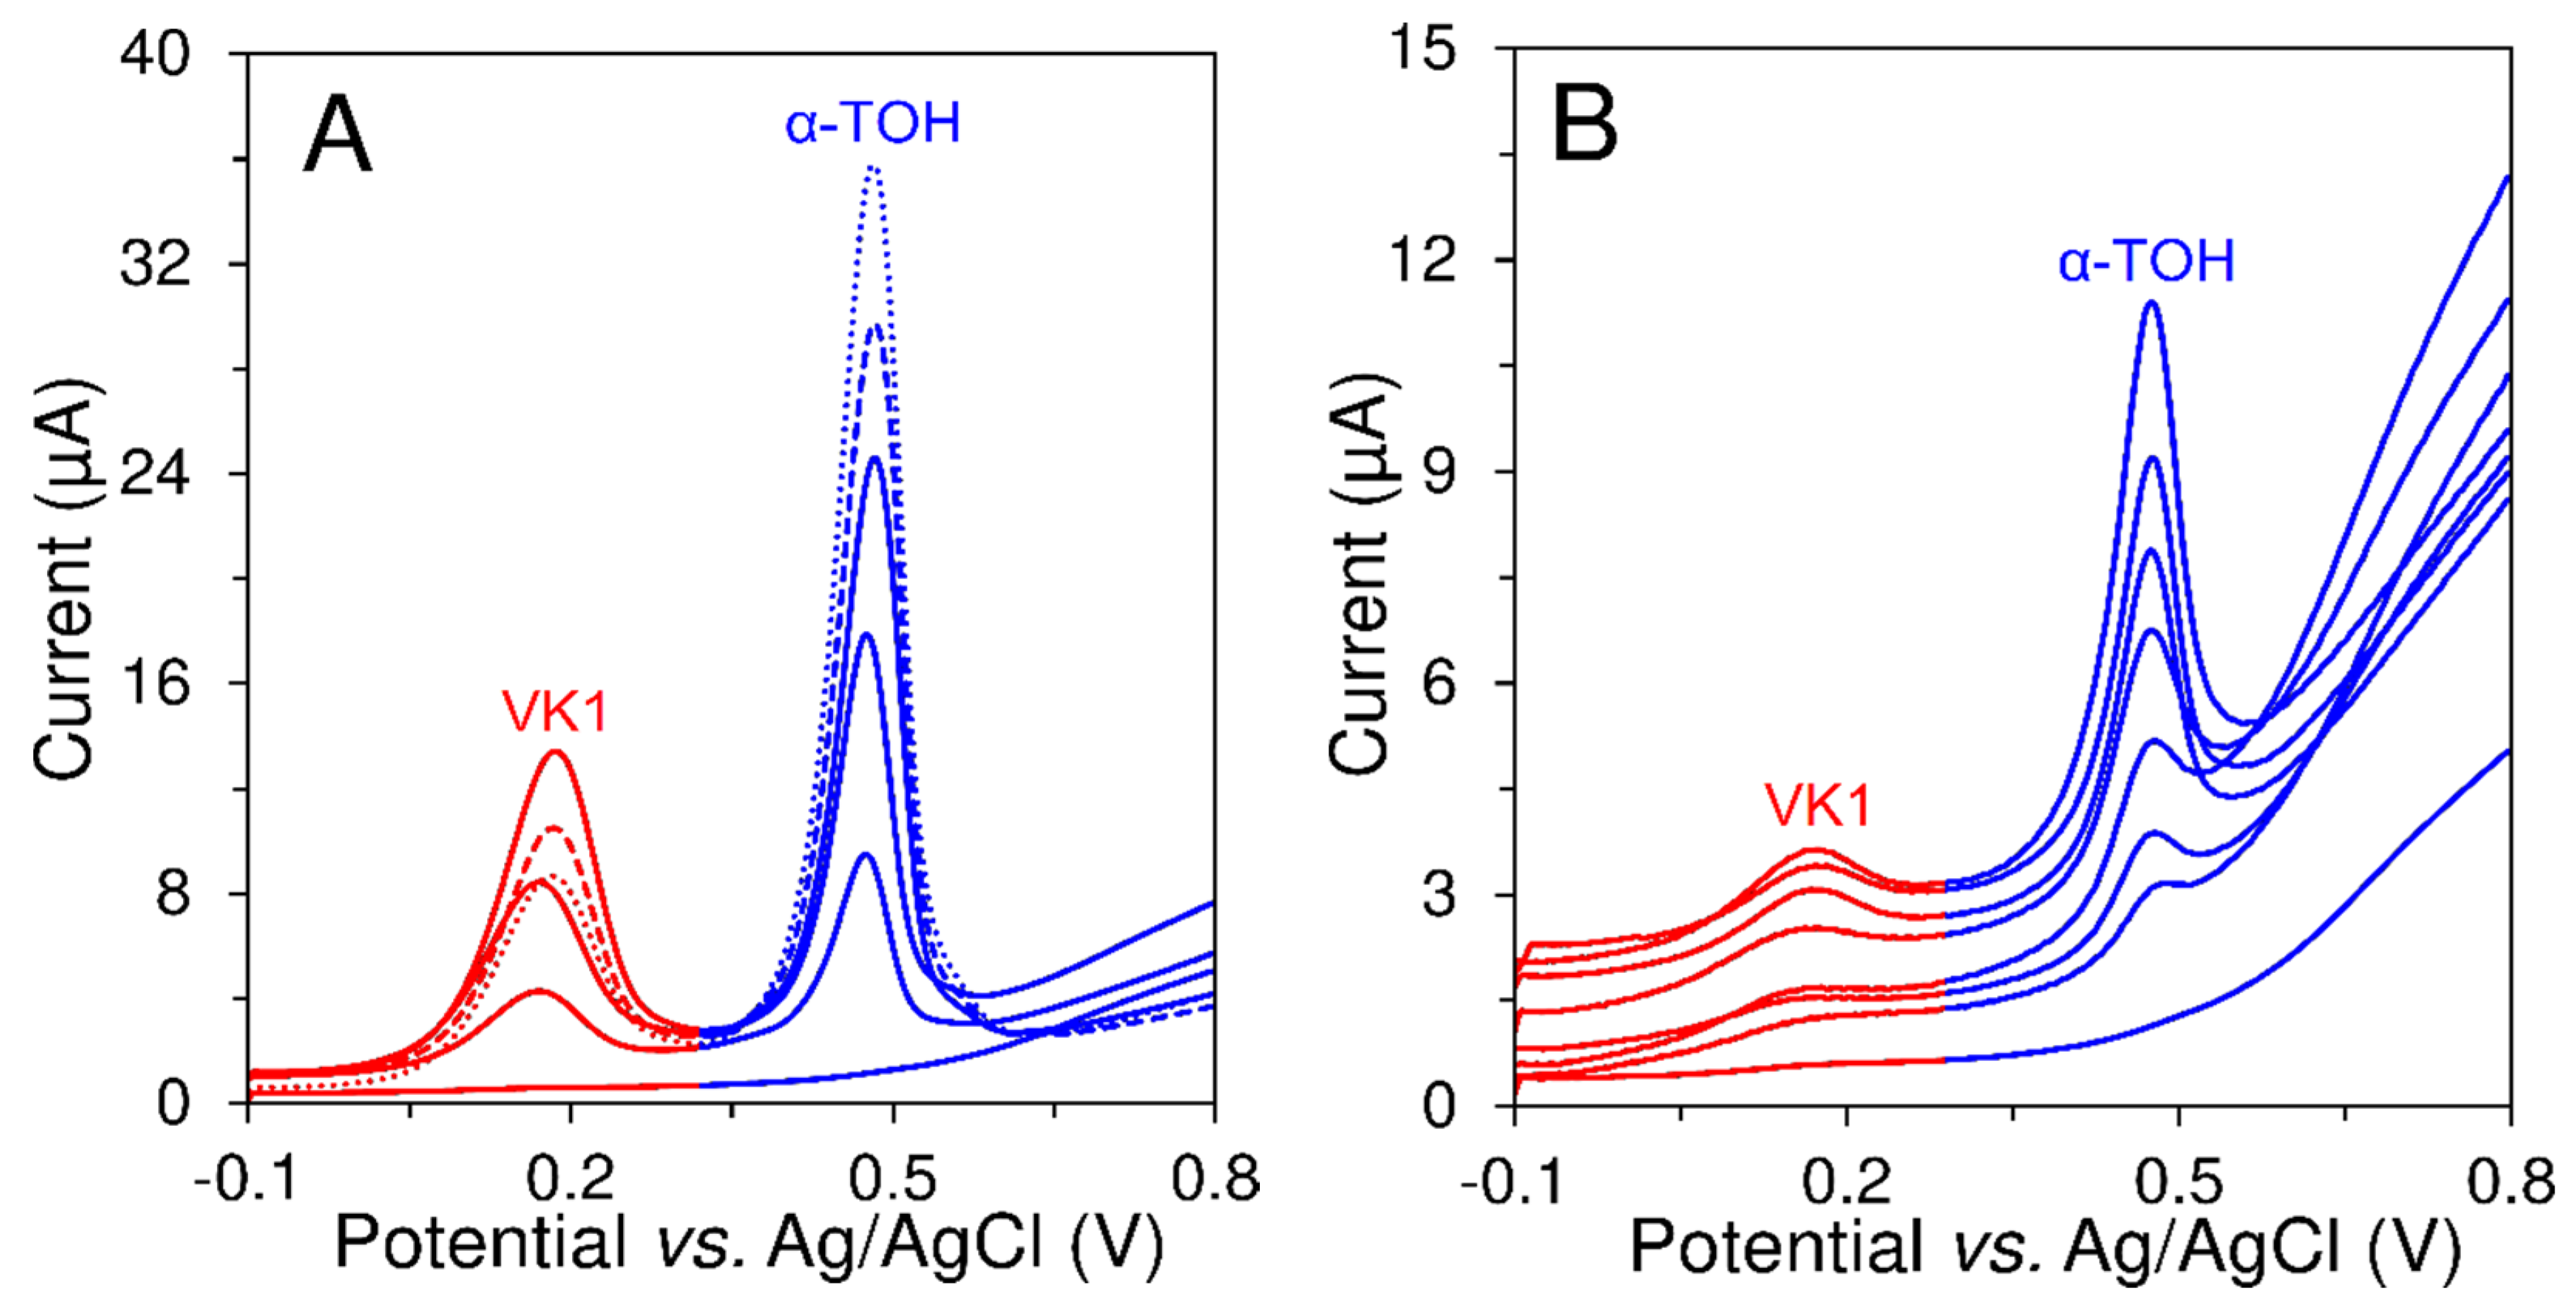
From previous paragraph, it seems that VK1 and α-TOH gave nearly the same peak current response (Ip) for equal concentration level (c). This fact applies only if they are determined separately using SWAdSV. The separate measurements on SWAdSV of VK1 and VE showed different behavior from the simultaneous ones, based on peak current responses (Ip), as it is shown in Figure 4. The α-TOH gave significantly higher peak current response than VK1. An explanation could be found in preferable adsorption of α-TOH onto the surface of the GCE from 50% MeCN. It was found that this phenomenon negatively affected the final linear ranges. The peak height of the VK1 decreased above a concentration of 8 µmol L−1 VK1, while the oxidation peak of α-TOH still increased linearly with increasing content up to 10-µmol L−1 α-TOH (Figure 4A, dashed and dotted lines).
The linear ranges for VK1 and α-TOH determination were relatively short, 77–1000 nmol L−1 for VK1 and 29–1000 nmol L−1 for α-TOH, with detection limits (LOD) of 25 and 10 nmol L−1, respectively. Values of LODs were calculated as three times the standard deviation (s) of ten replicate measurements (200-nmol L−1 VK1 and 50-nmol L−1 α-TOH) divided by the slopes of corresponding regressions (k). Limits of quantification (LOQ), presented as the first values of corresponding linear ranges, were calculated as 10 s/k. The above-mentioned linear ranges are described by equations of calibration curves as follows: Ip (μA) = 0.611 c (μmol L−1) − 0.080 with coefficient of determination (R2) 0.9920 for VK1 and Ip (μA) = 6.333 c (μmol L−1) − 0.012 with R2 = 0.9993 for α-TOH. Statistically insignificant (negligible) values of intercepts (q) allow the use of the standard addition method for the simultaneous voltammetric determination of VK1 and α-TOH in selected food supplements. Moreover, additional linear ranges for higher concentrations were found: 1.0–7.0-µmol L−1 VK1 and 1.0–10-µmol L−1 α-TOH described by regression equations Ip (μA) = 1.964 c (μmol L−1) − 1.046 with R2 = 0.9997 and Ip (μA) = 3.416 c (μmol L−1) + 1.4105 with R2 = 0.9973, respectively.
Comparable analytical parameters were obtained with previously reported adsorptive stripping voltammetric methods (Table 1). The precision of the developed SWAdSV, referring to the mutual agreement between repeated measurements, was calculated for eight replicate measurements of equal vitamin content (50-µmol L−1) and relative standard deviations (RSD) of 4.7% and 6.6% for VK1 and α-TOH were achieved, respectively.

3.4. Analysis of Food Supplements

Common food supplements available in Czech stores usually do not contain lipophilic vitamins in their natural biologic form, but instead their synthetic analogs (menadione; VK3 and α-tocopheryl acetate), due to their higher chemical stability. Nowadays, food supplements based on vegetables or fish oils [38] encapsulated in gelatin capsules are rapidly growing in popularity. These good supplements usually contain a mixture of natural lipophilic vitamins. Here, a mixture of two of these types of food supplements was analyzed using the developed SWAdSV.
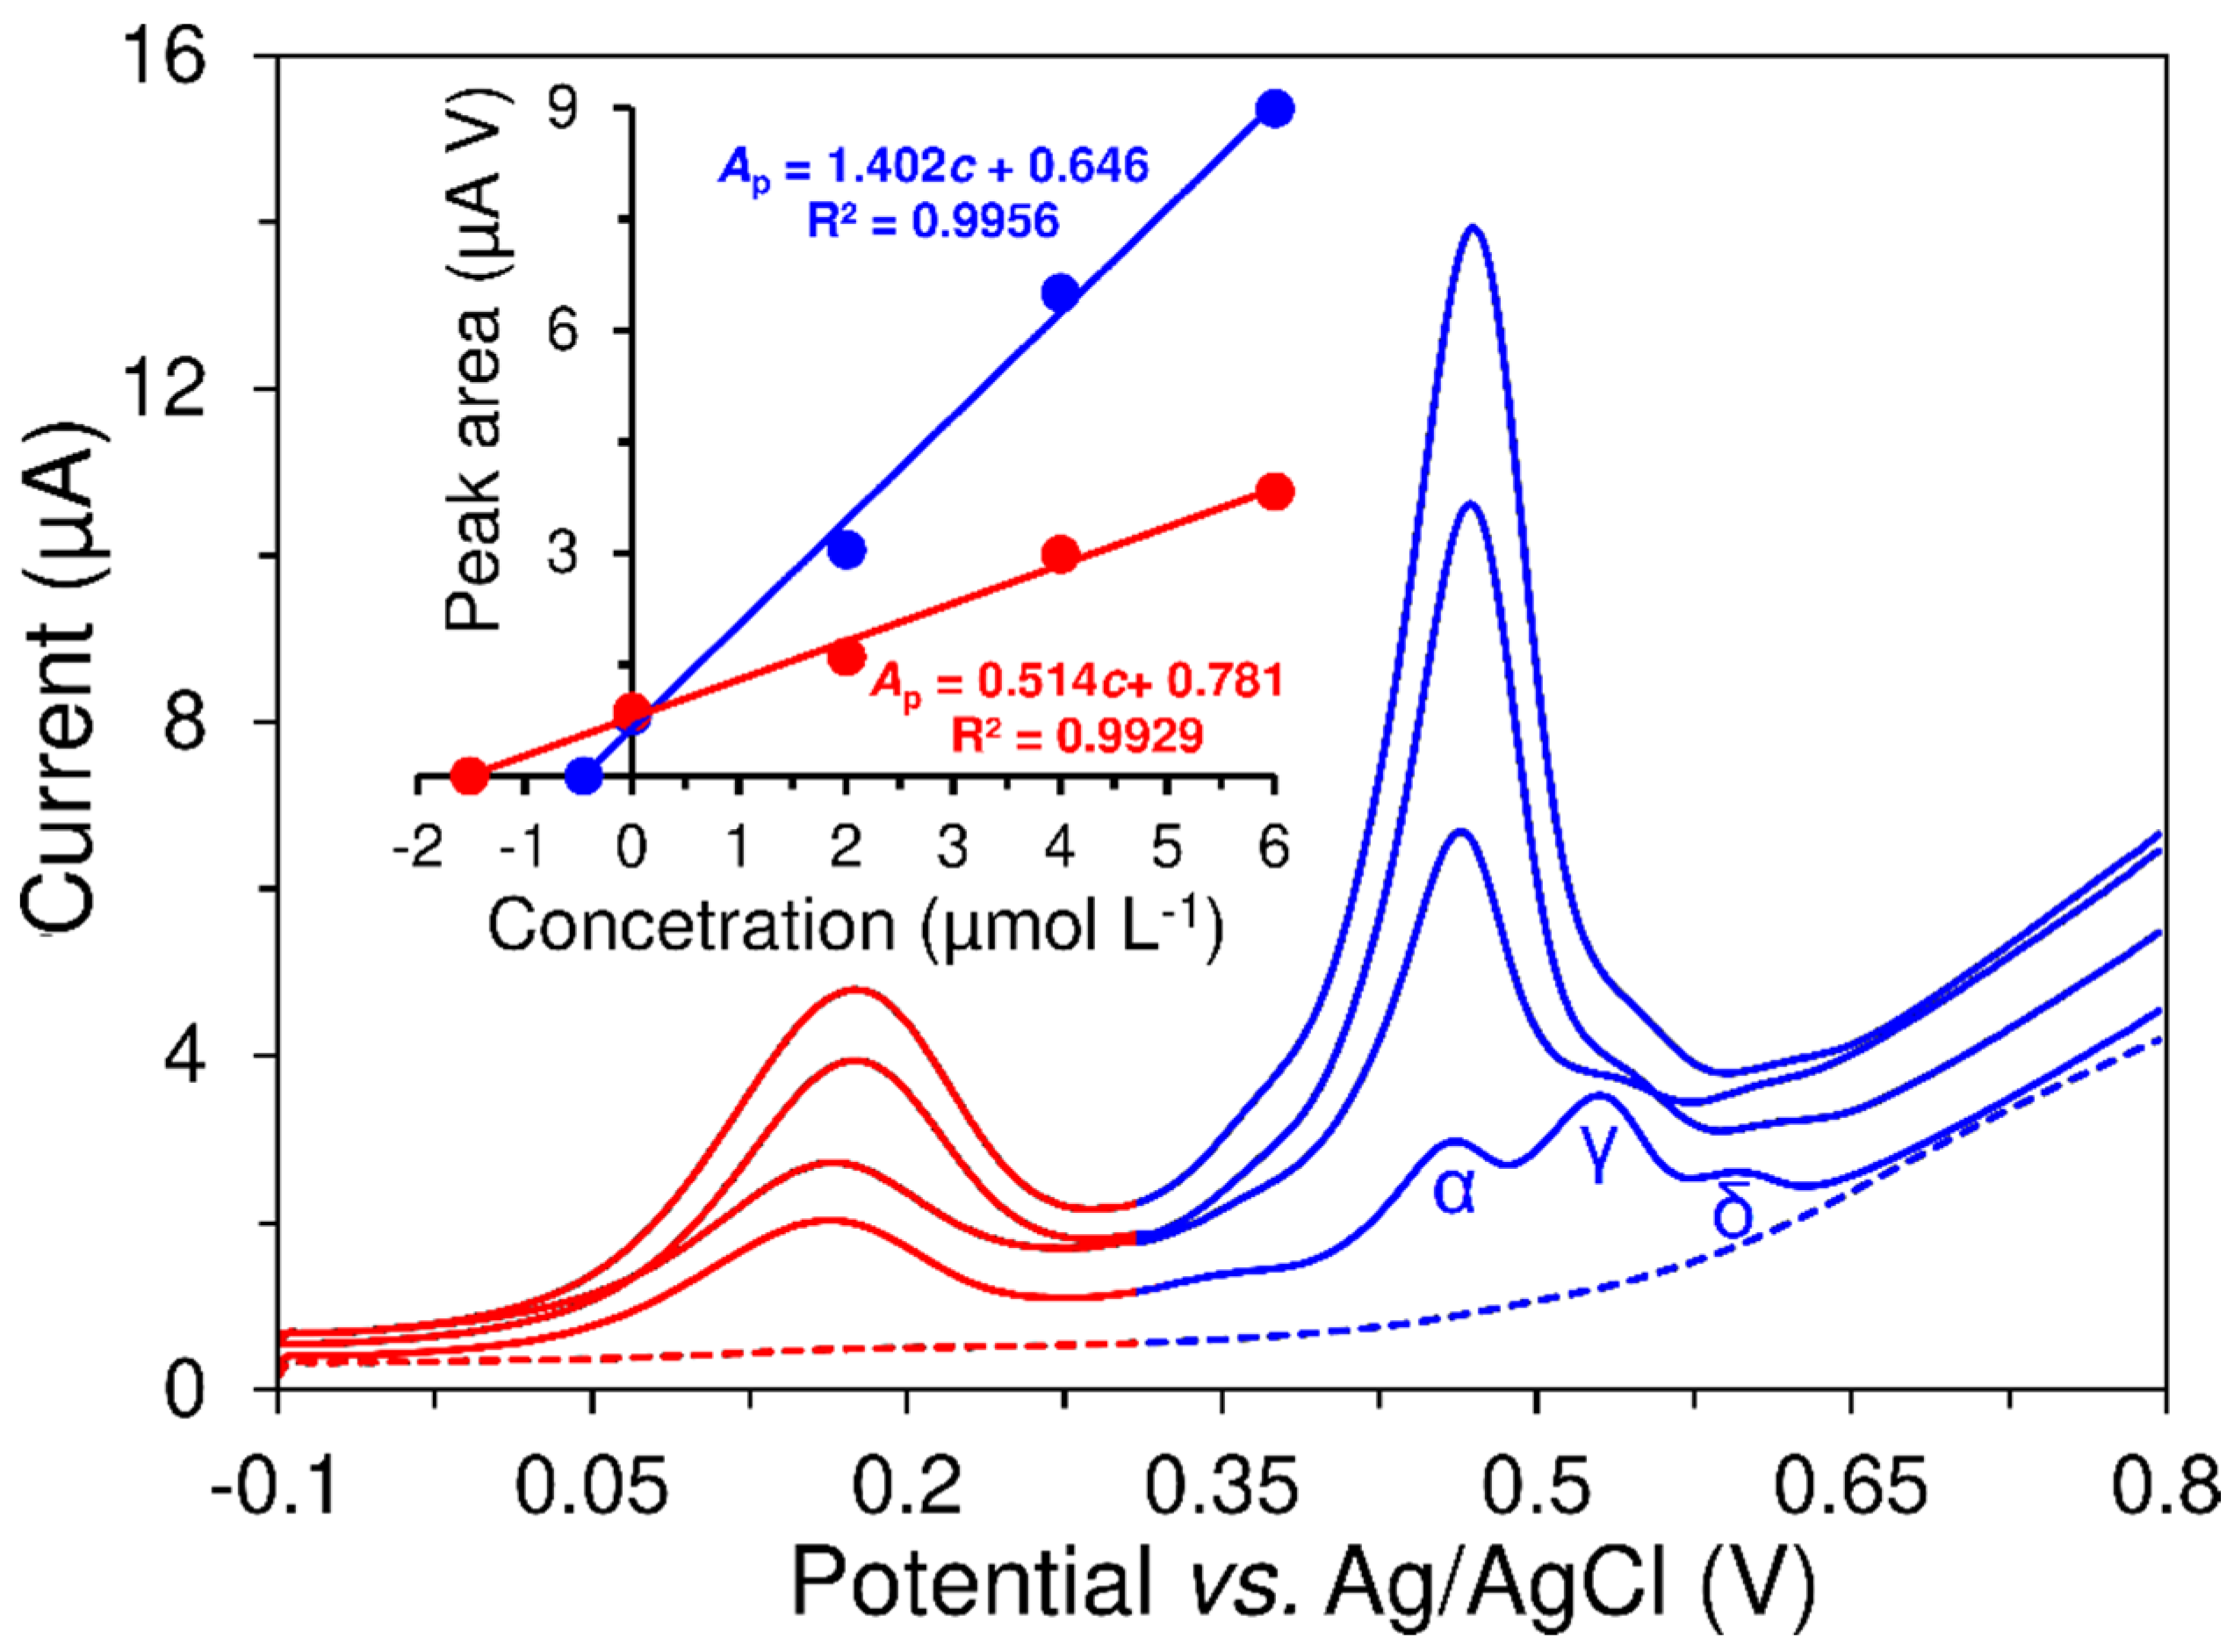
From Figure 5 it is evident that all the commonly occurring forms of VE are present in the capsule of VE because three overlapping peaks attributed to the anodic oxidation of α-TOH, γ-TOH and δ-TOH at +0.464 V, +0.539 V and +0.604 V were observed, respectively. Based on the position of the oxidation peaks reflecting the number of methyl groups (+I effect) in the chromanol ring, the order of the individual forms of vitamin E was determined [38,39]. Due to this unsymmetrical overleaping peak, an evaluation of peak height was not used and peak area (Ap) was used instead (Figure 5, inserted graph).
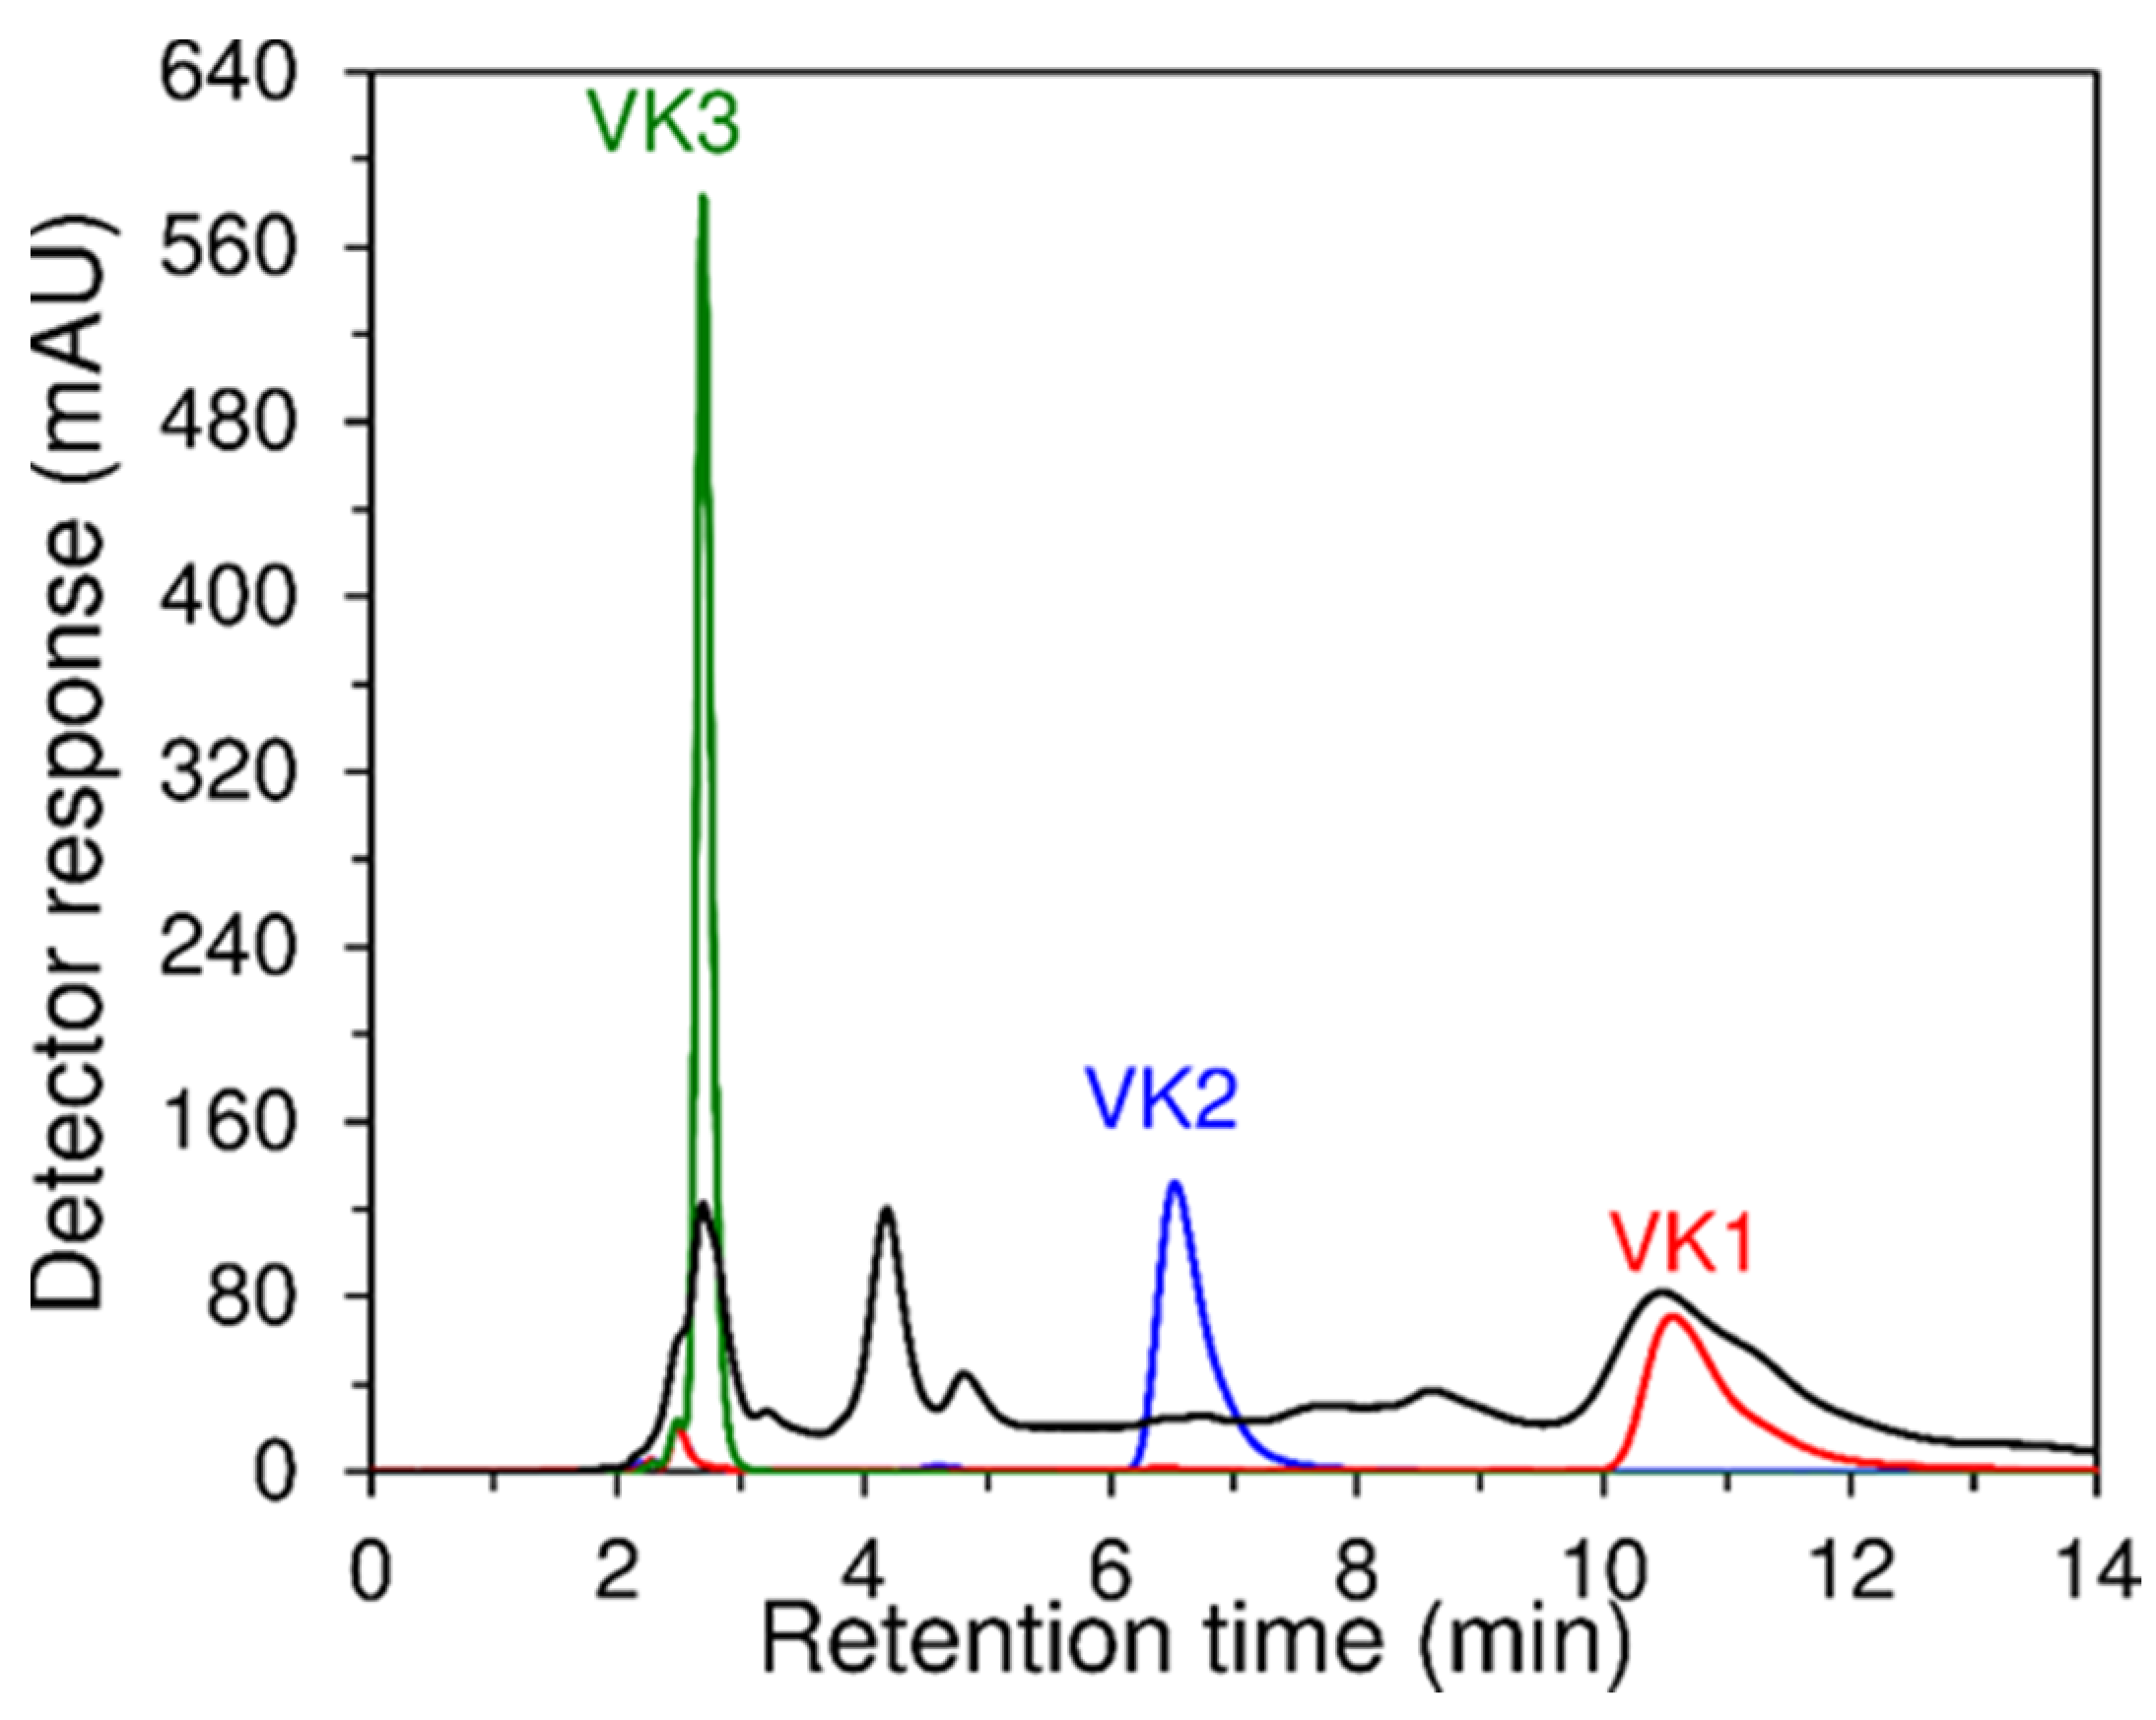
As was mentioned above, the recognition of individual forms of VE in the real sample was also possible using SWAdSV. Unfortunately, this did not apply for VK, because the HPLC analysis showed (Figure 6) that the food supplement (Sample 1) did not only contain only VK2 (retention time of 6.53 min), as the manufacturer claimed, but also VK1 (10.73 min) and menadione (VK3; 2.60). Thus, it can be concluded that SWAdSV is not a suitable electroanalytical tool for determining individual forms, but only their sums. By spiking sample solutions with a known concentration of individual forms of vitamins, the rate of recovery for HPLC was found to be in the range of 91–105%.
Table 2 summarizes the results obtained by both SWAdSV and HPLC methods of analysis of food supplements. For food supplements based on natural oils, the hydrolysis of fats was necessary and a simple dissolution in an organic solvent alone was insufficient to achieve precise (declared) results. Nevertheless, the developed SWAdSV could find a direct utilization (without complicated sample preparation) in the analysis of many other food supplements, especially in the form of tablets. Due to its high sensitivity, SWAdSV could represent a suitable analytical tool for the determination of lipophilic vitamins, e.g., in human plasma. Future research should be directed towards the possibility of the direct absorption of lipophilic vitamins bound with carrier lipoproteins [26] or also include a hydrolysis step with specific lipoprotein lipases [40].

4. Conclusions

In this study, it was demonstrated that the simultaneous determination of vitamin E and K in food supplements is possible using the developed square-wave adsorptive stripping voltammetry on the glassy carbon electrode. Due to the similar electrochemical properties of individual forms, the voltammetric method presented here is suitable for determining their sums, expressed as the concentration equivalents of the most biologically active forms (α-tocopherol and phylloquinone). However, relatively short linear calibration ranges were achieved because of the limited size of the working electrode surface. Thanks to the ex situ type of accumulation, the main advantage of this voltammetric method can be seen in the easy sample preparation consisting of dissolving the sample in the accumulation medium and minimal interference of accompanying substances. The benefits of the developed method may also lead to its application in clinical analysis because the contents of VE and VK in human plasma range from 12 to 30 µmol L−1 and from 0.4 to 7.1 µmol L−1, respectively. This assumption can be considered to be a continuation of this study.

Author Contributions

Conceptualization, L.K. and M.S.; methodology, M.S. and R.M.; formal analysis, G.K., B.Š. and G.J.; authors of the manuscript, G.K., M.S. and L.K.; final correction, M.S. and L.K.; supervising, T.A. and Z.B. All authors have read and agreed to the published version of the manuscript.

Funding

This research received no external funding.

Acknowledgments

Financial supports from the Faculty of Chemical Technology, University of Pardubice (projects No. SGS-2020-002 and No. SGS-2020-005), The Czech Science Foundation (project No. 20-01589S) and mobility support from CEEPUS network CIII-CZ-0212-13-1920 are gratefully acknowledged.

Conflicts of Interest

Authors declare no conflict of interest.

References

  1. Sýs, M.; Švecová, B.; Švancara, I.; Metelka, R. Determination of vitamin E in margarines and edible oils using square wave anodic stripping voltammetry with a glassy carbon paste electrode. Food Chem. 2017, 229, 621–627. [Google Scholar] [CrossRef] [PubMed]
  2. Sýs, M.; Jashari, G.; Švecová, B.; Arbneshi, T.; Metelka, R. Determination of vitamin K1 using square wave adsorptive stripping voltammetry at solid glassy carbon electrode. J. Electroanal. Chem. 2018, 821, 10–15. [Google Scholar] [CrossRef]
  3. AL-Eitan, L.N.; Alzoubi, K.H.; Al-Smadi, L.I.; Khabour, O.F. Vitamin E protects against cisplatin-induced genotoxicity in human lymphocytes. Toxicol. In Vitro 2020, 62, 104672. [Google Scholar] [CrossRef]
  4. Sýs, M.; Žabčíková, S.; Červenka, L.; Vytřas, K. Adsorptive stripping voltammetry in lipophilic vitamins abstract determination. Potravin. Slovak J. Food Sci. 2016, 10, 260–264. [Google Scholar] [CrossRef]
  5. Webster, R.D. Voltammetry of the liposoluble vitamins (A, D, E and K) in organic solvents. Chem. Rec. 2011, 12, 188–200. [Google Scholar] [CrossRef]
  6. Parvin, M.H.; Arjomandi, J.; Lee, J.Y. γ-Al2O3 nanoparticle catalyst mediated polyaniline gold electrode biosensor for vitamin E. Catal. Commun. 2018, 110, 59–63. [Google Scholar] [CrossRef]
  7. Lang, J.K.; Packer, L. Quantitative determination of vitamin E and oxidized and reduced coenzyme Q by high-performance liquid chromatography with in-line ultraviolet and electrochemical detection. J. Chromatogr. A 1987, 385, 109–117. [Google Scholar] [CrossRef]
  8. Ly, S.Y. Voltammetric analysis of DL-α-tocopherol with a paste electrode. J. Sci. 2008, 88, 1272–1276. [Google Scholar] [CrossRef]
  9. Richardson, D.P.; Astrup, A.; Cocaul, A.; Ellis, P. The nutritional and health benefits of almonds: A healthy food choice. Food Sci. Technol. Bull. Funct. Foods 2009, 6, 41–50. [Google Scholar] [CrossRef]
  10. Chetot, T.; Taufana, S.; Benoit, E.; Lattard, V. Vitamin K antagonist rodenticides display different teratogenic activity. Reprod. Toxicol. 2020, 93, 131–136. [Google Scholar] [CrossRef] [PubMed]
  11. De Oliveira, R.B.; Stinghen, A.E.M.; Massy, Z.A. Vitamin K role in mineral and bone disorder of chronic kidney disease. Clin. Chim. 2020, 502, 66–72. [Google Scholar] [CrossRef]
  12. Takeda, K.; Morita, A.; Ikenaka, Y.; Nakayama, S.M.M.; Ishizuka, M. Comparison of two reducing agents dithiothreitol and tris (3-hydroxypropyl) phosphine for in vitro kinetic assay of vitamin K epoxide reductase. Vet. Anim. Sci. 2020, 9. [Google Scholar] [CrossRef]
  13. Wakabayashi, H.; Onodera, K.; Yamato, S.; Shimada, K. Simultaneous determination of vitamin K analogs in human serum by sensitive and selective high-performance liquid chromatography with electrochemical detection. Nutrition 2003, 19, 661–665. [Google Scholar] [CrossRef]
  14. Schlievert, P.M.; Merriman, J.A.; Salgado-Pabón, W.; Mueller, E.A.; Spaulding, A.R.; Vu, B.G.; Chuang-Smith, O.N.; Kohler, P.L.; Kirby, J.R. Menaquinone analogs inhibit growth of bacterial pathogens. Antimicrob. Agents Chemother. 2013, 57, 5432–5437. [Google Scholar] [CrossRef] [Green Version]
  15. Akbari, A.; Jelodar, G.; Nazifi, S.; Sajedianfard, J. An overview of the characteristics and function of vitamin C in various tissues: Relying on its antioxidant function. Zahedan J. Res. Med. Sci. 2016, 18. [Google Scholar] [CrossRef] [Green Version]
  16. Brigelius-Flohe, R.; Traber, M.G. Vitamin E: Function and metabolism. FASEB J. 1999, 13, 1145–1155. [Google Scholar] [CrossRef] [PubMed]
  17. Browne, D.; McGuinness, B.; Woodside, J.V.; McKay, G.J. Vitamin E and Alzheimer’s disease: What do we know so far? Clin. Interv. Aging 2019, 14, 1303–1317. [Google Scholar] [CrossRef] [PubMed] [Green Version]
  18. Fryer, M.J. Vitamin E may slow kidney failure owing to oxidative stress. Redox Rep. 1997, 3, 259–261. [Google Scholar] [CrossRef] [PubMed]
  19. Girolami, A.; Ferrari, S.; Cosi, E.; Santarossa, C.; Randi, M.L. Vitamin K-dependent coagulation factors that may be responsible for both bleeding and thrombosis (FII, FVII, and FIX). Clin. Appl. Thromb./Hemost. 2018, 24, 42S–47S. [Google Scholar] [CrossRef] [Green Version]
  20. Girolami, A.; Ferrari, S.; Cosi, E.; Girolami, B.; Lombardi, A.M. Congenital prothrombin defects: They are not only associated with bleeding but also with thrombosis: A new classification is needed. Hematology 2017, 23, 105–110. [Google Scholar] [CrossRef] [Green Version]
  21. Bajaj, R.; Karthikeyan, G.; Sinha, N.; Lokhandwala, Y.; Rao, D.; Kaushik, S.K.; Jain, S.L.; Narayanan, S.; Seth, A.; Satyamurthi, I.; et al. CSI consensus statement on prosthetic valve follow up. Indian Heart J. 2012, 64, S3. [Google Scholar] [CrossRef] [Green Version]
  22. Zamarrefio, M.M.D.; Pérez, A.S.; Pérez, C.G.; MCndez, J.H. High-performance liquid chromatography with electrochemical detection for the simultaneous determination of vitamin A, D3 and E in milk. J. Chromatogr. A 1992, 623, 69–74. [Google Scholar] [CrossRef]
  23. Fauler, G.; Leis, H.J.; Schalamon, J.; Muntean, W.; Gleispach, H. Method for the determination of vitamin K1(20) in human plasma by stable isotope dilution/gas chromatography/mass spectrometry. J. Mass Spectrom. 1996, 31, 655–660. [Google Scholar] [CrossRef]
  24. Kamal-Eldin, A.; Görgen, S.; Pettersson, J.; Lampi, A.M. Normal-phase high-performance liquid chromatography of tocopherols and tocotrienols Comparison of different chromatographic columns. J. Chromatogr. A 2000, 881, 217–227. [Google Scholar] [CrossRef]
  25. McMurray, C.H.; Blanchflower, W.J. Application of a high-performance liquid chromatographic fluorescence method for the rapid determination of α-tocopherol in the plasma of cattle and pigs and its comparison with direct fluorescence and high-performance liquid chromatography—Ultraviolet detection methods. J. Chromatogr. A 1979, 178, 525–531. [Google Scholar] [CrossRef]
  26. Hart, J.P.; Wring, S.A.; Morgan, I.C. Pre-concentration of vitamin K1 (phylloquinone) at carbon paste electrodes and its determination in plasma by adsorptive stripping voltammetry. Analyst 1989, 114, 933–937. [Google Scholar] [CrossRef]
  27. Sýs, M.; Žabčíková, S.; Červenka, L.; Vytřas, K. Comparison of adsorptive with extractive stripping voltammetry in electrochemical determination of retinol. Potravinarstvo 2017, 11, 96–105. [Google Scholar] [CrossRef]
  28. Komorsky-Lovrić, Š.; Lovrić, M. Theory of square-wave stripping voltammetry with adsorptive accumulation. Fresenius’ Z. Für Anal. Chem. 1989, 335, 289–294. [Google Scholar] [CrossRef]
  29. Silva, P.L.; Bastos, E.L.; El Seoud, O.A. Solvation in binary mixtures of water and polar aprotic solvents:  theoretical calculations of the concentrations of solvent−water hydrogen-bonded species and application to thermosolvatochromism of polarity probes. J. Phys. Chem. B 2007, 111, 6173–6180. [Google Scholar] [CrossRef]
  30. Donohue, M.D.; Aranovich, G.L. Classification of Gibbs adsorption isotherms. Adv. Colloid Interface Sci. 1998, 76, 137–152. [Google Scholar] [CrossRef]
  31. Yao, W.W.; Peng, H.M.; Webster, R.D. Electrochemistry of α-tocopherol (vitamin E) and α-tocopherol quinone films deposited on electrode surfaces in the presence and absence of lipid multilayers. J. Phys. Chem. C 2009, 113, 21805–21814. [Google Scholar] [CrossRef]
  32. Yang, J.E.; Yoon, J.H.; Won, M.S.; Shim, Y.B. Electrochemical and spectroelectrochemical behaviors of vitamin K1/lipid modified electrodes and the formation of radical anion in aqueous media. Bull. Korean Chem. Soc. 2010, 31, 3133–3138. [Google Scholar] [CrossRef] [Green Version]
  33. Vire, J.C.; Abo El Maali, N.; Patriarche, G.J.; Christian, G.D. Square-wave adsorptive stripping voltammetry of menadione (vitamin K3). Talanta 1988, 35, 997–1000. [Google Scholar] [CrossRef]
  34. Wang, L.Z.; Ma, C.S.; Zhang, X.L.; Xu, Y. Determination of vitamin K3 by cathodic stripping voltammetry. Microchem. J. 1994, 50, 101–105. [Google Scholar] [CrossRef]
  35. Sýs, M.; Metelka, R.; Stočes, M.; Vytřas, K. Electrochemical properties of a-tocopherol in aqueous electrolytes after its previous extraction into the glassy carbon paste from aqueous-acetonic mixture. Mon. Für Chem. Chem. Mon. 2016, 147, 31–38. [Google Scholar] [CrossRef]
  36. Hart, J.P.; Catterall, A. Electrosorption of vitamin K1 at mercury and its determination at submicrogram levels by differential pulse voltammetry at a hanging mercury electrode. Anal. Chim. Acta 1981, 128, 245–250. [Google Scholar] [CrossRef]
  37. Vire, J.C.; Lopez, V.; Patriarche, G.J.; Christian, G.D. Determination of vitamin K1 by adsorptive stripping square-wave voltammetry. Anal. Lett. 1988, 21, 2217–2225. [Google Scholar] [CrossRef]
  38. Lubeckyj, R.A.; Winkler-Moser, J.K.; Fhaner, M.J. Application of differential pulse voltammetry to determine the efficiency of stripping tocopherols from commercial fish oil. J. Am. Oil Chem. Soc. 2017, 94, 527–536. [Google Scholar] [CrossRef] [Green Version]
  39. Wilson, G.J.; Lin, C.Y.; Webster, R.D. Significant differences in the electrochemical Behavior of the α-, β-, γ-, δ-tocopherols (vitamin E). J. Phys. Chem. B 2006, 110, 11540–11548. [Google Scholar] [CrossRef]
  40. Lamon-Fava, S.; Sadowski, J.A.; Davidson, K.W.; O’Brien, M.E.; McNamara, J.R.; Schaefer, E.J. Plasma lipoproteins as carriers of phylloquinone (vitamin K1) in humans. Am. J. Clin. Nutr. 1998, 67, 1226–1231. [Google Scholar] [CrossRef] [Green Version]
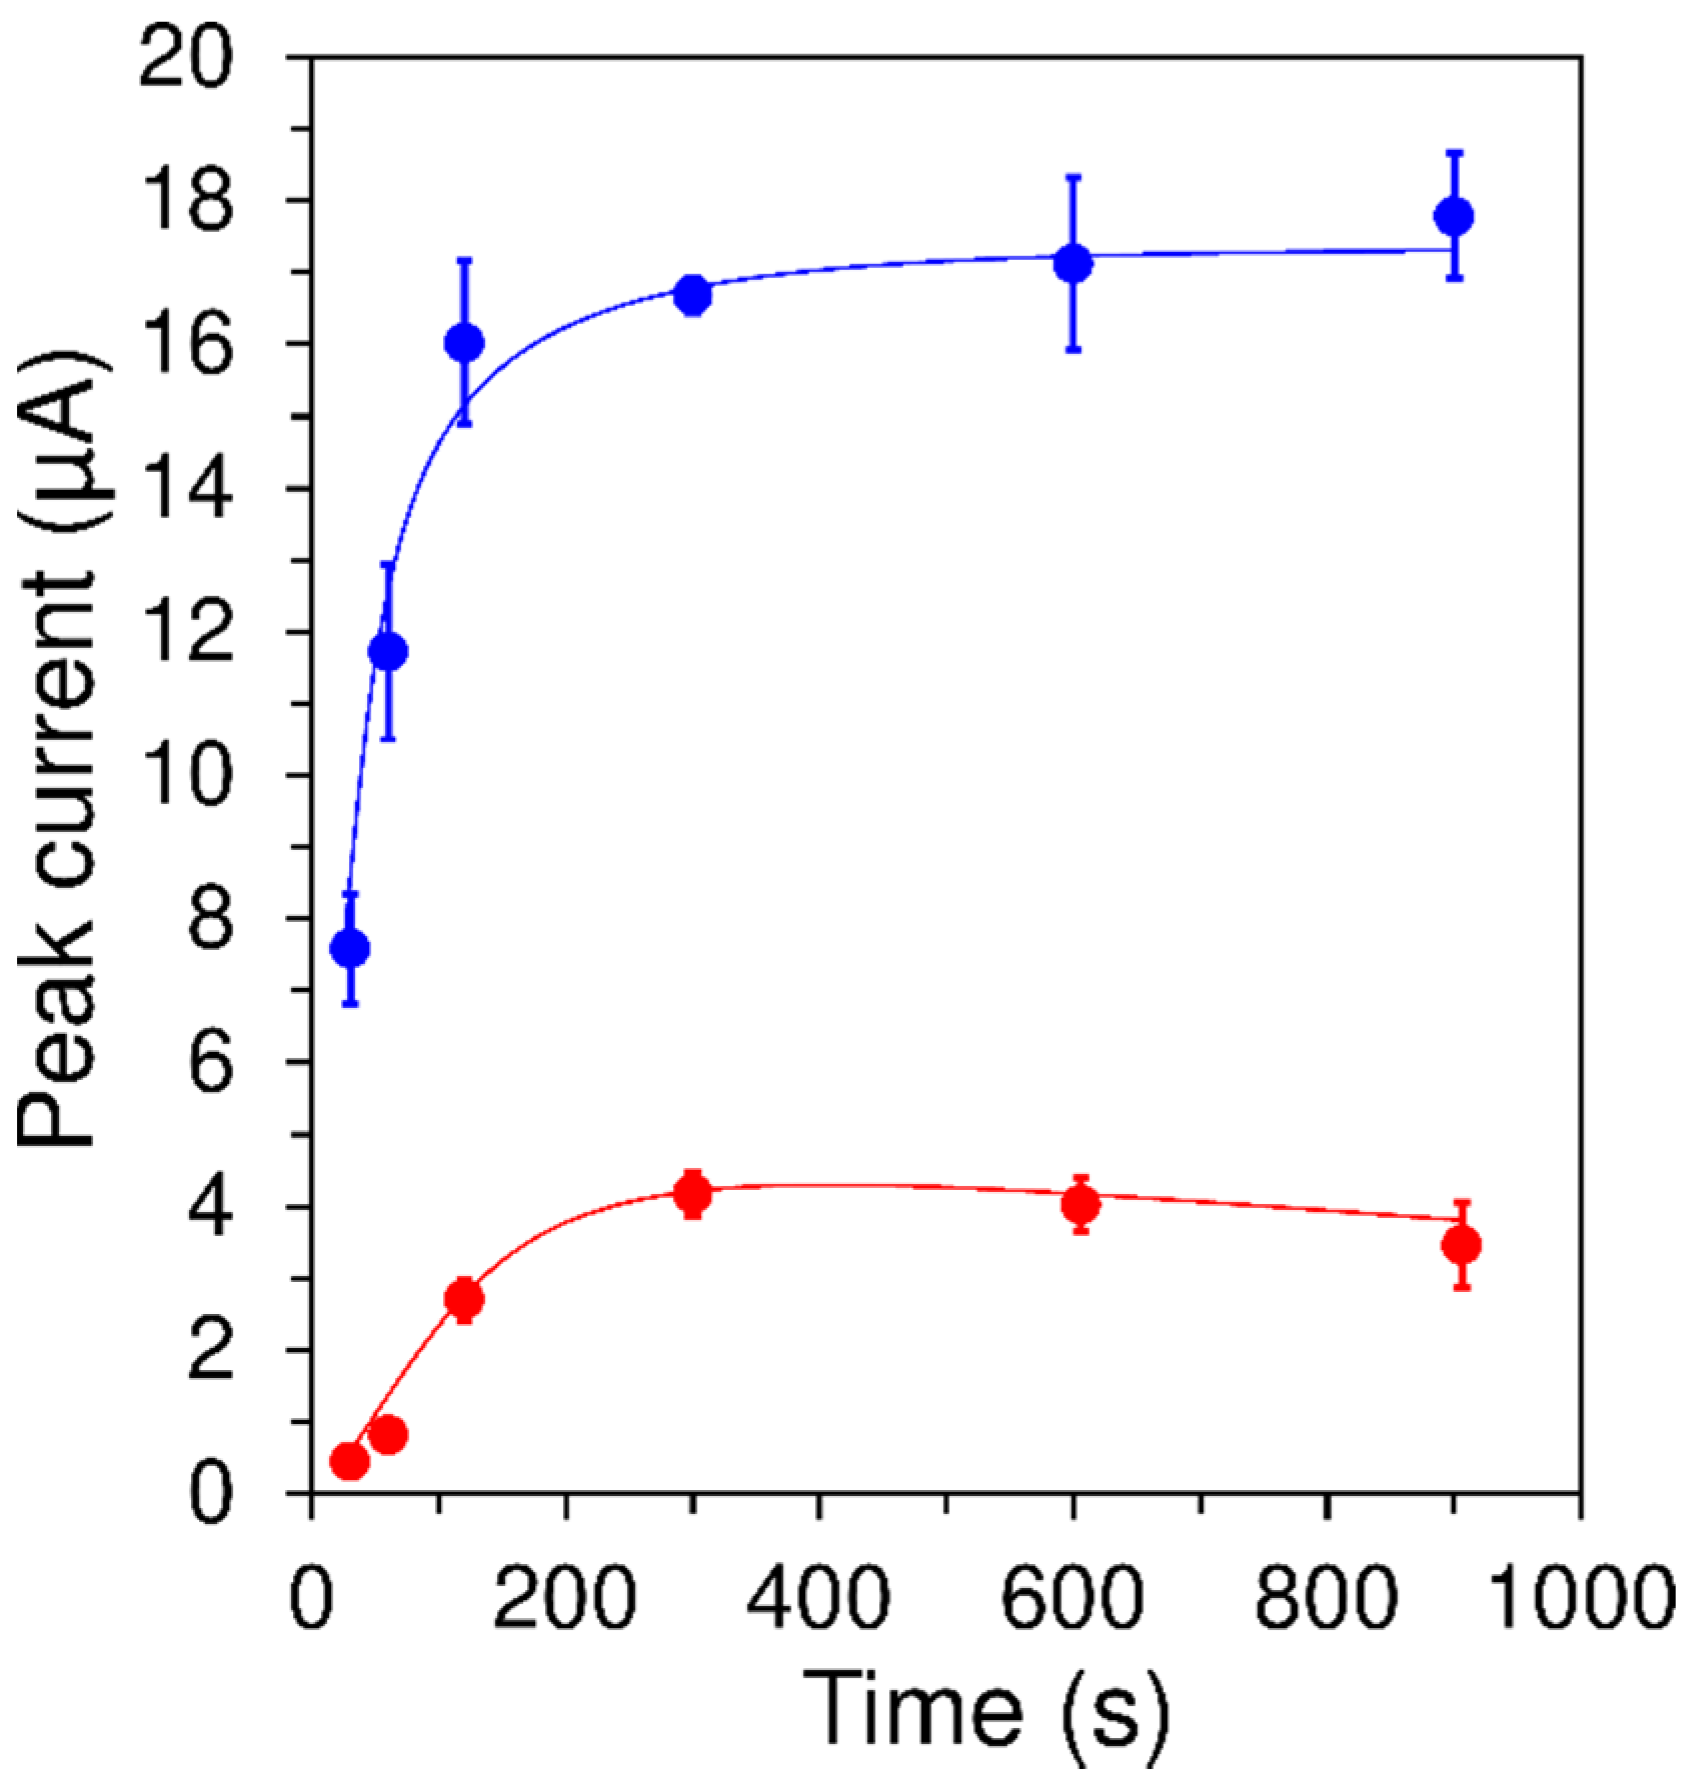
Figure 1. Dependence of anodic peak current phylloquinone (VK1) (red) and of (+)-α-tocopherol (α-TOH) (blue line) on adsorption time. square-wave adsorptive stripping voltammetry (SWAdSV) of 50-µmol L−1 α-TOH and 50-µmol L−1 VK1 adsorbed from its 50% aqueous–acetonitrile mixture onto a glassy carbon electrode (GCE) at stirring rate 400 rpm for different time durations. Voltammetric detection was carried out in 0.01-mol L−1 HNO3 containing 0.1-mol L−1 KCl (pH 2.08) at Edep = −0.1 V, tdep = 60 s, teq = 5 s, Estep = 5 mV, Eampl = 25 mV and f = 20 Hz.
Applsci 10 04759 g001
Figure 2. Dependence of anodic peak current VK1 (red) and α-TOH (blue line) on potential amplitude (A) and frequency (B). SWAdSV of 50-µmol L−1 α-TOH and 50-µmol L−1 VK1 adsorbed from its 50% aqueous–acetonitrile mixture onto GCE at stirring rate of 400 rpm for 5 min. Voltammetric detection was carried out in 0.01-mol L−1 HNO3 containing 0.1-mol L−1 KCl (pH 2.08) at Edep = −0.1 V, tdep = 60 s, teq = 5 s and Estep = 5 mV. The effect of potential amplitude was examined at a constant frequency of 80 Hz and the effect of frequency was studied at a constant potential amplitude of 25 mV.
Applsci 10 04759 g002
Figure 3. Repetitive SWV of VK1 (red, A) and α-TOH (blue records, B) adsorbed onto GCE surface from their 50-µmol L−1 solution (accumulated from 50% MeCN at stirring speed of 400 rpm for 5 min) in 0.01-mol L−1 HNO3 containing 0.1-mol L−1 KCl (pH 2.08) at Edep = −0.1 V, tdep = 60 s, teq = 5 s, Estep = 5 mV, Eampl = 30 mV and f = 80 Hz.
Applsci 10 04759 g003
Figure 4. SWAdSV voltammograms of calibration curves of VK1 and α-TOH at optimized working conditions: (A) 0 (blank), 2, 4, 6, 8 (dashed) and 10 (dotted line); (B) 0 (blank), 0.05, 0.1-, 0.2-, 0.4-, 0.6-, 0.8- and 1.0-μmol L−1 VK1 and α-TOH.
Applsci 10 04759 g004
Figure 5. SWAdSV voltammograms of mixture of two different food supplements analyzed by standard addition method (inset).
Applsci 10 04759 g005
Figure 6. HPLC analyses of food supplement VITAMÍN K2 MK 7 + D3 FORTE (black line) and 3 standard solutions of 10 mg L−1 VK1, VK2 and VK3. KinetexTM PFP 100 Å column (150 × 3 mm, particle size of 2.6 µm), mobile phase of water/methanol (10/90 v/v), flow rate of 0.3 mL min−1, sample volume of 10 µL, temperature 40 °C, detection at 246 nm.
Applsci 10 04759 g006
Table 1. Overview of stripping voltammetric methods for the determination of VK and vitamin E (VE).
ElectrodeAnalyteMethodLinear Range (mol L−1)LOD (mol L−1)Reference
HMDEVK1DPP2.2 × 10−8–2.2 × 10⁻⁷ [36]
HMDEVK1SWAdSV1.0 × 10−9–1.0 × 10⁻⁶ [37]
HMDEVK3SWAdSV2.0 × 10−10–5.0 × 10−71.3 × 10−10[33]
CPEVK1LSAdSV6.7 × 10−7–4.4 × 10−64.0 × 10−7[26]
GCEVK1SWAdSV5.0 × 10−6–1.0 × 10−45.1 × 10−8[2]
GCEVK1SWAdSV1.0 × 10−8–1.0 × 10−68.9 × 10−9[2]
GCEVK1SWAdSV7.7 × 10−8–1.0 × 10−62.5 × 10−8This work
GCPEVE (α-TOH)SWASV5.0 × 10−7–4.0 × 10−51.0 × 10−7[1]
GCEVE (α-TOH)SWAdSV2.9 × 10−8–1.0 × 10−61.0 × 10−8This work
Notes: CPE—carbon paste electrode; GCPE—glassy carbon paste electrode; DPP—differential pulse polarography; HMDE—hanging mercury drop electrode; LSAdSV—linear sweep adsorptive stripping voltammetry and VK3—menadione. LOD—detection limits.
Table 2. Comparison of SWAdSV with HPLC for the analysis of selected food supplements.
Food SupplementSWAdSVHPLCDeclared Content
VKVEVKVEVKVE
Model sample4.72 ± 0.2842.86 ± 1.944.8 ± 0.1345.3 ± 1.64.5143.71
Sample 10.11 ± 0.020.12 ± 0.010.10
Sample 20.20 ± 0.020.21 ± 0.012.50
Note: Values are presented as mg per capsule (µg per 100 mL in case of the model sample) and given as confidence intervals x ± st1−α, where x is the arithmetic mean, s the standard deviation and t1−α the critical values (2.365) of Student’s t-distribution for 8 repetitions of each analysis at α = 0.05.