Abstract
HS Solar Energy Company Inc. in Sejong city, Korea, has a big problem on how to monitor heterogeneous inverters with different protocols. Still a current photovoltaic power plant with different inverters, it has attracted significant attention to its experience of difficulties in monitoring integrated power generation. To solve this problem for the company, we adapt a metamodel mechanism to easily manage and integrate heterogeneous data into a metamodel-based data format. The existing metamodel-based photovoltaic monitoring system (M-PVMS) of the HS solar energy company also needs to simply predict the photovoltaic power generation in a day for small farm owners in the countryside. Therefore, we propose a method for predicting the power generation of M-PVMS panels using the gated recurrent unit (GRU) algorithm, which supports real-time learning to predict the photovoltaic system behavior that rapidly accumulates data in real time. As a result, we can predict the power generation for small farm owners with a probability of 96.353%.
1. Introduction
In recent years, faced with energy depletion because of the increase in the world’s population, oil price instability, and limited resources, there has been increasing interest in new renewable energies to solve this problem. In Korea, small farmhouses require low cost energy in the winter season. We focus on one of the renewable energies, like solar power and solar heat.
Furthermore, these renewable energies can change rapidly according to the climate. Hence their continuous management is required to maintain efficient energy, which continuously requires integrated monitoring services to maintain the energy production, operational status, and utilization of renewable energy installations.
In Korea, the New and Renewable Energy Center (NREC) of Korea Energy Management Corporation [1,2,3] has organized for the improvement of facility utilization by establishing a monitoring system. Moreover, it provides data for making policies, research, and projects.
Power exchange [4] is an efficient system for managing and controlling electrical energy, which supports just the homogeneous systems and does not manage the photovoltaic (PV) power generation of different systems. Further, technical support and maintenance may be unmanaged or unusable after the maintenance period for new renewable energy-related systems [5].
Presently, studies are conducted on various monitoring systems, such as the PV monitoring system combined with current GPS technology [6], web-based monitoring and remote control technology of the PV system [7], cloud service-based mobile monitoring service system [8], remote monitoring system based on ZigBee communication [9], GSM-based photovoltaic power monitoring system [10], smart grid monitoring system for building/home energy management [11], and smart monitoring technique for photovoltaic power systems [12].
Although the research on monitoring systems exists, these studies are insufficient with regard to monitoring systems connected with the existing legacy systems. To solve this problem, the metamodel-based photovoltaic monitoring system (M-PVMS) [13] provides a function for different connection and manages new renewable energy generation. The M-PVMS can efficiently integrate individual systems based on standard interfaces for data interoperability and reduce costs and times of development to plug and play new devices into the existing PVMS.
Recently, the failure of solar panels has been a critical factor in solar power generation. The M-PVMS uses solar panels with bypass diodes. This panel offers the advantage that the power generation of the normal cell is preserved even when a failure of the solar cell of the panel occurs. However, depending on the type of inverter, a fault alarm may not occur. Therefore, it is difficult for the individual owner to recognize the failure of the panel. Consequently, the owner may not recognize to reduce the amount of power generation.
To solve this problem, we suggest (1) prediction of solar power generation of M-PVMS using the gated recurrent unit (GRU) algorithm, which is a deep learning model used to improve long short-term memory (LSTM) as an upgrade of the existing recurrent neural network (RNN) structure, and this makes it suitable for use in M-PVMS data collection environments, (2) extension of the metamodel of M-PVMS with local environmental and public data for power generation prediction, and (3) verification of predicted generation with real generation.
This paper is organized as follows. Section 2 describes related studies. Section 3 describes how to improve the M-PVMS integrated server with redefining the metamodel for prediction of M-PVMS power generation. Section 4 describes the accumulated data analysis within the M-PVMS system, the data identification for training data set, and power prediction module of power generation with the GRU algorithm. Section 5 describes the verification of our predication model. Finally, Section 6 presents the conclusion and future work.
2. Related Studies
2.1. Metamodel-Based Model Transformation
The metamodel-based model transformation method is the model transformation method of model driven architecture (MDA) [14]. The metamodel-based transformation engine is easy to interoperate and manage heterogeneous legacy systems.
The detailed process is shown in Figure 1. The source model depicts the model before transformation, and the source metamodel contains meta-information on the source model. The target model is the model after transformation, and the target metamodel contains meta-information on the target model. Transformation language automatically converts a source model to a target model using meta-information from the source metamodel and target metamodel. The transformation engine parses and executes transformation language to transform the source model into a target model.
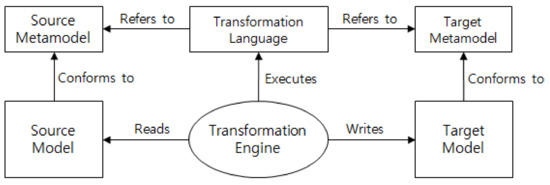
Figure 1.
Structure of metamodel-based model transformation engine.
2.2. Traditional PVMS
The structure of a legacy monitoring system is shown in Figure 2. Generally, inverter companies provide monitoring systems. Therefore, if heterogeneous inverters are installed in one power plant, one monitor should be used to run heterogeneous monitoring systems.
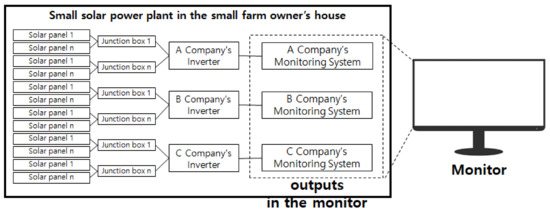
Figure 2.
Structure of common solar energy monitoring system.
To solve this problem, the M-PVMS [13] provides a function to connect and manage new renewable energy generation systems. The M-PVMS can efficiently integrate individual systems based on standard interfaces for data interoperability and reduce costs and development time in comparison with the existing PVMS.
2.3. Our Previous M-PVMS
Our M-PVMS for small farm owners manages information from heterogeneous inverters, such as the power amount, temperature, and tilt sensors. The M-PVMS consists of the local monitoring server and the integrated monitoring server, as shown in Figure 3. The local monitoring server sends the integrated monitoring server the monitoring data generated in junction boxes and inverters using RS232 communication. The problem is that different inverter manufacturers use different data protocol formats. To solve this problem, the local monitoring servers convert data generated in heterogeneous inverters into integrated data with the metamodel-based model transformation. The integrated monitoring server collects the data received from the local monitoring servers using TCP/IP communication to manage all data, which are stored in a database and analyzed through big data systems. They exist for services such as target load prediction, real-time prediction of new renewable energy, integrated control, optimal control status, and operational integration monitoring.
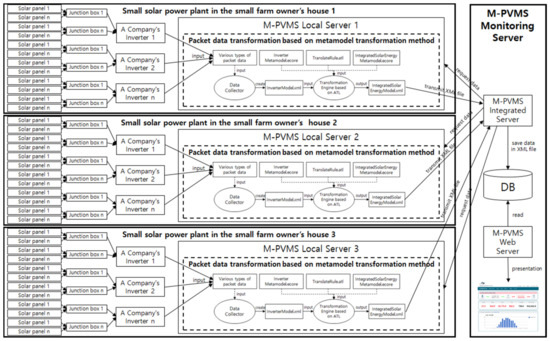
Figure 3.
Structural diagram of proposed metamodel-based photovoltaic monitoring system (M-PVMS).
This software platform consists of the Java framework, RS232 communication middleware, Netty [15], Hadoop [16], and visualization module-based TCP/IP communication middleware. All collected data are stored in a server database and analyzed in Hadoop to support various services. The visualization module uses graphs to display all data to end users and managers.
Figure 4 shows the structure of the metamodel used to convert data generated in heterogeneous inverters into integrated data. Each local monitoring server automatically performs the function to convert heterogeneous inverter data formats in accordance with metamodel structures, which is composed of a root element called the SolarEnergyModel. It contains the system ID and time of the transmitted protocol where there exist subnodes, such as PlantDisplay, Inverters, Sensors, and Junction Boxes. The PlantDisplay node exhibits total monitoring results, such as current power, daytime power, yesterday’s power, monthly power, last month’s power, and total power. Inverter nodes combine the information collected by each inverter node, which comprises data such as current power, day power, yesterday’s power, total power, output current, output voltage, input power, input current, input voltage, frequency, and warning data. The sensors node consists of some data, such as horizontal solar radiation, gradient solar radiation, module temperature, ambient temperature, CO2 density, slope, etc. The JunctionBox node shows the voltage and current values of the PV modules connected to the real junction box.
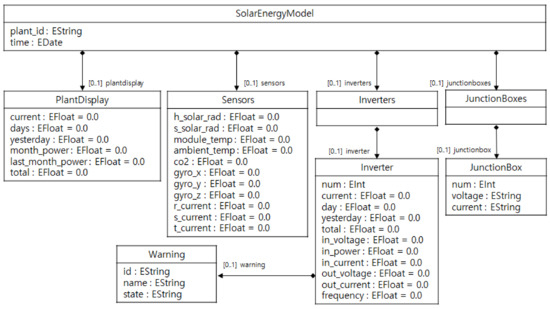
Figure 4.
Integrated metamodel for heterogeneous data transmissions.
Our M-PVMS monitoring system is shown in Figure 5. The current and past amounts of power generations can be collected from the real-time monitoring on the webpage.
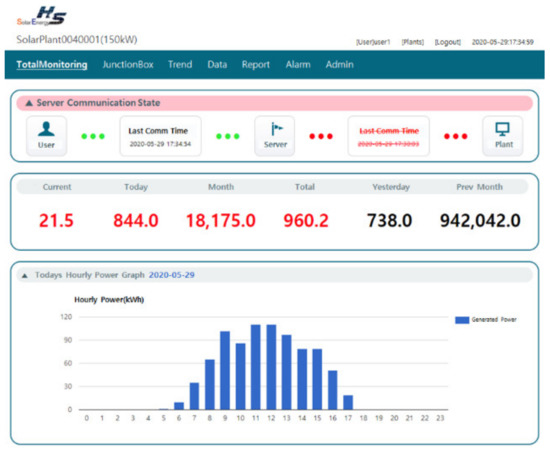
Figure 5.
Implemented M-PVMS monitoring server.
2.4. Gated Recurrent Unit (GRU)
A recurrent neural network (RNN) can process data with consecutive sequences [17]. This artificial neural network has the structure of input , output , and hidden layer . It is an algorithm that makes a prediction by circulating the output of the hidden layer back to the input value. Generally, the RNN is used for predicting data that feature voice recognition, handwriting recognition, time series, etc. Figure 6 shows the typical RNN structure.
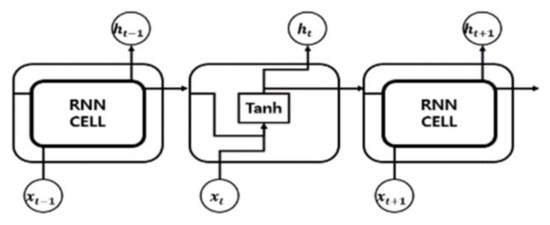
Figure 6.
Typical recurrent neural network structure.
The RNN can be used to solve the problem of predicting from previous data; however, a problem occurs that does not reflect the long-time-ago data in the prediction. To solve it, a long short-term memory (LSTM) network has been proposed.
The GRU algorithm [18] is a structured cell that lowers the computational complexity of LSTM, which is an improvement of the existing RNN structure. It has the advantages of an LSTM cell; however, it can reduce the number of gates used previously and speed up learning by not using additional nonlinear functions when calculating the output values. GRU gates are approximately divided into an update gate and a reset gate. Input and forget gates of LSTM are merged into the update gate, and the reset gate is applied to the previous hidden state value. Figure 7 shows the structure of the GRU cell.
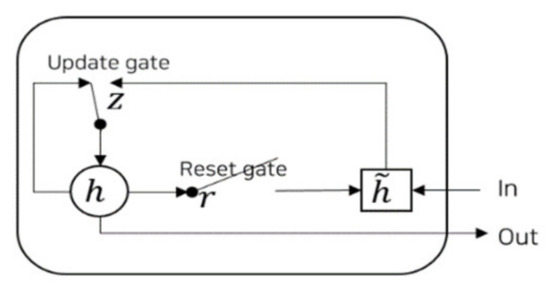
Figure 7.
Structure of gated recurrent unit (GRU) cell.
Update gate z determines the activate or update state. Reset gate r assumes the value of the previous state of GRU.
3. Our Improved M-PVMS Structure
3.1. Improvement of M-PVMS Integrated Server
The improved structure of the M-PVMS integrated server is showed in Figure 8. The original M-PVMS integrated server has urgent mail sender, model data request sender, and model data receiver. The urgent mail sender transmits urgent messages to the administrator when there is an abnormal state of inverter or a disorder of the panel. The model data request sender asks transmit data of each integrated power generation to each M-PVMS local server. The model data receiver stores IntegratedEnergyModel.xml file data of power transmitted from the M-PVMS local server.
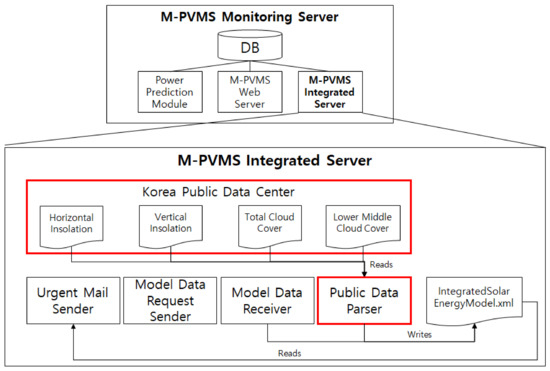
Figure 8.
Improved structure of M-PVMS integrated server.
We add a public data parser into the M-PVMS integrated server in the red box at Figure 8. The public data parser gets horizontal and vertical insolation, total cloud cover, lower-middle cloud cover from the Korea public data center [19], and saves into the IntegratedEnergyModel.xml file after parsing them.
3.2. Redefined Metamodel for Prediction of M-PVMS Power Generation
For the GRU prediction method, we need information on the horizontal solar radiation, vertical solar radiation, cloud cover, and middle and lower cloud presence from the Korea public data center. This information was added to the integrated metamodel of the M-PVMS local server. The improved metamodel is shown in the red box at Figure 9.
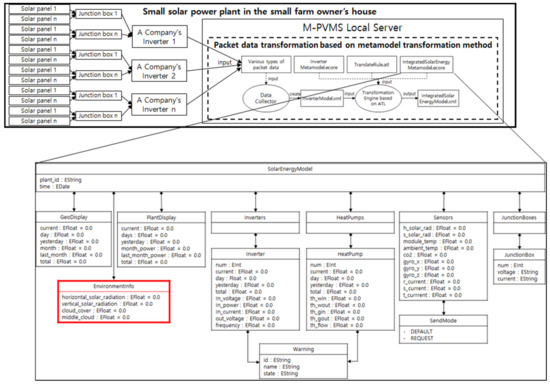
Figure 9.
Improved M-PVMS metamodel with environmental information.
Figure 10 shows the example code of IntegratedSolarEnergyModel.xml generated by the improved metamodel of the local server. The server inputs zero value of all attributes within the environmentinfo tag with red color in the XML file, and transmits the whole XML file to the integrated server. The integrated server inserts public data such as horizontal solar radiation, vertical solar radiation, cloud cover, and middle cloud from the Korea public data center into the environmentinfo tag.
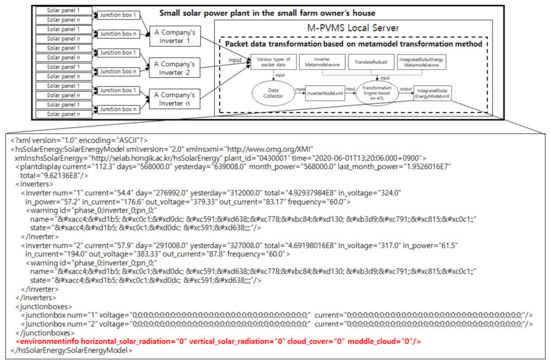
Figure 10.
Example code of IntegratedSolarEnergyModel.xml.
4. The Accumulated Data Analysis within the M-PVMS System
4.1. The Data Identification for Training Data Set
To identify data for training sets, we identified the right date through the correlation analysis of all PV power-related data from the integrated server and the public data center. For extracting the right data, it is necessary to find the correlative relationship between solar power generation data and environmental information in order to predict future power generation. That is, we predicted the power generation the day after today with the identified data. Table 1 shows the significant correlation after measuring the relationship between the current output and the environmental data on the Pearson correlation coefficient. The environmental sensor consists of an environmental sensor in a Korea public data center and an environmental information sensor that are installed in a solar power station. Significant data types in Korea public data centers are total cloud amount, lower-middle cloud amount, and insolation. Significant data types in the solar power plant environmental information sensor are vertical solar radiation and horizontal solar radiation. Pearson’s correlation coefficient expresses the correlation of each item with a value between −1 and 1. If the value is close to −1, there is a correlation that the variable y decreases as the variable x increases. If the value is close to 0, there is no correlation. If the value is close to 1, there is a correlation that the variable y increases when the variable x increases.

Table 1.
Correlation coefficient measurement table between power generation data and public data.
According to these data, the amount of insolation is inversely correlated when the clouds are high. Hence, the current output of power generation has a correlation coefficient that is proportional to the insolation. Therefore, we used these data, such as horizontal solar radiation, vertical solar radiation, total cloud cover, lower-middle cloud cover, and output, in learning for prediction.
4.2. Power Prediction Module of Power Generation with GRU Algorithm
Figure 11 shows the structure of the power generation prediction module. First, we stored power generation, insolation, module temperature data, public data insolation, and cloud cover data in the M-PVMS, and then merged them in the same local time.
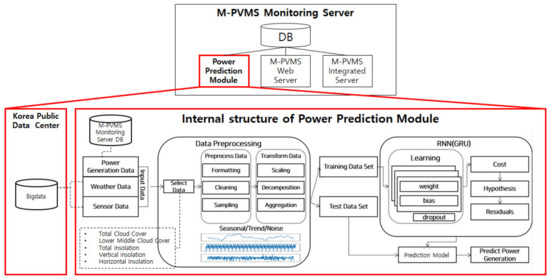
Figure 11.
Structure of power prediction module.
Second, in data preprocessing, we refined the merged data with two steps as follows: (1) preprocess through formatting, cleansing, and sampling with the merged data, and (2) transform with scaling, decomposing, and aggregating with the preprocessed data. Then, we classified them into the category of seasonal, trend, and noise with Seasonal-Trend decomposition using base Loess (STL) implementation.
Third, with the gated recurrent unit (GRU) algorithm, we executed training with the transformed data for predication. At this point, we assigned the value of dropout with 0.3 against the overfitting learning, that is, just training them except 30% of all neural nodes. To measure a training error, we used the mean squared error (MSE) method for precision and root mean squared error (RMSE) method for error of test data. The nearest zero value of MSE and RMSE may be the highest accuracy.
After learning, the training result was about 0.000 MSE of the error rate and the test result was about 0.015 RMSE of the error rate, which has a good prediction performance.
This means that the average error rate is about 1.2% of the real power generation value in the prediction through the verification data. Prediction models include those that predict power generation after one hour and those that do so after one day. Therefore, if the real power generation continuously exhibits significant differences from the predicted power generation, it is possible to anticipate the aging of a generator device and replace it in advance.
Figure 12 shows the graphs that predict data for 12 h when the sun was passing by predicting the amount of power generation per hour. Figure 13 shows results for 105 days obtained by predicting data per day. The red line represents the prediction and the blue one indicates the real power generation value. Consequently, there is little difference between the predicted total power generation and the real total power generation from 0.01% to 0.02%.
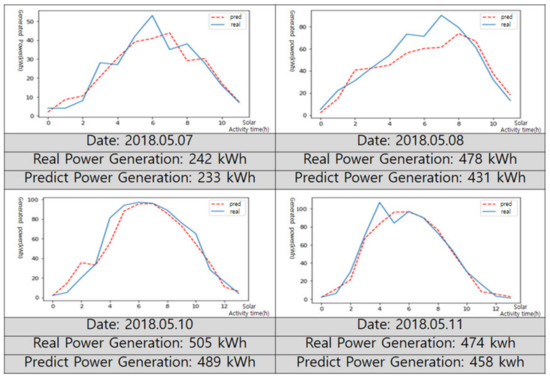
Figure 12.
Power generation prediction result per hour.
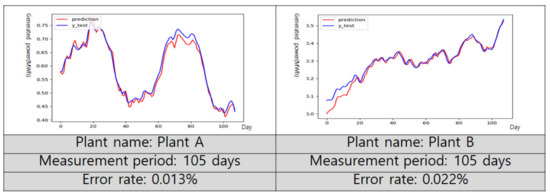
Figure 13.
Power generation prediction result per day.
5. Verification of Predication Model
We needed to check whether the data are reliable enough. In statistics, according to the central limit theorem, the sample size has to be 30 or greater. The t-distribution and the standard normal distribution will be the same with an infinitely large sample size. Additionally, for sample sizes greater than 30, they will be similar, but the t-distribution will be somewhat more conservative. We used 120 sample data with a sample size of more than 120, which means that the sample data are reliable according to the central limit theorem. Another way to find that the data sample are reliable is by using the t-test. We used paired sample t-tests since we have two independent data sets. The paired sample t-test is good when two numeric data are compared. The significance level for this test is set at α = 0.05. If the p value is larger than α, the real power generation and the predicted power generation have little similarity. The result of the paired sample t-test is shown in Table 2.
Table 2.
The result of paired sample t-test.
The test statistic is the difference between the average of real power generation and the average of predicted power generation. The degree of freedom (df) is the number of power generation data. Alternative hypothesis uses a two-sided test. The p value is 1.621 × 10⁻¹⁴, that is, 0.00000000000001621. Therefore, p value is less than α (0.05). This means that the result is statistically significant. So, we can say that the sample data are reliable through these tests. Since data samples are reliable, we can verify that the predicted model is close enough to the measured value of the current power.
In order to verify our prediction model, we used a statistical method called the mean absolute percentage error (MAPE). The MAPE is the most common measure used to forecast error and works best when there are no extremes to the data (and no zeros) [20]. The MAPE formula is:
We used the extracted data to verify whether the model is accurate enough or not. is the real power generation value. is the predicted power generation value. We set 95% of reliability degree to estimate that the predict model is successfully predicted for power generation. First, we subtracted two data samples and found the absolute value. Then, all the values obtained are added through sigma and multiplied by 100 to obtain the percentage. Second, in order to find the error rate of all values, we divided by n, which is 120. The error rate obtained through this process is 3.647%. Therefore, the similarity (reliability degree) between the predicted value and the real measured value is 96.353%, that is, 100 minus the error rate (3.647%). As determined above, the similarity between the two data samples is more than 95%. As a result, we can recognize that the predicted data are successfully predicted.
6. Conclusions and Future Research
In this research, we give a solution for a small solar energy company in Korea that has a big problem of how to monitor heterogeneous inverters with different protocols. Still a current photovoltaic power plant with different inverters, it has attracted significant attention to its experience of difficulties in monitoring integrated power generation. To solve this problem for the company, we adapted a metamodel mechanism to easily manage and integrate heterogeneous data into a metamodel-based data format. Simply predicting photovoltaic power generation for just a day for the small farm owners in the countryside, we improved this system for learning with the data accumulated.
Therefore, we developed a method for predicting power generation of M-PVMS panels using the gated recurrent unit (GRU) algorithm, which supports real-time learning to predict the photovoltaic system behavior that rapidly accumulates data in real time for the small solar energy company and small farm owners. As a result, we predicted the power generation for small farm owners as a probability of 96.353%. We are still developing and determining solar panel failure diagnosis and predicting error probabilities.
Author Contributions
W.S.J., J.S.H., J.H.K., B.K.J., and R.Y.C.K. designed the present study, reviewed the literature, and drafted the manuscript; J.S.H. and J.H.K. performed the verification of the predication model; W.S.J., B.K.J., and R.Y.C.K. critically revised the manuscript. All authors have read and agreed to the published version of the manuscript.
Funding
This research was supported by the Ministry of Trade, Industry, and Energy (MOTIE), Korea, through the Education Program for Creative and Industrial Convergence (Grant Number N0000717).
Conflicts of Interest
The authors have no conflicts of interest.
References
- New & Renewable Energy White Paper; Ministry of Trade & Industry and Energy: Sejong, Korea, 2014.
- Yang, S.J. This is a dawn for the solar age. LG Bus. Insight 2015, 2–15. [Google Scholar]
- New & Renewable Energy Center in Korea Energy Management Corporation. Available online: http://www.energy.or.kr (accessed on 31 August 2019).
- Korea Power Exchange’s ePEMS. Available online: http://epems.kpx.or.kr (accessed on 31 August 2019).
- Woo, J.T.; Lee, J.H.; Seo, T.W.; Han, M.H.; Seo, M.J. A Study on Standardized Instrumentation for Solar Power Plants Operated by Remote Control; The Korea Institute of Electronic Communication Sciences: Yeosu, Korea, 2015; Volume 10, pp. 707–712. [Google Scholar]
- Duan, X.; Liang, Z.; Li, X.; Niu, S.; Zhou, W. Research of distributed photovoltaic power supply access simultaneous power quality monitoring system. In Proceedings of the China International Conference on Electricity Distribution (CICED), Nanjing, China, 13–16 September 2010; pp. 1–4. [Google Scholar]
- Singh, B.S.; Husain, N.S.; Mohamed, N.M. Integrated photovoltaic monitoring system. In Proceedings of the AIP Conference, Chonburi, Thailand, 18–20 July 2012; Volume 1482, p. 176. [Google Scholar]
- Ryu, Y.H.; Yoo, J.K.; Kim, Y.R. Cloud Services based Mobile Monitoring for Photovoltaic Systems. In Proceedings of the IEEE 4th International Conference on Cloud Computing Technology and Science, Taipei, Taiwan, 3–6 December 2012; pp. 578–580. [Google Scholar]
- Je, H.W.; Yang, O. Remote Monitoring System of Photovoltaic Inverter using Zigbee Communication. J. Korean Inst. Inf. Technol. 2012, 10, 94–101. [Google Scholar]
- Gagliarducci, M.; Lampasi, D.A.; Podesta, L. GSM-based monitoring and control of photovoltaic power generation. Measurement 2007, 40, 314–321. [Google Scholar] [CrossRef]
- Batistaa, N.C.; Meliciob, R.; Matiasa, J.C.O.; Catalaoa, J.P.S. Photovoltaic and wind energy systems monitoring and building/home energy management using ZigBee devices within a smart grid. Energy 2013, 49, 306–315. [Google Scholar] [CrossRef]
- Cho, H.C.; Sim, K.Y. A Development of Smart Monitoring Technique for Photovoltaic Power Systems. Trans. Korean Inst. Electr. Eng. 2015, 64, 50–56. [Google Scholar] [CrossRef][Green Version]
- Jang, W.S.; Son, H.S.; Seo, C.Y.; Kim, R.Y.C. Metamodel Based Photovoltaic Monitoring System for Heterogeneous Renewable Energies. Asia Pac. Soc. Comput. Inf. Technol. 2017, 1, 44–47. [Google Scholar]
- Jang, W.S.; Kim, R.Y.C. A Case study of Cost Reduction for Maintenance of Photovoltaic Energy Monitoring System based on Model Driven Architecture. KCSE 2019, 21, 159–161. [Google Scholar]
- Netty. Available online: http://netty.io (accessed on 31 August 2019).
- Hadoop. Available online: http://hadoop.apache.org (accessed on 31 August 2019).
- Pascanu, R.; Gulcehre, C.; Cho, K.; Bengio, Y. How to Construct Deep Recurrent Neural Networks. arXiv 2014, arXiv:1312.6026. [Google Scholar]
- Chung, J.; Gulcehre, C.; Cho, K.; Bengio, Y. Empirical Evaluation of Gated Recurrent Neural Networks on Sequence Modeling. arXiv 2014, arXiv:1412.3555. [Google Scholar]
- Korea Public Data Center. Available online: https://www.data.go.kr/ (accessed on 31 August 2019).
- Swamidass, P.M. Encyclopedia of Production and Manufacturing Management; Springer: Boston, MA, USA, 2000; p. 462. [Google Scholar]
© 2020 by the authors. Licensee MDPI, Basel, Switzerland. This article is an open access article distributed under the terms and conditions of the Creative Commons Attribution (CC BY) license (http://creativecommons.org/licenses/by/4.0/).