1. Introduction
When the boundaries or the interiors of compressible mediums are exposed to a rapid temperature change, a rapid expansion of the adjacent medium will occur and generate a pressure or stress wave, just as when a piston is suddenly pushed into a gas-filled tube. In terms of heat transfer, the waves from these thermal phenomena in the boundary of a compressible fluid are called thermo-acoustic convection.
The case of compressible fluids and thermal dynamic processes are closely related to each other because of local heat exchange. Rayleigh [
1] found the idea that a micro-difference in temperature can generate a mechanical reaction in the form of an acoustic wave in the rest of the fluid. Ozoe et al. investigated the characteristics of fluid flow from this rapid heating, so called thermos-acoustic convection [
2,
3], using numerical methods. They applied temperature-independent thermo-physical properties to finite difference solutions of the compressible Navier–Stokes equations for the gas dynamics. From the matched asymptotic expansions and multiple-time-scale methodology, Kassoy [
4] and Radhwan and Kassoy [
5] investigated the thermo-acoustic phenomena in an enclosed ideal gas with slow and rapid boundary heating. They found that the dominant process has two physical regimes, thermo-dynamic convection on the acoustic timescale and strong conductive–convective coupling on the typical timescale for thermal diffusion, respectively. Huang and Bau [
6,
7] established their theoretical modeling of the thermo-acoustic effect in gases, which specified that the thermo-mechanical waves, linear or nonlinear, should have an asymmetrical waveform, including a sharp front and a long tail. These are completely opposite configurations compared to previous predictions, such as those for a rounded symmetric configuration. Fusegi et al. [
8] investigated the characteristics of thermo-acoustic waves under a nitrogen-filled two-dimensional cavity in order to study how these can be developed to enhance the effective heat removal mechanism. Lin and Farouk [
9], Aktas and Farouk [
10], Farouk et al. [
11], and Škerget and Ravnik [
12] investigated the strong thermo-acoustic waves according to impulsive heating applied to boundary element methods (BEM). Moreover, they found that the horizontal velocity component reverses sign after reflection from the side walls, such as one-dimensional flow fields.
Interferometric studies using the principle of interference of consistent light beams due to a phase difference are useful methodologies for the experimental study of thermal fluid phenomena. Goldstein and Eckert [
13] checked the heat transfer coefficients on a uniformly heated vertical plate using Mach–Zehnder interferometry. Polymeropoulos and Gebhart [
14] investigated the thermal boundary layer of a vertical flat plate using an interferometric apparatus. Shakher and Nirala [
15] explained their interferometric study using laser beams for the measurement of the refractive index and the thermal phenomena of burners. Herman et al. [
16] experimentally investigated the incompressible flow of air over heated obstacles in a two-dimensional and horizontal channel using holographic interferometry and high-speed cinematography. Jarosinski [
17] studied the convection phenomena from the heated wall of a duct using various interferometric methods like interferometry, Schlieren, and PIV (particle image velocimetry) methods with a high-speed camera. Binoy and Sobhan [
18] performed finite difference methods to check the forced convection phenomena in a compact mini-channel with rectangular obstacles and compared these results to the experimental results using Michelson interferometry. These technologies can be applied to various fields where temperatures are not very high. Interferometry can be an effective means for measuring three-dimensional unsteady thermal flow fields accurately. They also checked the forced convection characteristics in a meso-scale channel with inconstant cross-sections using finite difference solution and validated these results with the experimental results from Mach–Zehnder interferometry [
19]. Ahadi and Saghir [
20] performed experimental studies to measure the heat transfer phenomena under thermo-diffusion experiments, using Mach–Zehnder interferometry at reduced gravity. They explained the deviations reflected in the measured results between the temperature differences at the hot and cold sides of a cell using optical techniques and Peltier elements. Takahashi et al. [
21] confirmed the availability of the bumped channel for the micro heat sink which is to measure the density distributions of supersonic flow in the microchannel using a phase-shifting interferometer. The results were validated by the results from a numerical study of basic density field and heat transfer simulations. Yousefi-Asli, et al. [
22] performed an experimental study to determine the temperature field and Nusselt number for a methane/air slot flame impinging into a cylindrical surface. In order to determine the temperature, Mach–Zehnder interferometry was used. The effects of the operating conditions, Reynolds number, equivalence ratio, distance between the burner and impingement surface, and the surface diameter were considered in order to analyze the thermal fluid flow phenomena.
Additionally, there were a few experimental studies focused on obtaining results for the thermo-acoustic wave phenomena using interferometric apparatuses. Blanc-Benon et al. [
23] measured the flow characteristics from a stack of parallel plates at relatively low drive ratios between 1.0% and 1.5% using PIV, and they validated these results using the results of numerical analysis. Berson et al. [
24] investigated the flow phenomena in the stack of a thermo-acoustic refrigerator using the PIV method. They found that vortex flow fields are generated during the half period of the acoustic cycle when the working fluid flows out of the stack, and they showed the flow phenomena using eight vortices according to eight different phases within an acoustic cycle. Mao et al. [
25] performed various experimental studies using PIV to find the vortex generation processes under higher drive ratios (by 2%), using two stacks with 1 and 5-mm thick plates, with fixed spacing between the plates of 5 and 10 mm, respectively. They utilized nine figures of vortices out of 20 phases to describe an acoustic cycle, and they found that the most significant vortex structures turned up in the ejection stage (when the fluid flows out of the stack). Aben et al. [
26] judged that the ratio between Strouhal and Reynolds numbers is an important factor in deciding the vortex shapes behind the stack plates, and they also investigated the porous effects and the end shape of the plate. Shi et al. [
27,
28,
29,
30] found that the various parameters and Reynolds numbers were around 5000. They also tried to prove the relationship between the Reynolds number and the Strouhal number according to the vortex shedding frequency and the evolution of the vortex wake patterns. The fluctuating fields were classified as the ejection stage and the suction stage. The two-dimensional temperature fields were also observed via planar laser-induced fluorescence and combined with the velocity fields.
The intensive studies on the thermo-acoustic phenomena created by thermal effects were being investigated numerically and experimentally at the end of the twentieth century. However, there were a lot of problems, like various errors of numerical schemes, inaccuracy of the experimental methodologies, and the difficulty of visualization in thermal flow fields with various parameters. In the present study, the heat transfer phenomena induced by the rapid heating of a metal sheet in air are experimentally studied. A resistance–capacitance (R–C) heating device and measurement systems including a high-speed imaging system were designed, and measurement processes were developed. The focus was centered on the temperature profile of the metal surface and the visualization of isotherms near the nickel sheet in open space. In addition, the effect of heat transmission with respect to the heating conditions of a nickel sheet was quantified by finite fringe analysis with a Mach–Zehnder interferometer.
2. Experiments
2.1. Experimental Apparatus
Figure 1a shows the schematic of an experimental chamber and circuit to obtain the pressure wave and the temperature in open space [
31]. The experimental setup for an open space is composed of bus bars, connecting bolts, and a nickel sheet. For minimizing thermal loss, insulating materials are added under the nickel sheet. This is fixed on the bus bars to connect the heating circuit. The temperature of an experimental specimen (nickel sheet) with resistance can be increased suddenly according to the capacitor’s characteristics, which allows the quick release of electric power. The designed R–C heating system of this study has charging and discharging circuits, an electric switch, and a trigger part near the capacitor (see
Figure 1b). The charging circuit has a capacitor which has the ability to charge electric power, a power supplier to handle the direct current, a resistor to protect over current, and a power button. The discharging circuit contains a capacitor, a metal sheet which will be heated by the discharging electric power, and the power button for immediate opening of the circuit.
Table 1 and
Table 2 show the details of the capacitor and the physical properties of the experimental specimen, respectively.
The interference phenomenon of thermo-acoustic waves due to the variation of density is visualized by a Mach–Zehnder interferometer. The interferometer is equipped with a He-Ne laser with about 10-mW output, a beam expander, a beam splitter, a reflection mirror, and concave and convex lenses, as shown in
Figure 2. This device measures the distribution of the density or temperature. The fundamental principle relies on the distinction between the refractive indices from the result of the interference between two laser beams separated by a half-silvered mirror, one passing to the test space and the other acting as a reference beam. The fringe shift between them is utilized to determine the density or temperature distributions.
The operating sequence of the apparatus is as follows. First, the beam emitted from a He-Ne laser is diffused after passing through an objective lens and a space filter of 10-µm depth. The beam is separated into two parallel beams by a beam splitter. The two beams are recombined after they pass through different paths, which have different densities. At this time, the interference phenomenon, which occurs due to the difference in wavelength, can show an interference fringe in the wall. This fringe is used to analyze the flow field.
A high-speed camera (HG 2000, Kodak) which is capable of operating at 2000 frames per second is used to visualize the test section. For simultaneous operation with a rapid heating switch and a data measuring instrument, a pulse generator and trigger system are made using a J-K flip-flop chip. A part of the saved image is selected to evaluate and analyze the fringes.
2.2. Experimental Methodologies
The experimental setup for this study had various devices to check the interference. Thus, controlling the sensitivity of these devices is very important to secure the reliability of the results. The measuring process of the thermo-acoustic wave is established to the preliminary experimental study, the main aim of which is to evaluate the data reproduction and processing.
Before the main experiment, charging and discharging devices, trigger systems, the measuring device, and the high-speed camera needed to be calibrated to ensure their reliability. Then, the test specimen of this experiment, the nickel sheet, was produced in various sizes. A thermocouple (0.127 mm, K-type, Omega) was fixed on the surface to measure the temperature of the specimen via the electric arc welding method. The left and right sides of the specimen were compressed by bus bars, which were connected to the circuit for rapid heating.
The capacitor was charged to a set voltage, and the various values of the charging voltage, such as 16 V, 19 V, and 21 V, etc., were measured using the multi-meter. The reliability of the capacitor under continuous charging and discharging was estimated in a sample test according to the various temperature values from 300 to 500 °C [
31].
A Mach–Zehnder interferometer and high-speed camera were prepared for measurements. The pulse generator acts as a trigger which allows each device to operate simultaneously. The temperature distribution and visualization image data were automatically measured for about 0.3 s. After one experiment, performed in an open or closed space with the specimen, the conditions of the experiment were reset, and the experiment was repeatedly carried out in order to check the reproducibility of these experiments. Actually, there were some uncertainties about these experiments. The uncertainty in this study could be divided into operational aspects of the experimental equipment and errors in data processing. In terms of the operation of the experimental equipment, there were the dimensions of production of the specimens, the precision of the charging voltage, etc., the misalignment of the experimental equipment, and the inherent error of the measurement equipment. In addition, the errors in data processing occur mainly in the process of measuring the deformation distance of the finite pattern line to calculate the Nusselt number.
3. Results and Discussion
Experiments were performed to confirm the generation and propagation of the thermo-acoustic waves from a nickel sheet in an R–C rapid heating circuit.
Figure 3 shows the trial process to find the testing sheet temperature and thickness of it, generating the Mach number (
Ma) with various charging voltages. This confirmed that the Mach number had the value of 0.99, which comes close to the value of 1, as in the case of E
c = 19 V [
31]. We performed the experimental works to confirm the effects of charging voltages based on the value of charging voltage at 19 V.
Figure 3a shows the thickness effects of the specimen with various values of temperature, as in the case of continuously discharging energy by a 68,000 µF capacitor with a charging voltage of E
c = 21 V. For the specimen thicknesses of δ = 0.0125 mm and δ = 0.01 mm, the maximum temperature values were obtained as 142 °C and 185 °C, with acquisition times of 0.35 s and 0.065 s, respectively. The effects of the discharging energy on the temperature distribution of the specimen with δ = 0.0075 mm thickness are shown in
Figure 3b. The maximum temperature values were found to be about 257 °C, 362 °C, and 475 °C when the discharging voltages of the capacitor were E
d = 16 V, 19 V, and 21 V, respectively [
31].
Infinite fringes of the interference phenomena in the upper part of a heating surface of the nickel sheet are shown in
Figure 4. A Mach–Zehnder interferometer and high-speed digital camera were used to visualize the interference phenomena. In order to elucidate the effects of charging energies, the charging voltages of the capacity were set to E
c = 17 V, 19 V, and 21 V, in order to check the interference phenomena with various charging energies based on the value of
Ma = 1. The maximum temperatures of 296 °C, 378 °C, and 480 °C, corresponding to each discharging voltage, respectively, were reached in about 0.05 s.
At the beginning of heating, conduction or radiation heat transfer were expected from the rapid heating and cooling of fluid, which makes contact with the heated wall. It was verified from the results that the distance between the isothermal line and the nickel sheet was shorter than 0.5 mm. Then, the distance between them gradually increased because of the expansion of the fluid. The cutting line of the infinite fringes appeared at 0.01 s and then disappeared after about 0.001 s. This is because the thermo-acoustic wave generated by the fluid heating source dissipated. Therefore, the heating energy and time required to reach the maximum temperature are important factors in the generation of thermally powerful acoustic waves. For generating the thermo-acoustic waves, rapid heating should be supplied within 0.01–0.03 s, and sufficient energy is needed to grow and propagate the thermo-acoustic waves.
The isothermal lines that occurred at the beginning of heating are disturbed at a certain time.
Figure 4c shows that the largest heating energy occurs at about 0.008 s. In
Figure 4a,b, the largest heating energy occurs at about 0.12–0.14 s and 0.1 s, respectively. The occurrence of these disturbance phenomena is considered a critical point from which the natural convection originates. The critical point of the nickel sheet is shortened by about two times relative to that of a stainless steel sheet, despite having a five to eight times lower heating energy. However, in order to observe visual outputs such as shock waves, it is necessary that the maximum temperature be reached within 0.015–0.023 s.
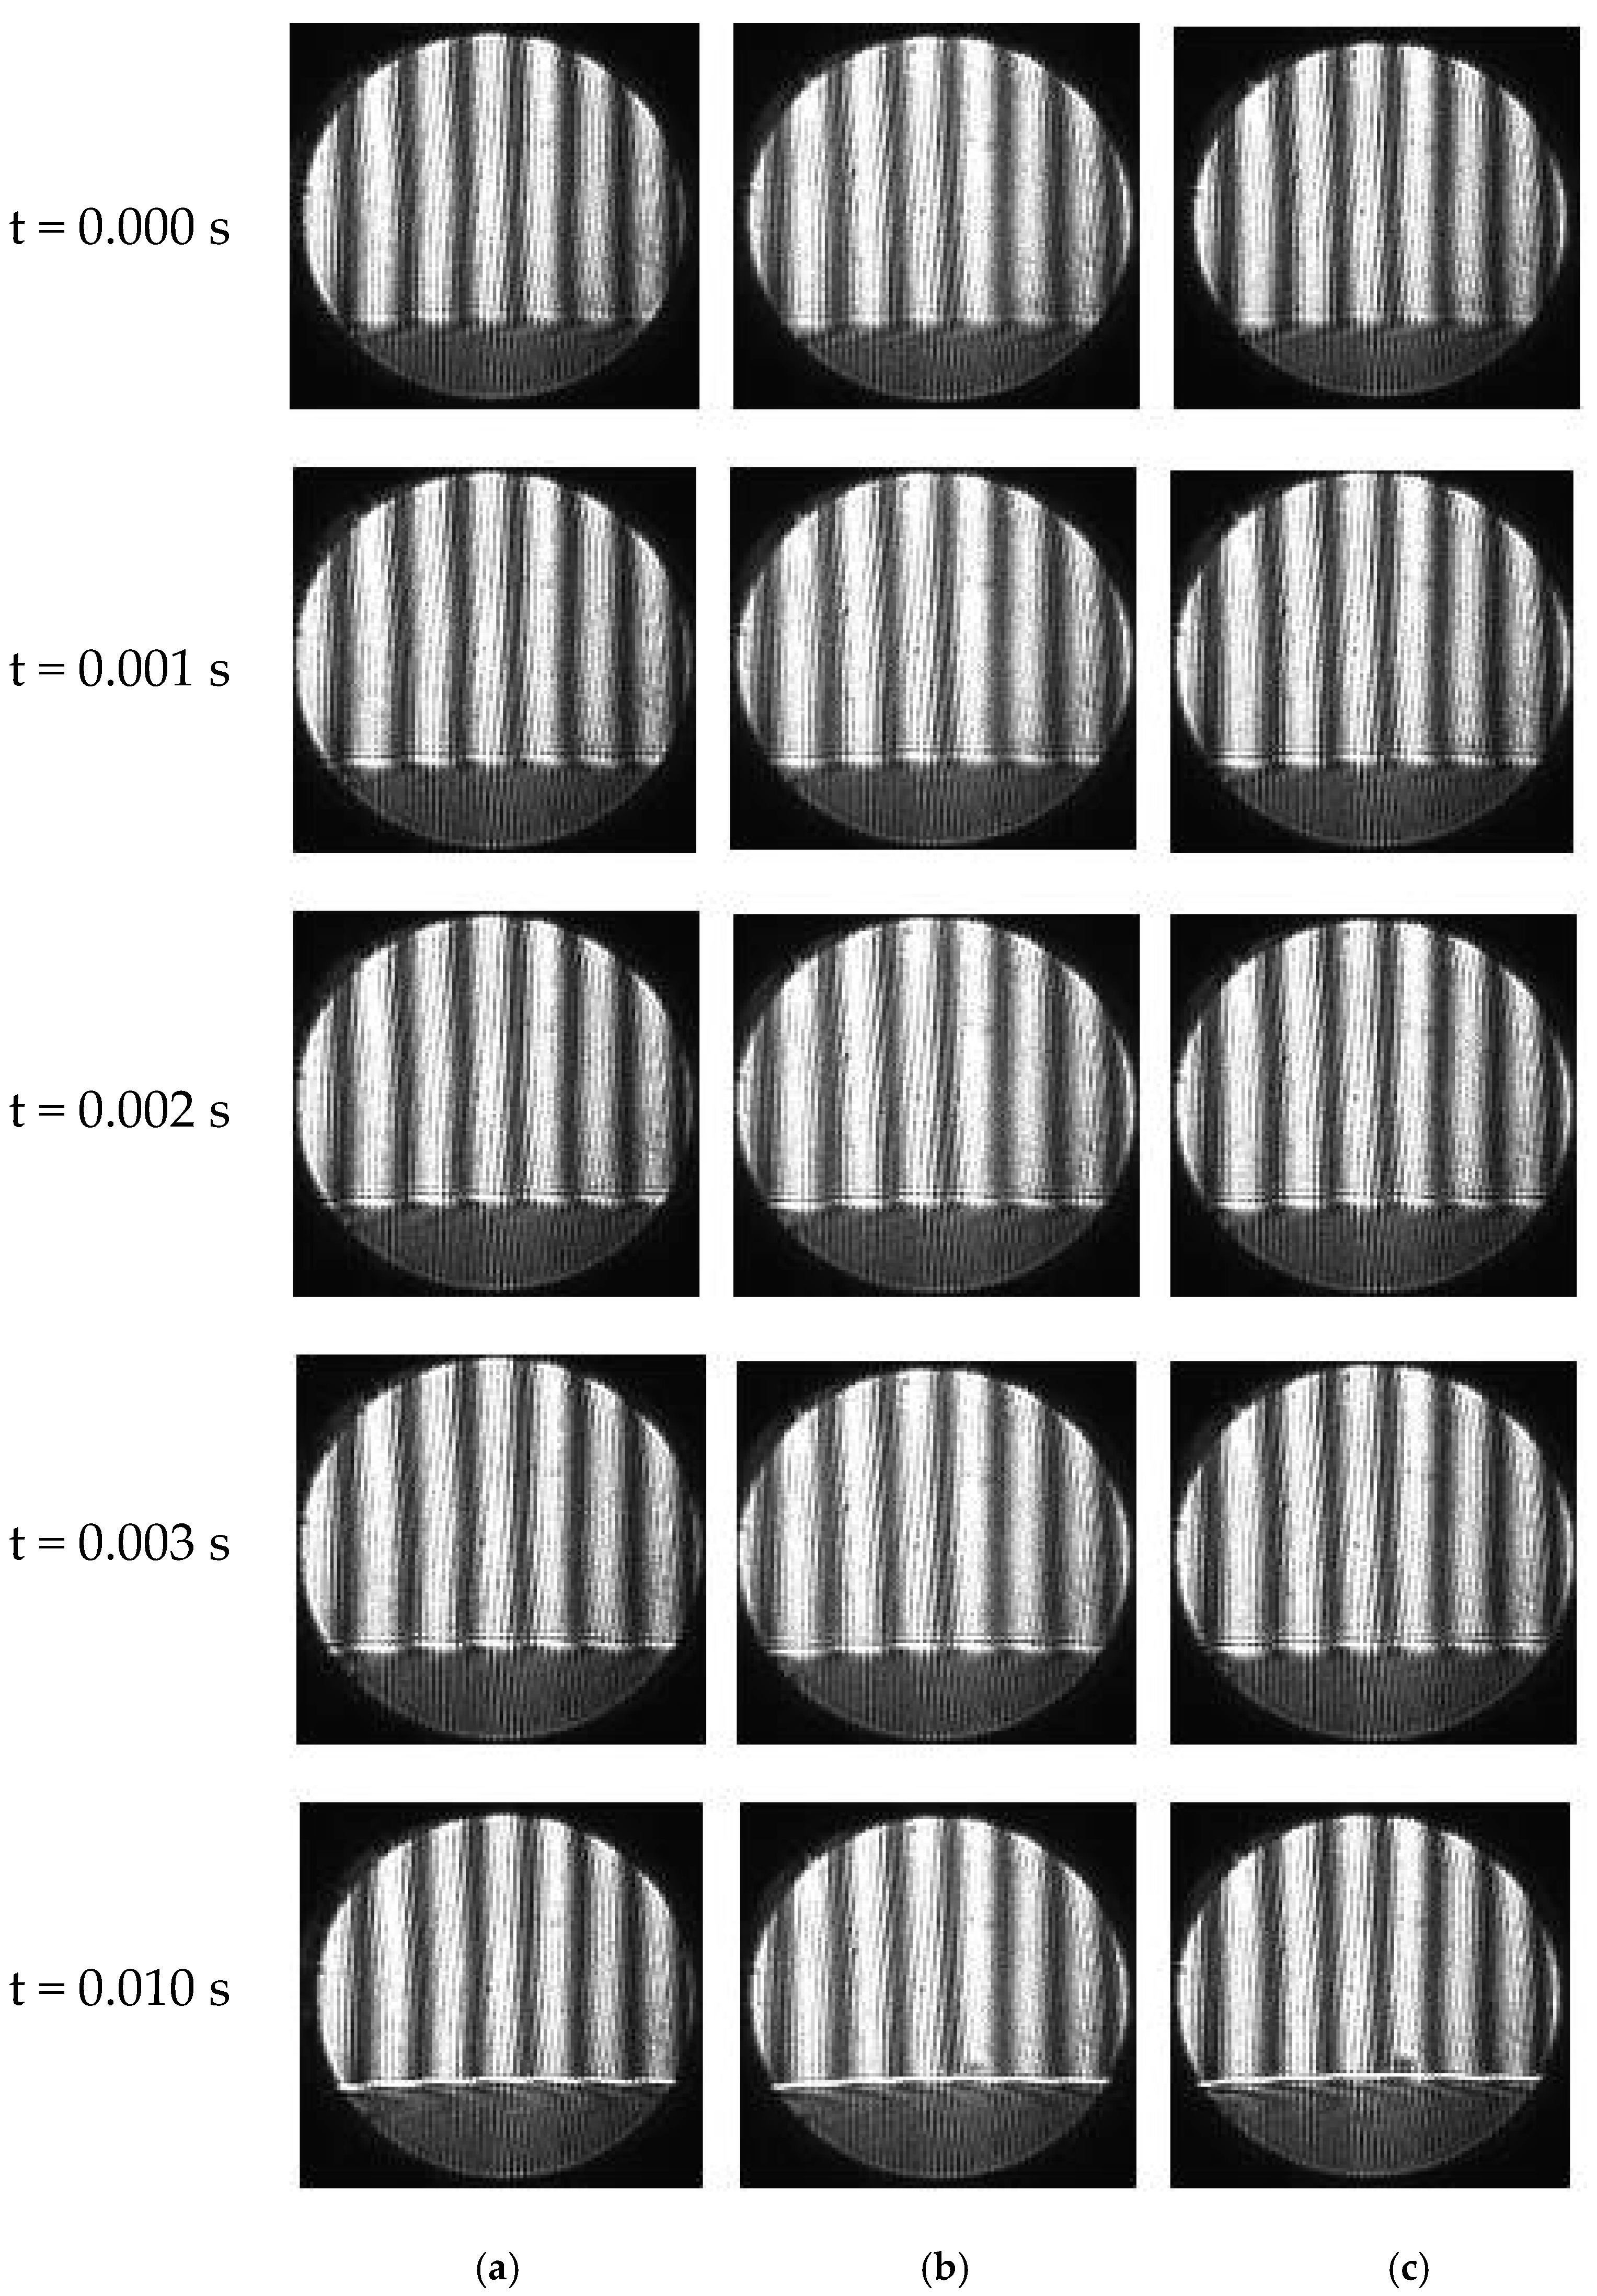
The displacements of finite fringes are shown in
Figure 5. Finite fringes were set perpendicularly on the upper part of the δ = 0.0075 mm thick nickel sheet. The heating conditions were the same as in
Figure 4. The heating phenomena were observed before 0.001–0.002 s for the heating conditions. At about 0.01 s, a cutting line that interrupted the finite fringes could be observed near the upper part of the nickel sheet, but it was extinguished immediately. This displacement was dependent on the surface temperature of the sheet, and it plays a leading part in understanding the characteristics of the heat transfer of the fluid near the metal sheet. Before 0.015 s, it was difficult to distinguish the critical point of the displacements. As time proceeded, however, the critical point could be observed. It could be distinguished with the naked eye that these local displacements varied according to the discharging energy. The displacement lines formed at the beginning of heating were disturbed at a certain time. The occurrence of these disturbance phenomena is considered as a critical point from which the natural convection originates, like in
Figure 4.
The local Nusselt number can be obtained in order to estimate the heat transfer characteristics in the heating wall by measuring local values of the interval between the order of interference (
Sw) and the finite pattern, using the following equations:
where
H is the local height, and
Tw and
T∞ are the wall temperature and the surround temperature, respectively.
λ denotes the wavelength of the He-Ne laser source, which is 632.8 nm, and l
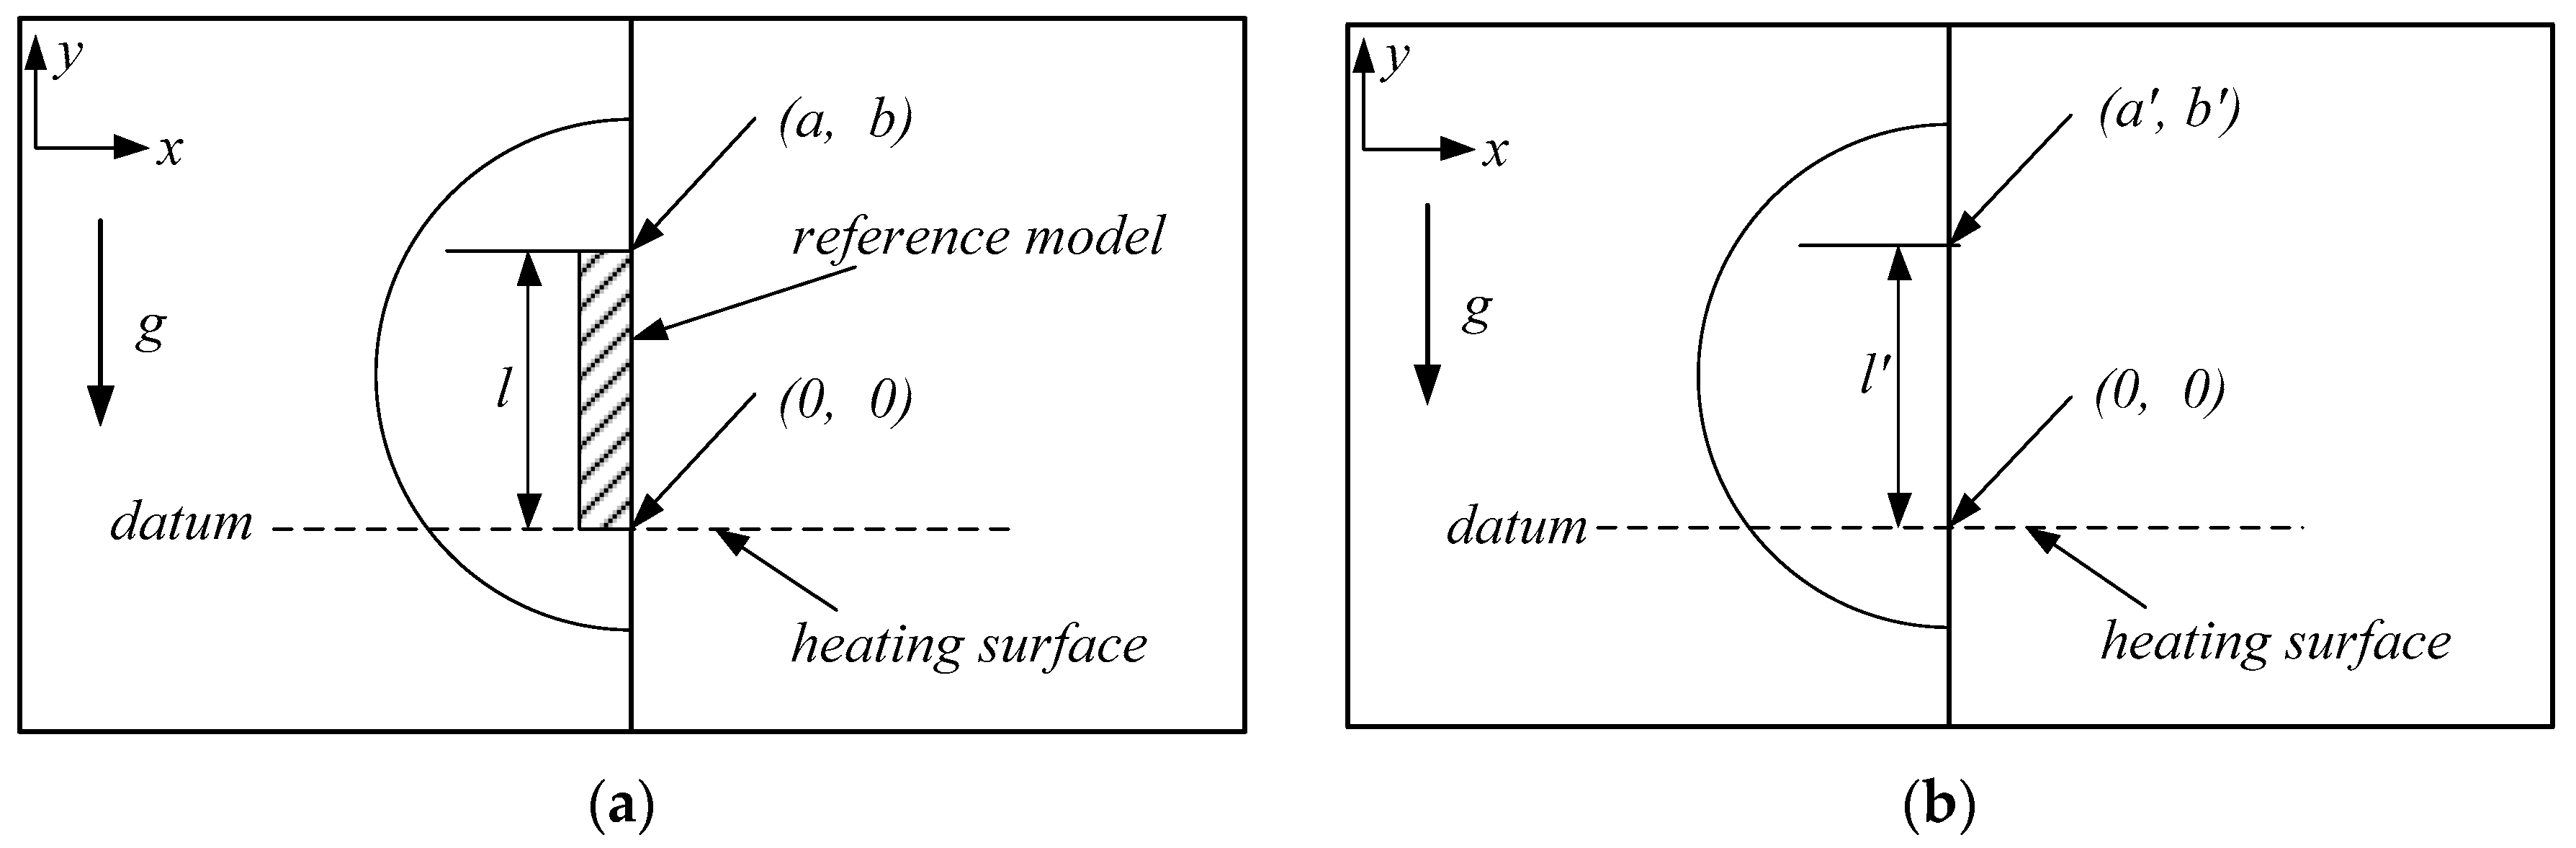
z is the measured specimen length along the direction of light. The modified position and spacing of the patterns can be determined by measuring the pixel coordinates, as shown in
Figure 6. The relevant values can be converted into actual dimensions or positions using Equation (3):
The variations of the local Nusselt numbers for different nickel sheet thicknesses and heating energies are shown in
Figure 7,
Figure 8 and
Figure 9. As the thickness of the testing sheet increased, the total heat capacity increased accordingly. Therefore, a high charging voltage must be applied to ensure the temperature of the shock wave on the plate. The local Nusselt number distributions for the case of rapidly heated δ = 0.0125 mm nickel sheet are shown in
Figure 7. It was difficult to distinguish the exact deformed location in the finite patterns obtained until 0.015 s. This difficulty was caused by the natural convection generated due to buoyancy effects, which resulted from the relatively long time of 0.35 s to reach the maximum temperature, unlike with the initial expansion and compression and heat transfer by conduction. The local Nusselt number was decreased by increasing the charging voltage, indicating a dependence on the discharge energy.
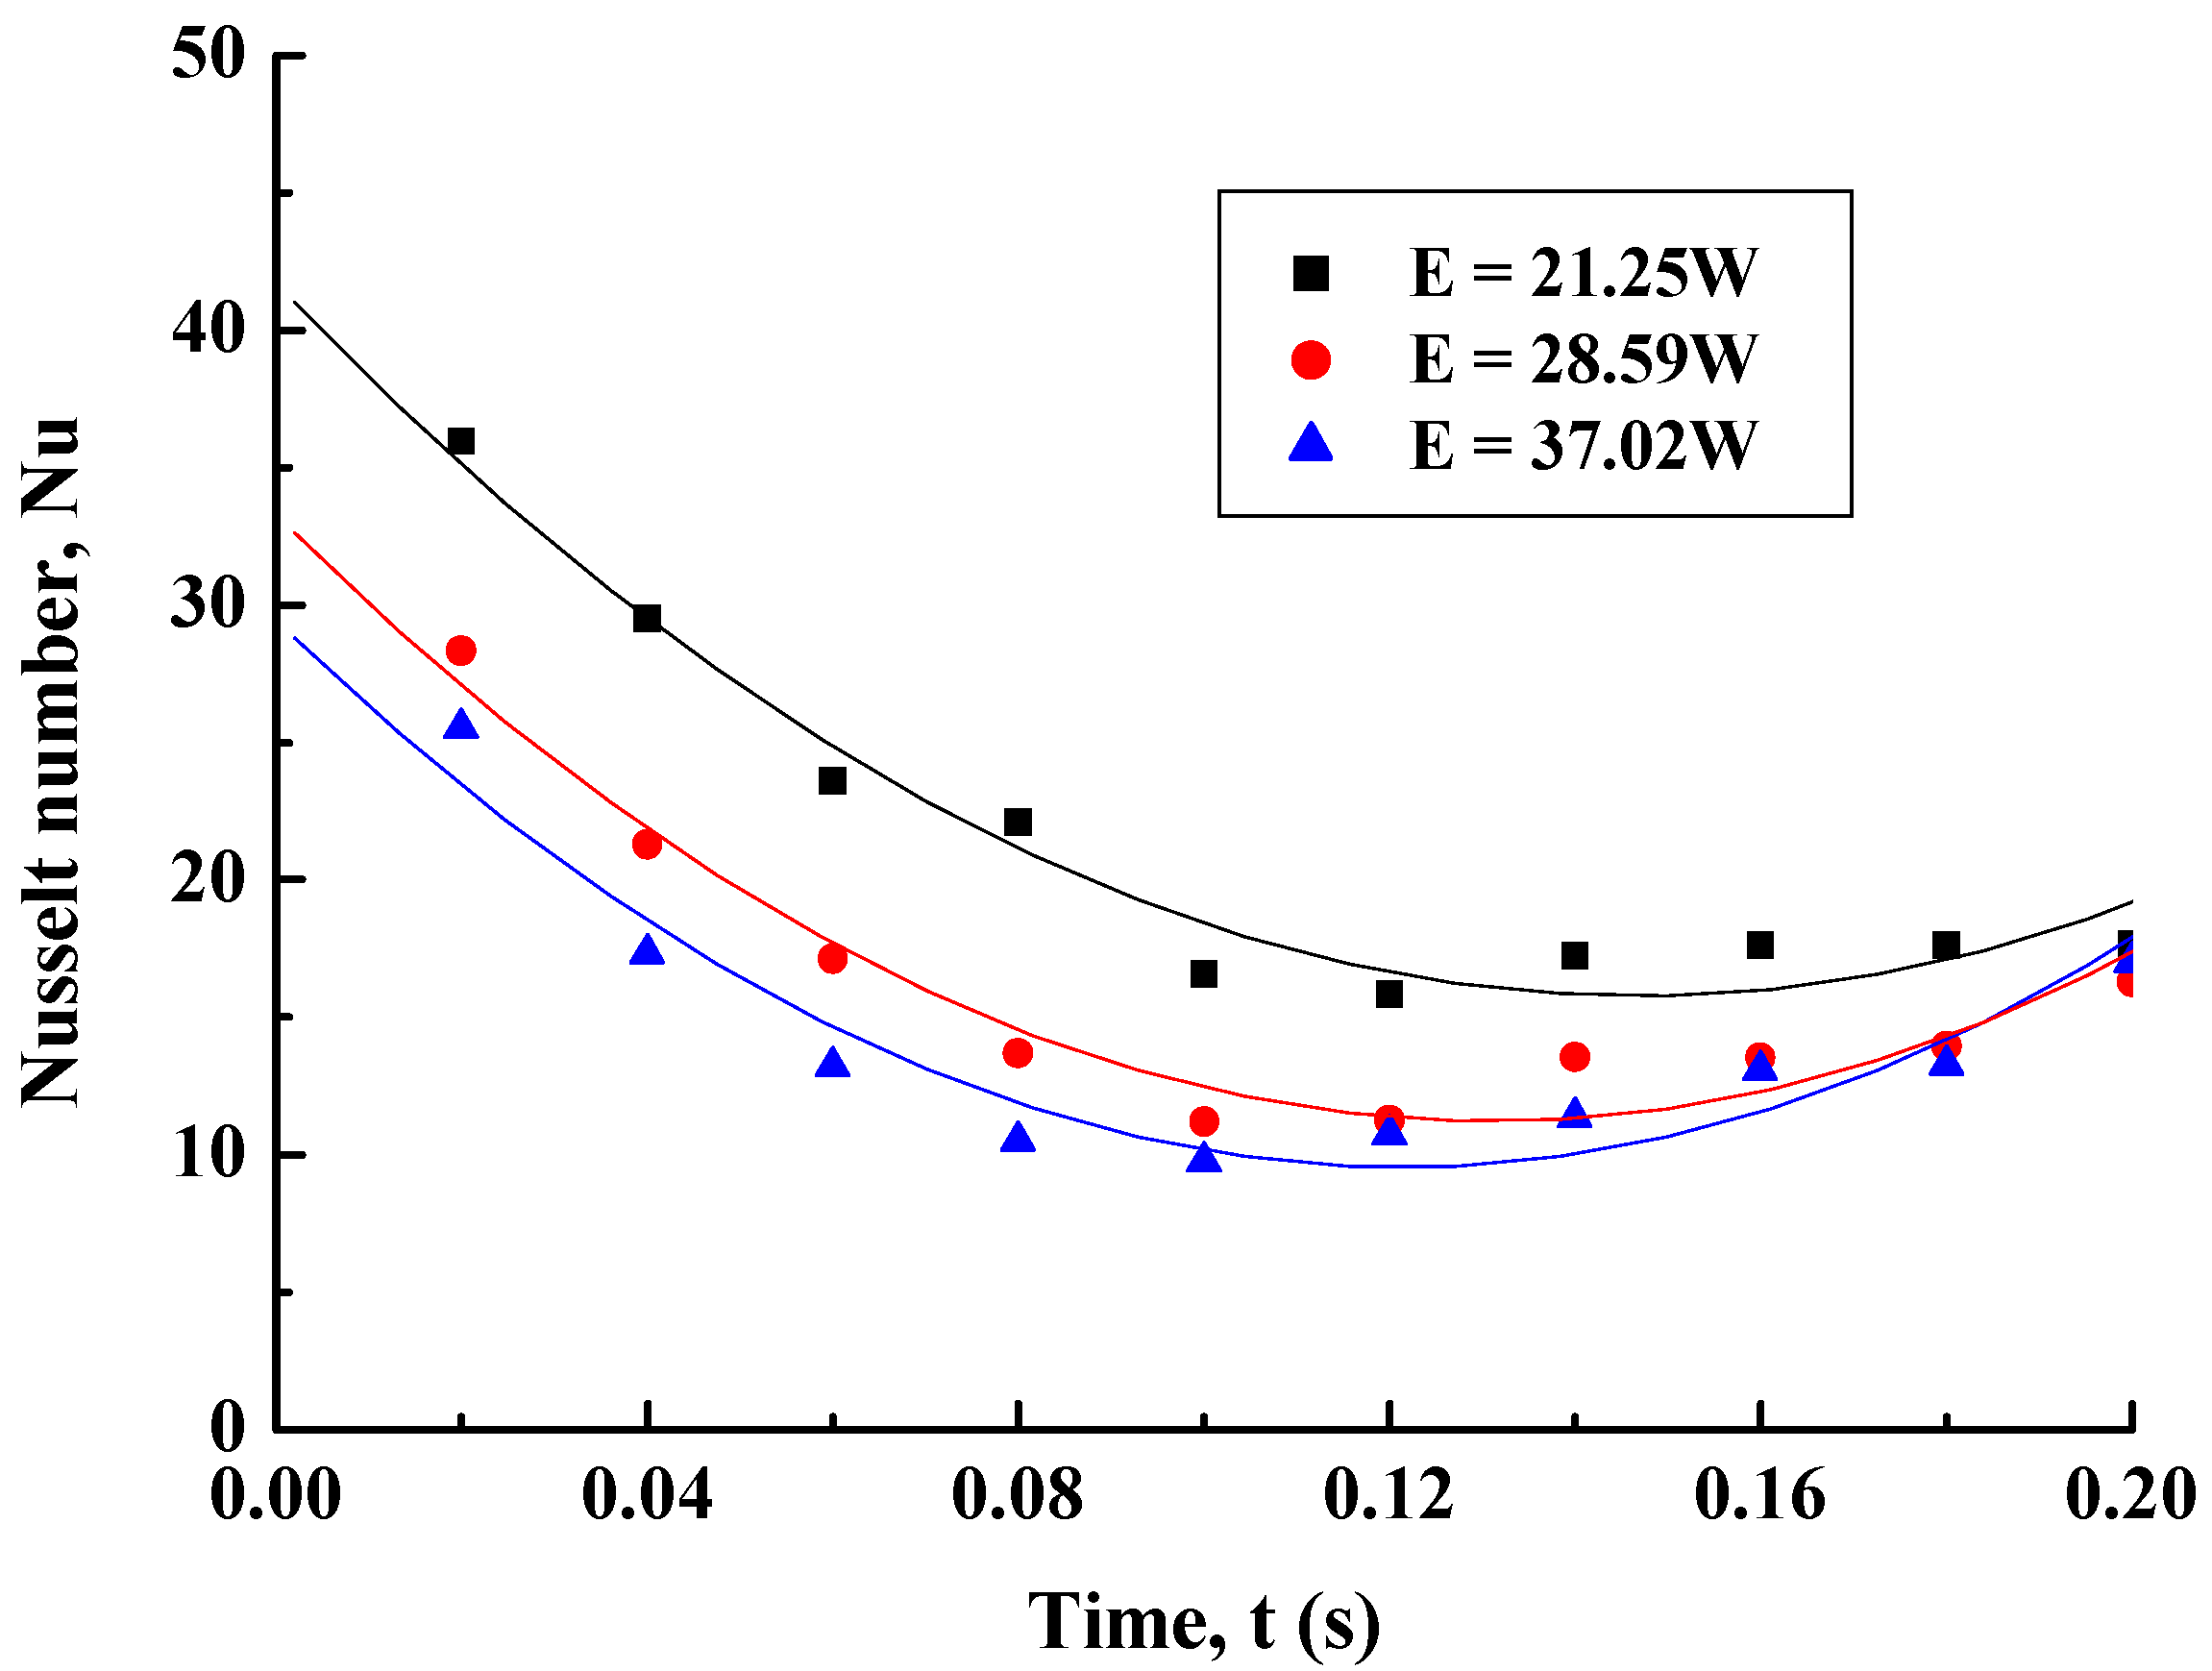
For heating energies of E = 21.25 W, 28.59 W, and 37.02 W, equivalent to the charging voltage values of 25 V, 29 V, and 33 V, respectively, the maximum temperatures reached 137 °C, 280 °C, and 520 °C. The results also showed that at around 0.2 s, the local Nusselt number tended to increase and converge. This might have resulted from the increase in convective heat transfer due to buoyancy, according to the long time required to reach the highest temperature and the lack of cooling rate caused by the heat capacity of the material.
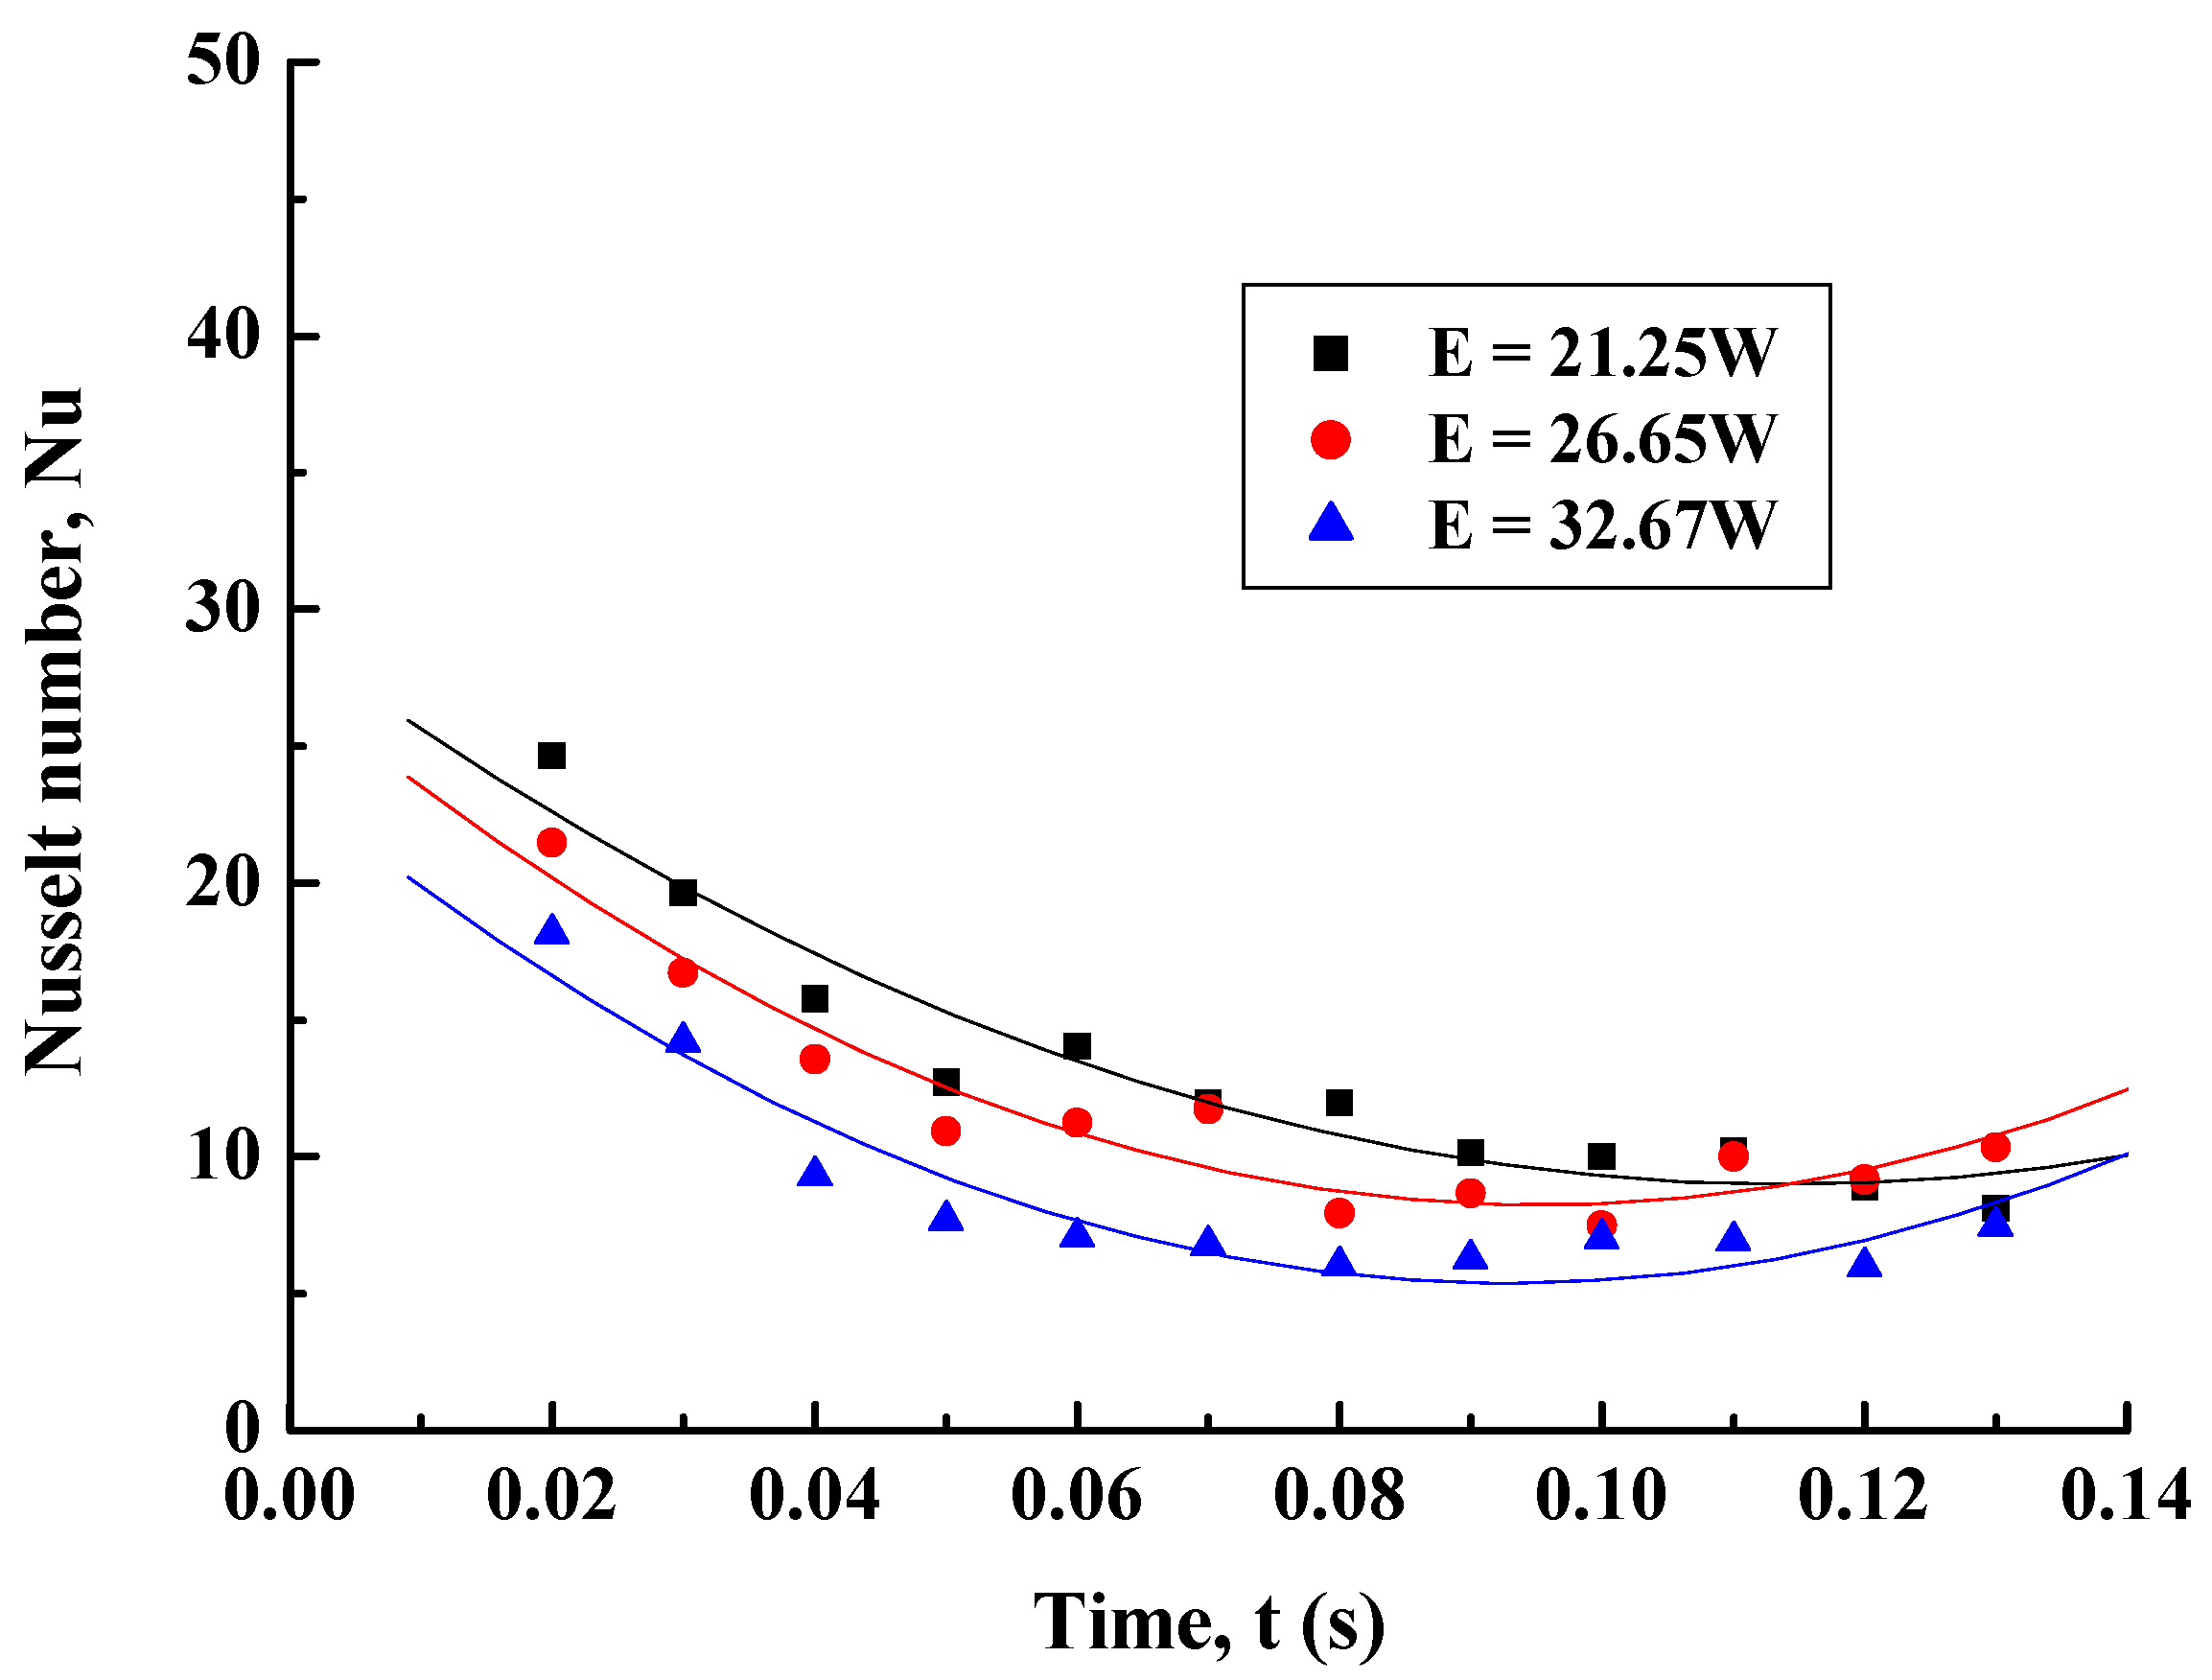
Figure 8 shows the case of the δ = 0.01-mm-thick nickel sheet. As the heating energy was varied to E = 21.25 W, 26.65 W, and 32.67 W, corresponding to charging voltage values of 25 V, 28 V, and 31 V, respectively, the maximum temperatures reached 290 °C, 390 °C, and 490 °C. The local Nusselt number tended to decrease initially and then increase slightly after 0.12 s, since the time to reach the peak temperature and cooling characteristics still affected the partial increase in the convective heat transfer, as is shown in the numerical results in
Figure 3a.
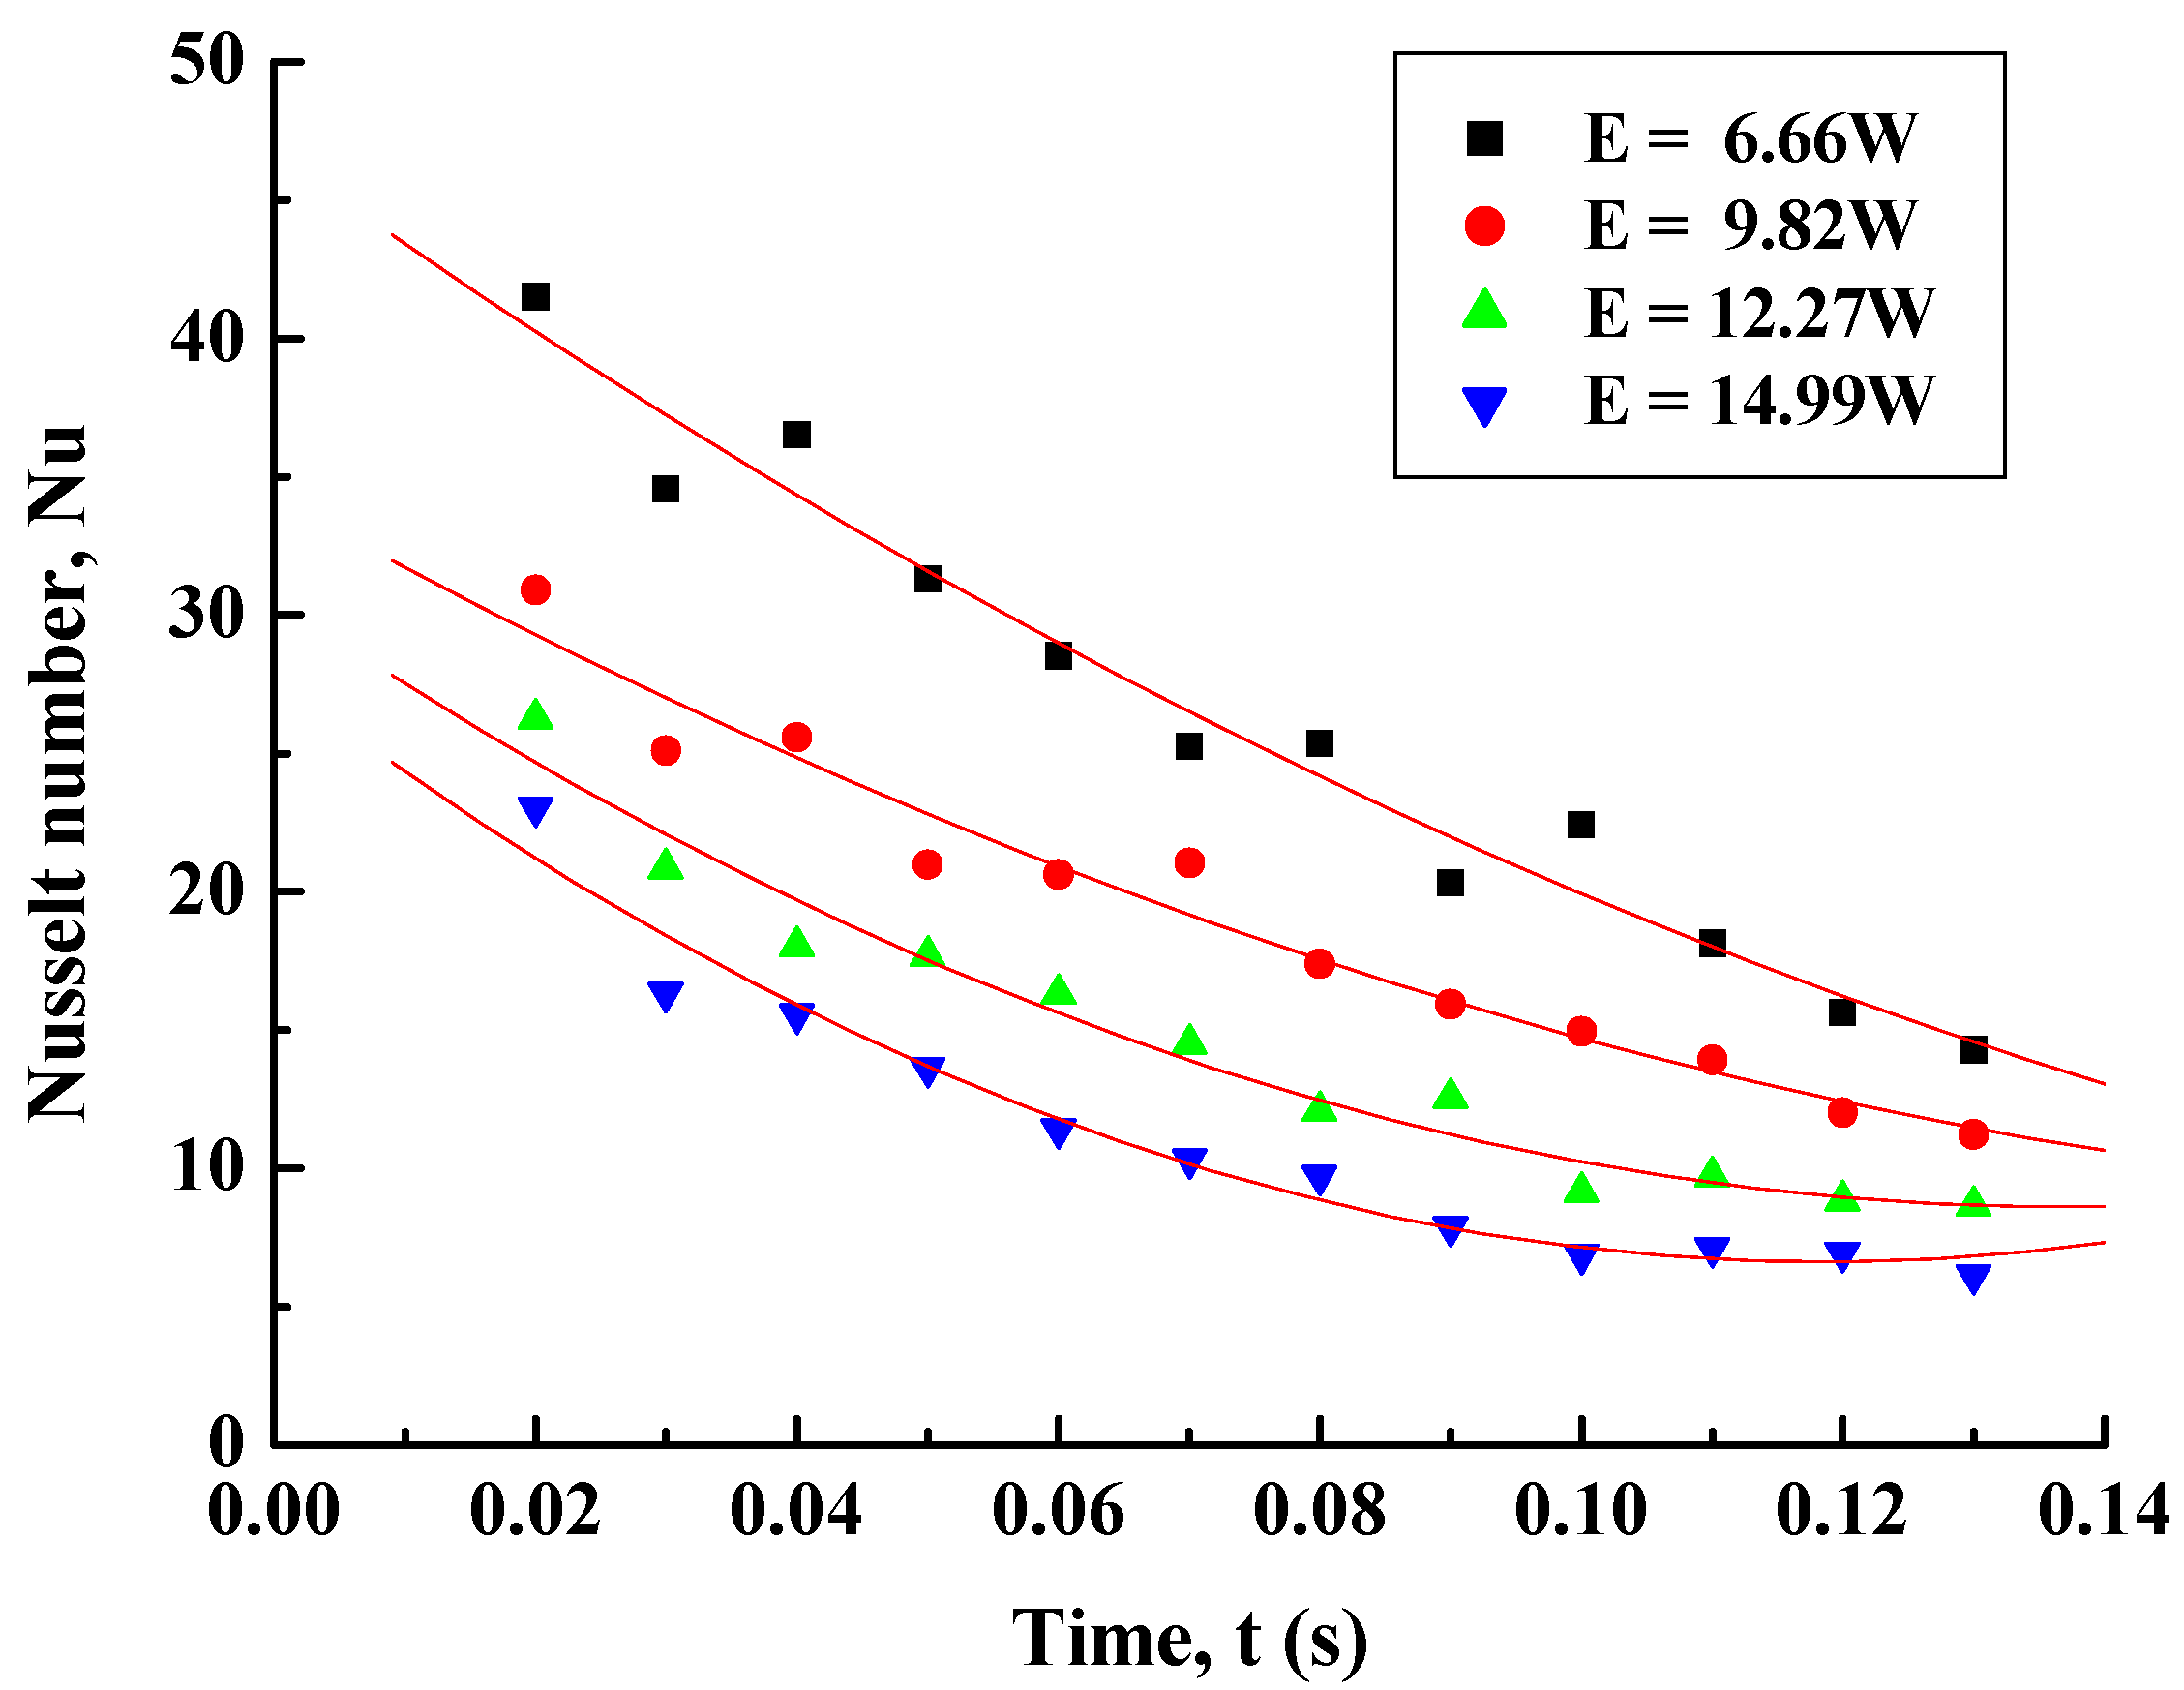
Figure 9 presents the local Nusselt number variations for the case of δ = 0.0075-mm-thick nickel sheet. The maximum temperature reached 204 °C, 296 °C, 378 °C, and 480 °C for the heating energies of E = 6.66 W, 9.82 W, 12.27 W, and 14.99 W, which are equivalent to the charging voltage values of 14 V, 17 V, 19 V, and 33 V, respectively. As time passed, the local Nusselt number tended to vary as a quadratic function. In addition, it tended to decrease due to increases in the heating energy in the same way as in the prior cases of
Figure 7 and
Figure 8, compared to the relatively large values of the local Nusselt numbers that were found in the case of
Figure 9. This is because of the different heating energy per unit volume, caused by differences in the thickness of the nickel sheet and the temperature rise.
The local Nusselt number can be expressed as a quadratic Equation (4) with respect to time, as follows:
The coefficients A, B, and C are described in
Table 3.


