Article

Analysis of Carbon Dioxide Concentration Prediction Model and Diffusion Tendency of Expiratory by Simultaneous Multipoint Sensing

1
Graduate School of Media and Governance, Keio University, Fujisawa-shi 252-0882, Kanagawa, Japan
2
Faculty of Data Science, Musashino University, Nishi-tokyo-shi, Tokyo 202-8585, Japan
3
YUKI Precision Co., Ltd., Yokohama-shi 222-0033, Kanagawa, Japan
4
Kankyo Research Co., Ltd., Hachioji-shi, Tokyo 192-0054, Japan
*
Author to whom correspondence should be addressed.
Appl. Sci. 2020, 10(13), 4631; https://doi.org/10.3390/app10134631
Submission received: 28 May 2020 / Revised: 29 June 2020 / Accepted: 2 July 2020 / Published: 4 July 2020

Abstract

:
Recent indoor air quality studies show that even 1000 parts per million (ppm) concentration of Carbon Dioxide (CO2) has an adverse effect on human intellectual activities. Therefore, it is required to keep the CO 2 concentration below a certain value in a room. In this study, in order to analyze the diffusion tendency of carbon dioxide by breathing, we constructed a simultaneous multi-point sensing system equipped with a carbon dioxide concentration sensor to measure indoor environment. Furthermore, it was evaluated whether the prediction model can be effectively used by comparing the prediction value by the model and the actually measured value from the sensor. The experimental results showed that CO 2 by exhaled breathing diffuses evenly throughout the room regardless of the sensor’s relative positions to the human test subjects. The existing model is sufficiently accurate in a room which has above at least a 0.67 cycle/h ventilation cycle. However, there is a large gap between the measured and the model’s predicted values in a room with a low ventilation cycle, and that suggests a measurement with a sensor still is necessary to precisely monitor the indoor air quality.

1. Introduction

With the spread and development of the Internet of Things (IoT), highly accurate and compact sensor devices for environmental measurement have been developed and can be used in a variety of situations. These sensor devices are used not only for specific facilities, but also for measuring and adjusting the environment of places where people normally live, such as smart homes and smart offices [1,2]. By quantifying the state of the environment with these sensor devices, it has become possible to objectively evaluate changes in the environment that cannot be captured by human senses. However, there are many factors that should be evaluated in a person’s living environment, and it is difficult to manage all of them [3], such as tobacco smoking and ambient particulate matter pollution. Therefore, it is necessary to identify and control the factors that may exist in any living environment to support people’s lives. In this study, we focus on the concentration of carbon dioxide (CO 2 ) in a room. Since CO 2 is generated and accumulated by human activity, it is necessary to prevent a decrease in the quality of human intellectual activity due to an increase in CO 2 concentration [4]. Furthermore, according to the study by U. Satish et al. [5], it is considered to be “Relative to 600 ppm (parts per million), at 1000 ppm CO 2 , moderate and statistically significant decrements occurred in six of nine scales of decision-making performance.” Thus, even concentrations as low as 1000 ppm have been shown to have an adverse effect on human decision-making. For this purpose, it is necessary to predict the change in CO 2 concentration and control it so that the concentration in the room is below constant. In order to maintain the quality of intellectual activity in human interaction in a room, we analyze the diffusion tendency of CO 2 in exhaled air and investigate a model to predict CO 2 concentration. Specifically, in this study, we measured and analyzed how CO 2 diffused in a low concentration zone, which had not been noticed until now, by simultaneous multipoint sensing. In addition, we selected a prediction model from the experimental results and compared the prediction model of CO 2 concentration in the existing room with the measurement device in the actual room in three different sized rooms on the same basement level of the same building, and verified whether the existing prediction model is applicable to the measurement method using the measurement device.

2. Related Research

The measurement of CO 2 concentration has been around for a long time, even before the development of sensor technology, and the measurement of CO 2 using plants was reported as far back as 1990 [6]. CO 2 concentration is also used as a measure of focus, and it has been reported that there is a correlation between CO 2 concentration, the discomfort index and the number of blinks, which is a measure of ability to concentrate [7]. In recent years, with the development of the IoT, CO 2 concentration sensors have become smaller and smaller, and they are used as devices for environmental measurement such as forest fires [8]. These sensor devices equipped with CO 2 concentration sensors and gas sensors are installed on the university campus to verify the air quality [9]. Similar to the present study, Piotr Batoga et al. [10] reported a study in which the concentration was measured using simultaneous multipoint sensing to predict the CO 2 concentration. In this report, the CO 2 concentration in the bedroom during sleep was predicted to be about 150 ppm by using a Computational Fluid Dynamics (CFD) simulation, but as a result of measuring the CO 2 concentration by using a CO 2 concentration sensor, the CO 2 concentration exceeded 3000 ppm. The CO 2 concentration in the ambient air was about 400 ppm, indicating that the CO 2 concentration in the bedroom was more than 7 times higher than the outside air. Therefore, simulation like CFD is not always effective, so it is necessary to make actual measurements using a measurement device.

3. System Overview

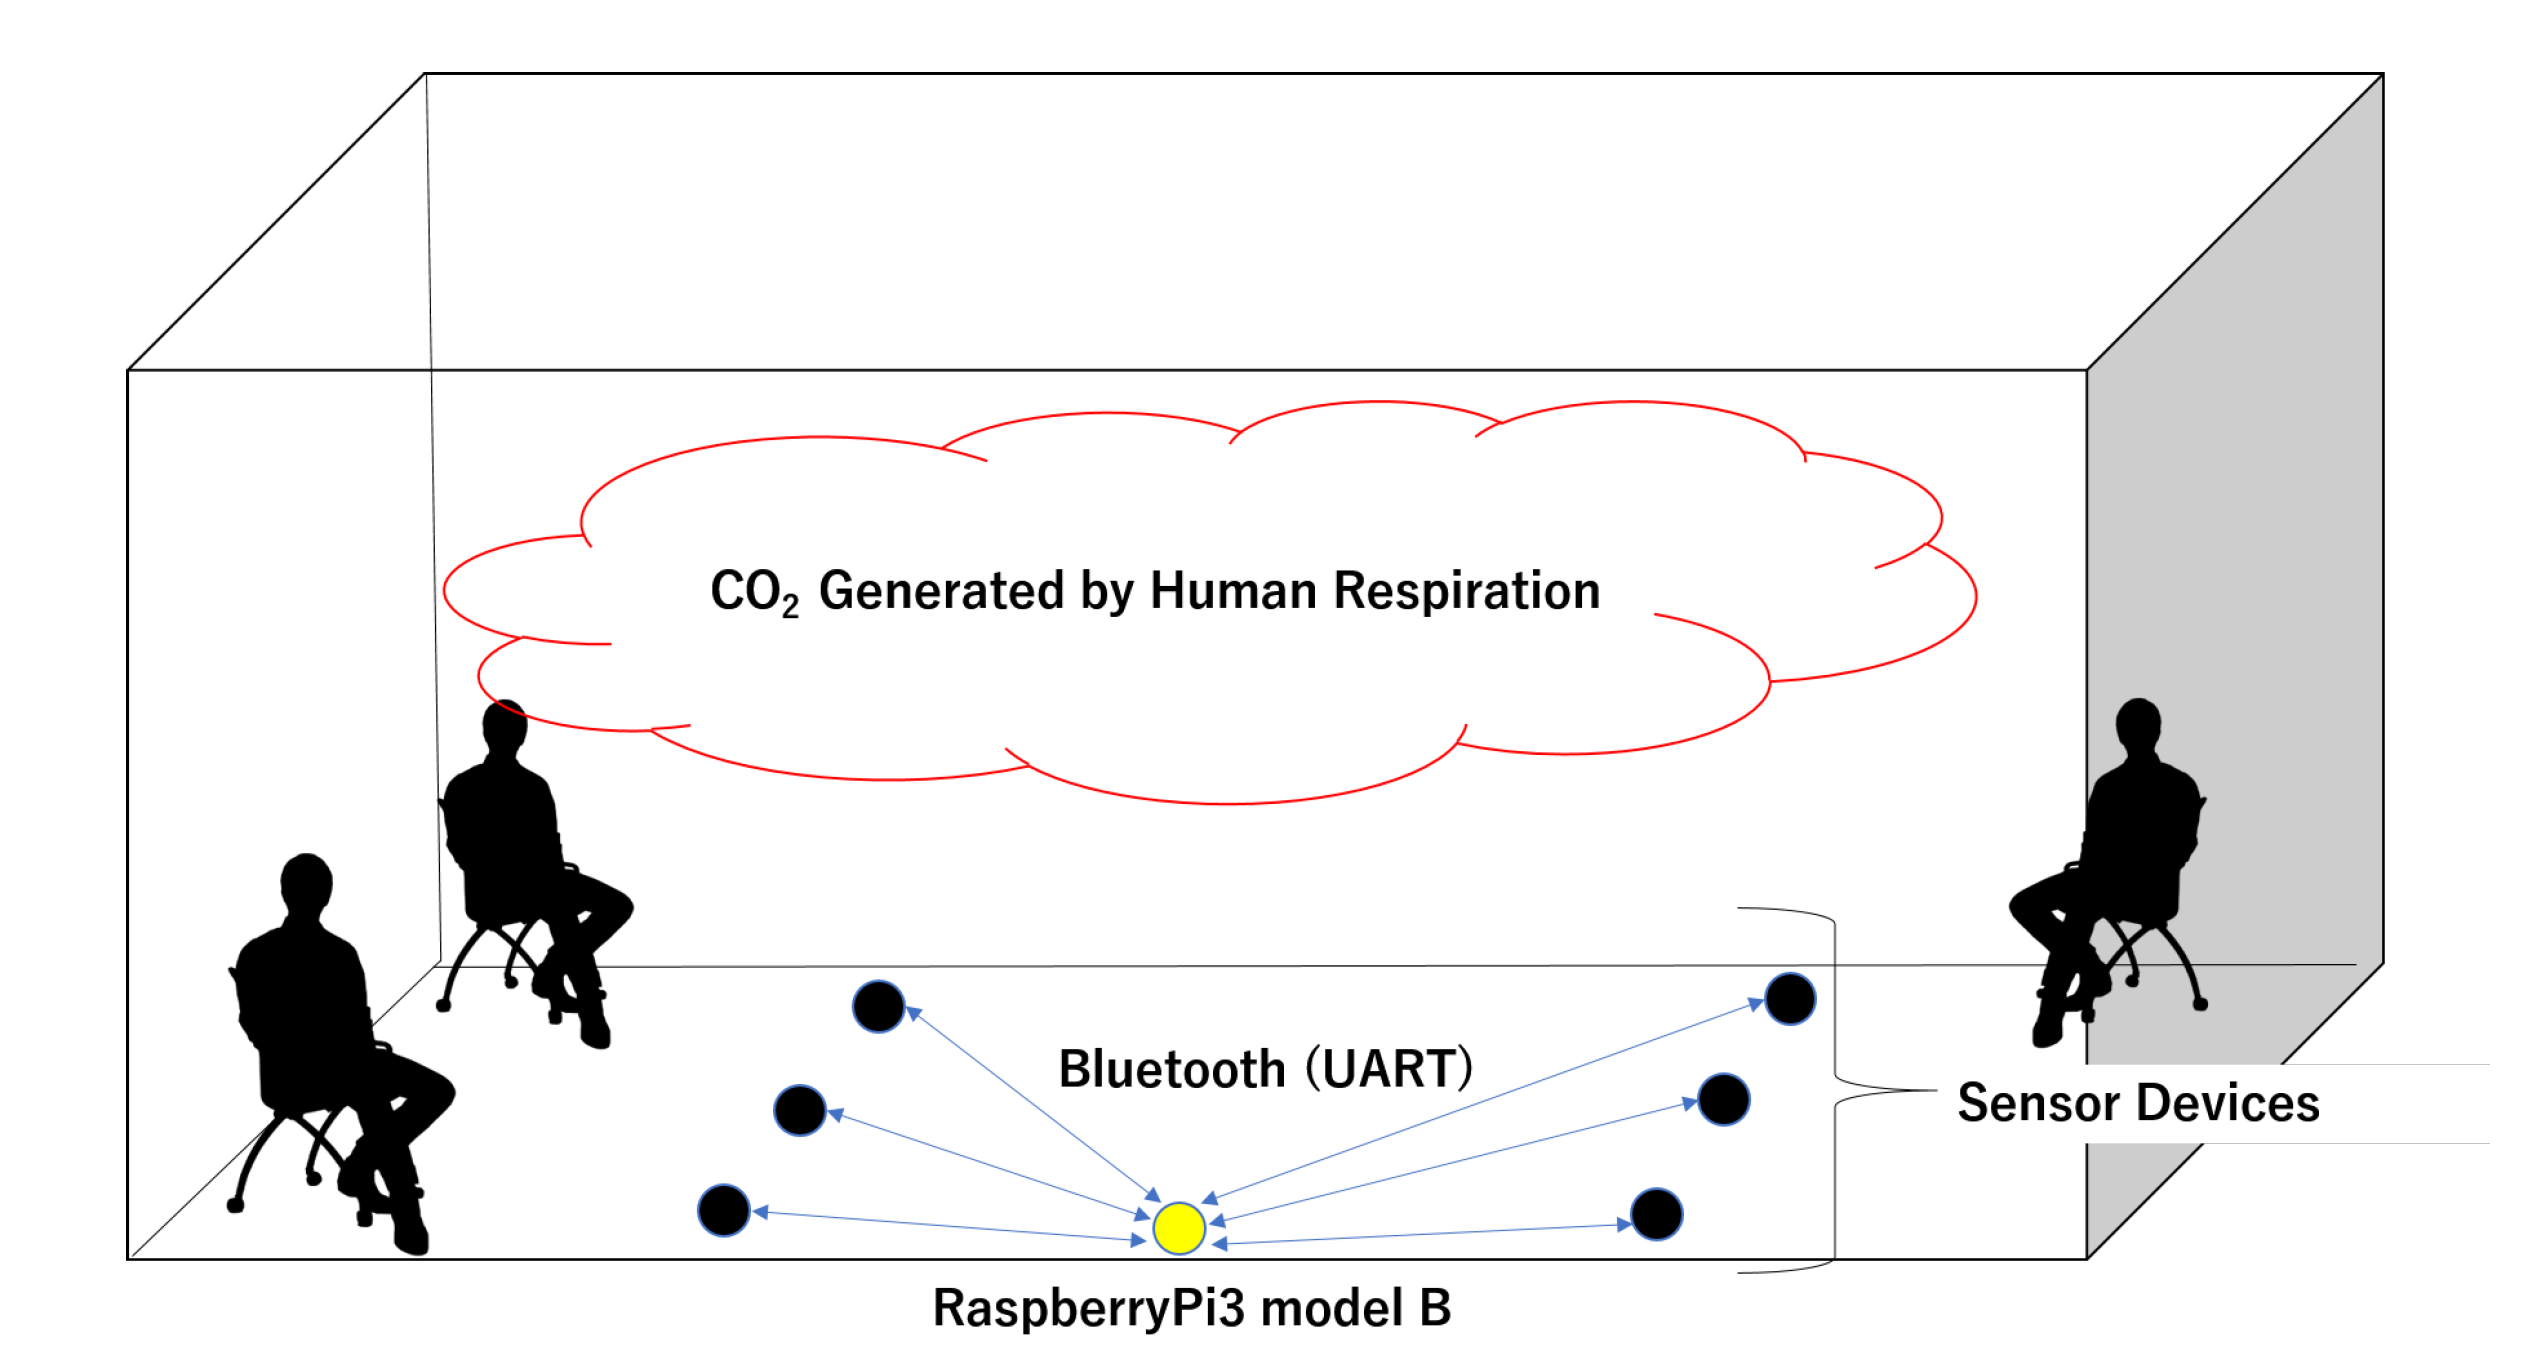
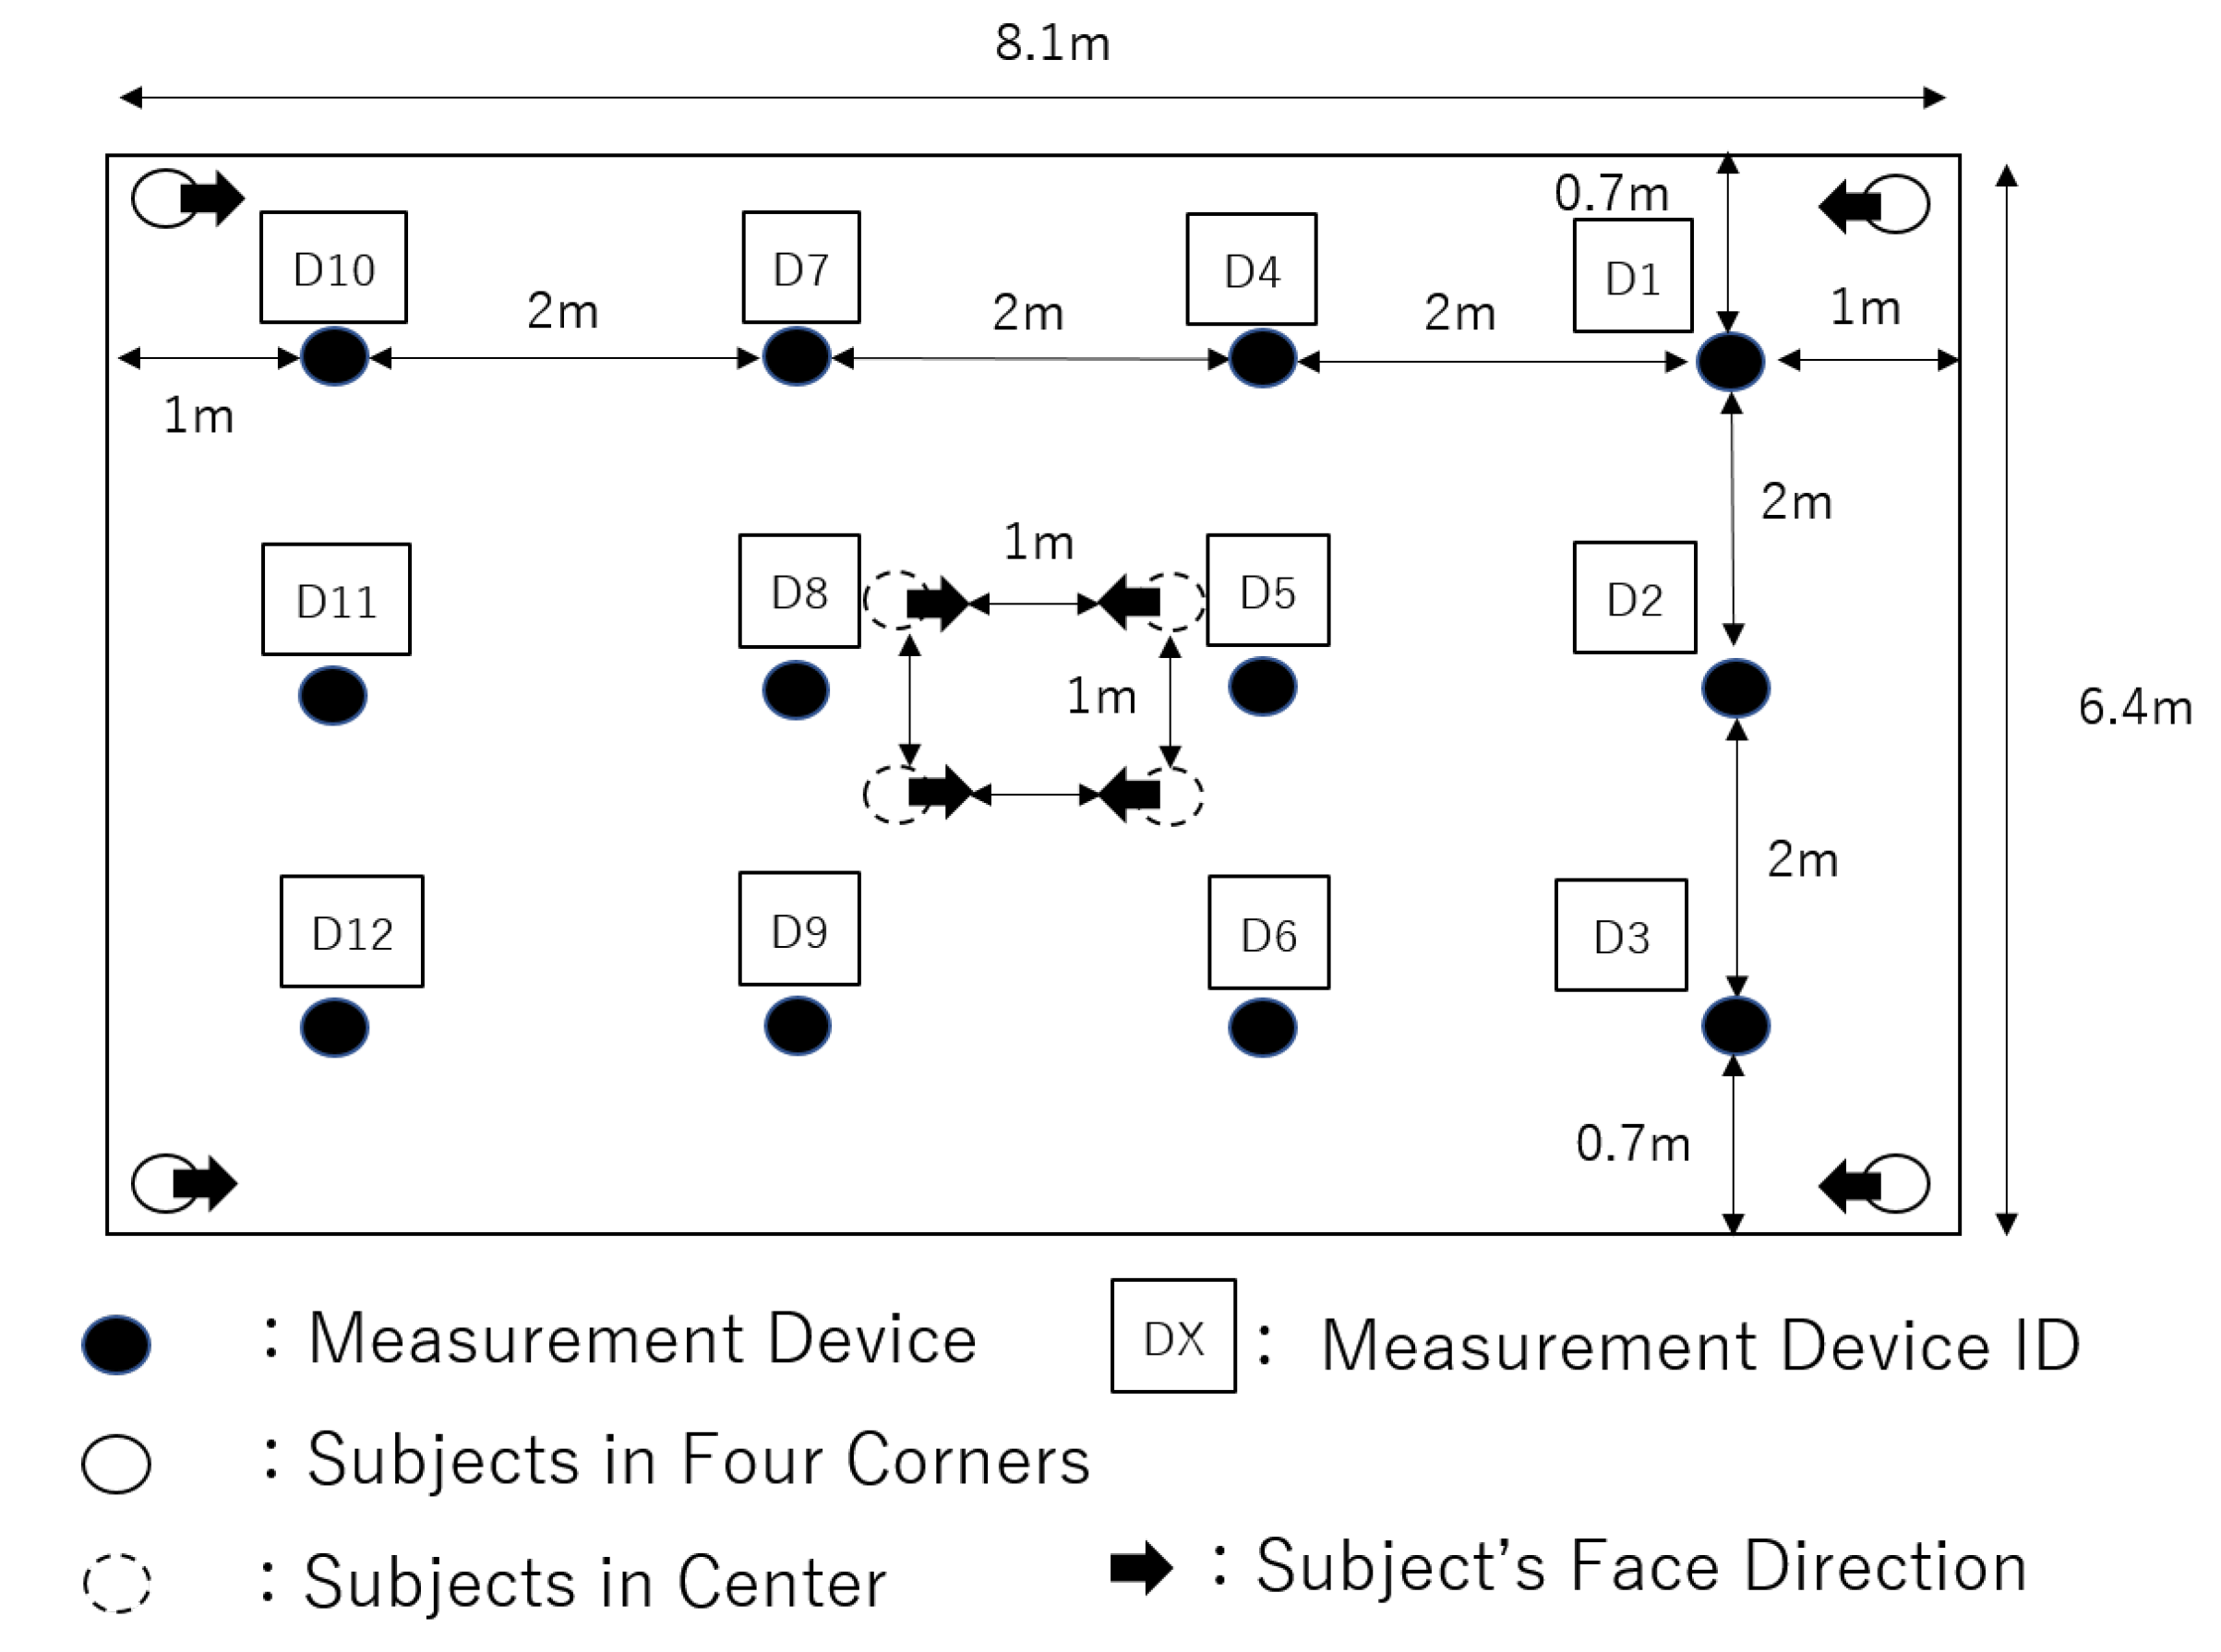
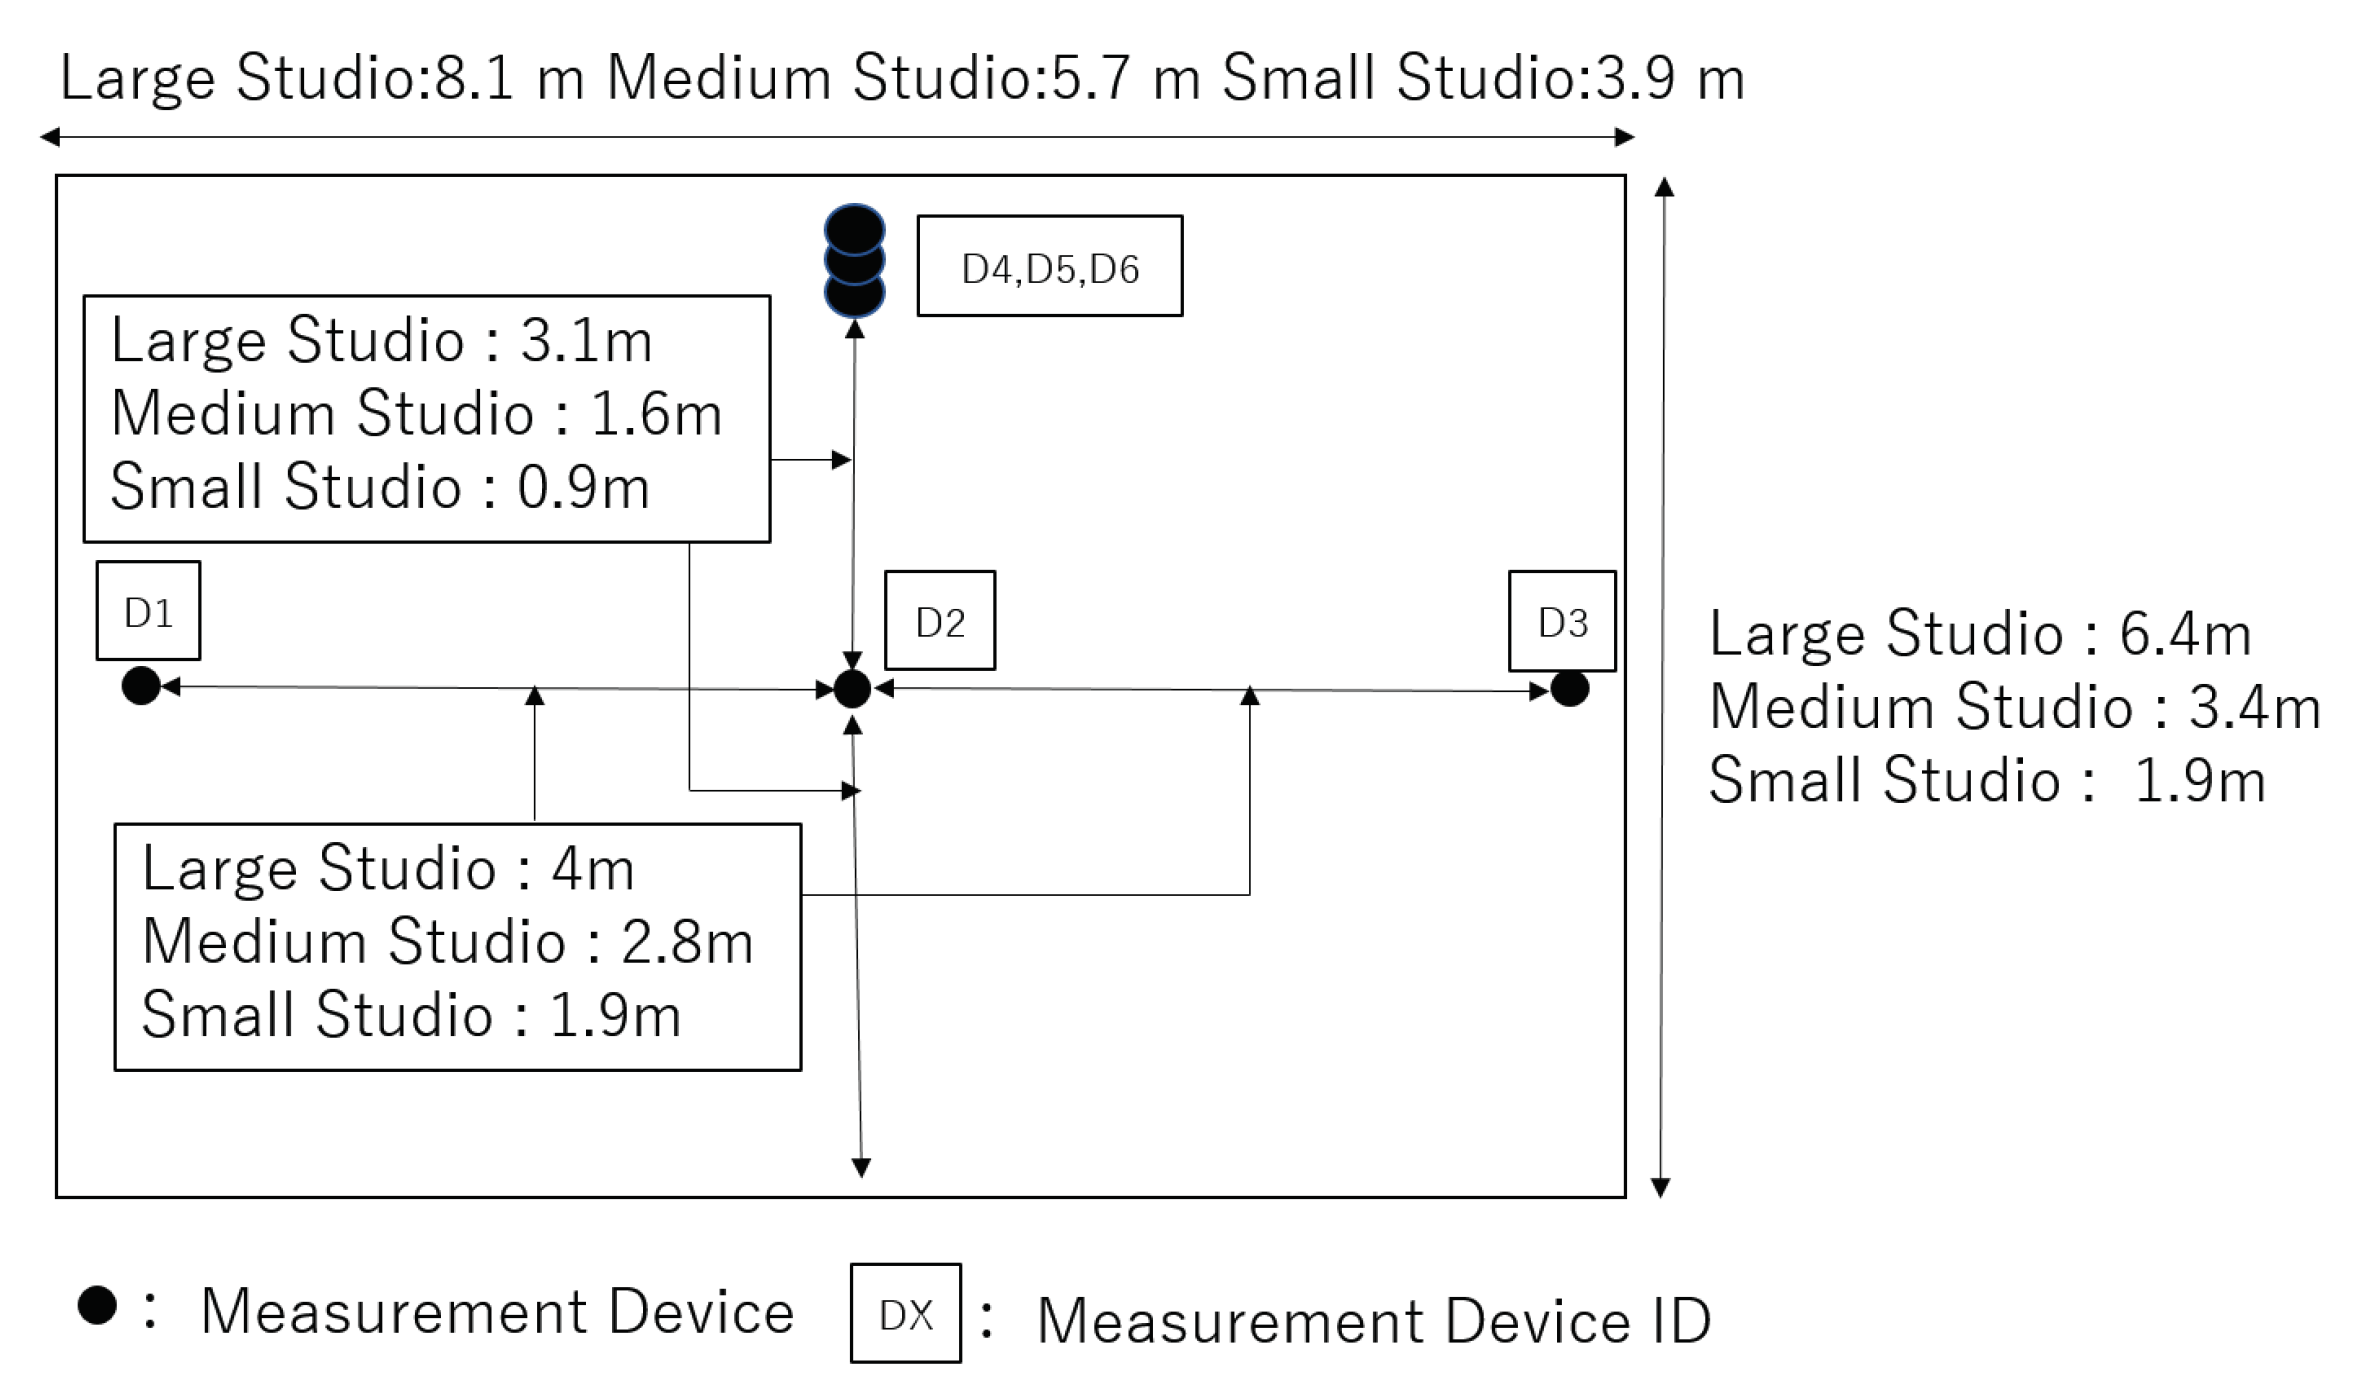
3.1. System Configuration

In this study, we analyzed the diffusion of CO 2 generated by human breath by simultaneously measuring CO 2 concentrations at multiple locations in a studio. A single measurement device can only measure locally because it measures the atmospheric CO 2 concentration that enters the measurement section in the sensor through the nonwoven fabric. Therefore, to accurately measure the distribution of CO 2 concentration in space, it is necessary to use multiple measurement devices to simultaneously sense CO 2 diffusion at multiple points. Each measurement device is connected to the RaspberryPi3 via an on-board Bluetooth module and acquires data every minute. We used the Universal Asynchronous Receiver/Transmitter (UART) for serial communication between the RaspberryPi3 and the measurement device. Six measurement devices were able to be stably connected to RaspberryPI3 per one. In this study, two RaspberryPi3 were used to verify the CO 2 diffusion. Figure 1 shows a concept diagram of the system created.

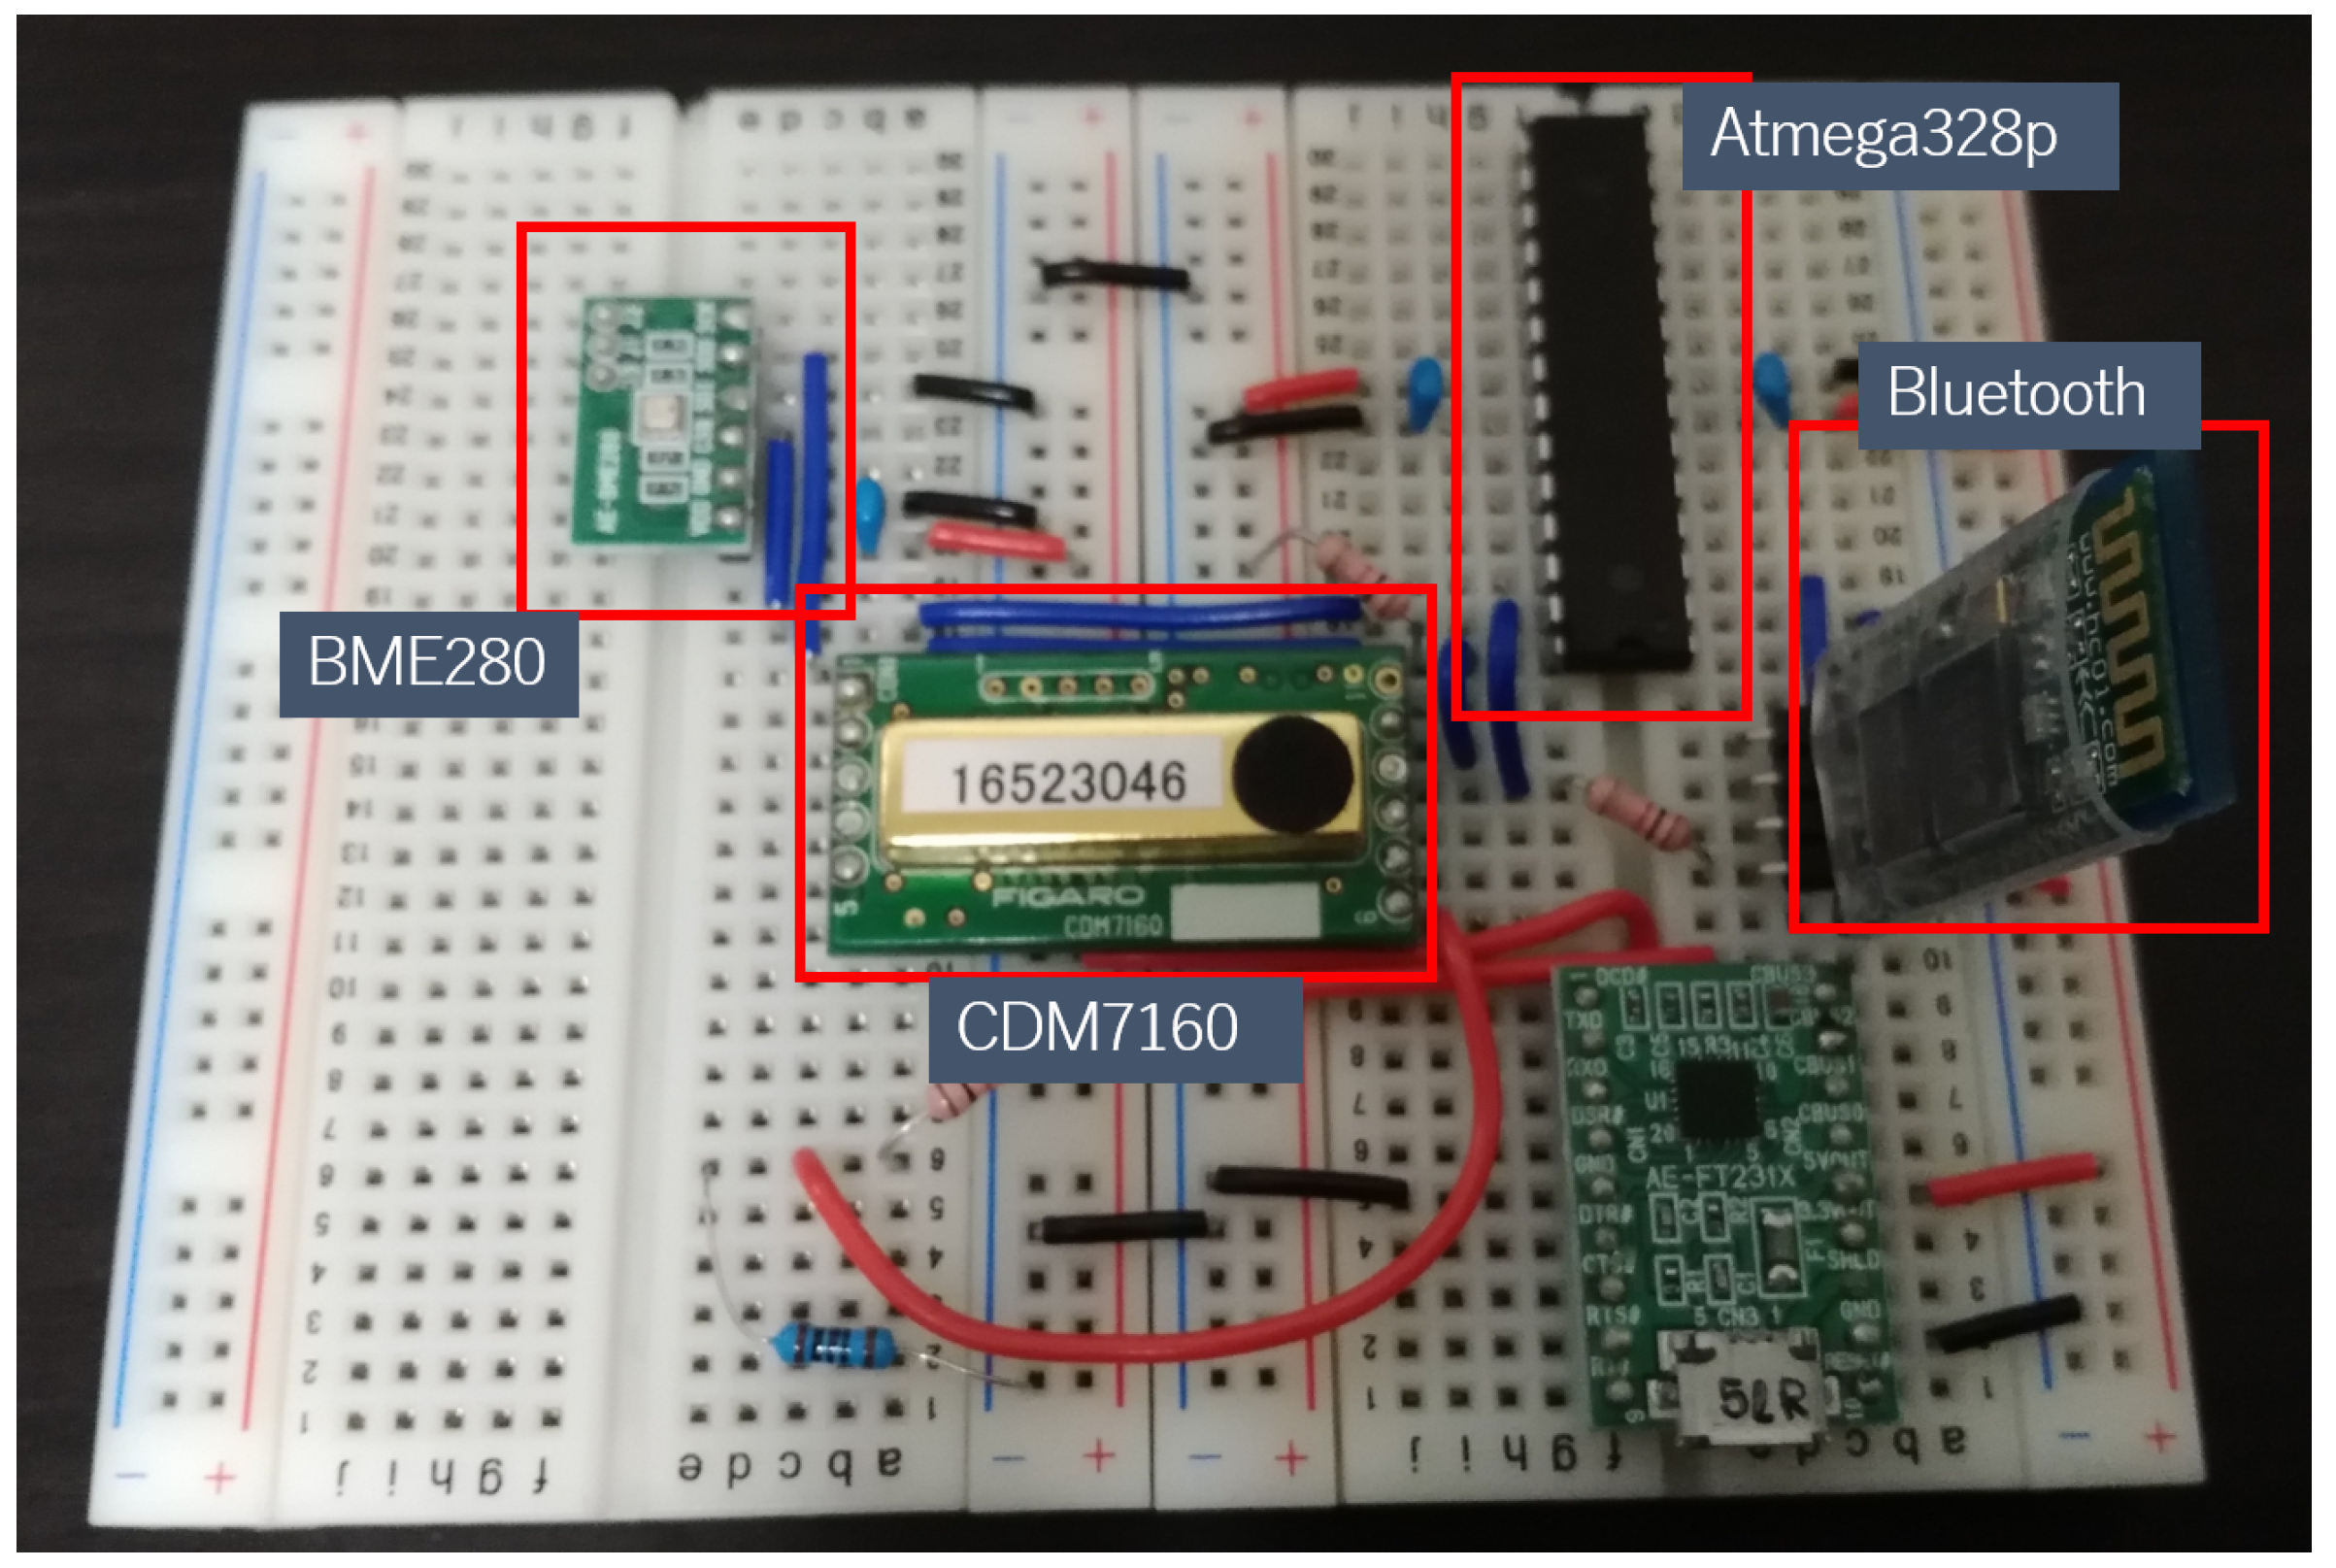
3.2. Measurement Device

In this study, a CDM7160 CO 2 sensor module provided by Figaro was used to measure CO 2 concentration and a temperature sensor, BME280, was used to check the temperature change in the room. The reason for selecting the CDM7160 CO 2 sensor module is that the data output is digital rather than analog, which is often used in conventional CO 2 concentration sensors. The accuracy is ±50 ppm plus 3% of the output value in the range of 300 to 5000 ppm, which is higher than that of conventional sensors [11]. The measurement range is limited to a single point in the sensor because the CO 2 concentration in the atmosphere that enters the measurement part of the sensor through the nonwoven fabric is measured. The accuracy of the BME280 is ±1 C in the range of −45 to 85 C. Figure 2 shows the external view of the measurement device.
To confirm that the acquired data were correctly obtained, we compared and corrected 12 measurement devices using the IES-5000 type indoor environment measurement set developed by Shibata Kagaku Co [12]. We used a two-point calibration curve [13] with two gases, 500 ppm and 1500 ppm, to make adjustments, and the sensor outputs of all the measurement devices were corrected to be within the error range.

4. Analysis of CO 2 Diffusion Trend to the Position of the Subject and the Measurement Device

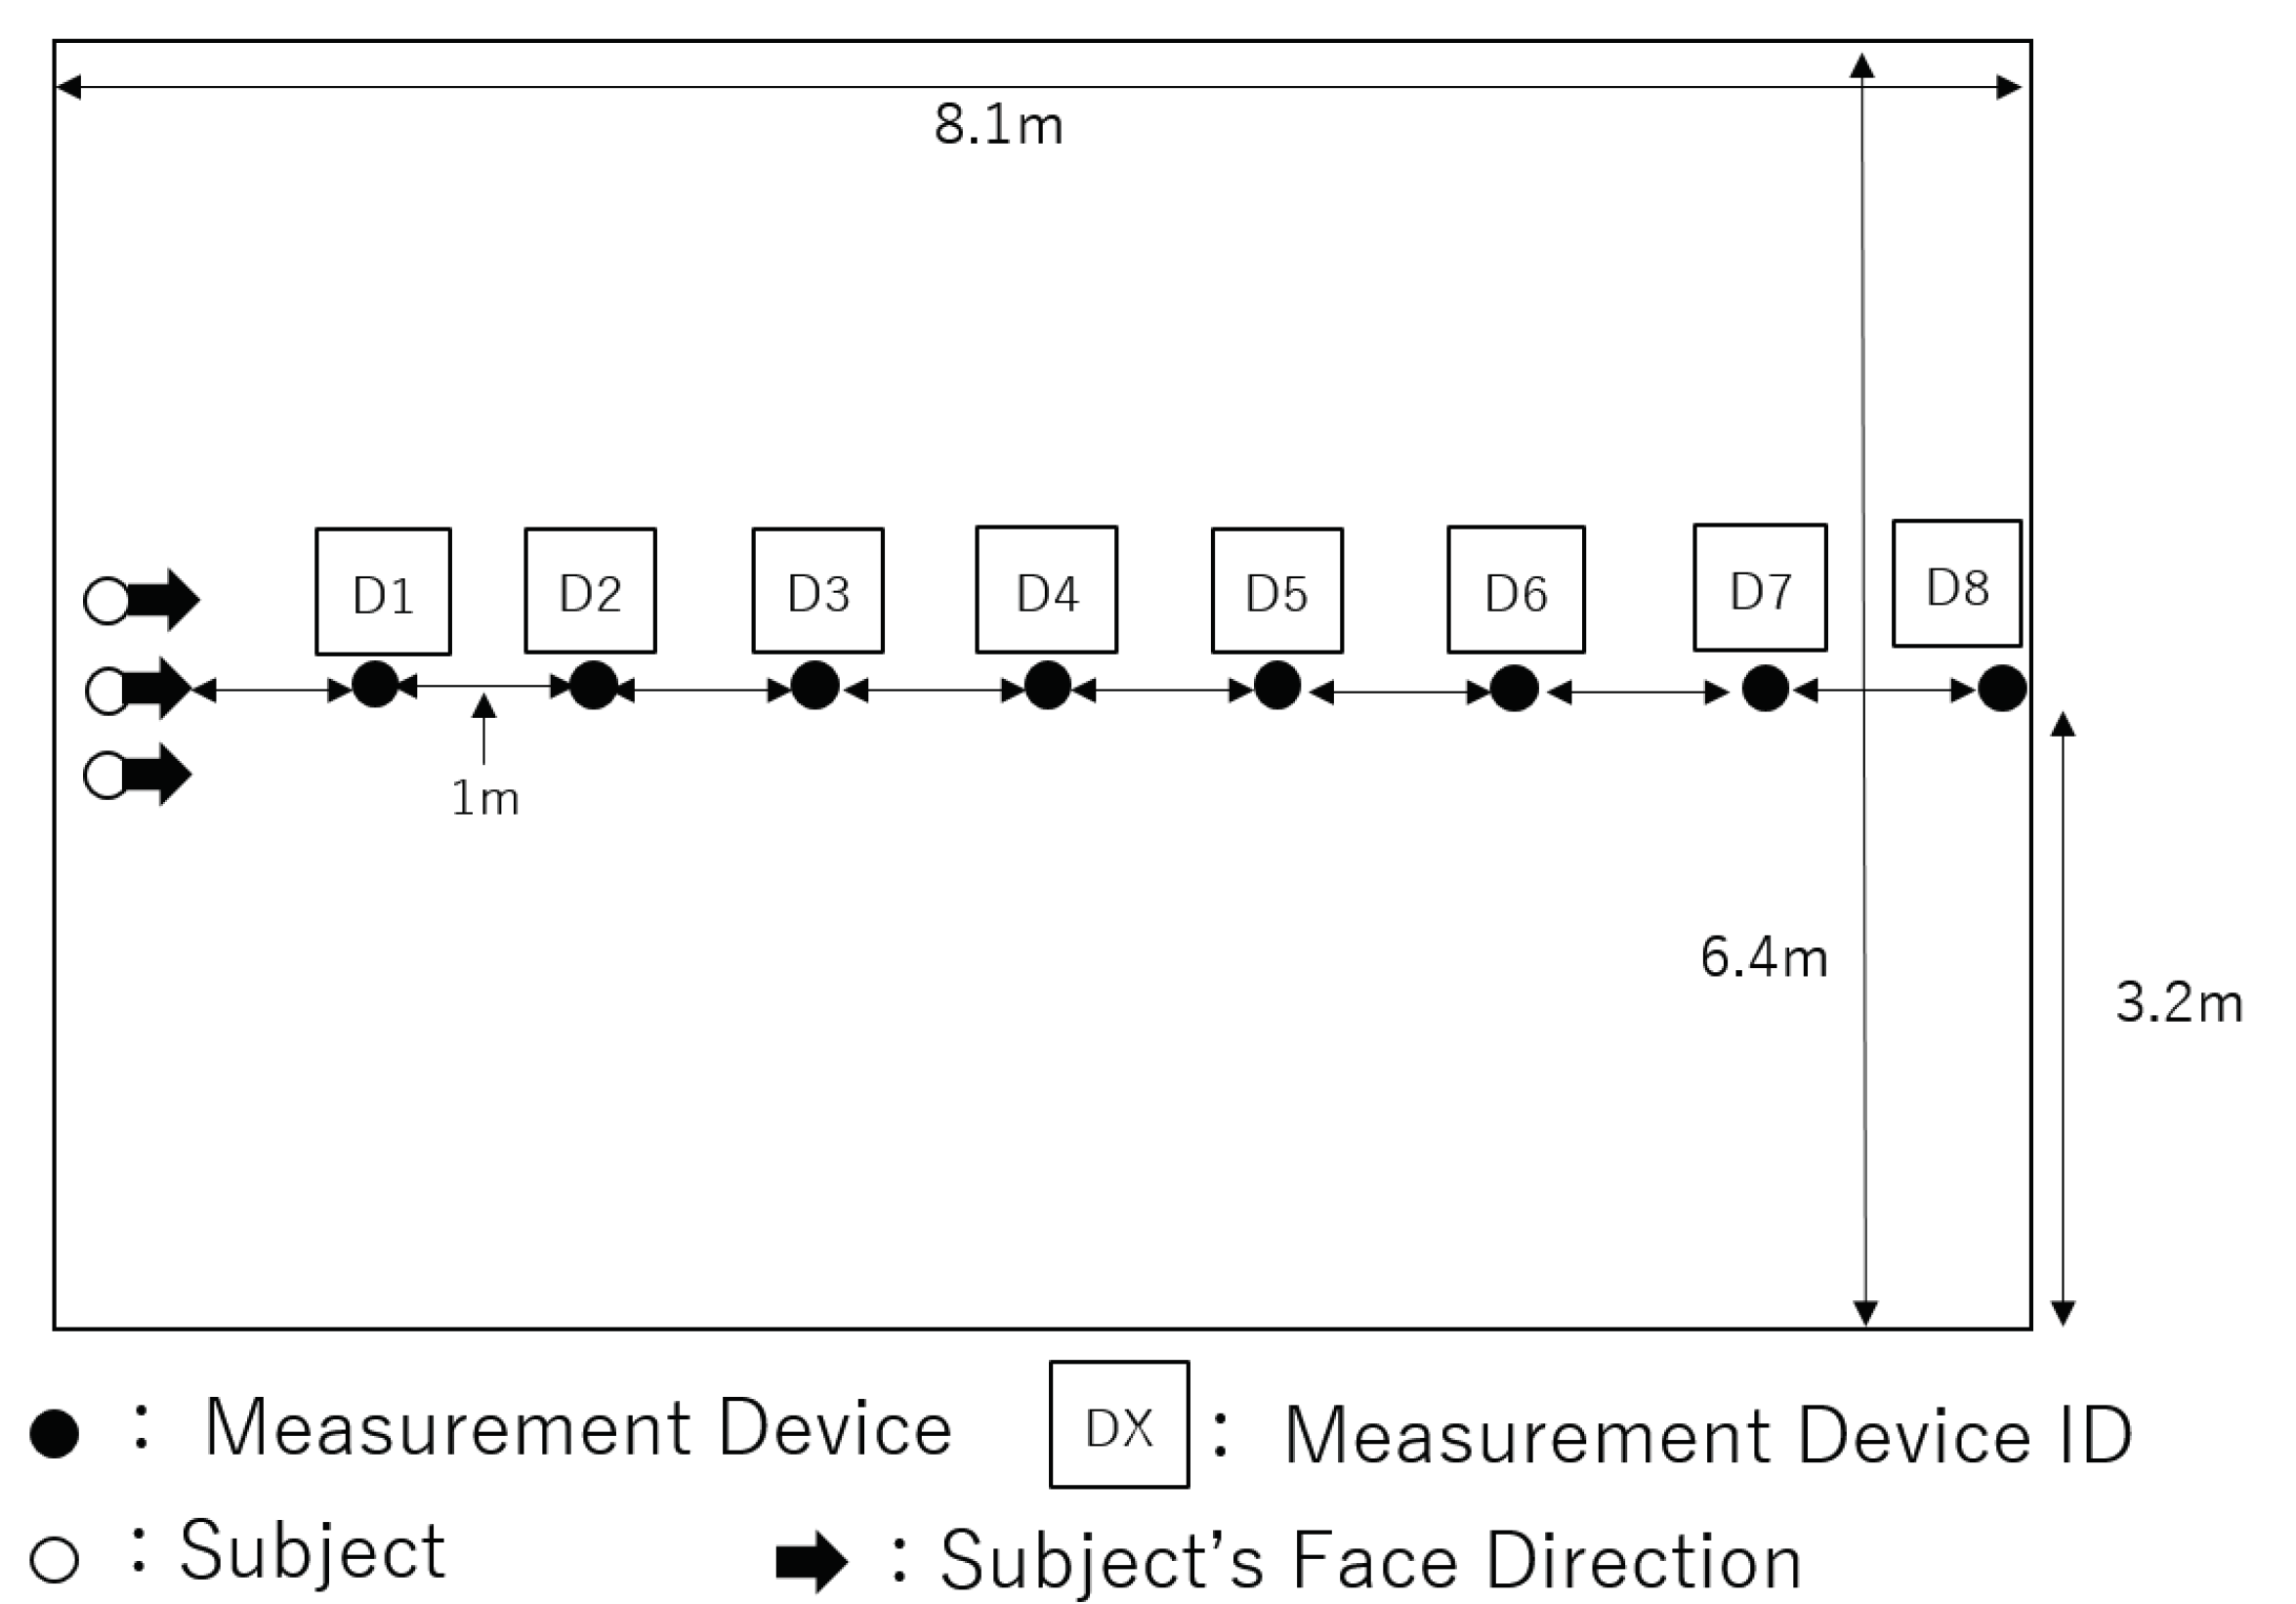
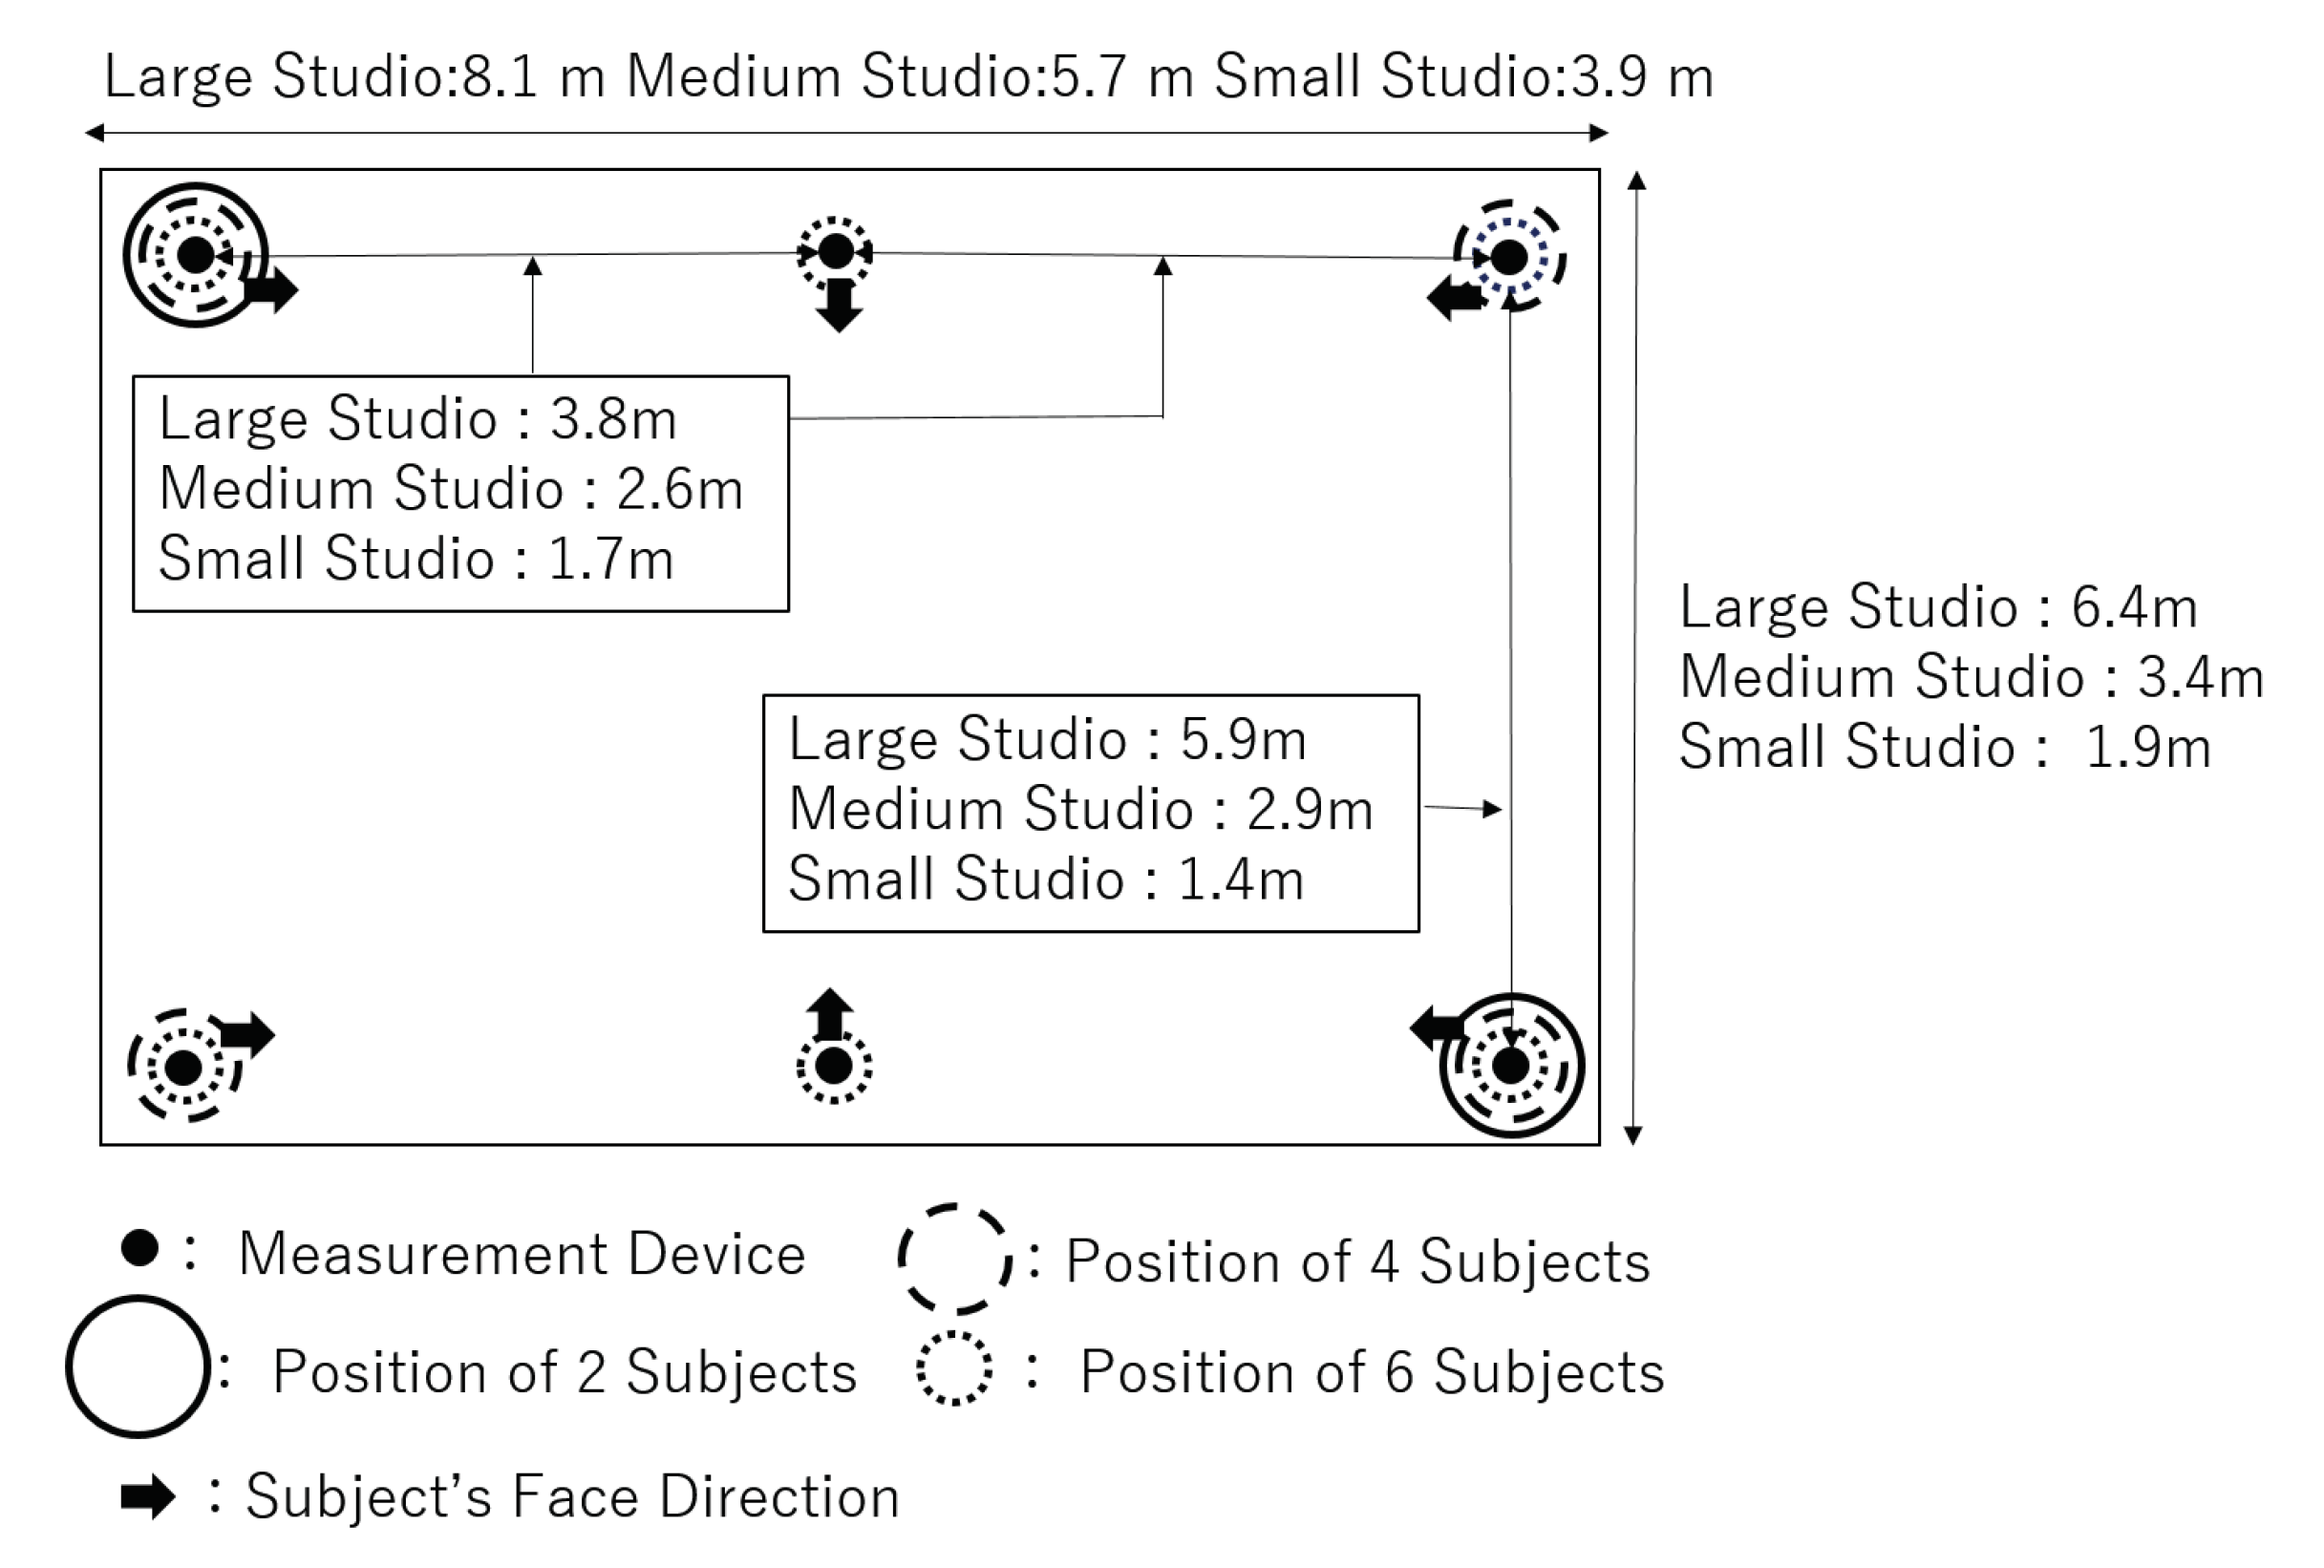
4.1. Environment and Methods
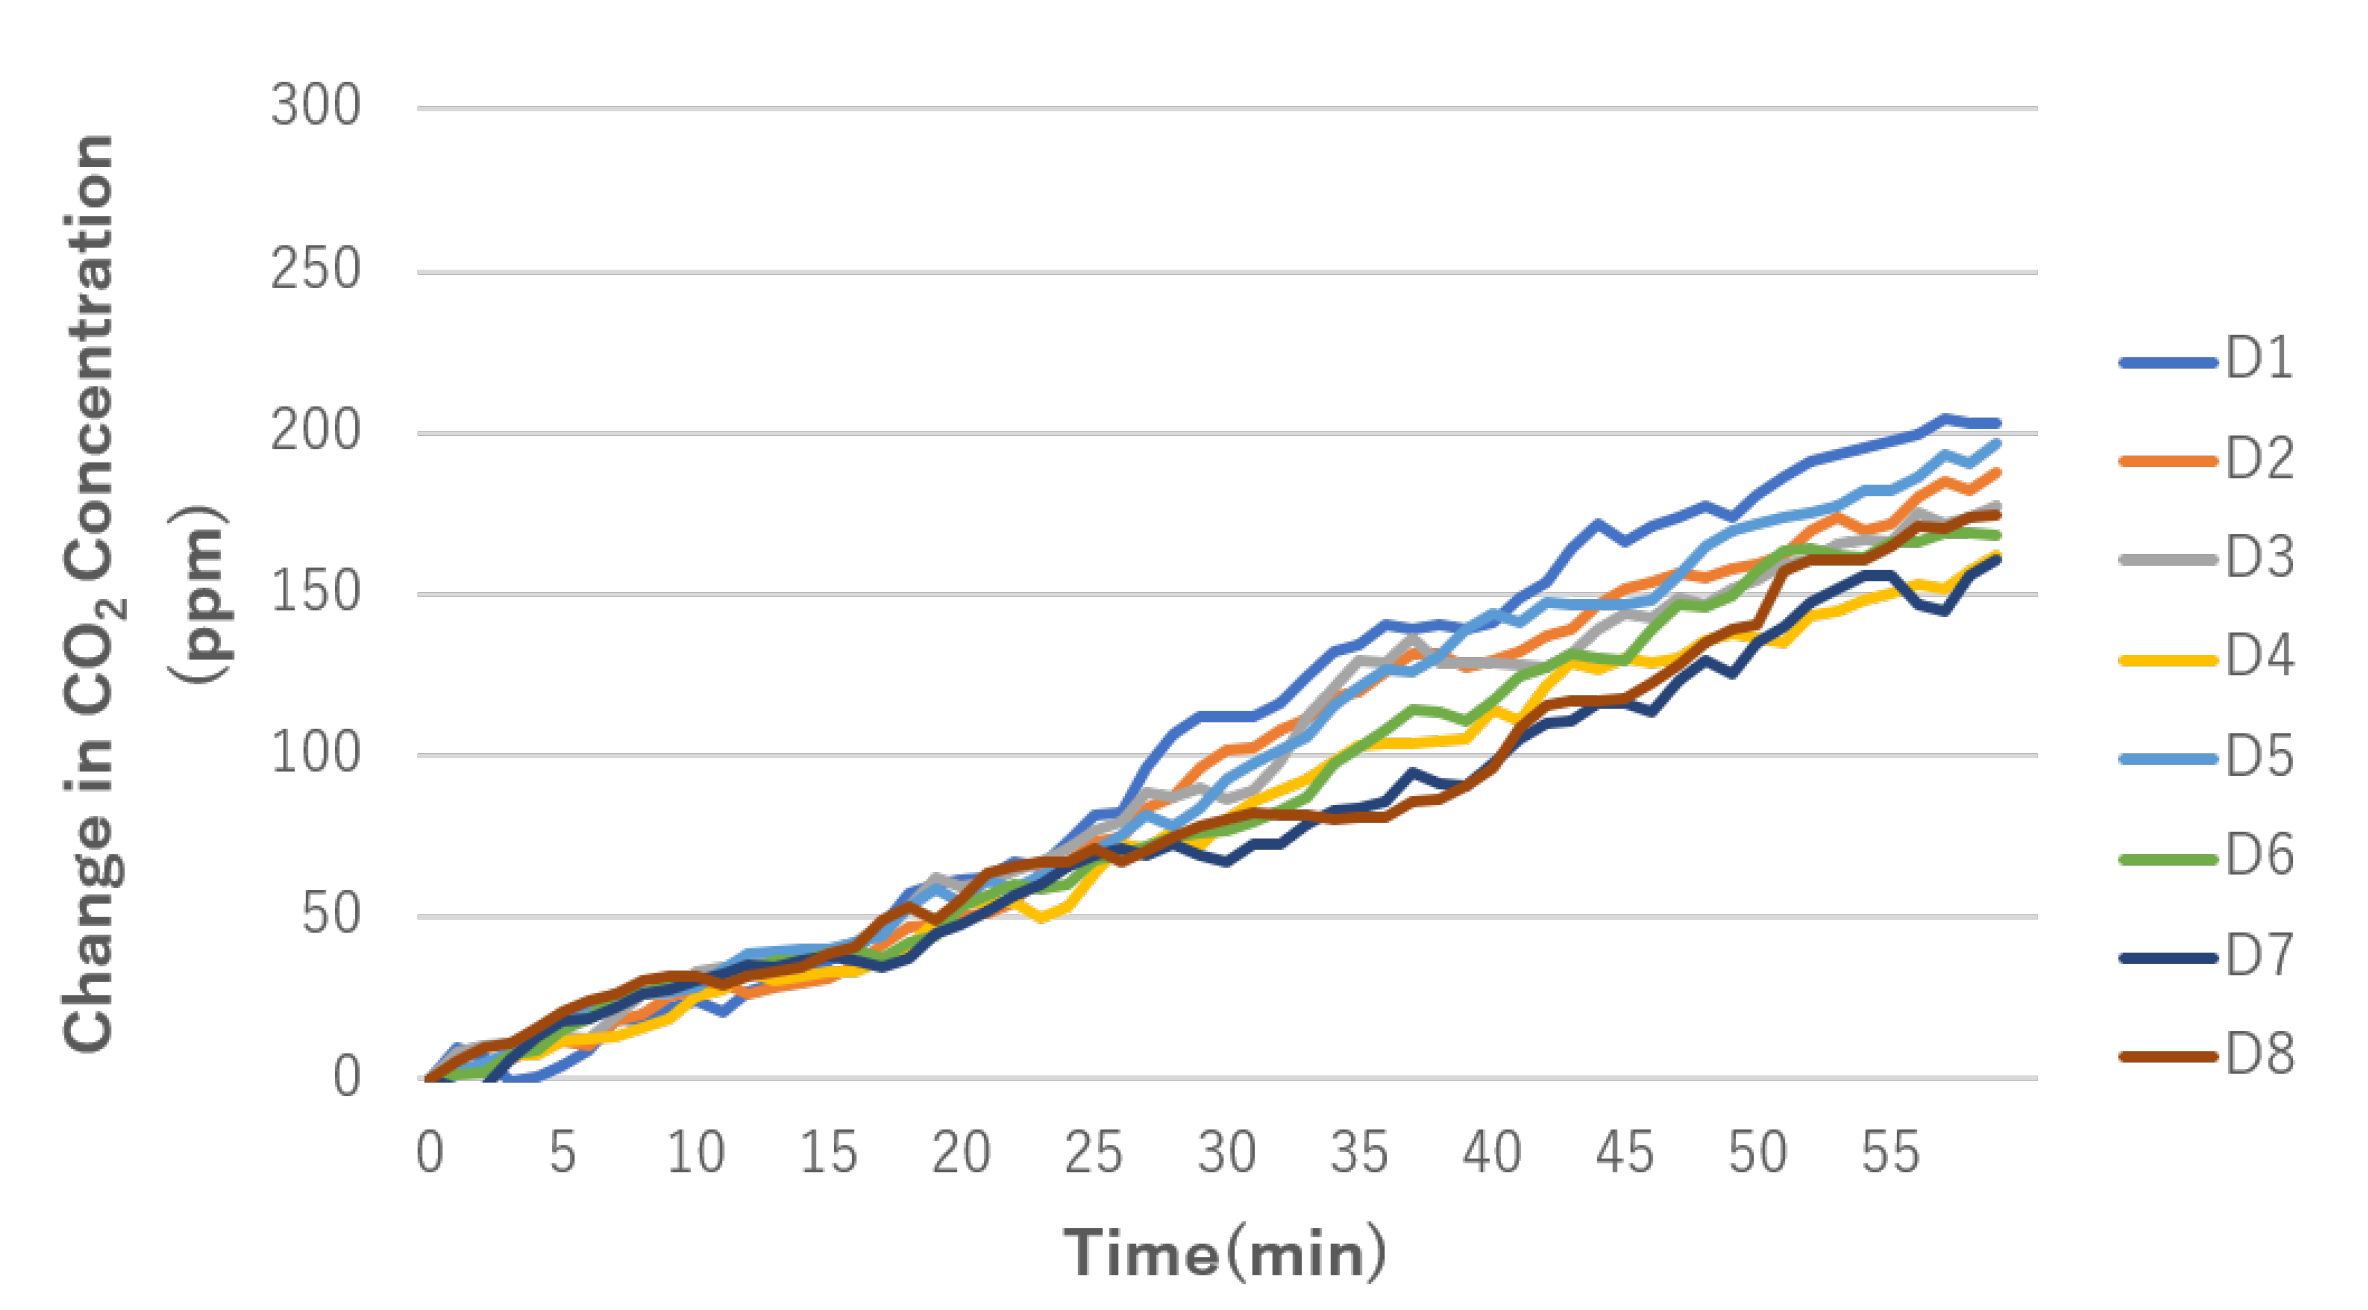
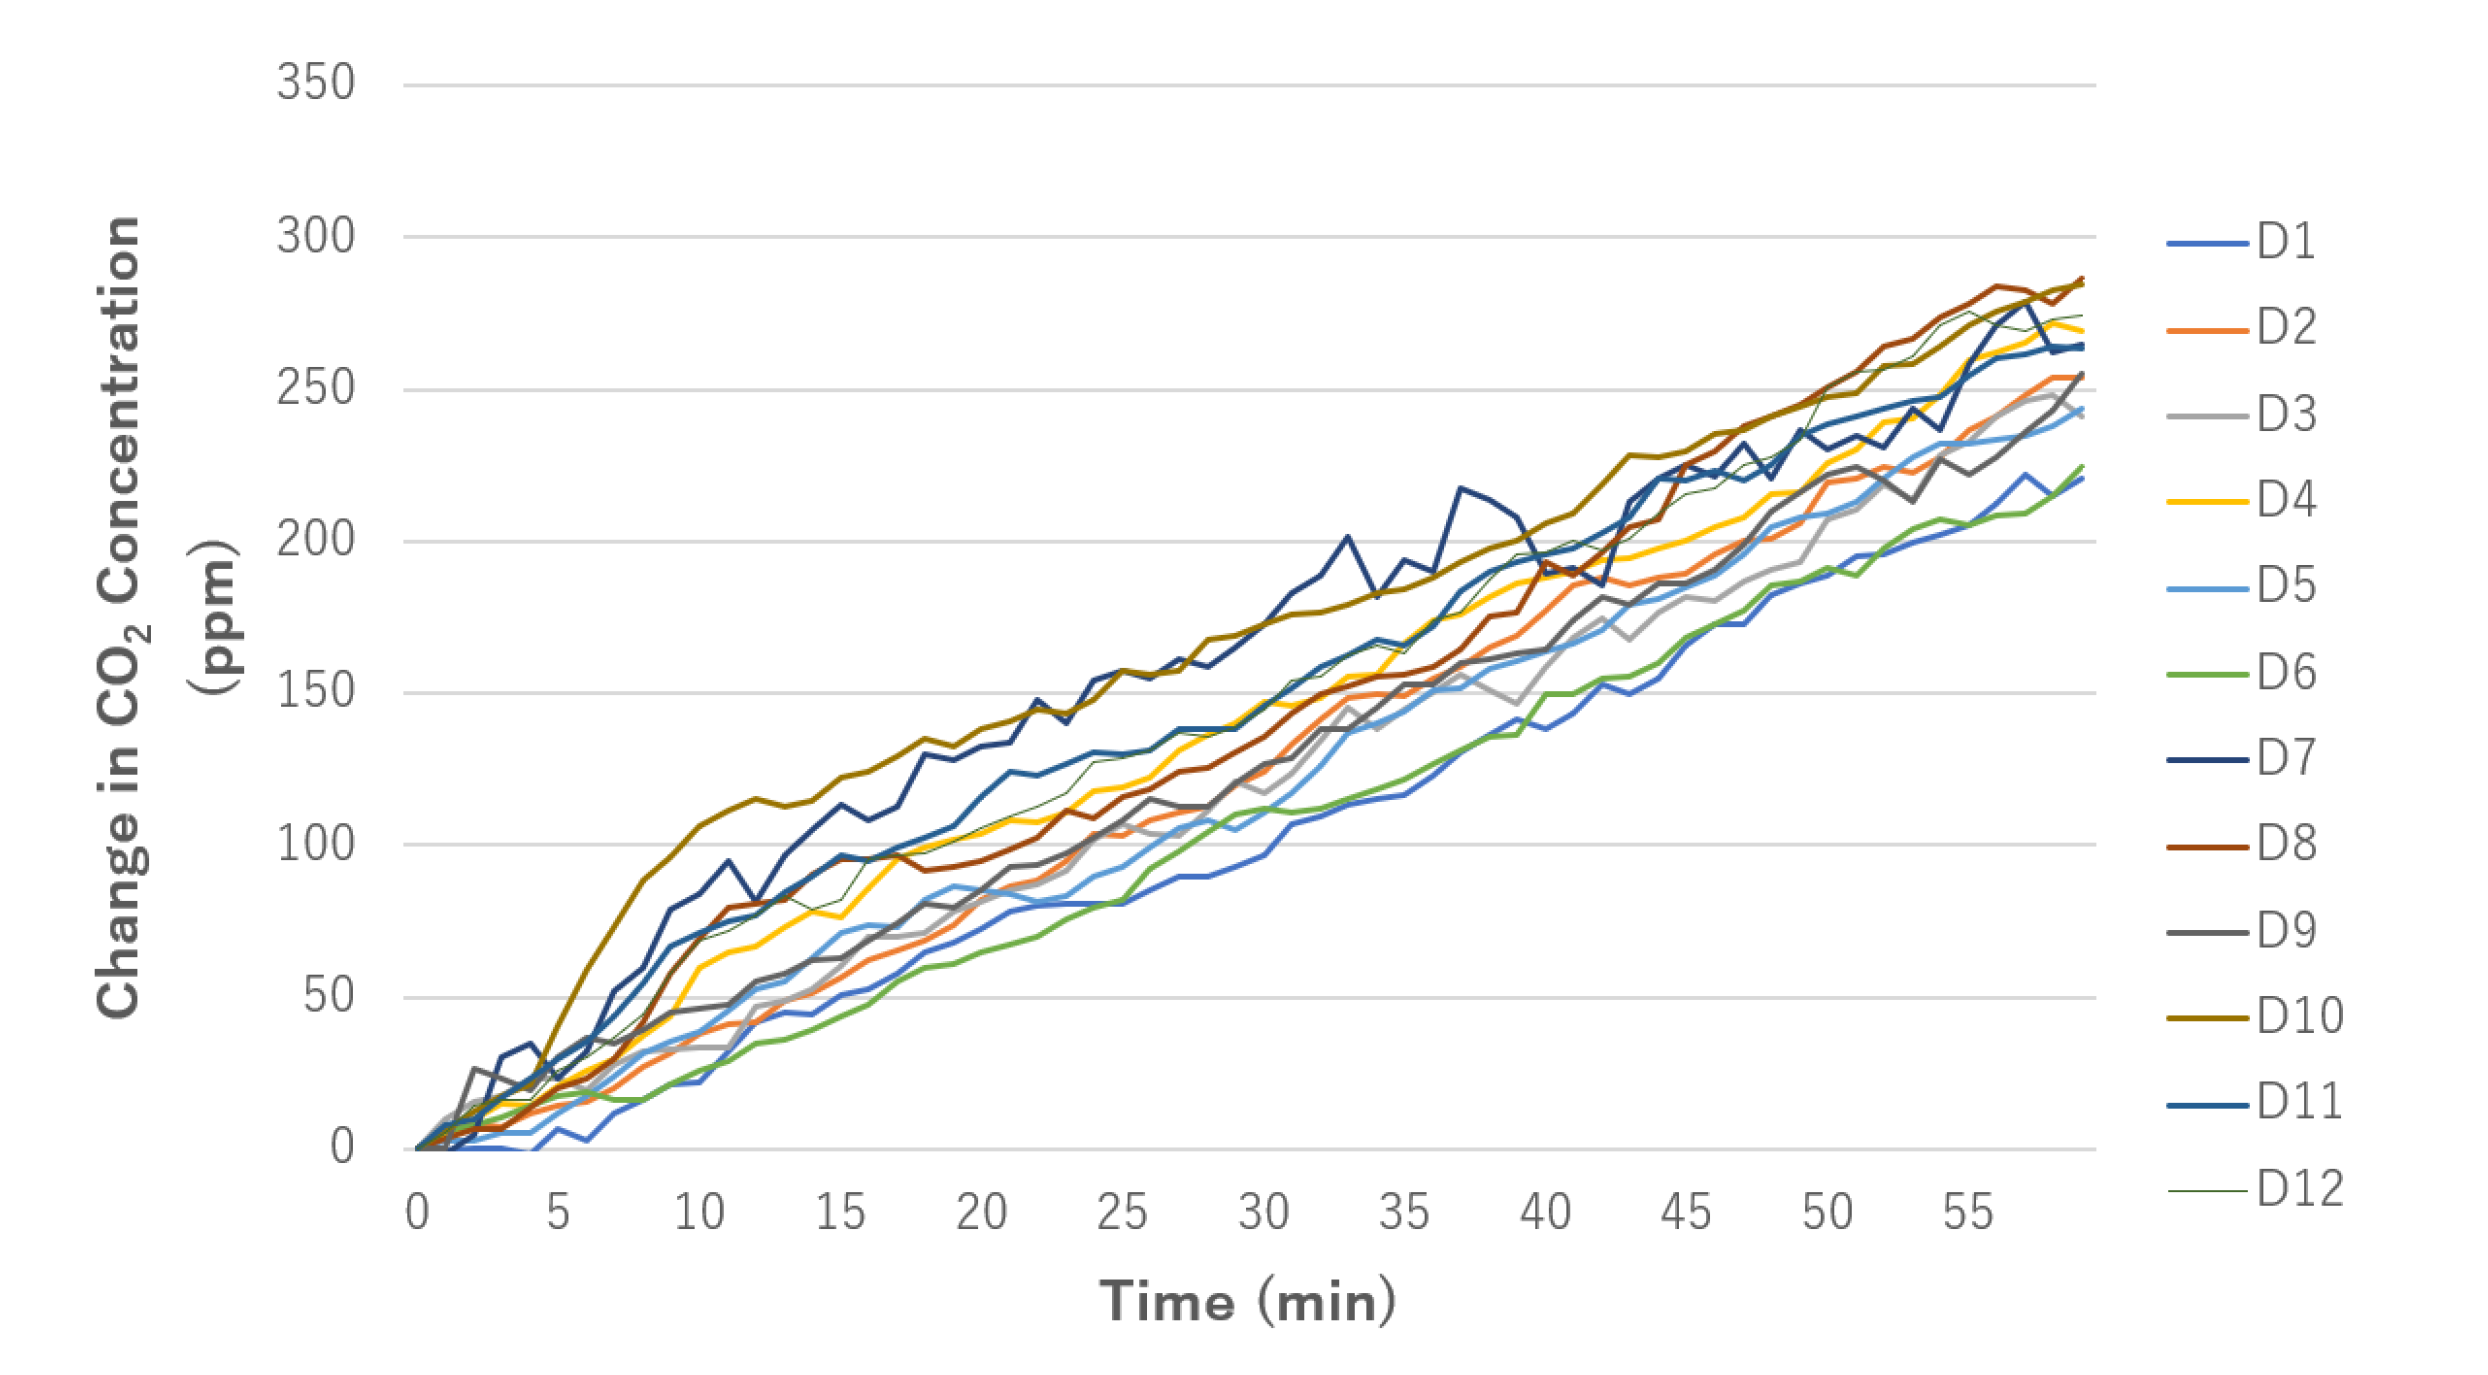
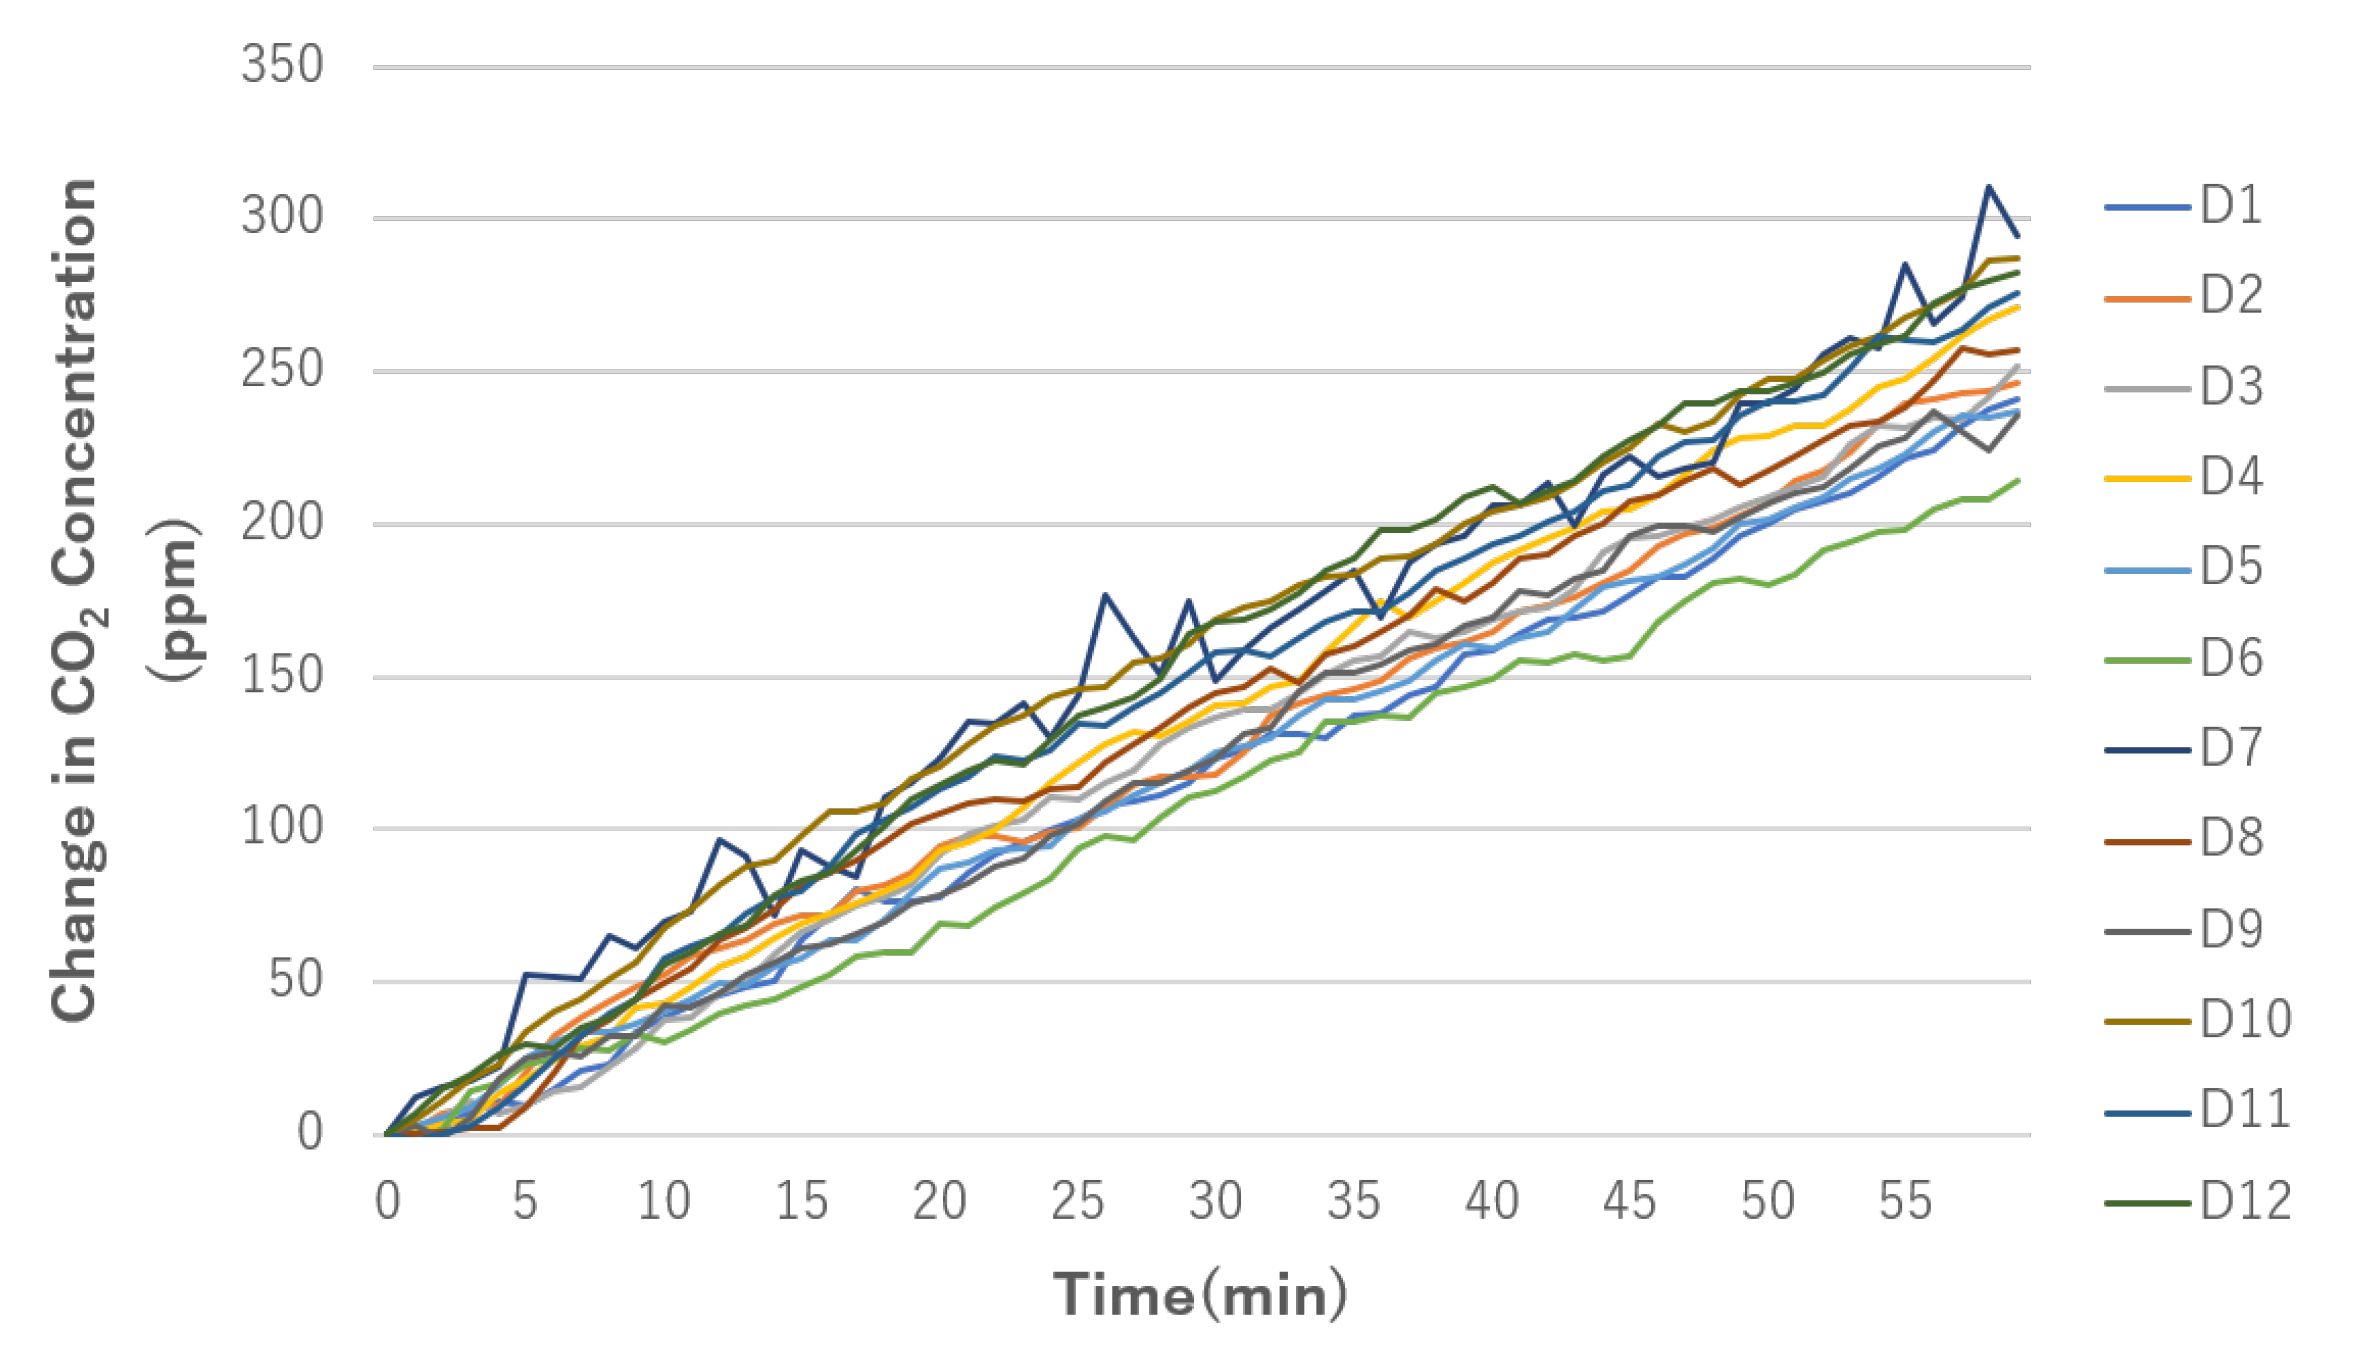
In this chapter, we analyze the diffusion of CO 2 generated by human breath by simultaneously measuring CO 2 concentrations at multiple locations in a room. All experiments in this chapter were performed in the same studio with a volume of 197.0 m 3 . During the experiment, all door gaps, vents and openings were sealed up to prevent the CO 2 concentration from being biased by the outside air and the studio’s ventilation system is turned off (only natural ventilation). In addition, the studio is located in the basement, and there are no windows or other openings in contact with the outside air. The reason for the use of the basement is to minimize the effect of the air entering through the gaps in the windows on the amount of ventilation, depending on the weather conditions of that day. After the experiment, the door to the outside was opened, the studio’s ventilation system was activated and the subjects left and were ventilated for 60 min. The number of subjects in the studio was decided to be three to four because we could place the subjects evenly in the four corners of the studio due to the nature of the experiment. All the subjects were males over 18 years of age and were instructed to breathe steadily in a seated position during the experiment and were allowed to speak to some extent. The duration of the experiment was 60 min for all conditions, and the mean value of the experiment was used as the experimental result. After the experiment, we ventilated the room sufficiently and confirmed that the CO 2 concentration in the room had decreased to the same level as the outside air in the building (about 400 to 500 ppm according to the measurement device) before starting the next experiment. To show that there was no sudden temperature change in the room, the room temperature was measured every minute during the experiment. The experiments in this chapter are referred to as Case 1, Case 2 and Case 3. In Case 1, we measured and analyzed how the distance between the subject and the measurement device. The height difference between the subject and the measurement device in Case 2 and the position of several subjects in Case 3, respectively, affect the diffusion of CO 2 in the room.
In Case 1, the measurement devices were placed in a straight line from three subjects at 1 m intervals, and the distance between subjects was 30 cm. The arrangement of the subjects and devices in Case 1 is shown in Figure 3, where the measurement device was placed on the floor and the height of the device was set at 0 m.
In Case 2, three subjects were placed at the edge of the room, and the measurement devices were placed at six locations at a height of 0 m (floor), 1 m and 2 m, and 1 m and 8 m away from the subjects, respectively. The arrangement of the subjects and devices in Case 2 is shown in Figure 4.
In Case 3, four subjects were placed in the four corners or the center of the room. Case 3a is the experiment in which subjects are placed in the four corners of the room, and Case 3b is the experiment in which subjects are placed in the center. The measurement devices were placed at 2 m intervals on 4 × 3 blocks to cover the room, and the distance between subjects was set to 8 m or 6.5 m when subjects were placed at the four corners. The measurement device was placed on the floor and its height was set at 0 m. The distance between subjects was set at 1 m when the subjects were placed in the center of the study. The arrangement of the subjects and devices in the experiment is shown in Figure 5.

4.2. Results

For all graphs in this section, the x-axis shows the time elapsed and the y-axis shows the amount of change in CO 2 concentration from the the beginning of the experiment. The experimental results of Case 1 are shown in Figure 6.
Figure 6 shows that an increase in CO 2 concentration of about 150 to 200 ppm at almost the same time interval at all distances and the final CO 2 concentration in the room was about 700 ppm. The amount of change was within the error range of the measurement sensor.
The experimental results for the devices with a distance of 1 m from the subjects in Case 2 are shown in Figure 7, and those for the devices with a distance of 8 m are shown in Figure 8.
As shown in Figure 7 and Figure 8, the amount of change in CO 2 concentration increased with time, regardless of the difference between high and low, and increased from 200 to 250 ppm in 60 min after the start of the measurement and the final CO 2 concentration in the room was about 750 ppm. In Figure 8, where the distance from the subject is 8 m, there is a temporary increase in CO 2 concentration beyond the error range of the measurement device, but by the next measurement, the CO 2 concentration has decreased to the same level as that of other sensors. As in Case 1, the amount of change was within the error range of the measurement sensor, so it is considered that there was no change in CO 2 concentration due to the difference in height.
The experimental results of Case 3a and Case 3b are shown in Figure 9 and Figure 10, respectively, with the subjects in the four corners and in the center, respectively. The changes in the final CO 2 concentration in Case 3 are shown in Table 1. The devices in boldface in Table 1 show the top six devices with the largest change in CO 2 concentration in each experiment.
As shown in Figure 9 and Figure 10, all the sensors finally showed an increase in concentration of 200–300 ppm, and the final CO 2 concentration in the room was about 800 ppm. As Table 1 shows, the top six devices (D4, D7, D8, D10, D11 and D12) with the largest changes in CO 2 concentrations in Case 3a and Case 3b were the same in both conditions, although the CO 2 concentrations seemed to vary depending on the location of the measurement devices. In addition, when comparing the changes in the final CO 2 concentration for each measurement device under the conditions of Case 3a and Case 3b, the changes are within the error range of the measurement sensor for all devices. Therefore, it is considered that the position of a person has no effect on CO 2 diffusion in the room.
The mean indoor temperature during the experiment was 24 C for both of the two experiments conducted for Case 1, 20 and 21 C for Case 2 and 21 and 22 C for Case 3, and did not change by more than ±2 C for all conditions.

5. Comparison of Predicted and Measured Values Using a Prediction Model

5.1. Prediction Model

The change over time in the concentration of gas in a room from its initial state is generally expressed by the following Equation (1), when the amount of gas generated is constant [14].
C = C 0 + M N V ( 1 e N t )
C is concentration of CO 2 in indoor air (mg/m 3 ), C 0 is concentration of target air outside (mg/m 3 ), t is elapsed time (h), V is studio volume (m 3 ), M is amount of gas generated (mg/h), N is number of ventilation cycle (cycle/h). The ventilation cycle is defined as the ventilation amount (m 3 /h) of a room divided by the volume (m 3 ).
In this study, there are deals with CO 2 diffused from human exhaled air, and the concentration is expressed as volume concentration (ppm). Therefore, if we rearrange the equation to align the units, we obtain Equation (2) (Seidel’s equation).
C = ( C 0 + n E N V ( 1 e N t ) ) × 10 6
C is concentration of CO 2 in indoor air (ppm), n is number of subjects in the room, E is CO 2 emission per subject (m 3 /h).
In the prediction model, the concentration of CO 2 increases in an almost linear manner at the beginning of the measurement, but as time passes, it ascends to a constant concentration. In this study, Equation (2) is used as a prediction model for the CO 2 concentration in a room, and the predicted CO 2 concentration until the steady state is reached is evaluated by comparing the predicted values with the actual values measured by simultaneous multipoint sensing of the CO 2 concentration sensor.

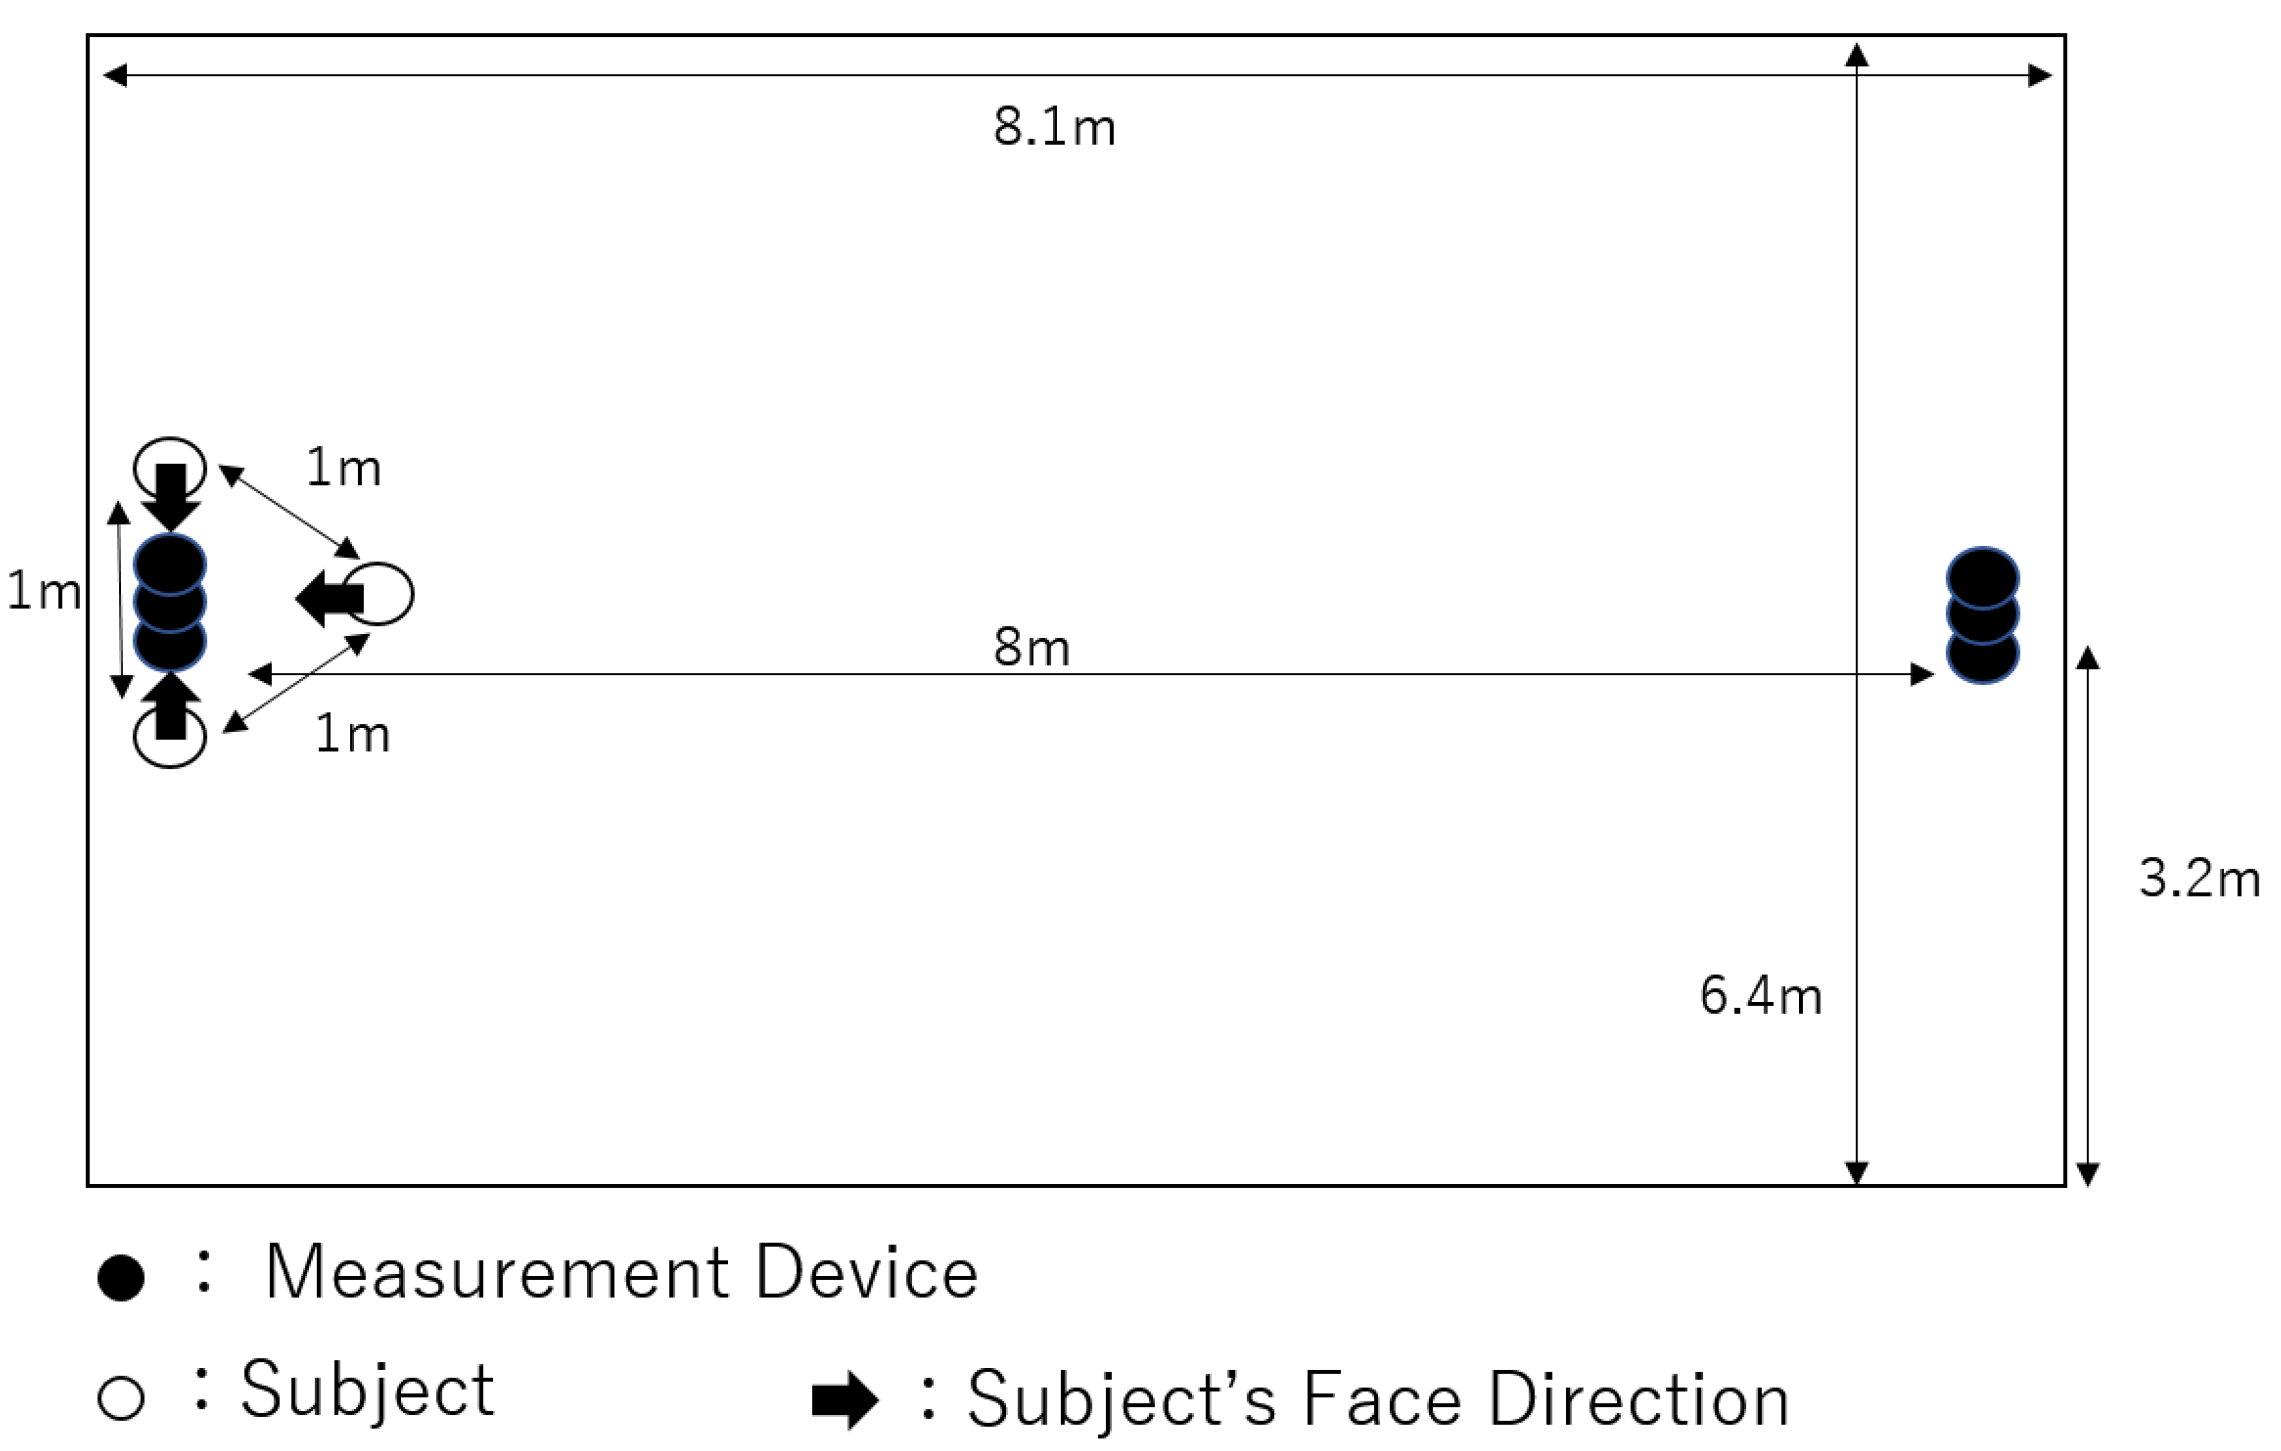
5.2. Environment and Methods
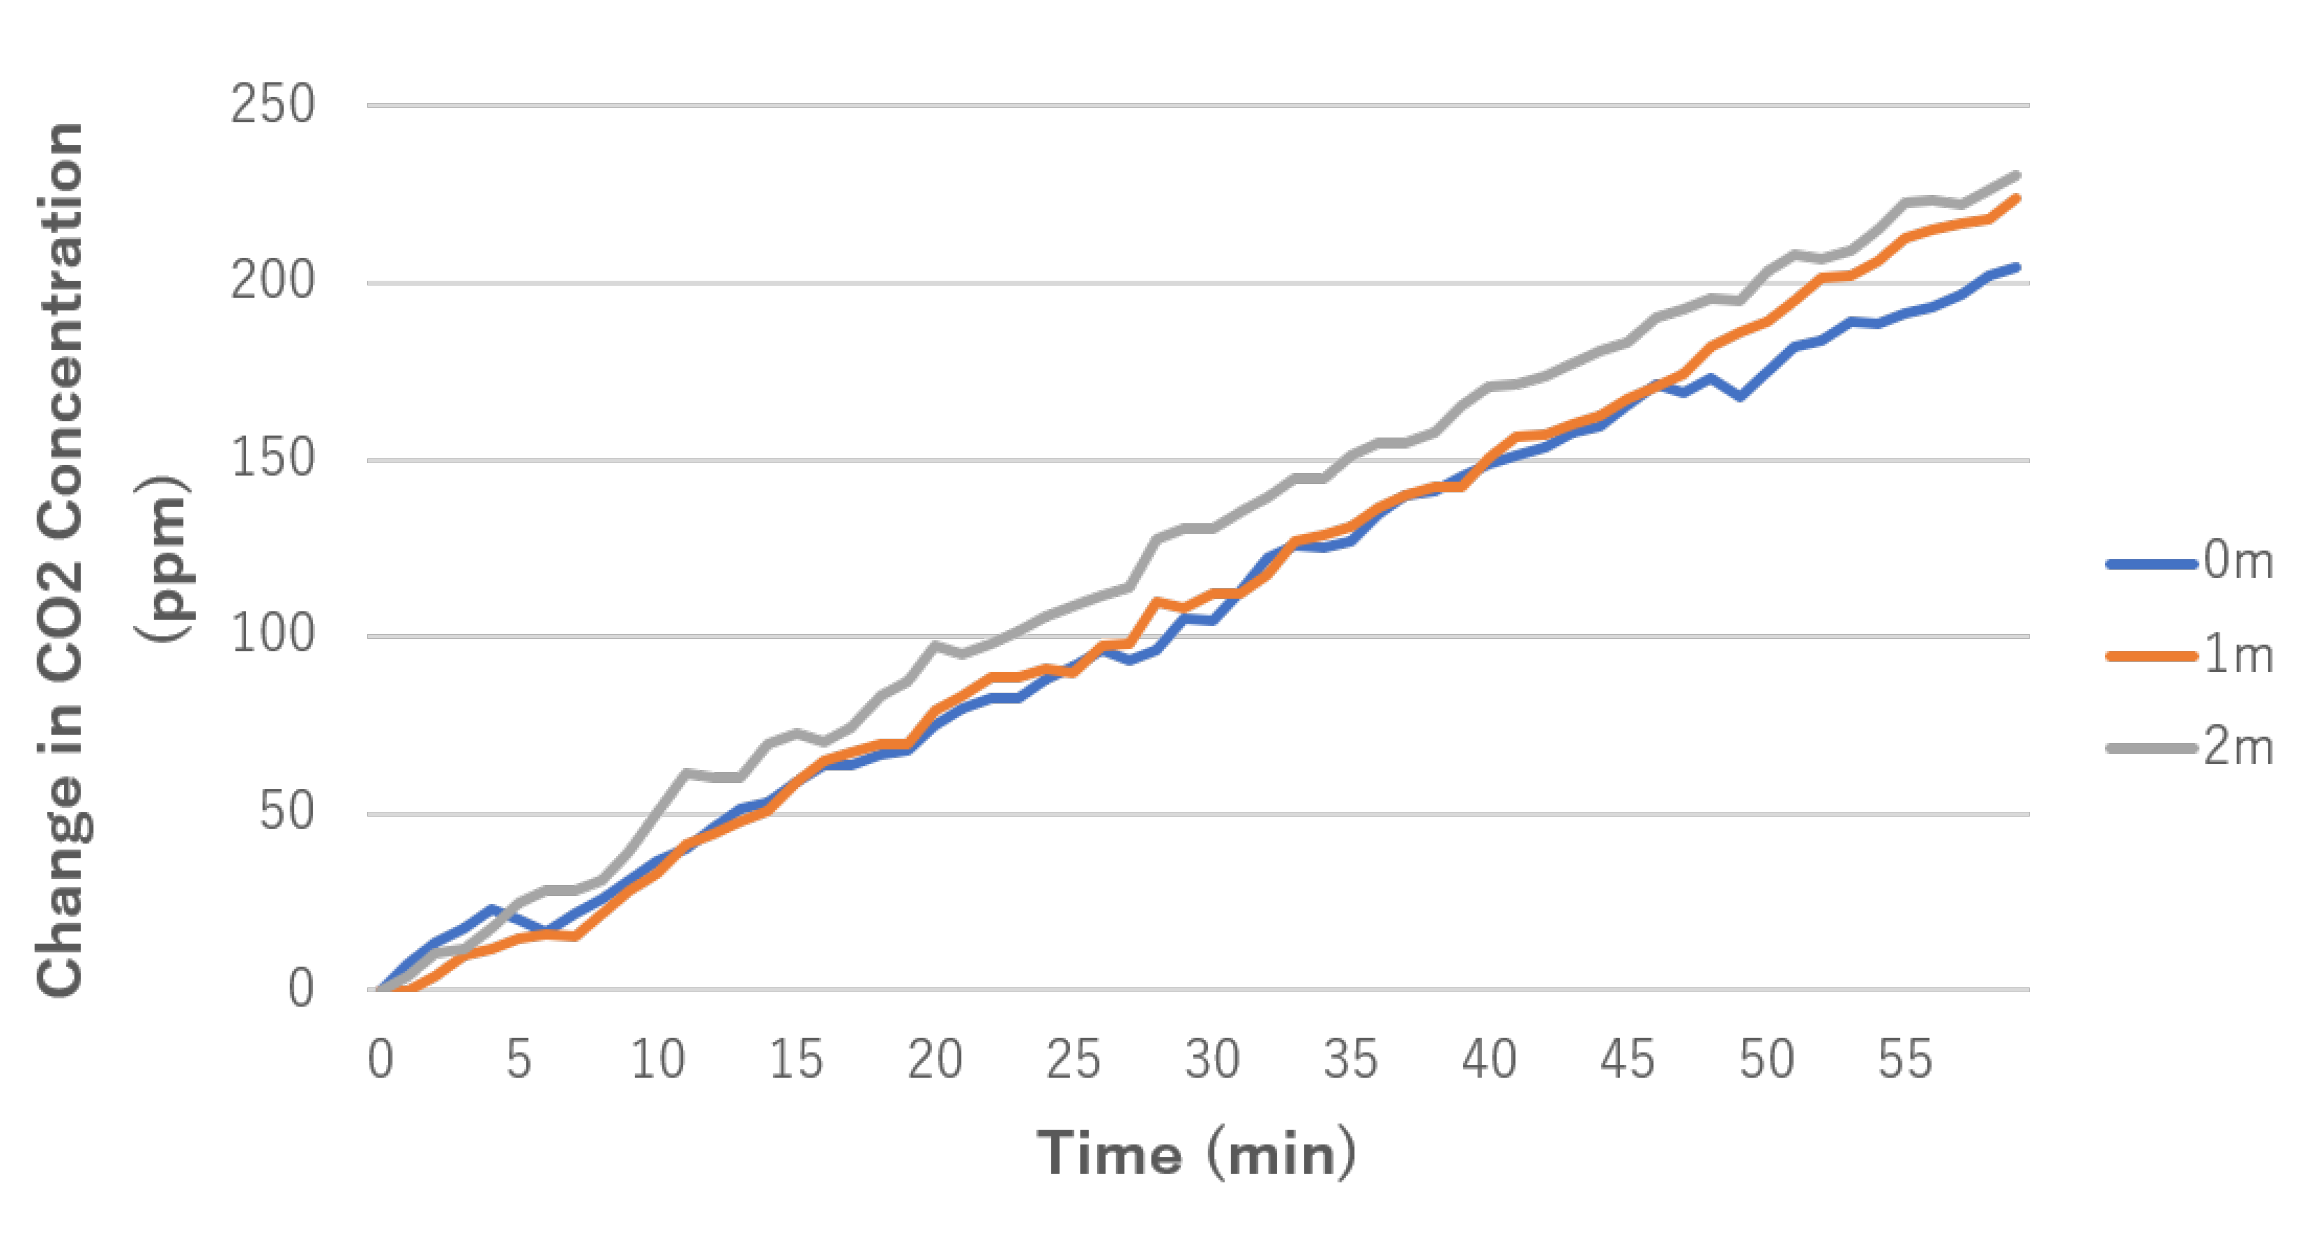
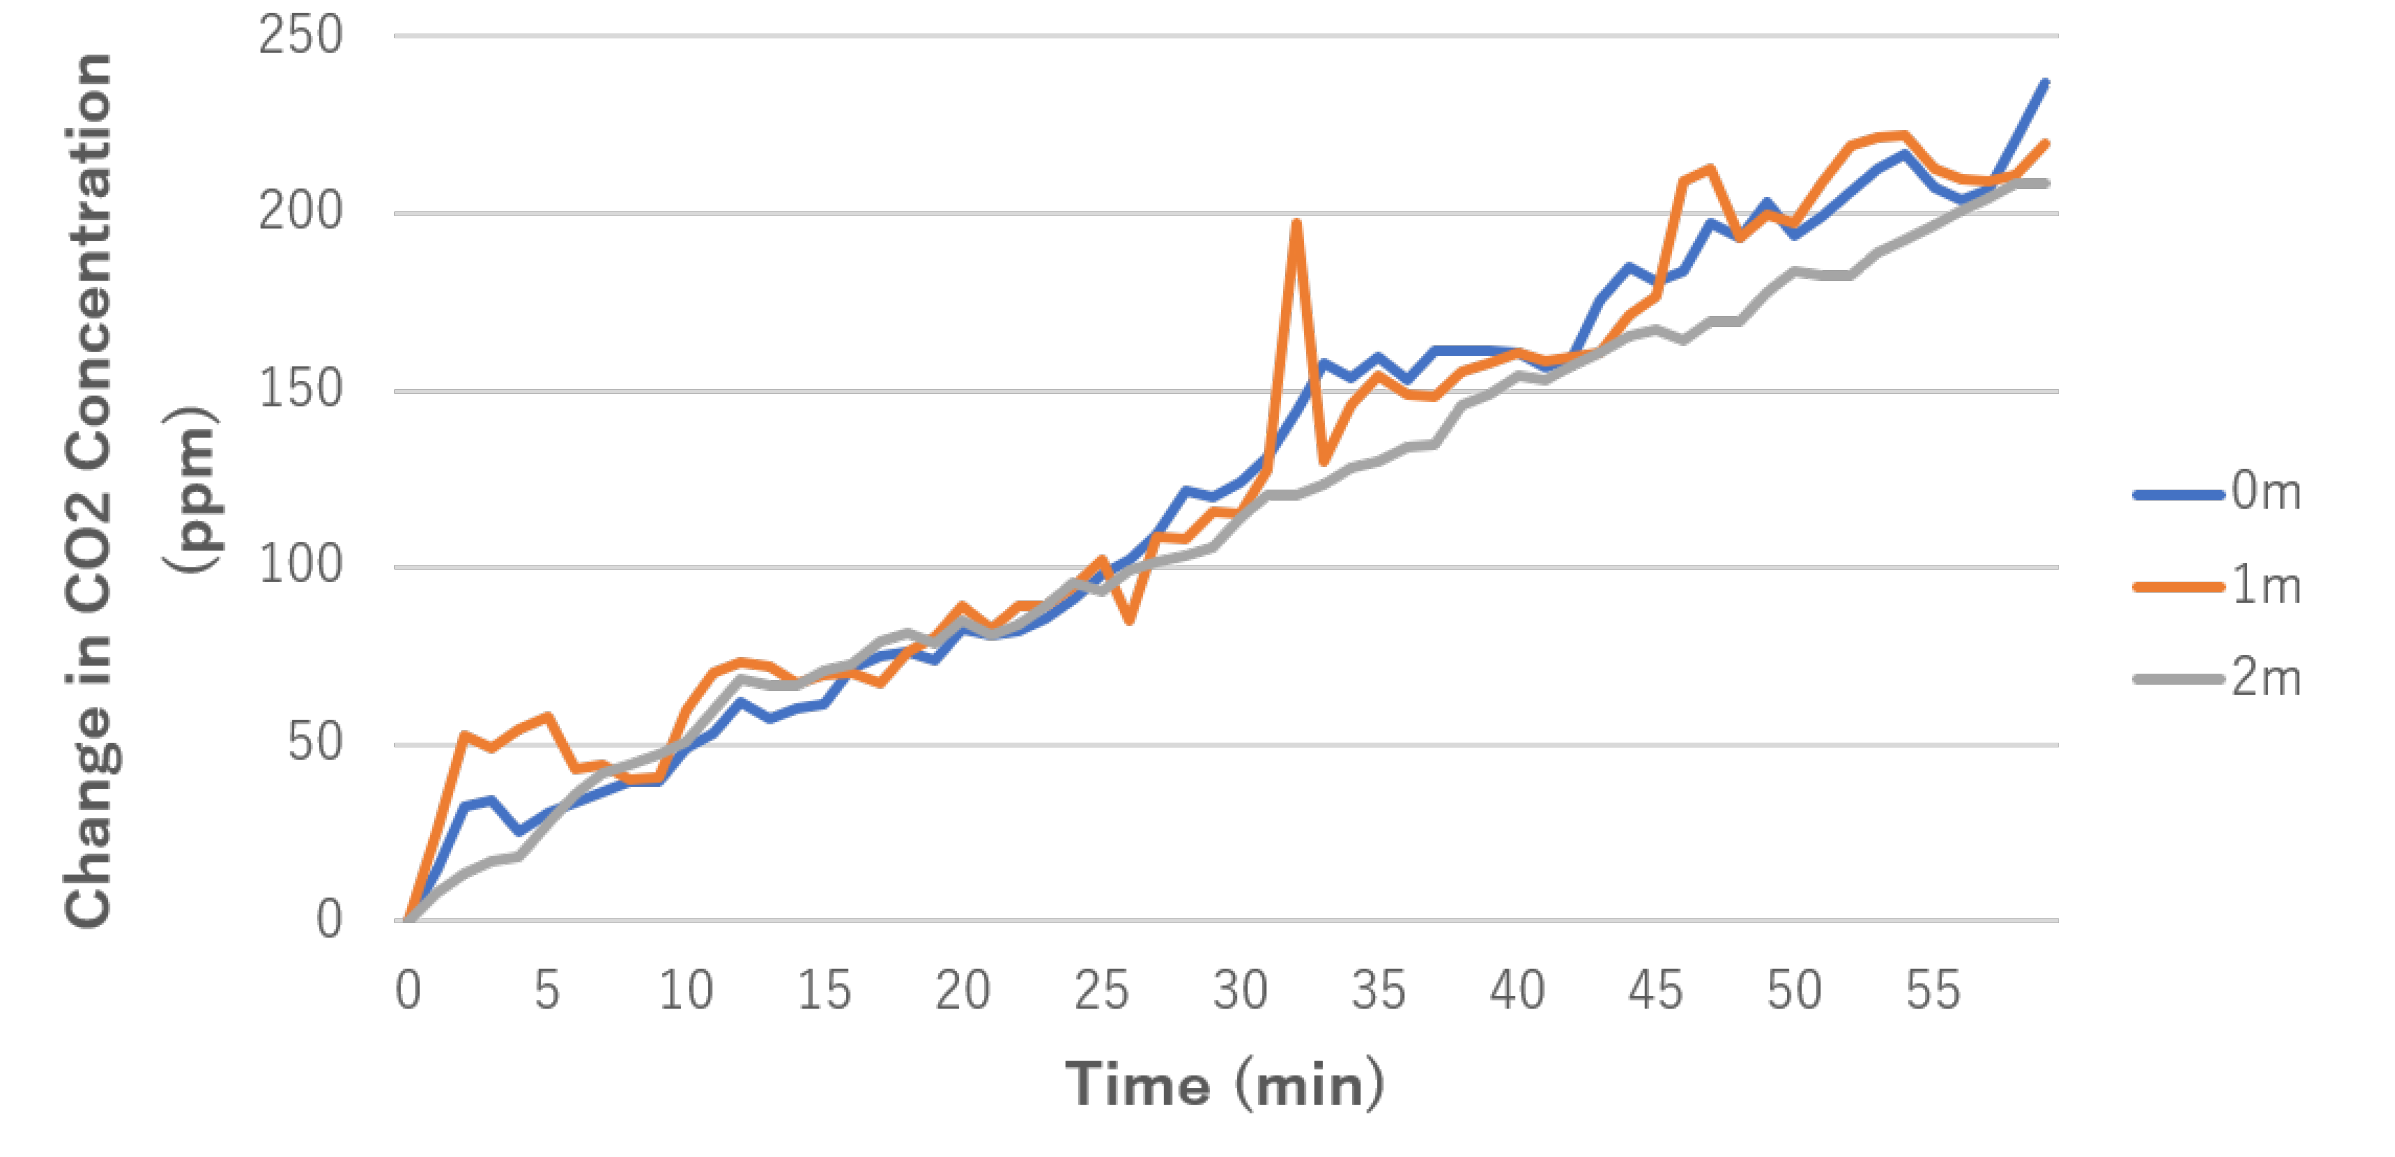
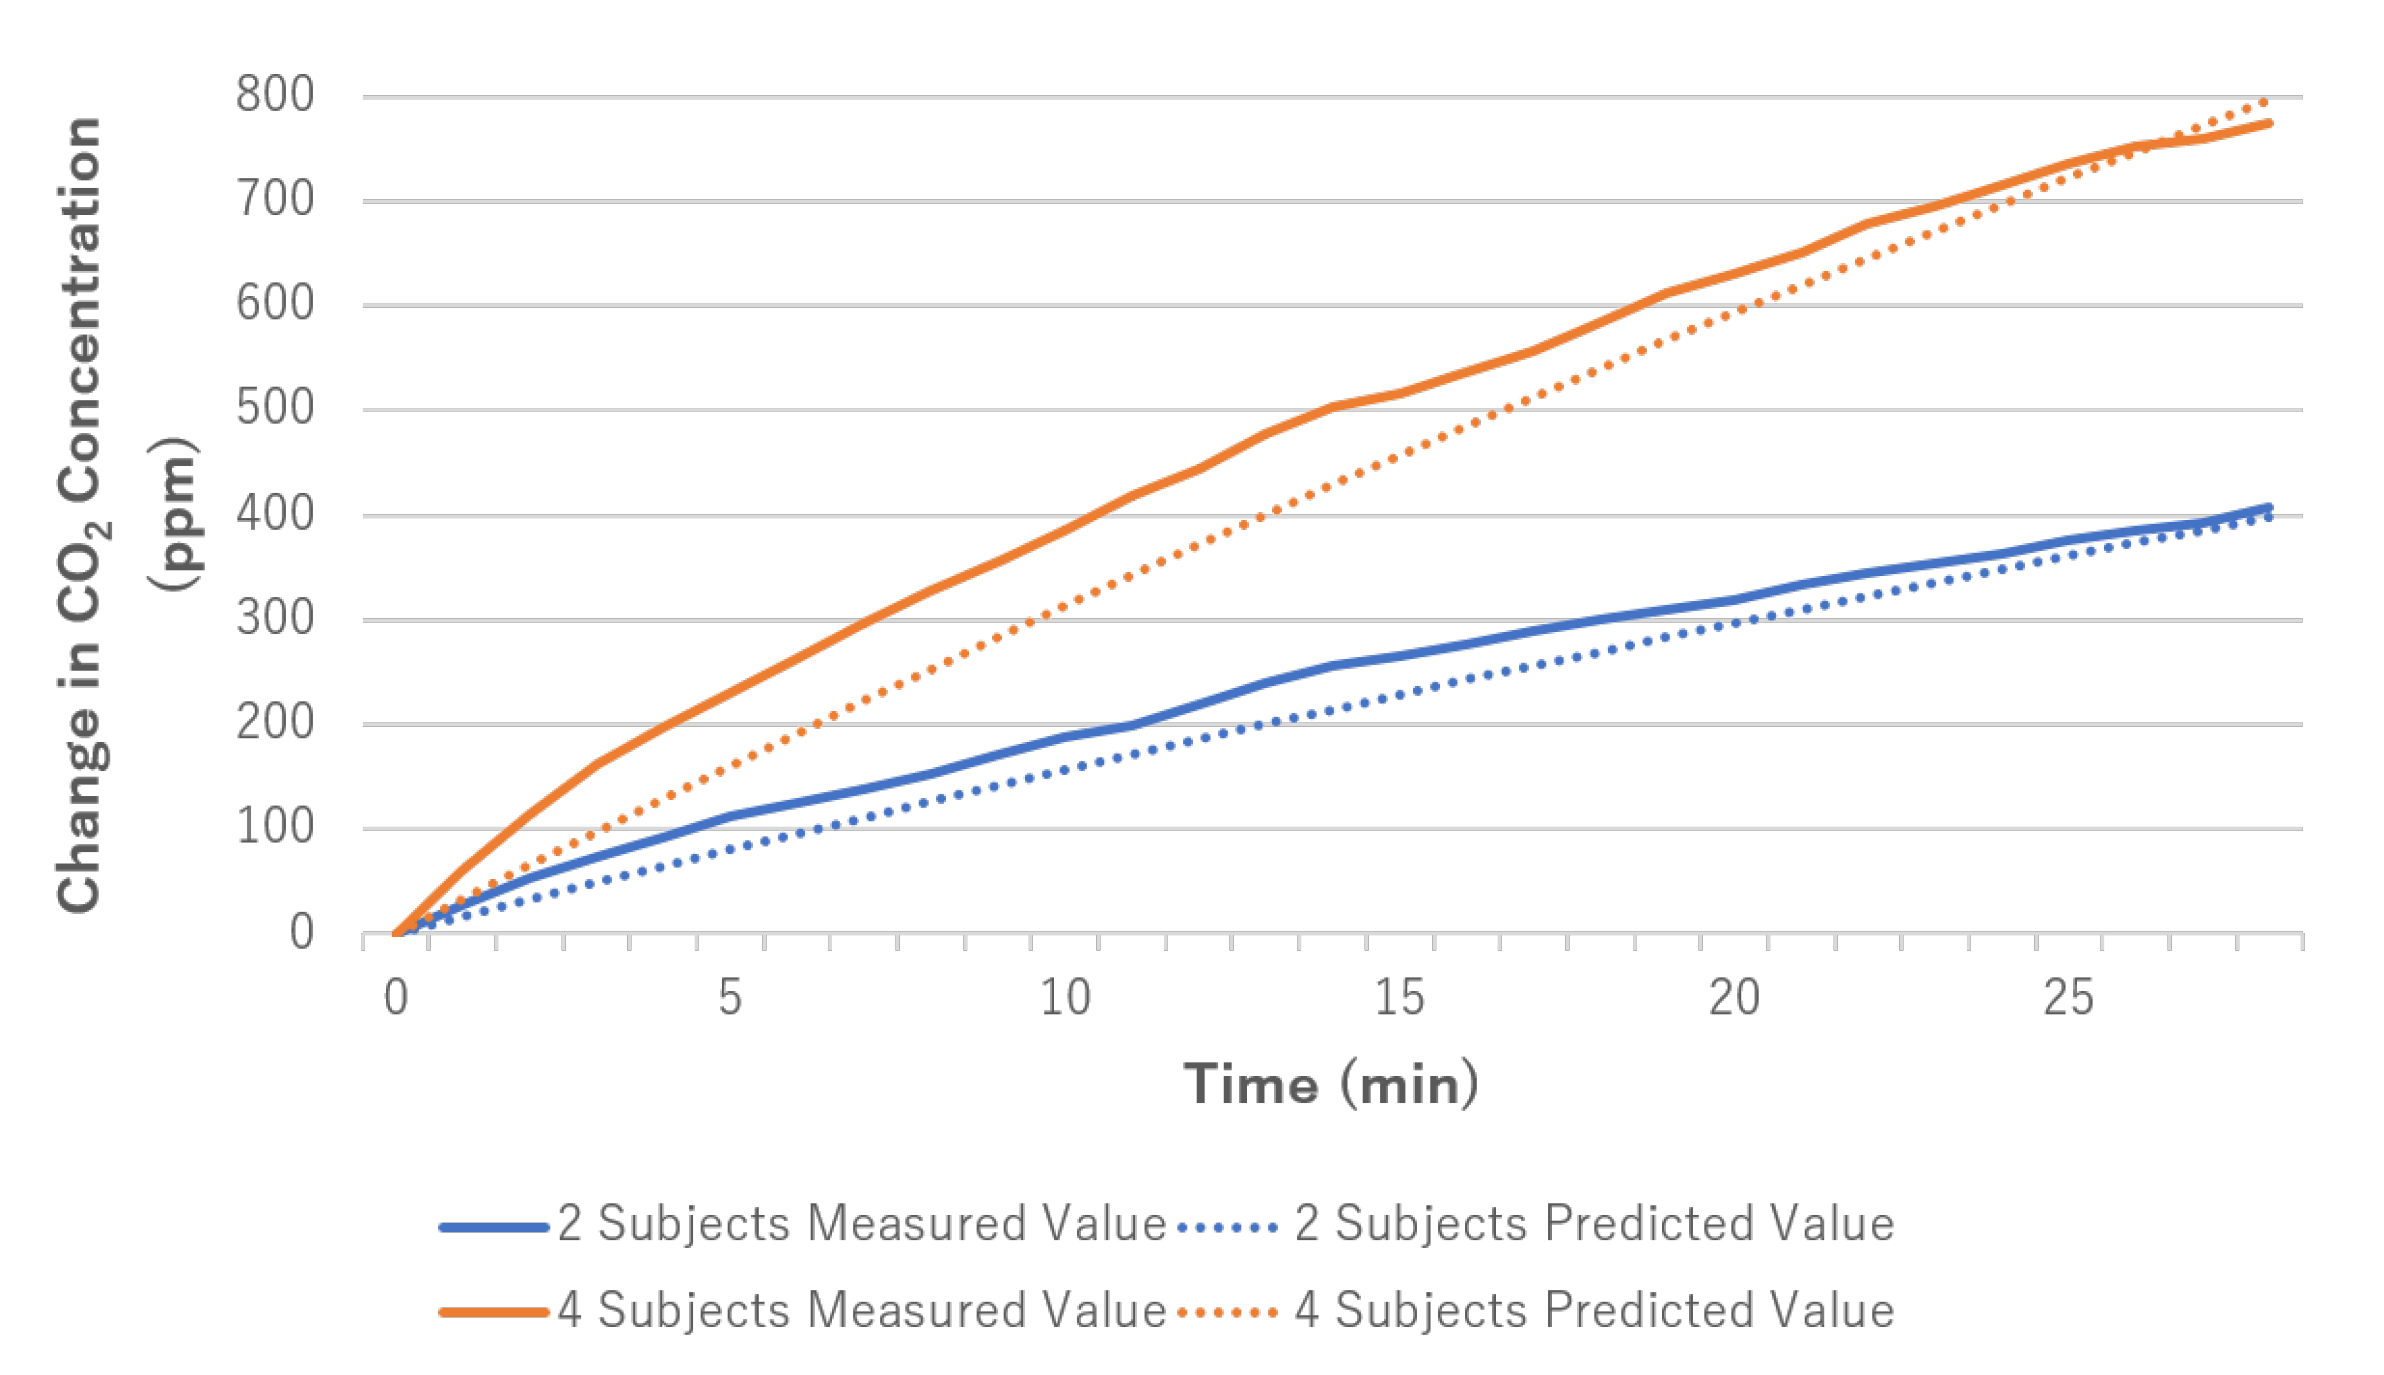
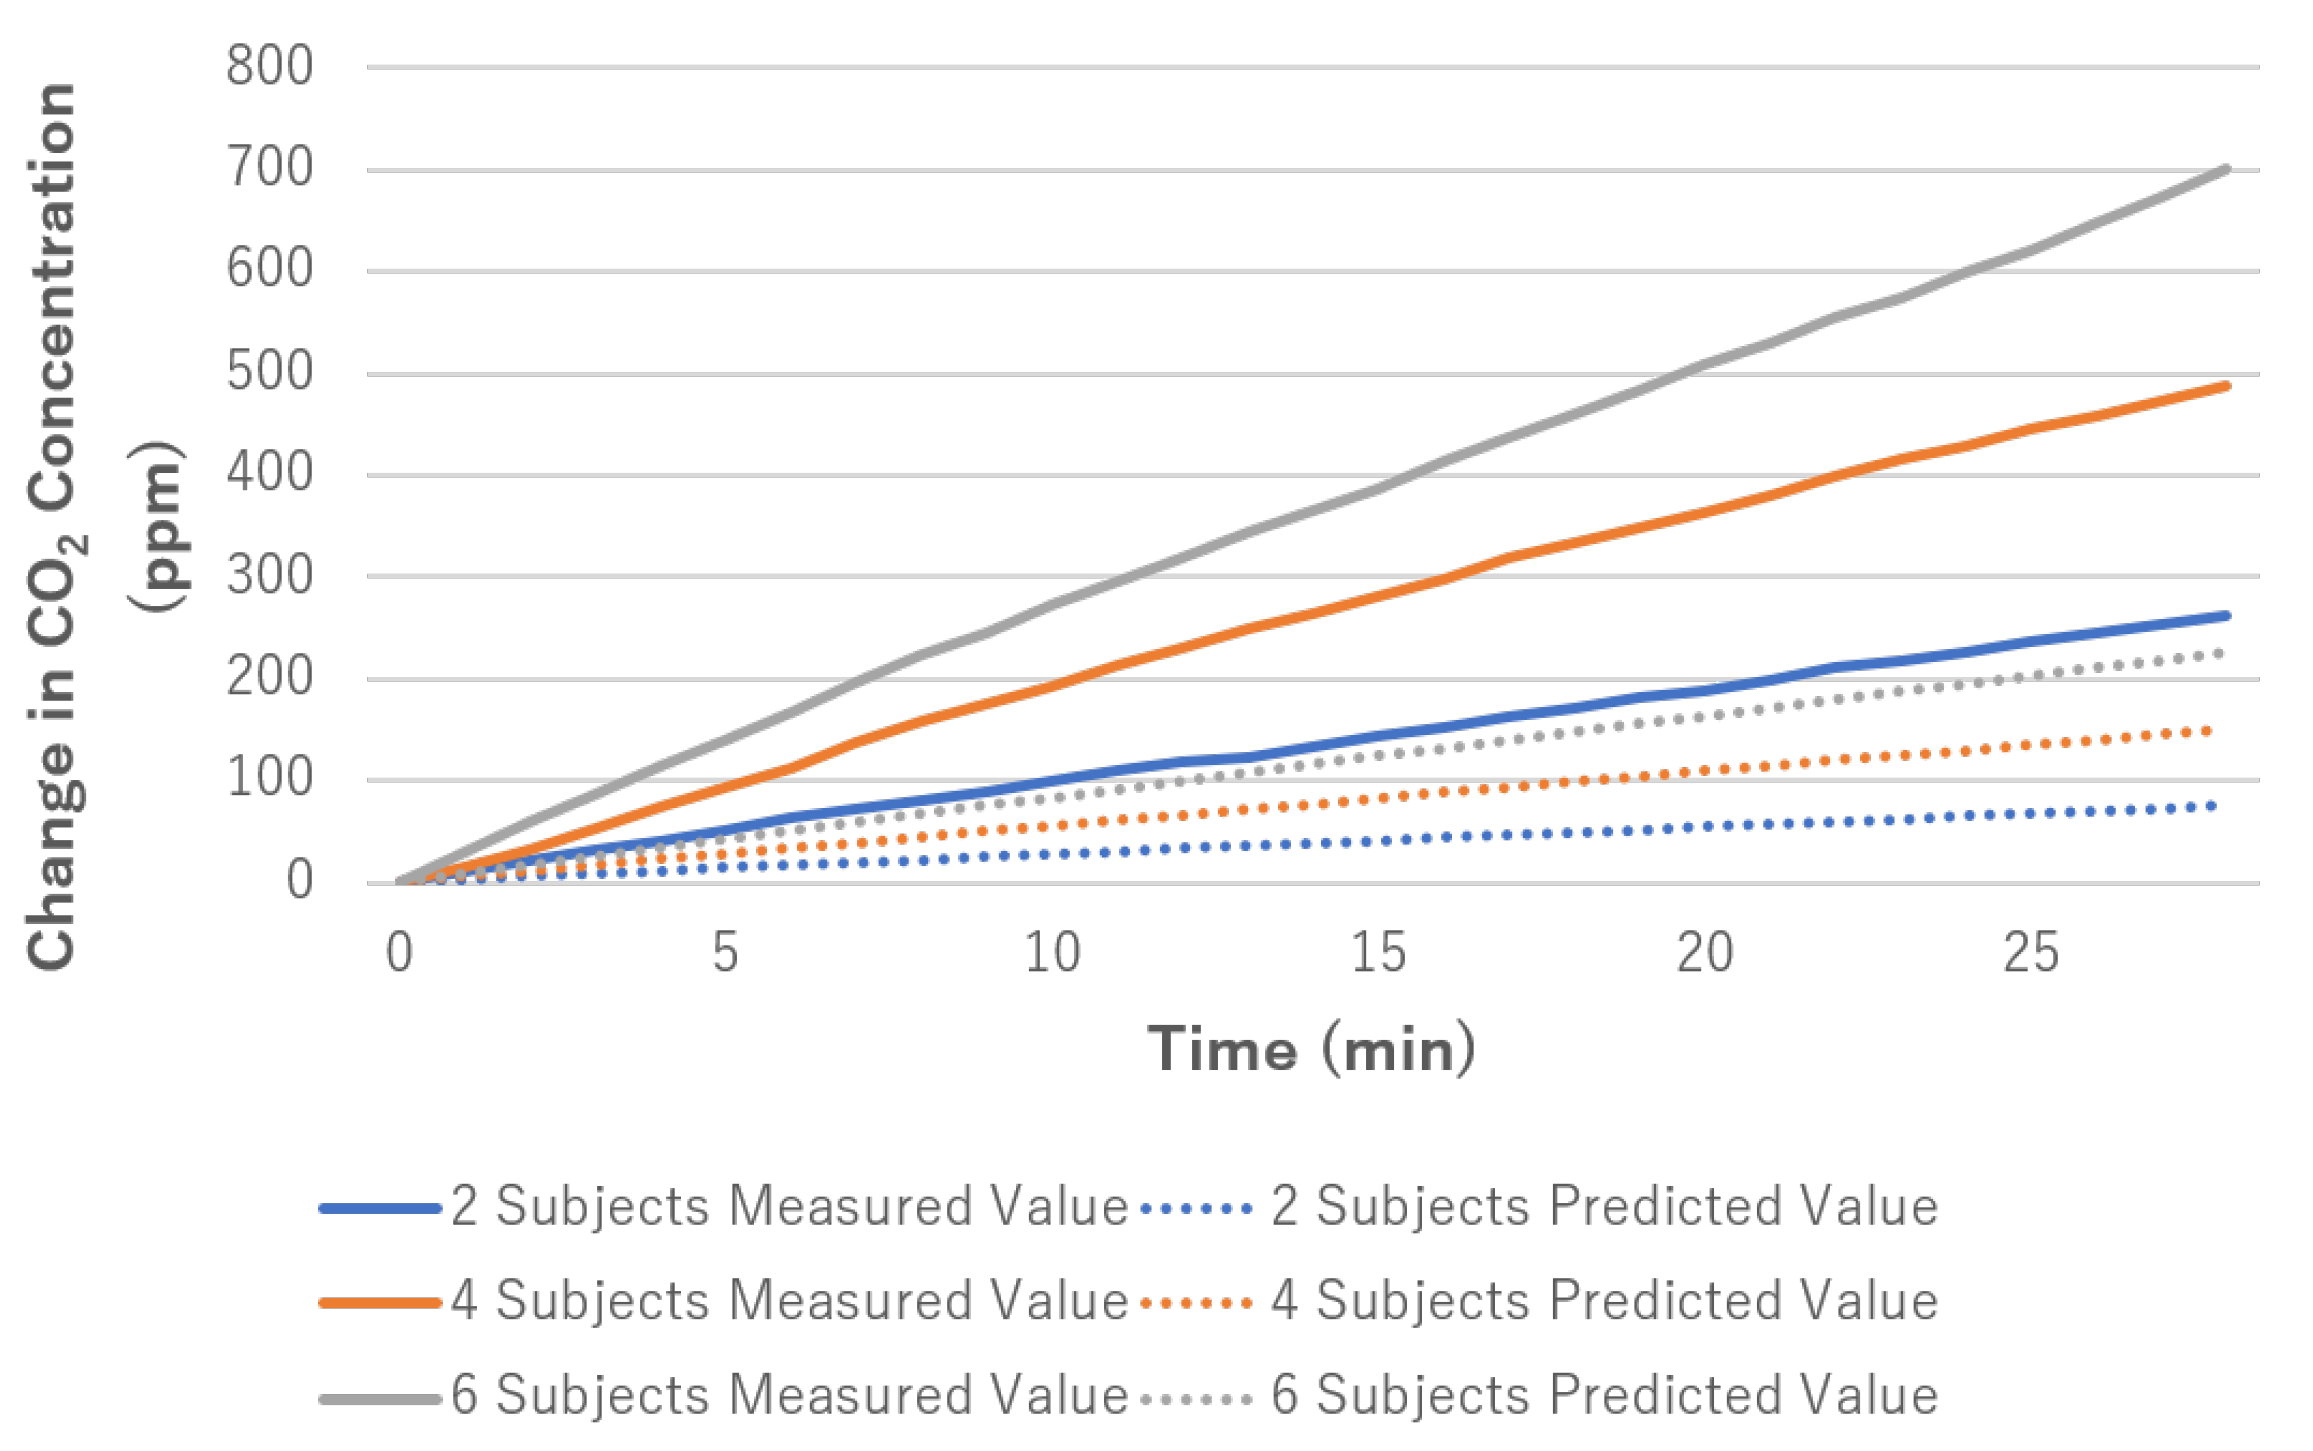
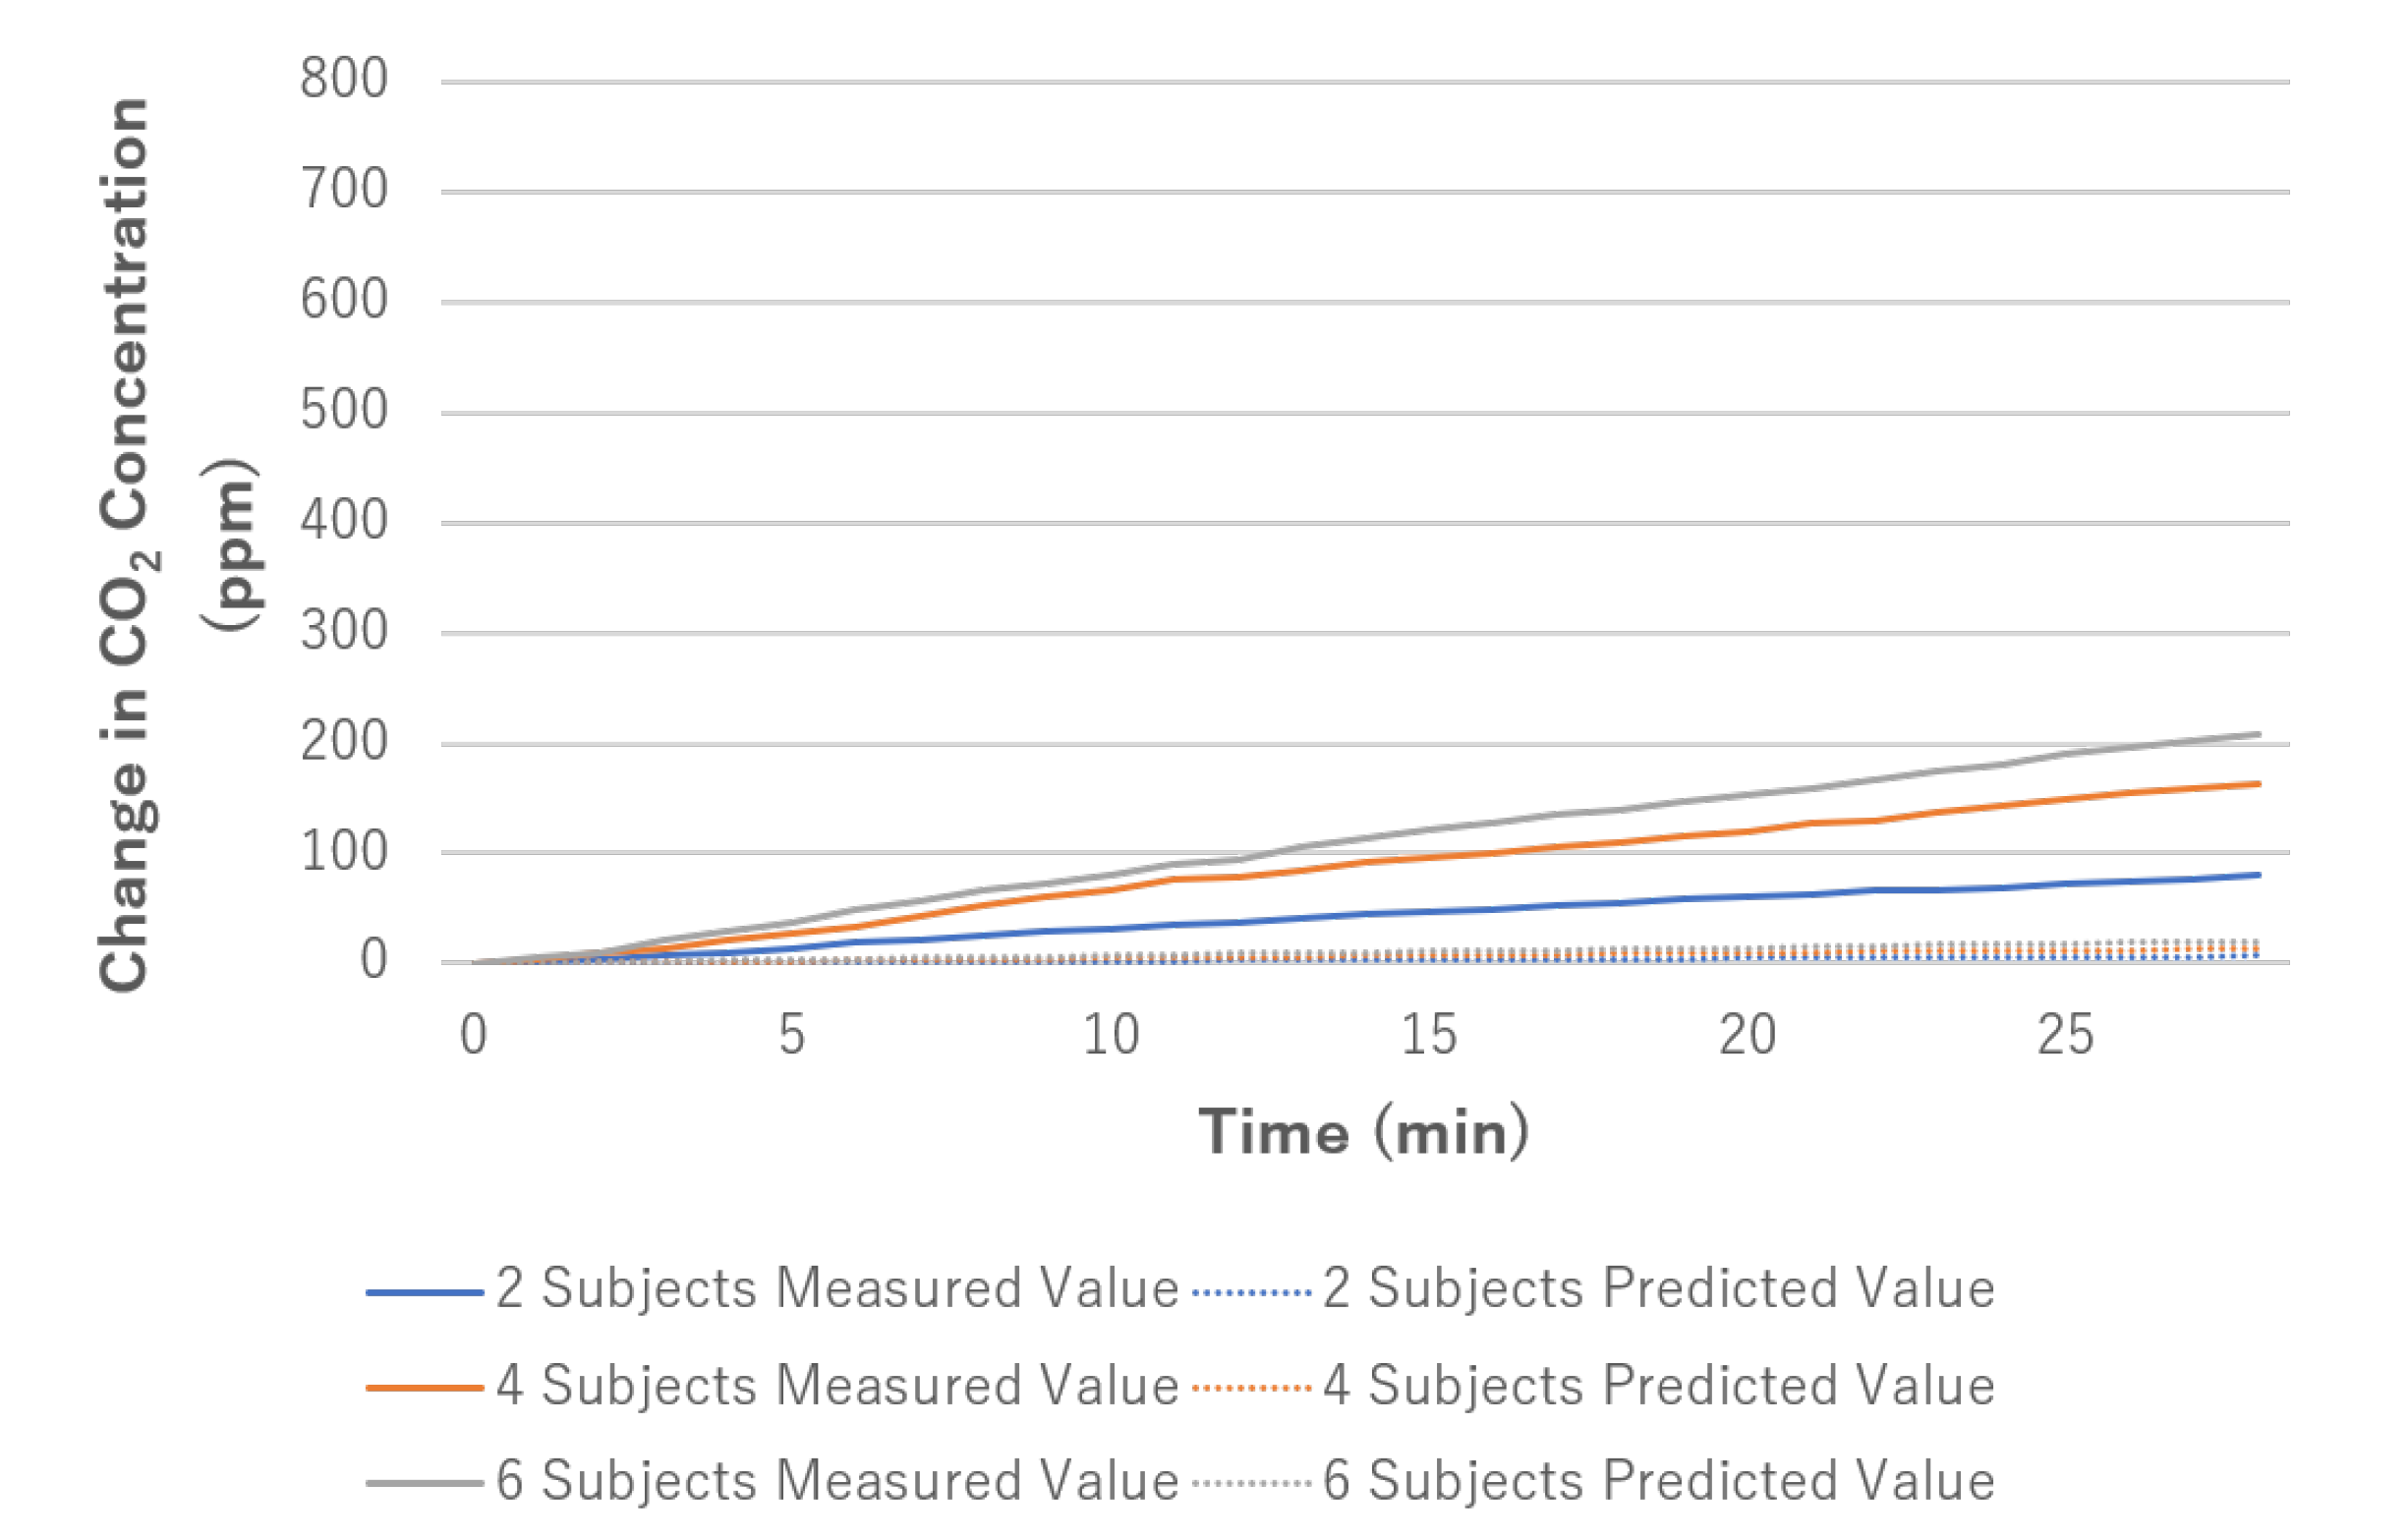
In this chapter, we compare and analyze the change in CO 2 concentration measured by the measurement device and the change in concentration by CO 2 concentration prediction model described in chapter 3, when the room volume and the number of subjects are different. Essentially, the prediction model for gas concentration is predicated on steady-state or instantaneous uniform diffusion, and since human exhalation is not instantaneous uniform diffusion, it does not satisfy that prerequisite. However, from the results of the experiments in Section 4, it was confirmed that the CO 2 concentration in the room increased uniformly within the error range of the sensor under the condition of one-minute intervals. Based on these experimental results, we considered that the concentration in the room increased near the measurement point in the same way as instantaneous uniform diffusion, albeit quasi-uniformly, and applied the prediction model. In the experiment, we measured the increase of CO 2 concentration in three rooms of different sizes (large, medium and small studios) on the same basement level in the same building, where two, four and six subjects waited for the experiment. The duration of the experiment was set at 30 min, and the volume of the studio was 197.0 m 3 for the large studio, 48.5 m 3 for the medium studio and 22.2 m 3 for the small studio, with heights of 3.8 m, 2.5 m and 3 m, respectively. Six measuring devices were installed in the room, and considering the sensor error, the change of CO 2 concentration in the room was defined as the average of four values excluding the two measuring devices with the maximum and minimum increase in the final CO 2 concentration. The measurement device was placed on the floor and its height was set at 0 m. Figure 11 shows the arrangement of the subjects in each room and their distances.
In this experiment, the measurement device is placed under the chair in which the subject is seated, and the distance from the subject is almost non-existent. Four experiments were conducted under each condition, and the mean value of the experiment was used as the experimental result. As in Section 4, the room temperature was measured every minute during the experiment to show that there was no sudden temperature change in the room. In order to increase the CO 2 concentration in the room in a short time and with a small number of subjects, the ventilation openings and gaps between the doors were covered with liner. In addition, the studio used in the experiment was a basement room, and there were no windows or other openings. After the experiment, in order to keep the effect of ventilation volume other than volume and the change in ventilation volume from experiment to experiment small, one of the air conditioning linings and one of the door linings were removed, the air conditioning was activated and the subjects were exited. After confirming that the CO 2 concentration in the room decreased to the same level as the outside air in the building (about 400 to 500 ppm by the measurement device), we started the next experiment. The parameter of the number of ventilation cycles in each studio was determined under the following conditions: a measurement device was installed in each room as shown in Figure 12, the CO 2 concentration in the room was measured and the average value of the CO 2 concentration in the room was taken as the CO 2 concentration in the room.
D1, D2 and D3 were placed on the floor (0 m height), while D4, D5 and D6 were placed at the same location and at different heights (0 m, 1 m and 2 m), and each device was placed about 10 cm away from the nearest wall except for D2. Next, a maximum of 10 subjects were placed in a room and the CO 2 concentration in the room was increased to more than 2000 ppm. Afterward, the subjects left and the door was reattached from the outside. Considering the effect of air inflow due to evacuation, we used the initial CO 2 concentration 30 min after evacuation as the initial concentration and calculated the amount of ventilation compared to the CO 2 concentration one hour after that time. For the calculation, Equation (3) was used from the carbon dioxide method specified in JIS standard A1406, and the number of times each ventilation was determined.
Q = 2.303 V t l o g 10 C 1 C 0 C t C 0
Q is amount of ventilation (m 3 /h), V is room volume (m 3 ), t is elapsed time since the first measurement (h), C 1 is CO 2 concentration in the room at the time of the first measurement (mg/m 3 ), C t is concentration of CO 2 in the room after t hours (mg/m 3 ) and C 0 is CO 2 concentration in the outside air (mg/m 3 ).
Since the CO 2 concentration in the building was stable at about 450 ppm, the unit was converted to C 0 . From Equation (3), each studio’s amount of ventilation was calculated. And the ventilation cycle was calculated from the amount of ventilation and studio volume. The ventilation cycle for each studio was 0.67 cycle/h for small studio, 0.23 cycle/h for medium studio and 0.08 cycle/h for large studio, with the results showing different ventilation cycles depending on the volume. In the calculation of the prediction model, the CO 2 emission of the subject was referred to as the numerical value defined by JIS A 1406, and according to JIS A 1406, the CO 2 emission in seated office work is 0.0129 to 0.0230 m 3 /h. Therefore, the median CO 2 emission per subject was determined to be 0.0180 m 3 /h.

5.3. Results

The results of changing the number of subjects in the large, medium and small studio environments are shown in the graphs from Figure 13, Figure 14 and Figure 15 along with the results of the prediction model. However, when we experimented with six subjects in the small studio, the CO 2 concentration in the room was about to exceed 2000 ppm, and the experiment was stopped because of the effect on the health of the subjects. In all experiments, the average room temperature ranged from 19 to 22 C and did not change more than ±2 C during the experiment. For all graphs in this section, the x-axis shows the time elapsed and the y-axis shows the amount of change in CO 2 concentration from the beginning of the experiment.
As shown in Figure 13, the maximum difference between the predicted and measured values of 41.9 and 77.2 ppm for the two and four subjects, respectively, was similarly increased in the small studio. In contrast, as shown in Figure 14 and Figure 15, there was a clear discrepancy between the measured and predicted values in the studio and large subjects, with a maximum difference of 200 to 500 ppm in the studio and 70 to 200 ppm in the large subjects. Therefore, it is clear that the prediction model deviates from the measured values in the environment with low ventilation cycle.

6. Discussion

From the experimental results in Section 4, it is considered that the effect on CO 2 diffusion and CO 2 concentration in a room is insignificant under any condition of distance from a subject, height difference and position with a subject in a space with CO 2 concentration of about 1000 ppm, and there is no effect on CO 2 diffusion considering the error of the sensor used.
The experimental results in Section 5 indicate that the prediction model is sufficiently useful for predicting CO 2 concentration in a room if the ventilation cycle is at least above 0.67 (cycle/h). According to the Japanese building code, the minimum number of ventilation is 0.5 in a human living space [14]. Therefore, this model is valid for many residential spaces. However, in an environment with low ventilation cycle, the difference from the prediction model increases, so it is necessary to use a measurement device and measure it in real-time.
These results show that when measuring CO 2 concentration in a room under the condition of no external influence, it is not necessary to measure at multiple points at the same time, and it is clear that it is possible to measure CO 2 concentration in a room within the error of the measurement device even if it is localized. In addition, under the condition of measurement at 1-minute intervals and the accuracy of the CO 2 concentration sensor used, we considered that the room concentration increases near the measurement point in the same way as instantaneous uniform diffusion, albeit quasi-uniformly. Seidel’s equation was selected as the prediction model based on the results of this experiment. We compared the measured CO 2 concentration with the predicted value using the prediction model in a room with different volume on the same basement level of the same building, changing the number of subjects. As a result, the prediction model is considered to be sufficiently useful for predicting indoor CO 2 concentrations when the ventilation cycle is above 0.67 (cycle/h), but there is a large discrepancy between the predicted and measured values of the prediction model when the ventilation cycle is low. Therefore, it is necessary to measure CO 2 concentration in real-time using a device to predict CO 2 concentration.

7. Conclusions

To maintain the quality of intellectual activity in human interaction in a room, we analyzed the diffusion tendency of CO 2 in exhaled air and studied a model to predict CO 2 concentration for an automatic ventilation system. First of all, we evaluated the effect of the distance from the sensor, the difference in height and the presence of people in multiple locations on the diffusion of CO 2 in an indoor room, and analyzed the diffusion trend of CO 2 concentration in the room. Furthermore, under the condition that there is a certain error between the accuracy of the CO 2 concentration sensor in a room and the average CO 2 emissions of a typical user, we examined how much the deviation between the prediction model and the measured values by the measurement device occurs. To verify these results, we developed a measurement device equipped with a CO 2 concentration sensor with high accuracy and digital output, and constructed a system that can measure the concentration change in a whole room by simultaneous multi-point sensing, instead of local measurement in a room. From the results, even in a studio with a very small ventilation cycle (0.08 cycle/h), the effect on CO 2 diffusion and CO 2 concentration was insignificant in terms of distance from the subject, height difference and position with the subject, and there was no effect on CO 2 diffusion considering the error of the sensor used. In addition, Seidel’s equation was found to be useful in predicting CO 2 concentration under a sufficient ventilating cycle. In the future, we would like to use different sensors and create a measurement system to further improve the prediction accuracy, and to consider its application to models. If it becomes possible to predict changes in CO 2 concentration due to human breath in a room, it will be possible to maintain the indoor environment in an optimal state to maintain the quality of human intellectual activity by linking it with an automatic ventilation system, etc., before CO 2 concentration interferes with human intellectual activity. These technologies will be effective not only in meeting rooms and offices, but also in various other settings such as homes and schools.

Author Contributions

Data curation, K.M., K.I., J.I. and H.A.; Methodology, M.M.; Software, M.M. and H.A.; Supervision, N.W. and Y.T.; Writing—original draft, M.M.; Writing—review & editing, N.W., K.I., H.A. and Y.T. All authors have read and agreed to the published version of the manuscript.

Funding

This research received no external funding.

Conflicts of Interest

The authors declare no conflict of interest.

References

  1. Ransing, R.S.; Rajput, M. Smart Home for Elderly Care, based on Wireless Sensor Network. In Proceedings of the 2015 International Conference on Nascent Technologies in the Engineering Field (ICNTE), Navi Mumbai, India, 9–10 January 2015; Volume 1, pp. 1–5. [Google Scholar]
  2. Puri, V.; Nayyar, A. Real time smart home automation based on PIC microcontroller, Bluetooth and Android technology. In Proceedings of the 2016 3rd International Conference on Computing for Sustainable Global Development (INDIACom), New Delhi, India, 16–18 March 2016; Volume 1, pp. 1478–1484. [Google Scholar]
  3. Gligorovski, S.; Abbatt, J.P.D. An indoor chemical cocktail. Science 2018, 359, 632–633. [Google Scholar] [CrossRef] [PubMed]
  4. Allen, J.G.; MacNaughton, P.; Satish, U.; Santanam, S.; Vallarino, J.; Spengler, J.D. Associations of Cognitive Function Scores with Carbon Dioxide, Ventilation, and Volatile Organic Compound Exposures in Office Workers, A Controlled Exposure Study of Green and Conventional Office Environments. Environ. Health Perspect. 2016, 124, 805–812. [Google Scholar] [CrossRef] [PubMed] [Green Version]
  5. Satish, U.; Mendell, M.J.; Shekhar, K.; Hotchi, T.; Sullivan, D.; Streufert, S.; Fisk, W.J. Is CO2 an indoor pollutant? Direct effects of low-to-moderate CO2 concentrations on human decision-making performance. Environ. Health Perspect 2012, 120, 1671–1677. [Google Scholar] [CrossRef] [PubMed] [Green Version]
  6. Mott, K.A. Sensing of atmospheric CO2 by plants, Plant. Cell Environ. 1990, 13, 731–737. [Google Scholar] [CrossRef]
  7. Kawasumi, K.; Iwai, M. Non-Contact Concentration-Level Estimation System Using Multiple-Sensors. In Proceedings of the IPSJ SIG Technical Report, Okinawa, Japan, 23–24 January 2017; Volume 2017-HCI-171, No. 35. pp. 1–7. (In Japanese). [Google Scholar]
  8. Rajkumar, D.M.N.; Sruthi, M.; Kumar, D.V.V. IOT Based Smart System for Controlling CO2 Emission. Int. J. Sci. Res. Comput. Sci. Eng. Inf. Technol. 2017, 2, 284–288. [Google Scholar]
  9. Eusebio, L.; Derudi, M.; Capelli, L.; Nano, G.; Sironi, S. Assessment of the Indoor Odour Impact in a Naturally Ventilated Room. Sensors 2017, 17, 778. [Google Scholar] [CrossRef] [PubMed] [Green Version]
  10. Batoga, P.; Badura, M. Dynamic of Changes in Carbon Dioxide Concentration in Bedrooms. Procedia Eng. 2013, 57, 175–182. [Google Scholar] [CrossRef] [Green Version]
  11. CDM7160 CO2 Sensor Module Technical Information. Available online: https://cdn.sos.sk/productdata/52/08/dadc87c9/cdm7160.pdf (accessed on 25 June 2020).
  12. SIBATA SCIENTIFIC TECHNOLOGY LTD. IES-5000 Technical Information. Available online: https://www.sibata.co.jp/products/products-33651/?c=8 (accessed on 25 June 2020).
  13. Miller, J.N.; Miller, J.C. Statistics and Chemometrics for Analytical Chemistry, 6th ed.; Prentice Hall: Toronto, ON, Canada, 2010; Chapter 5. [Google Scholar]
  14. Sekine, Y. Chemical Substance in the House Risks and Benefits, 1st ed.; Tokyo Denki University Press: Tokyo, Japan, 2015; pp. 20–29. (In Japanese) [Google Scholar]
Figure 1. System concept diagram.
Applsci 10 04631 g001
Figure 2. Measurement device appearance.
Applsci 10 04631 g002
Figure 3. Position of subjects and measurement devices in Case 1.
Applsci 10 04631 g003
Figure 4. Position of subjects and measurement devices in Case 2.
Applsci 10 04631 g004
Figure 5. Position of subjects and measurement devices in Case 3a and Case 3b.
Applsci 10 04631 g005
Figure 6. CO 2 concentration change in Case1. DX means Device ID.
Applsci 10 04631 g006
Figure 7. Change in CO 2 concentration at 1 m away from subjects, in Case 2.
Applsci 10 04631 g007
Figure 8. Change in CO 2 concentration at 8 m away from subjects, in Case 2.
Applsci 10 04631 g008
Figure 9. Change in CO 2 concentration in Case3a. DX means Device ID.
Applsci 10 04631 g009
Figure 10. Change in CO 2 concentration in Case3b. DX means Device ID.
Applsci 10 04631 g010
Figure 11. Position of subjects and measurement devices in three conditions.
Applsci 10 04631 g011
Figure 12. Position of measurement devices in the ventilation measurement experiment.
Applsci 10 04631 g012
Figure 13. Predicted and measured values of CO 2 concentration in the small studio (2 and 4 subjects).
Applsci 10 04631 g013
Figure 14. Predicted and measured values of CO 2 concentration in the medium studio (2, 4, 6 subjects).
Applsci 10 04631 g014
Figure 15. Predicted and measured values of CO 2 concentration in the large studio (2, 4, 6 subjects).
Applsci 10 04631 g015
Table 1. Change in CO 2 concentration at the end of Case 3.
Measurement Devices IDCase 3a (ppm)Case 3b (ppm)
D1221.0241.0
D2254.0246.5
D3241.5251.5
D4269.0271.0
D5243.5237.0
D6224.5214.0
D7265.0294.5
D8286.5257.0
D9255.5236.0
D10284.5287.0
D11263.5276.0
D12274.5282.5

