Quality Control of the Continuous Hot Pressing Process of Medium Density Fiberboard Using Fuzzy Failure Mode and Effects Analysis

 , ,
, ,  , , ,
, , ,  and
and
Abstract
1. Introduction
- (1)
- The deviation grade information of continuous heat pressing of medium-density fiberboard analyzed by the fuzzy FMEA method is more accurate than the original FMEA method. For comparison, the decision matrix logic OR operation result of the Hamming coding analysis is used to verify the proposed method.
- (2)
- Through the fuzzy FMEA method used to analyze the deviation level information, the solution can be found more quickly and the problem can be corrected and rectified in time.
2. Methodology
2.1. Related Work
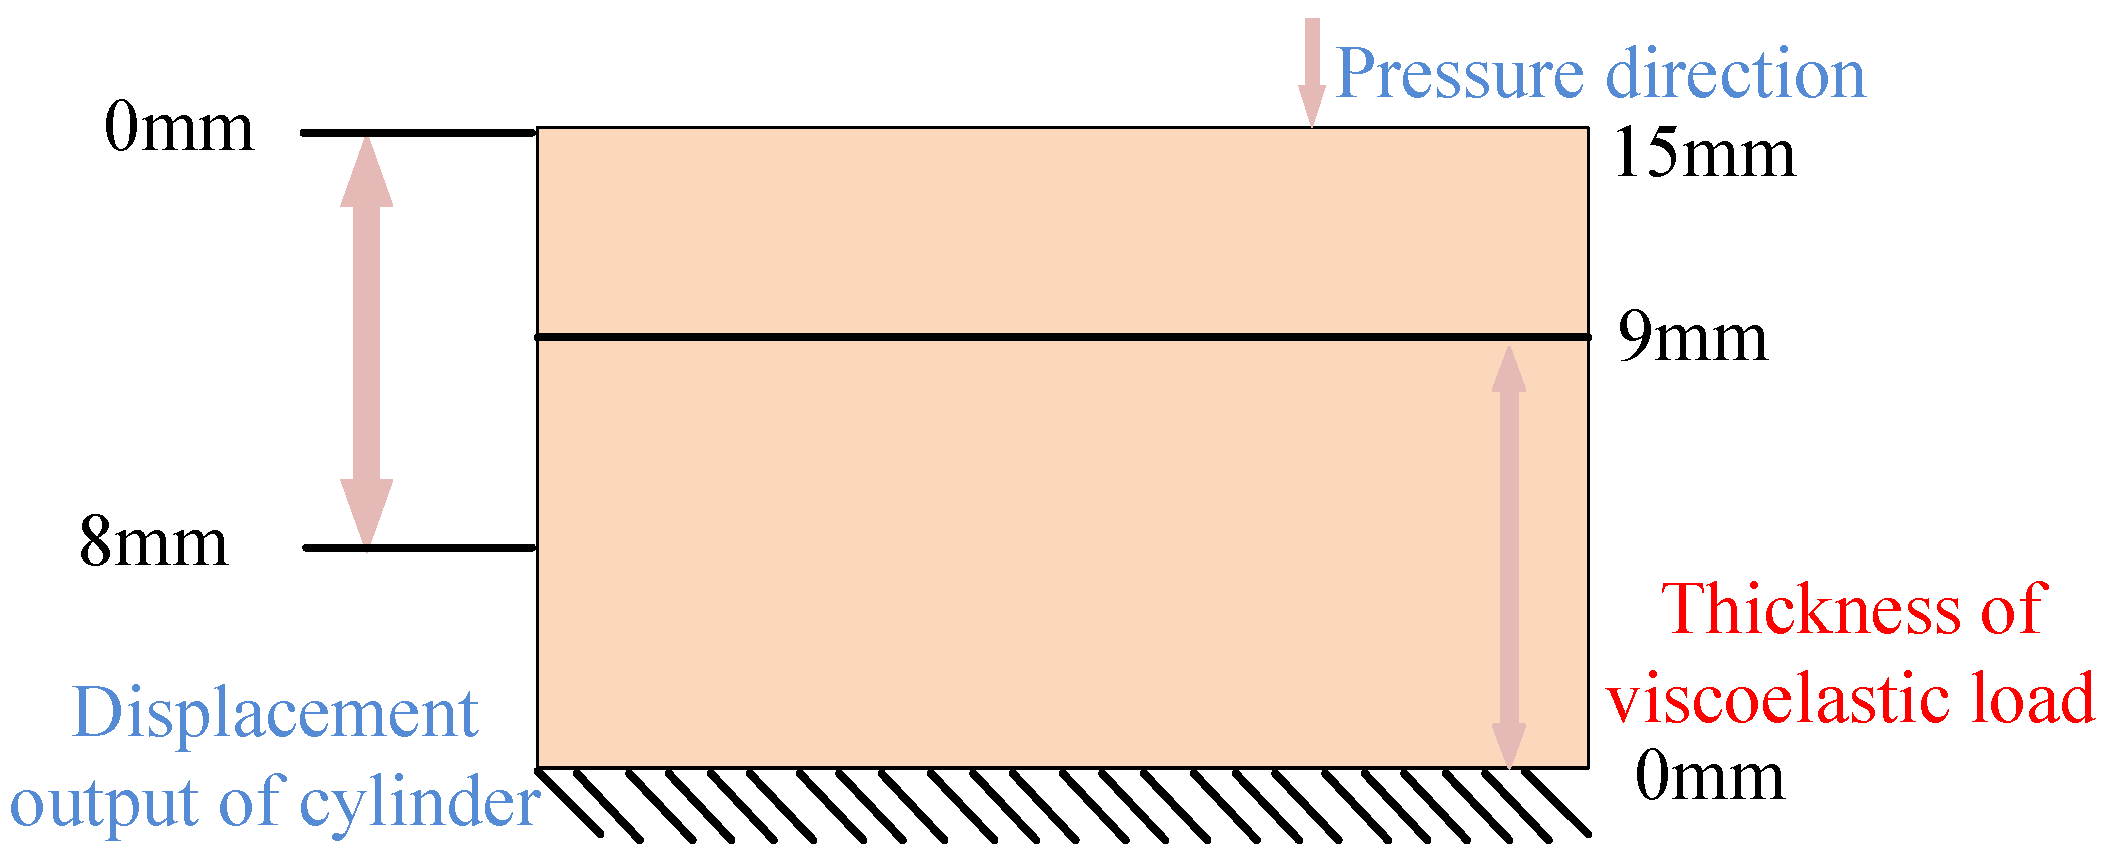
2.2. MDF Processing Mechanism
2.3. FMEA of Continuous Hot Pressing
2.4. Fuzzy FMEA-Based MDF Continuous Pressing
3. Experiments and Analysis
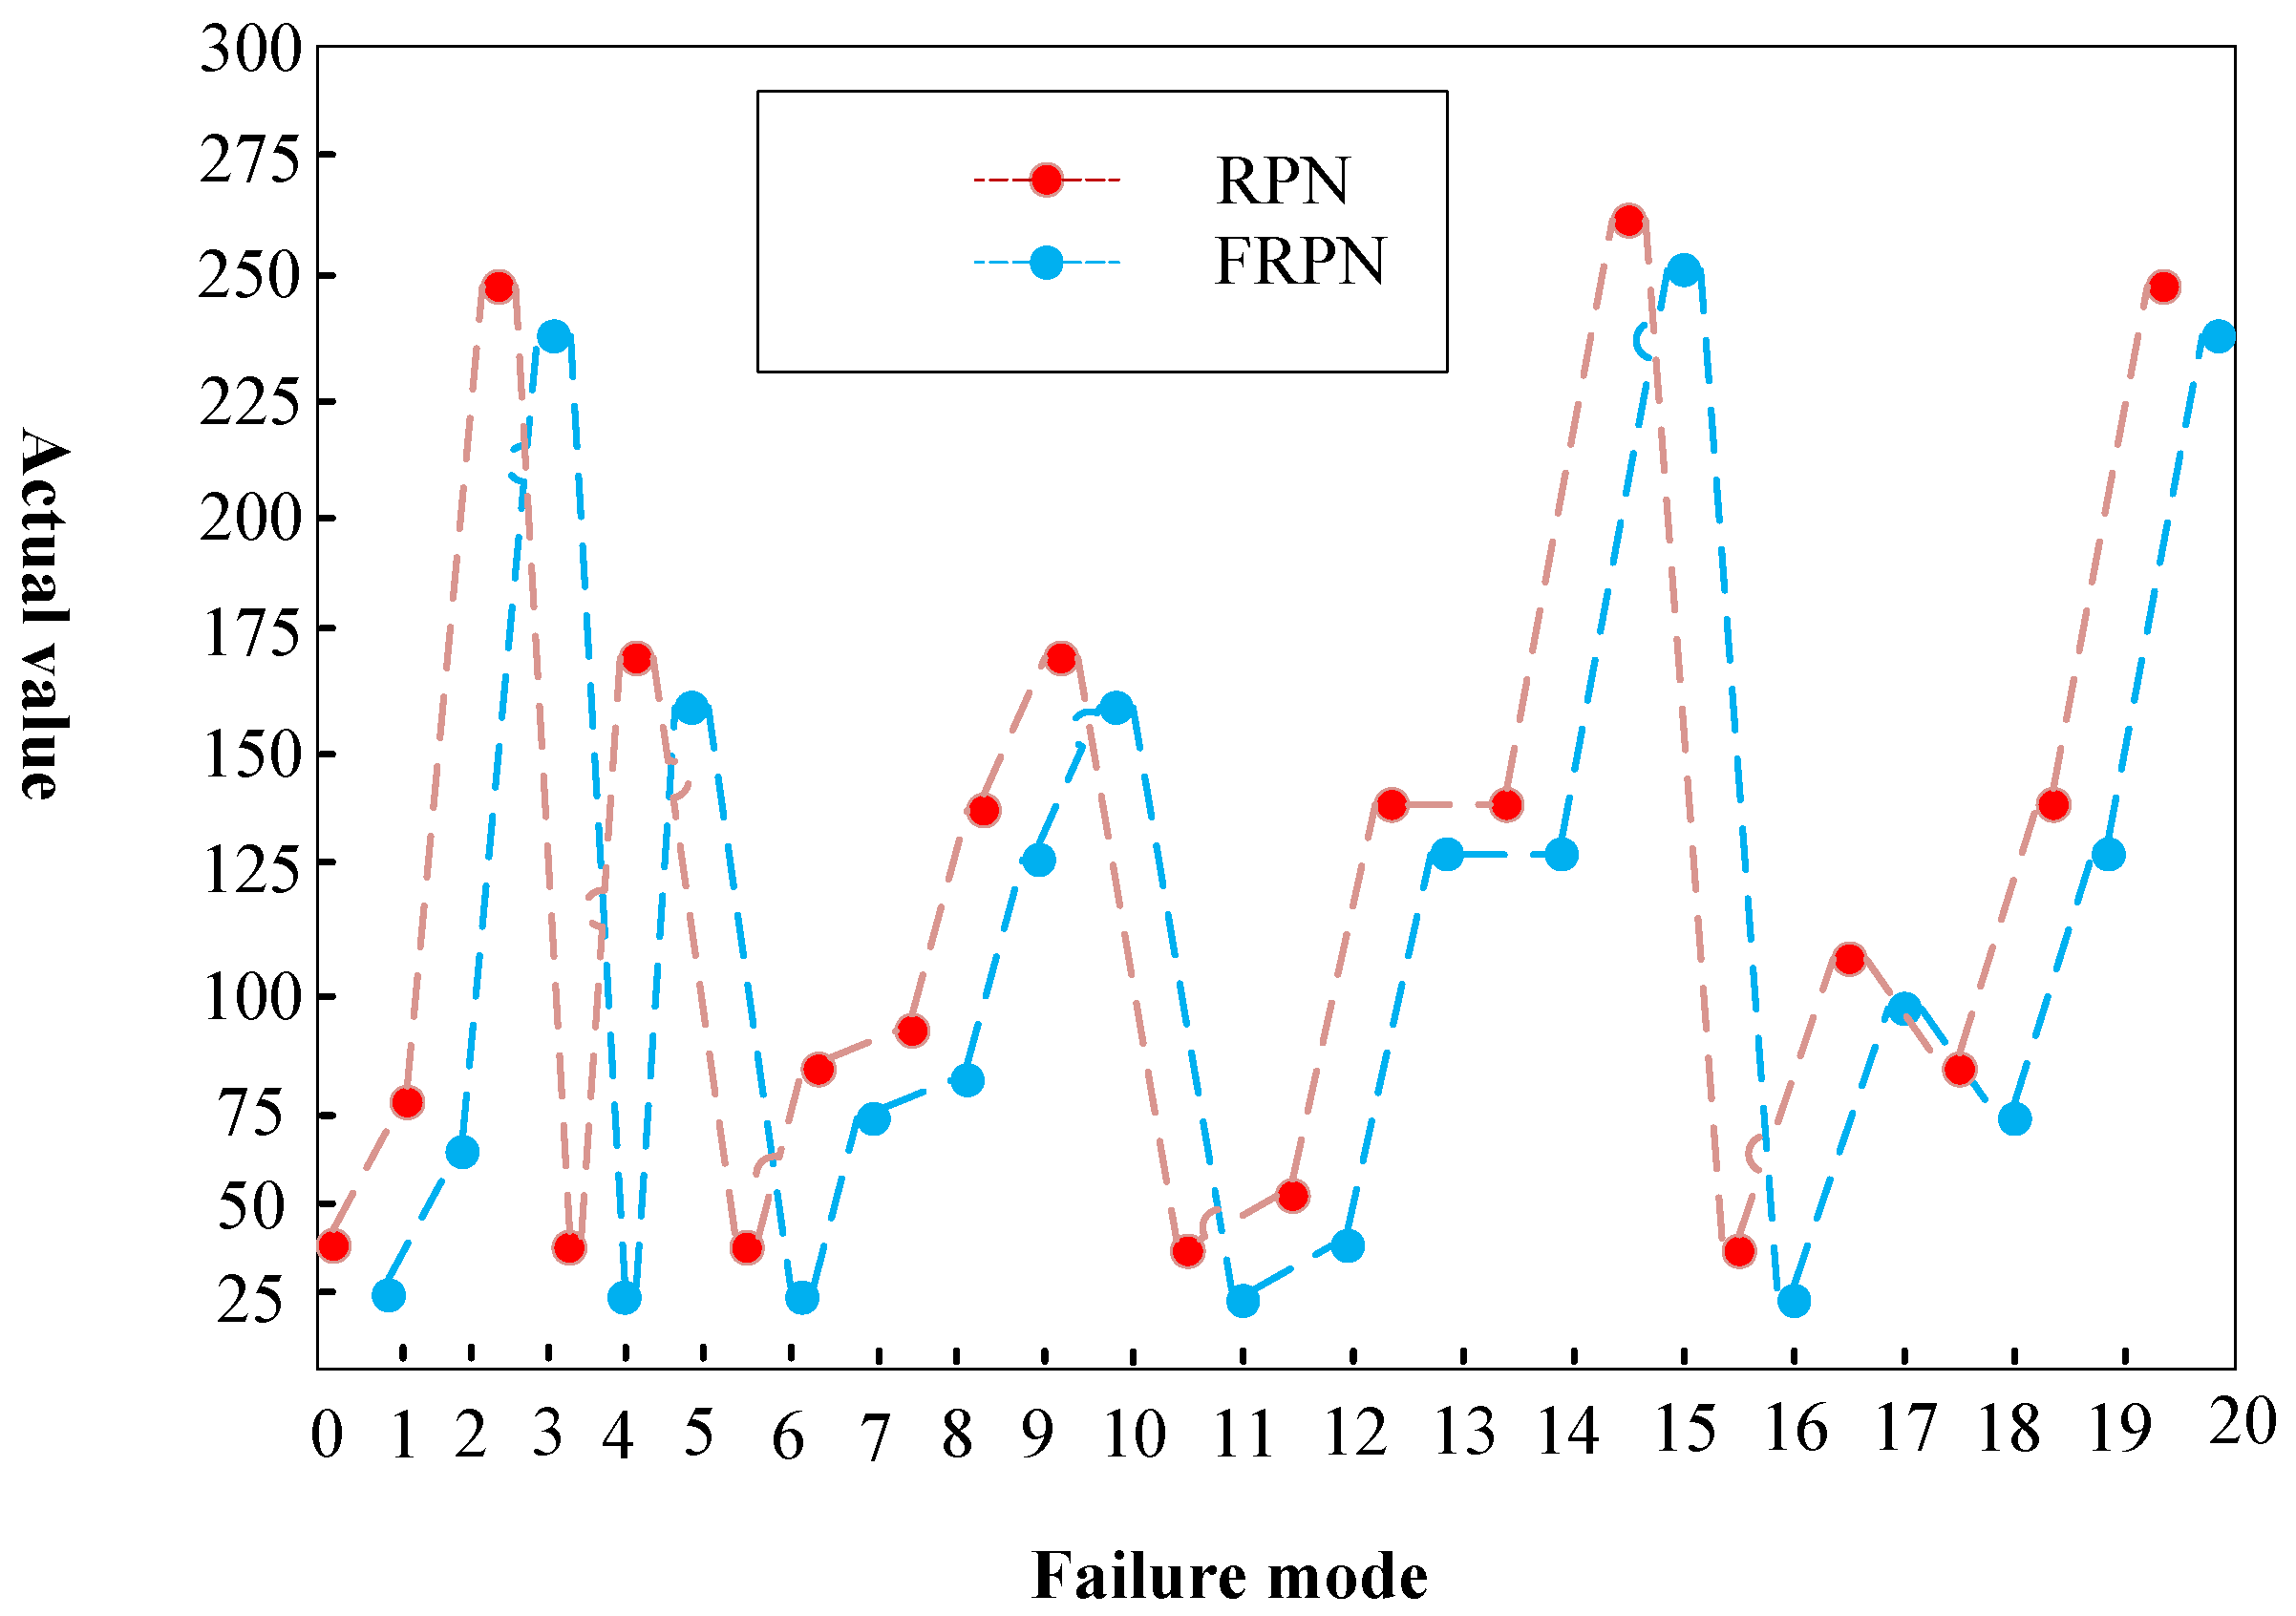
3.1. RPN Compared with FRPN
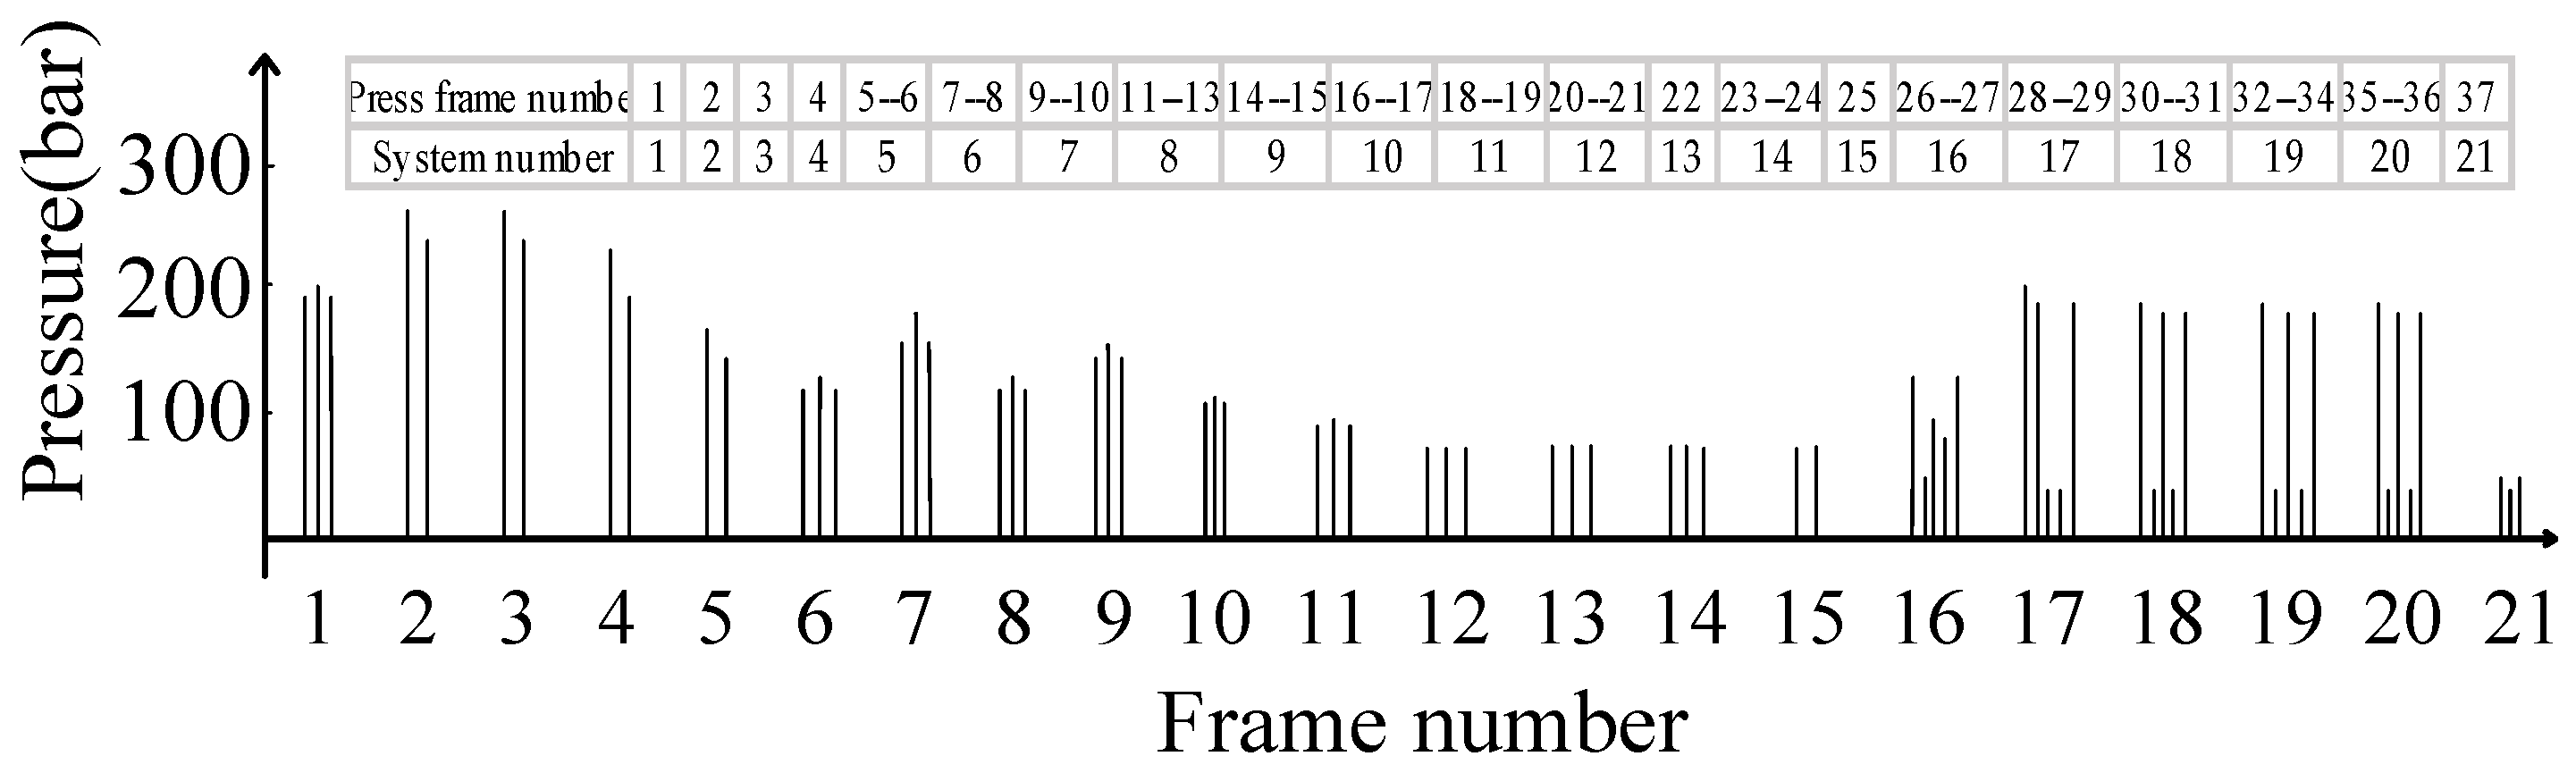
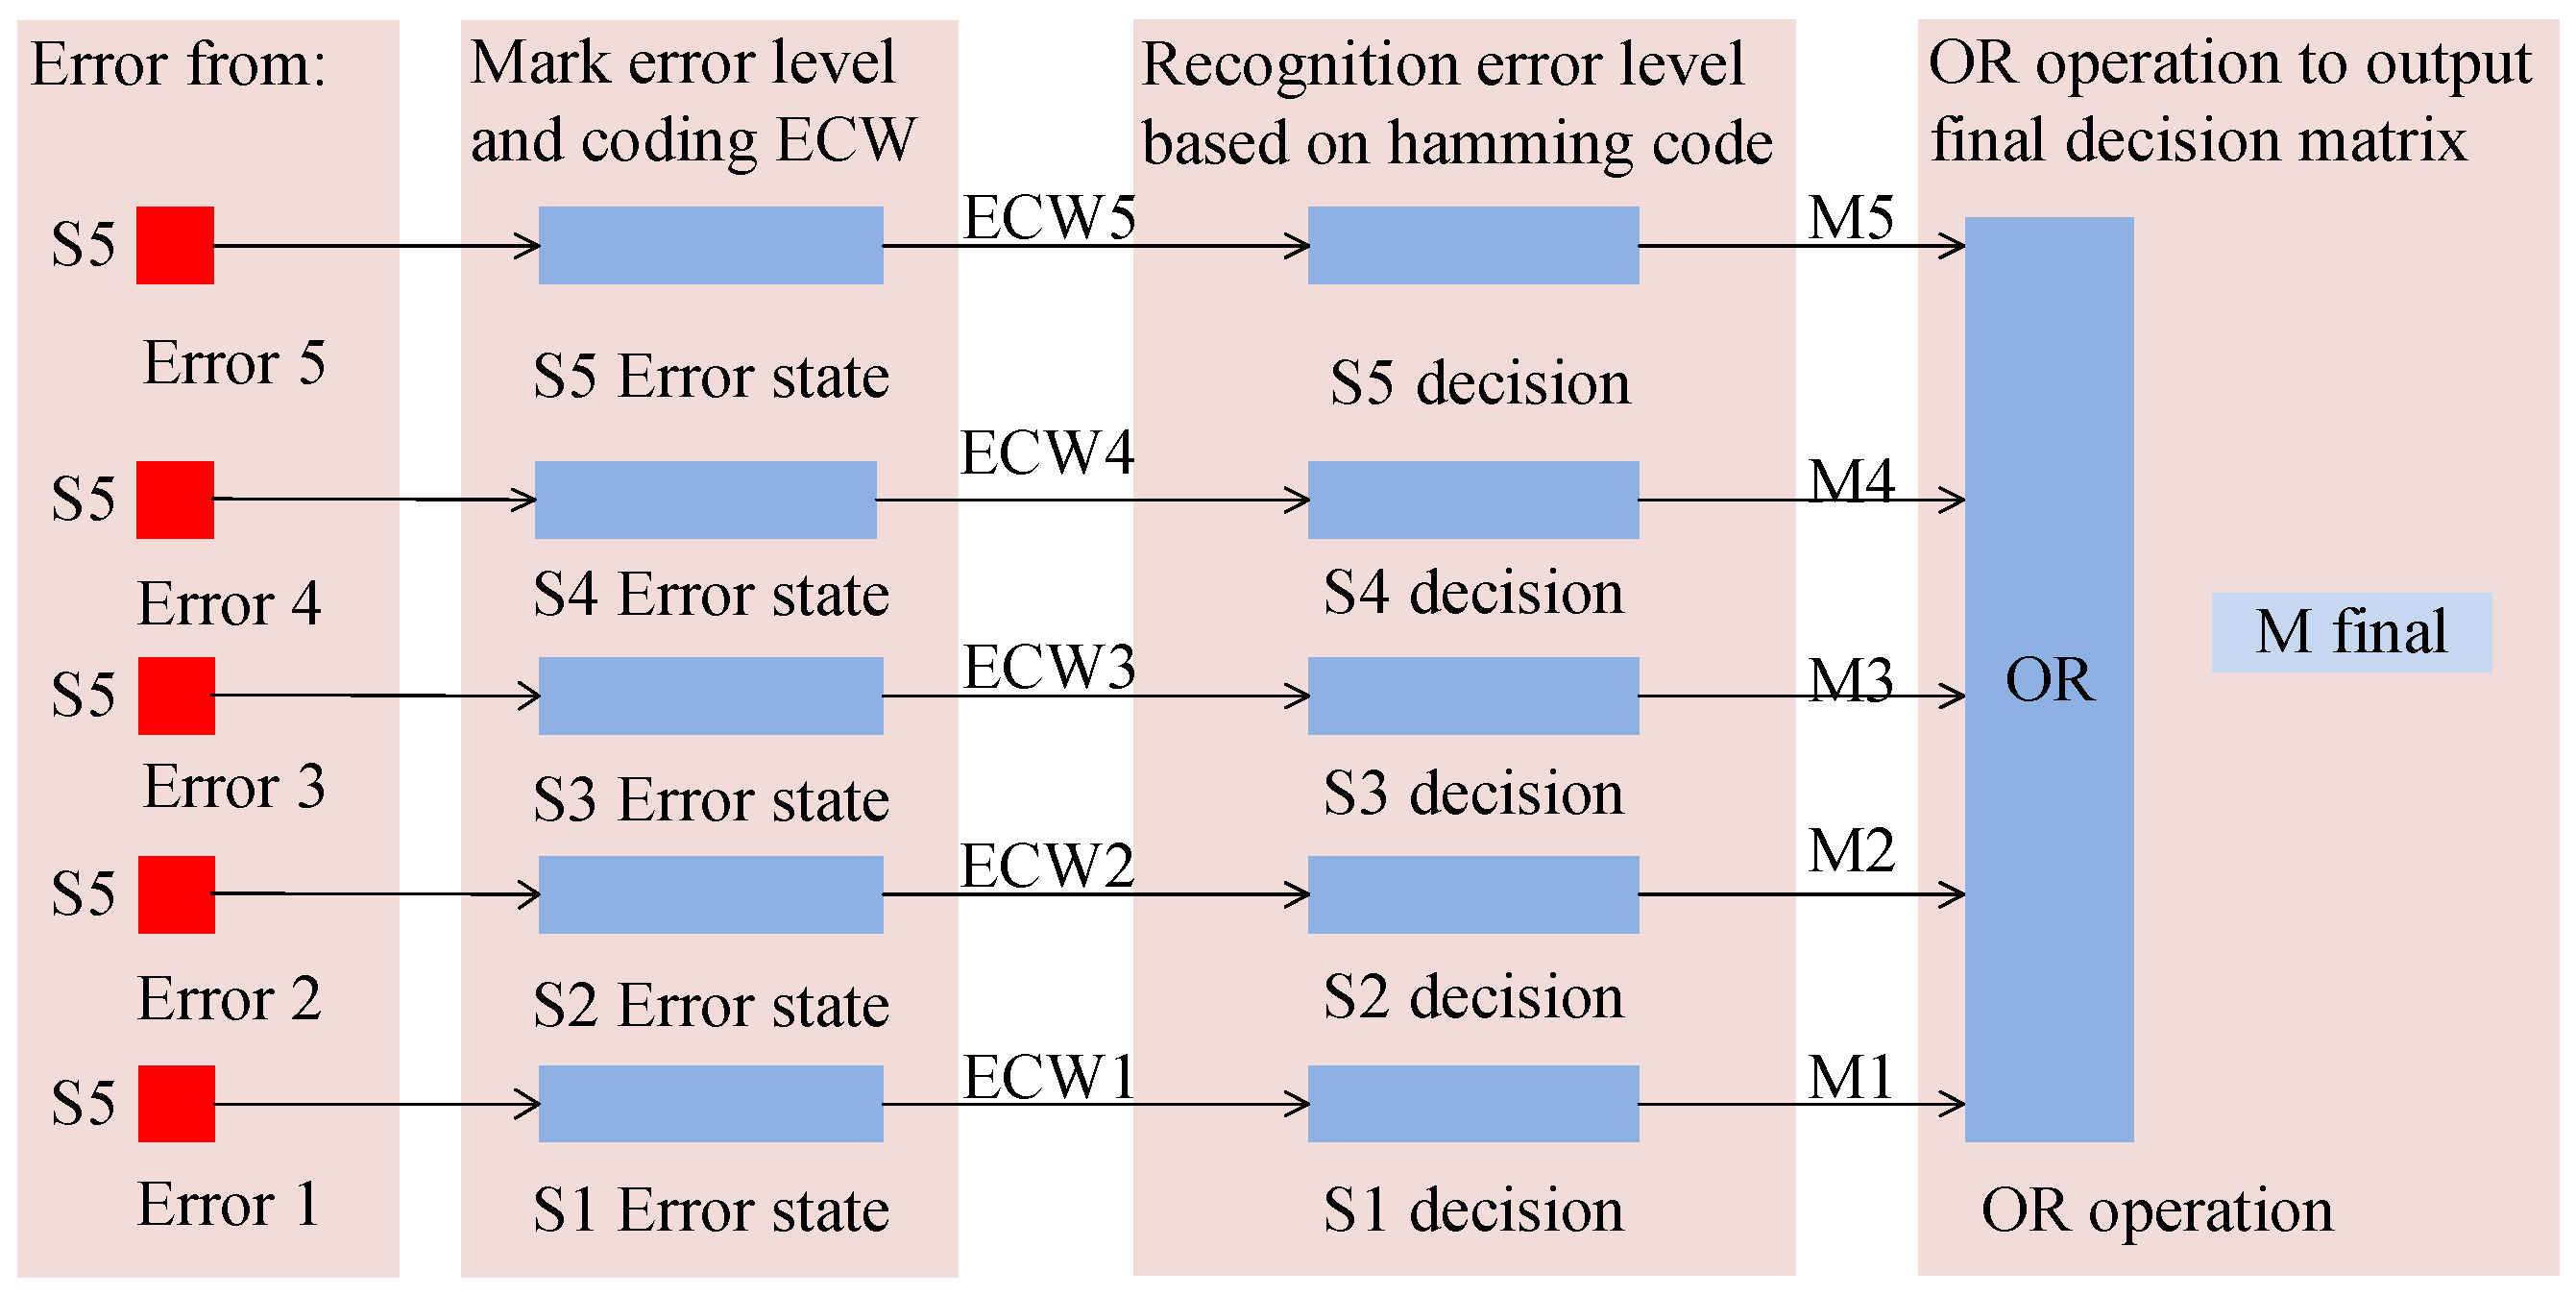
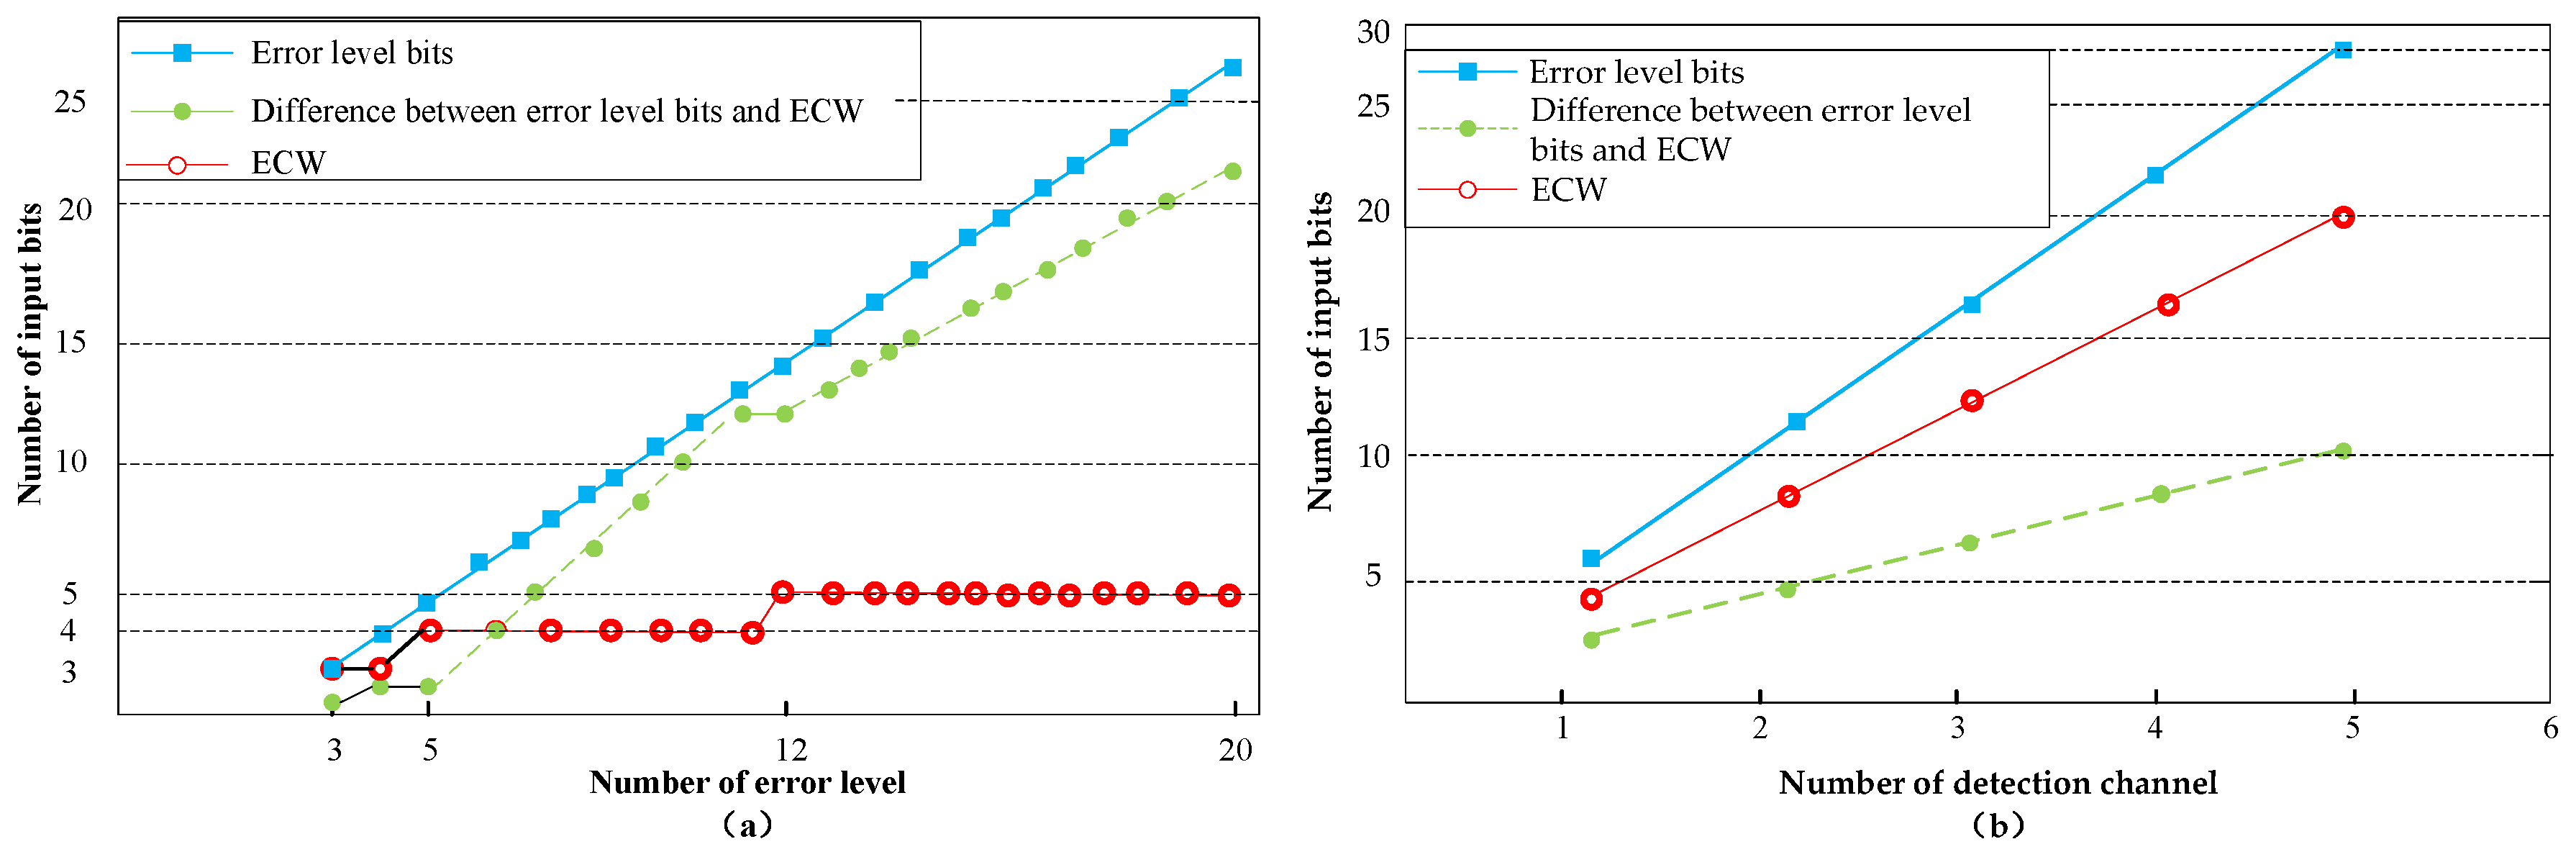
3.2. ECW of MDF Continuous Hot Pressing
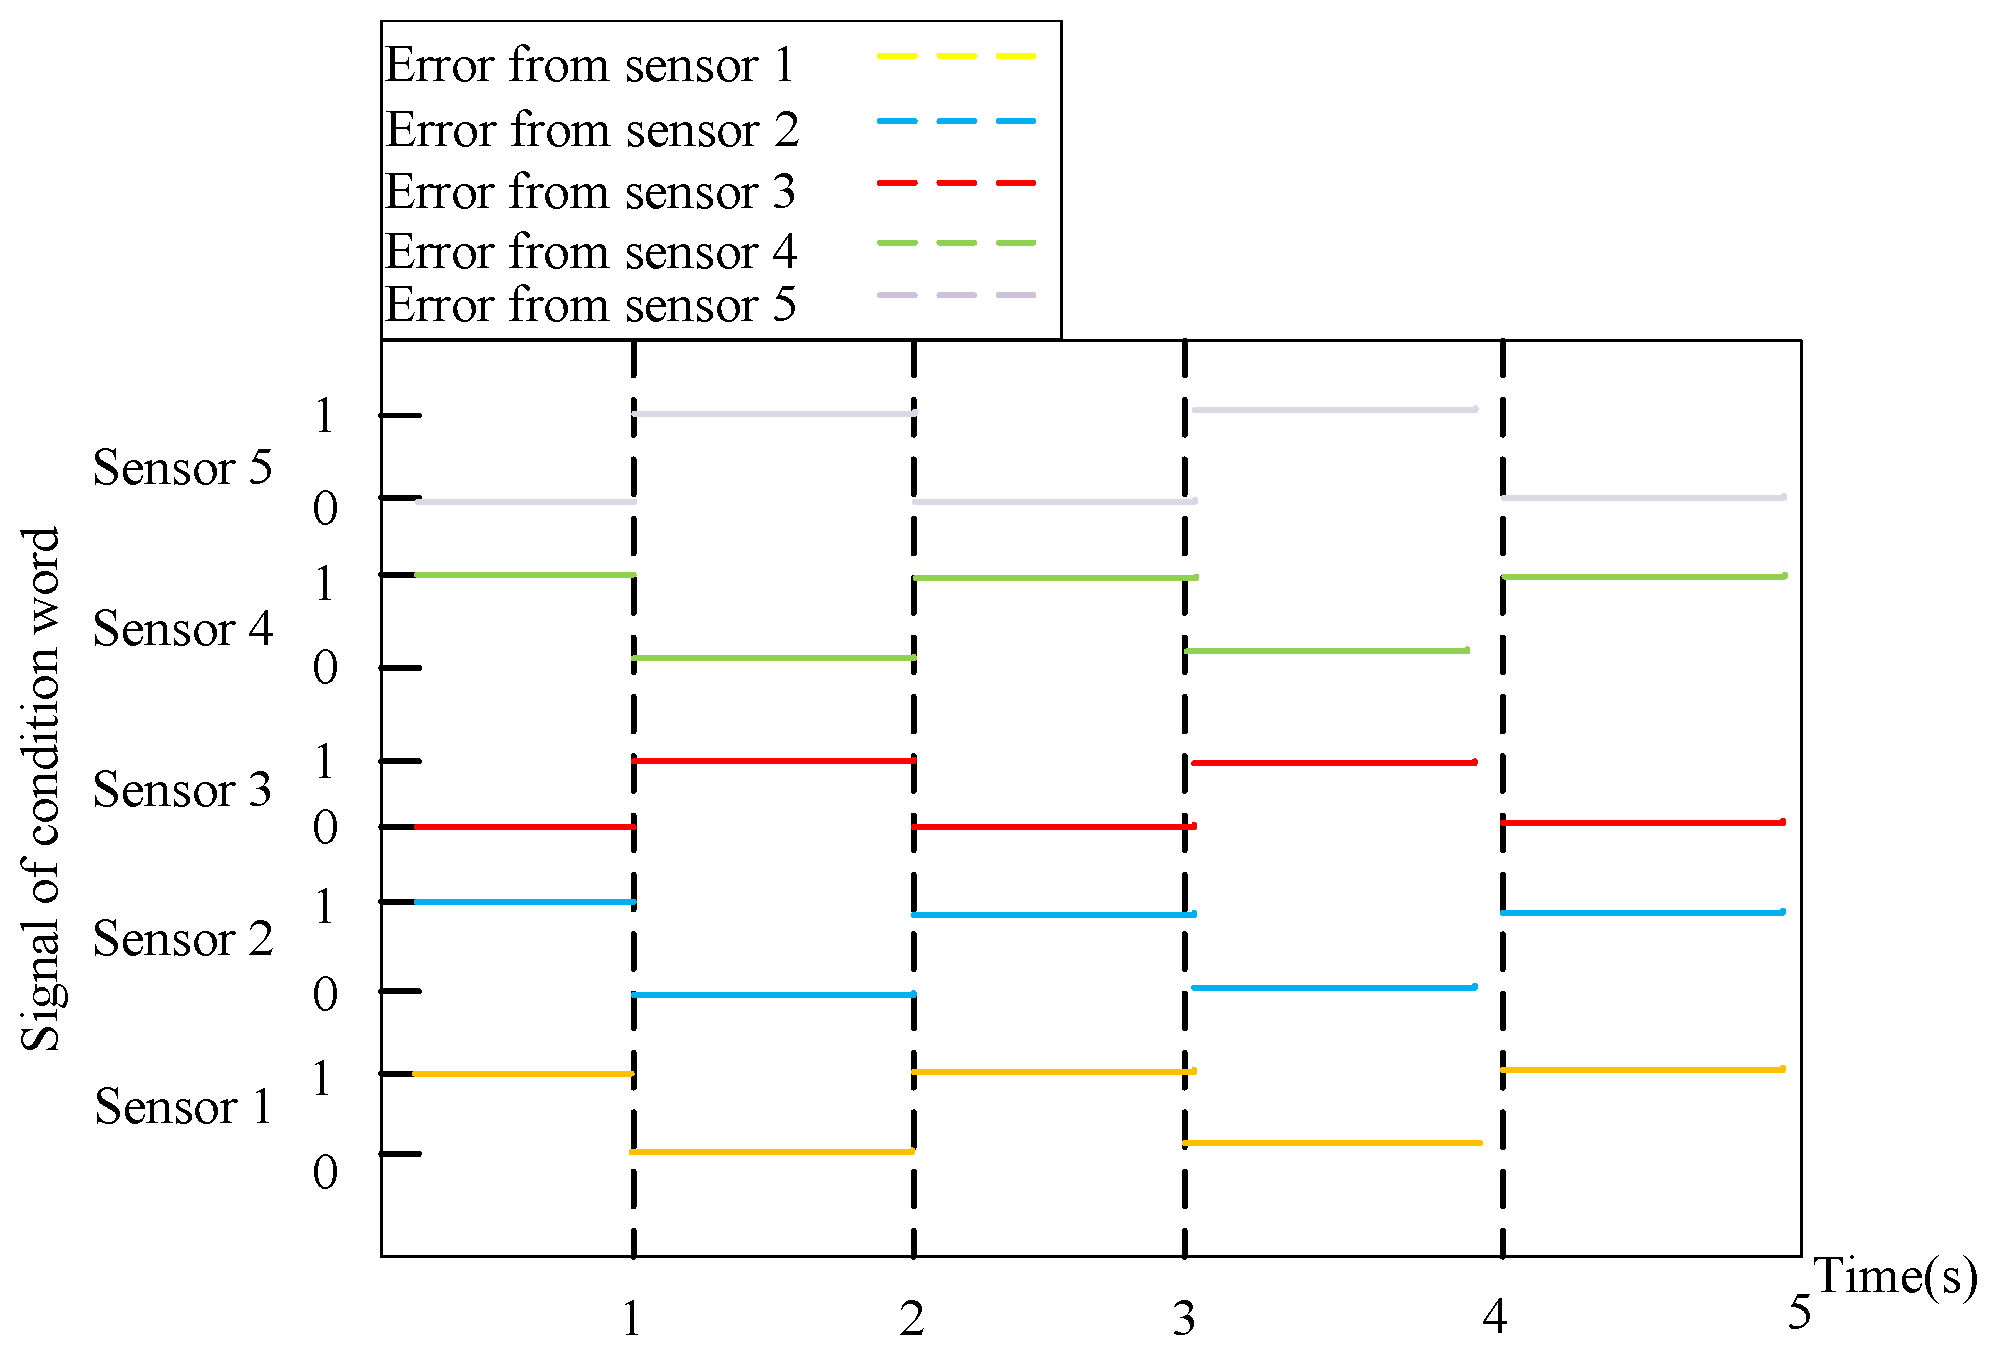
3.3. MDF Hamming Coding
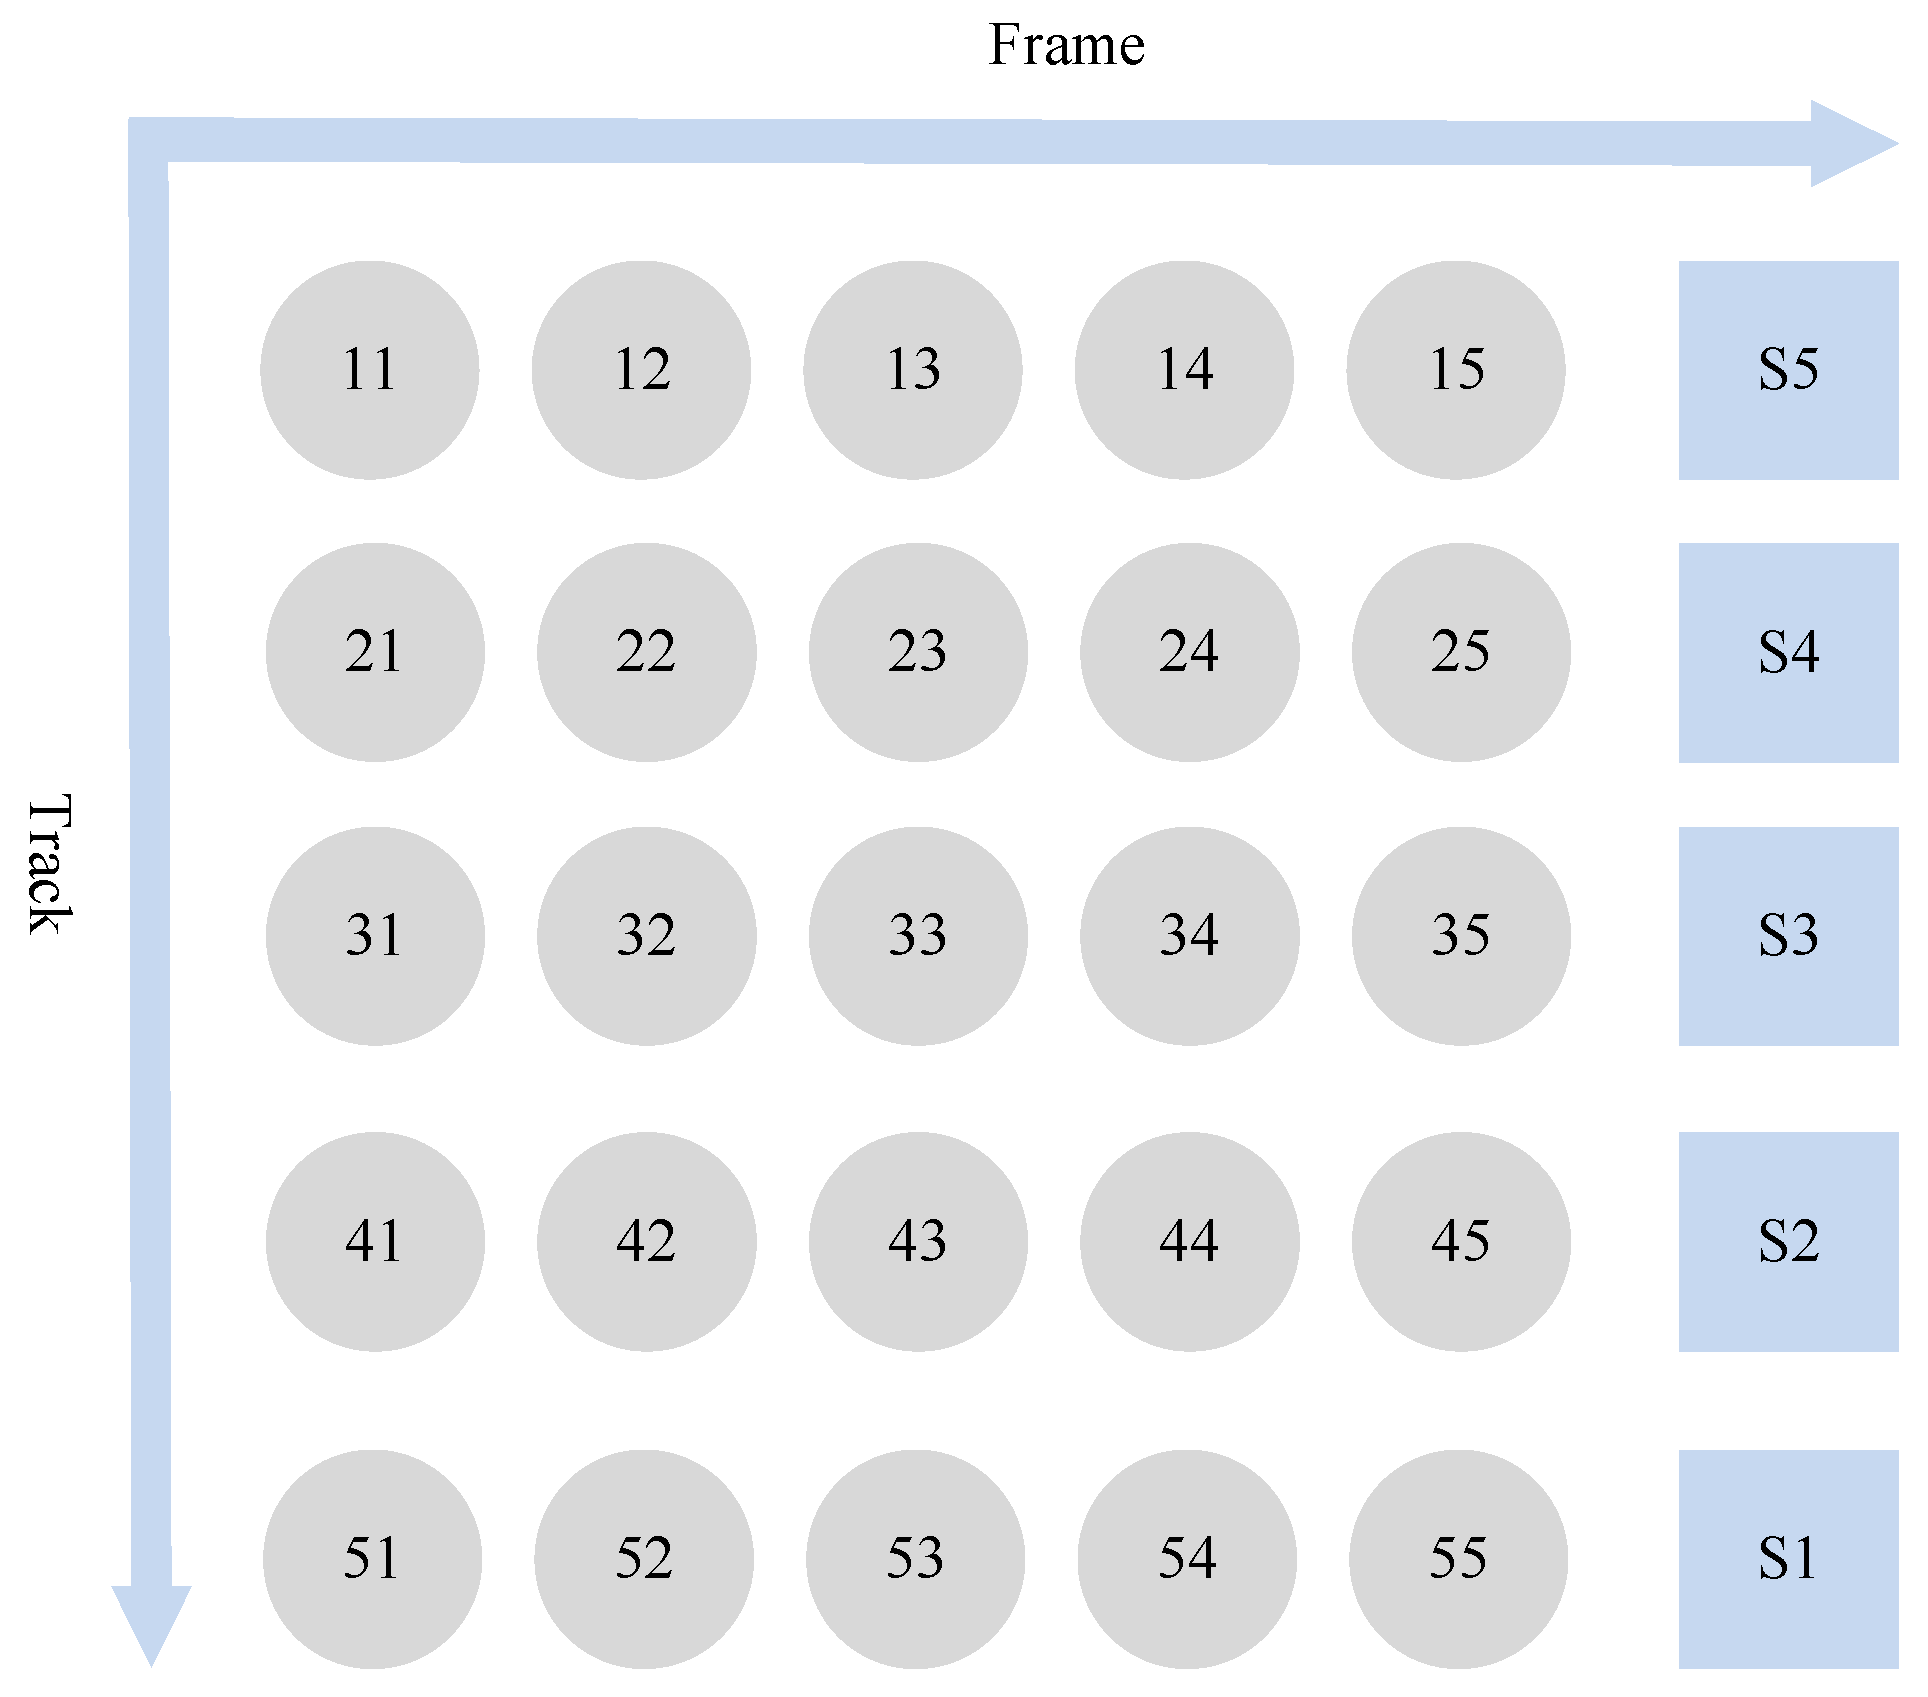
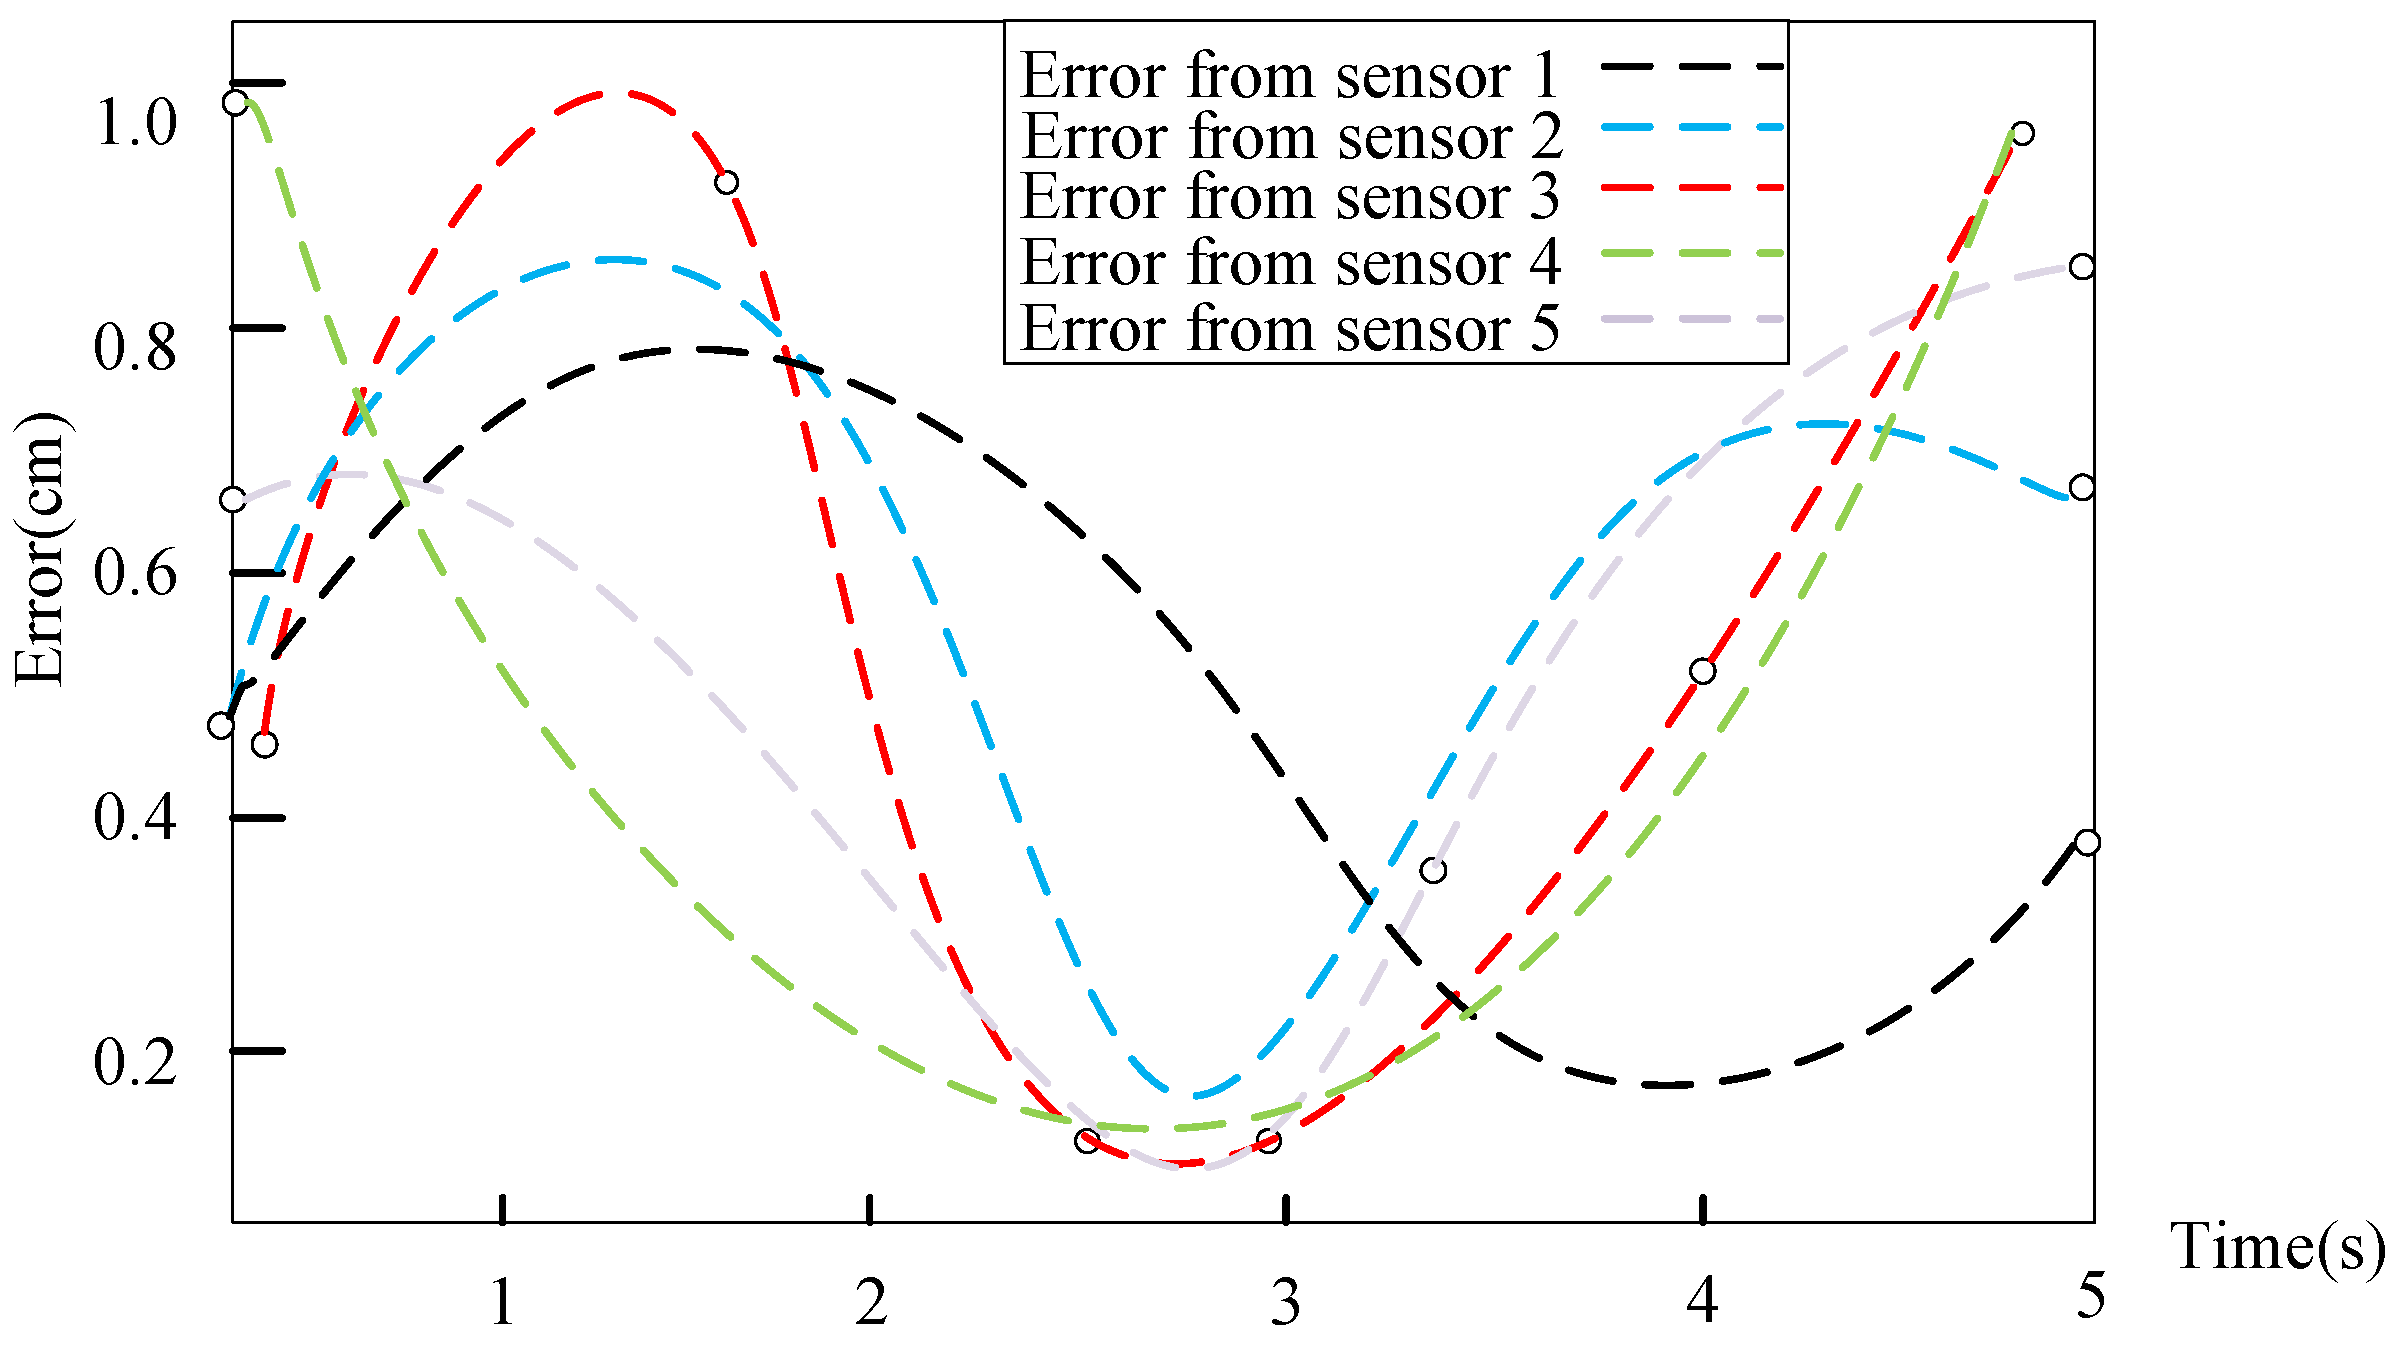
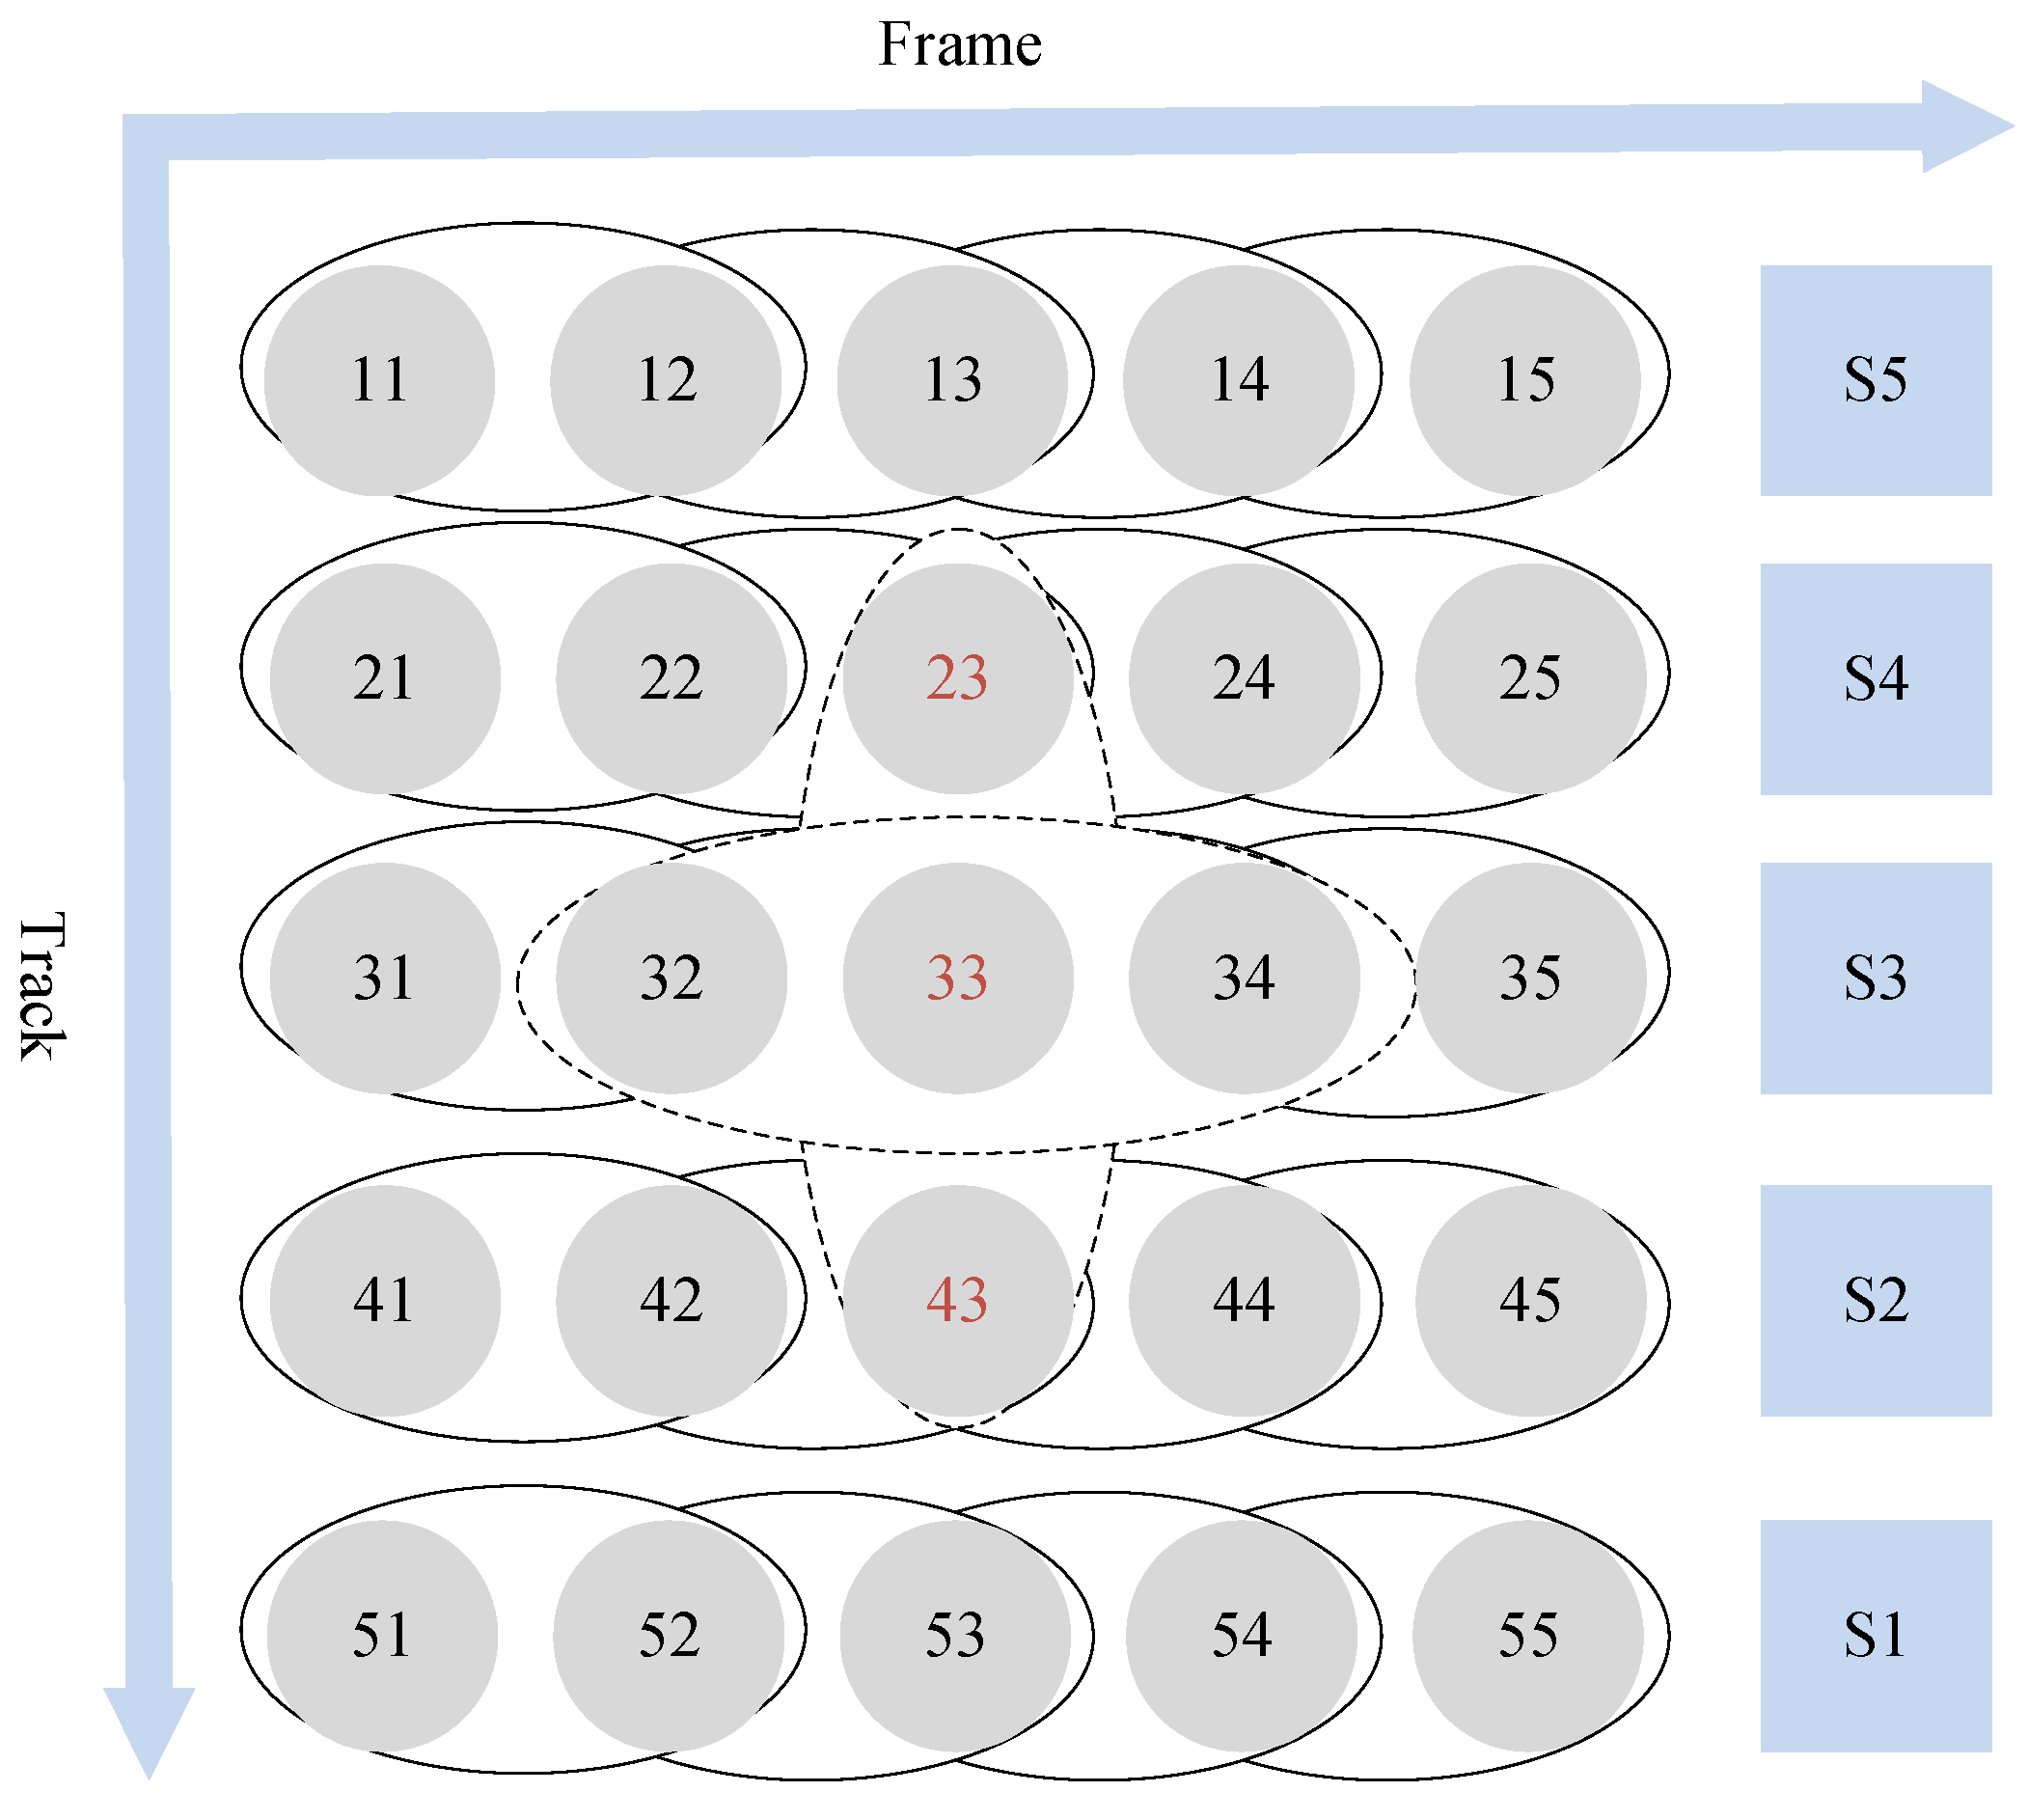
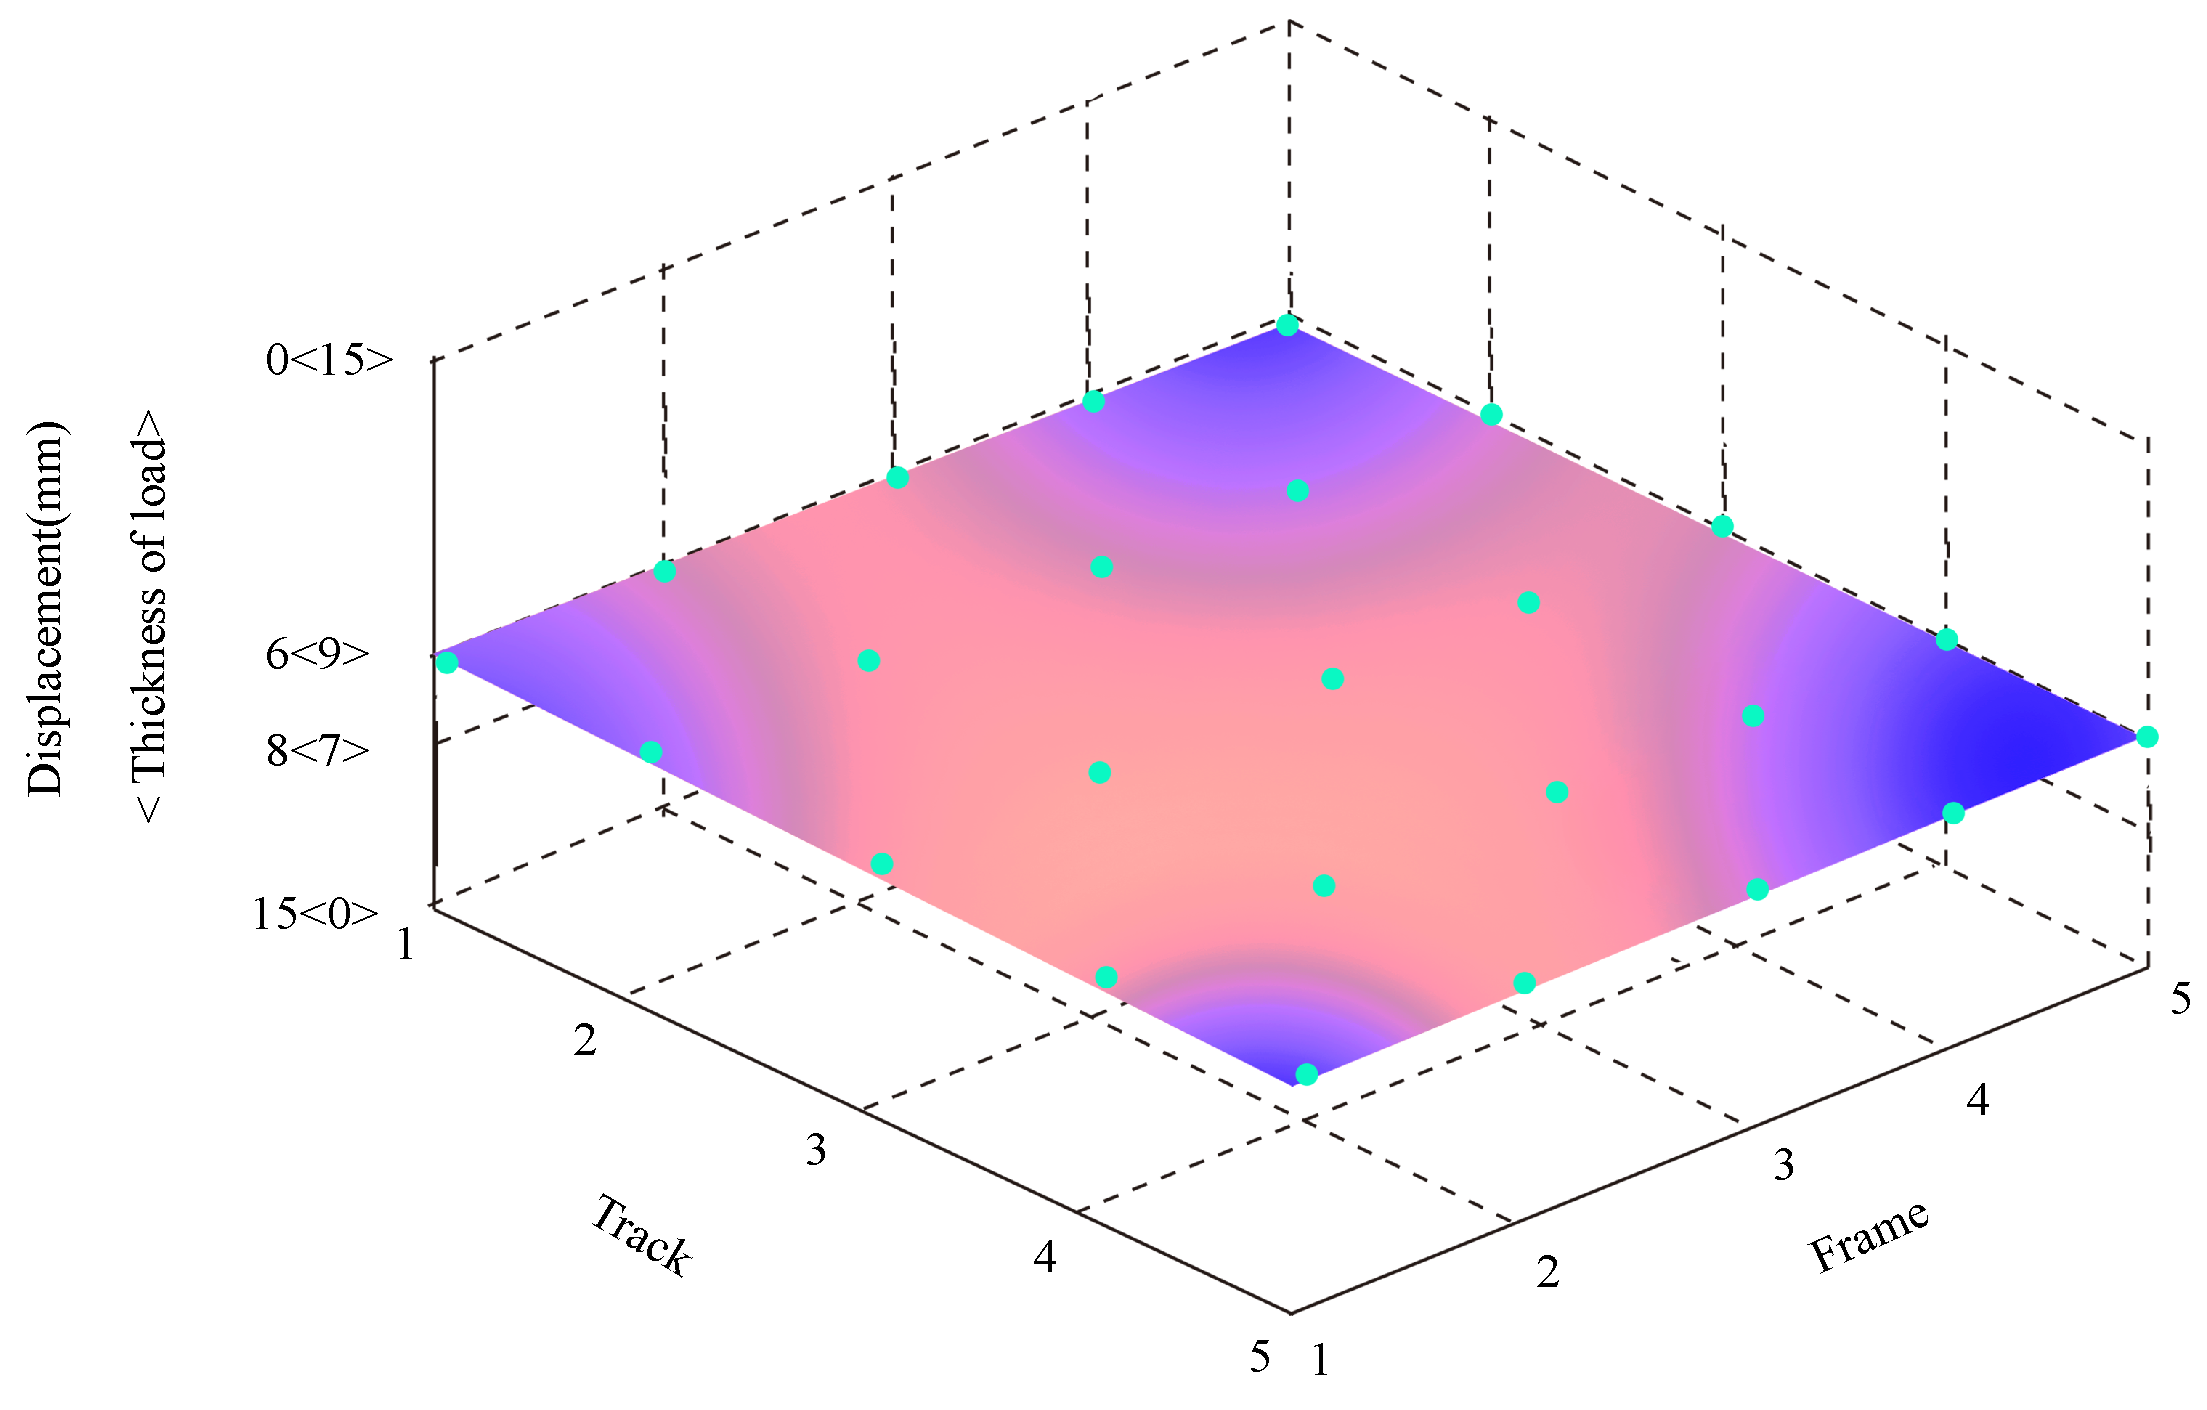
3.4. Self-Coordination and Mutual Cooperation of the MDF Continuous Hot Press Cylinder
4. Conclusions
Author Contributions
Funding
Conflicts of Interest
Abbreviations
| CHP | continuous hot pressing |
| DS | Dempster–Shafer |
| FMEA | failure mode and effects analysis |
| FRPN | fuzzy risk priority number |
| IT2FS | interval type-2 fuzzy sets |
| MDF | medium-density fiberboard |
| RPN | risk probability number |
References
- Akbulut, T.; Ayrilmis, N. Some advantages of three-layer medium-density fibreboard as compared to the traditional single-layer one. J. Wood Sci. 2019, 65, 46. [Google Scholar] [CrossRef]
- Ates, S.; Kara, H.R.; Olgun, C.; Ozkan, O.E. Effects of heat treatment on some properties of MDF (medium-density fiberboard). Wood Mater. Sci. Eng. 2017, 12, 158–164. [Google Scholar] [CrossRef]
- Euring, M.; Kirsch, A.; Kharazipour, A. Pre-pressing and pre-heating via hot-air/hot-steam process for the production of binderless medium-density fiberboards. BioResources 2016, 11, 6613–6624. [Google Scholar] [CrossRef]
- Wu, Q. Synergetic Control for Slab Thickness Deviation Rectification of MDF Continuous Press. Ph.D. Thesis, Northeast Forestry University, Harbin, China, 2013. (In Chinese). [Google Scholar]
- Gul, W.; Khan, A.; Shakoor, A. Impact of hot pressing temperature on medium density fiberboard (MDF) performance. Adv. Mater. Sci. Eng. 2017, 2017, 1–6. [Google Scholar] [CrossRef]
- Zhu, L.; Wang, Z.; Qiang, H.; Liu, Y. Global sliding-mode dynamic surface control for MDF continuous hot pressing slab thickness via LESO. Int. J. Mach. Learn. Cybern. 2019, 10, 1249–1258. [Google Scholar] [CrossRef]
- Zhu, L.; Wang, Z.; Zhou, Y.; Liu, Y. Adaptive neural network saturated control for MDF continuous hot pressing hydraulic system with uncertainties. IEEE Access 2017, 6, 2266–2273. [Google Scholar] [CrossRef]
- Zhu, L.; Zhou, Y.; Liu, Y. Robust adaptive neural prescribed performance control for MDF continuous hot pressing system with input saturation. IEEE Access 2018, 6, 9099–9113. [Google Scholar] [CrossRef]
- Zhu, L.; Zhou, Y.; Wang, Z.; Liu, Y. A novel control for MDF continuous hot pressing accurate tracking: Adaptive fuzzy approach. Int. J. Comput. Appl. Technol. 2019, 59, 175–184. [Google Scholar] [CrossRef]
- Lv, B.; Liu, Y.Q.; Zhu, L.K. Error-driven decision and error condition word for continuous hot press flocking control system. Int. J. Model. Identif. Control 2016, 26, 324–335. [Google Scholar]
- Urbonas, A.; Raudonis, V.; Maskeliunas, R.; Damaševičius, R. Automated identification of wood veneer surface defects using faster region-based convolutional neural network with data augmentation and transfer learning. Appl. Sci. 2019, 9, 4898. [Google Scholar] [CrossRef]
- Juočas, L.; Raudonis, V.; Maskeliūnas, R.; Damaševičius, R.; Woźniak, M. Multi-focusing algorithm for microscopy imagery in assembly line using low-cost camera. Int. J. Adv. Manuf. Technol. 2019, 102, 3217–3227. [Google Scholar] [CrossRef]
- Huang, J.; You, J.-X.; Liu, H.-C.; Song, M.-S. Failure mode and effect analysis improvement: A systematic literature review and future research agenda. Reliab. Eng. Syst. Saf. 2020, 199, 106885. [Google Scholar] [CrossRef]
- Sho, Y.; Hidenori, K.; Keiji, S. Extended Flocking Algorithm for Self-parameter Tuning. Electron. Commun. Jpn. 2015, 98, 44–51. [Google Scholar]
- Nie, W.B.; Liu, W.D.; Chen, B.S. Application of Fuzzy Matrix Correlation and Risk Preference in FMEA Decision Making. Stat. Decis. Mak. 2019, 35, 54–58. (In Chinese) [Google Scholar]
- Wu, Q.; Lv, B.; Wang, L.; Bai, J. Hamming Code Specification Analysis Based on Binary Tree Structure. Highlights Sci. 2015, 8, 540–548. [Google Scholar]
- Qin, J.; Xi, Y.; Pedrycz, W. Failure mode and effects analysis (FMEA) for risk assessment based on interval type-2 fuzzy evidential reasoning method. Appl. Soft Comput. J. 2020, 89, 106134. [Google Scholar] [CrossRef]
- Akyuz, C. A quantitative risk analysis by using interval type-2 fuzzy FMEA approach: The case of oil spill. Marit. Policy Manag. 2018, 45, 8. [Google Scholar] [CrossRef]
- Dong, G.; Wei, W.; Xia, X.; Woźniak, M.; Damaševičius, R. Safety risk assessment of a Pb-Zn mine based on fuzzy-grey correlation analysis. Electronics 2020, 9, 130. [Google Scholar] [CrossRef]
- Wei, W.; Xia, X.; Wozniak, M.; Fan, X.; Damaševičius, R.; Li, Y. Multi-sink distributed power control algorithm for Cyber-physical-systems in coal mine tunnels. Comput. Netw. 2019, 161, 210–219. [Google Scholar] [CrossRef]
- Seiti, H.; Hafezalkotob, A.; Najafi, S.E.; Khalaj, M. A risk-based fuzzy evidential framework for FMEA analysis under uncertainty: An interval-valued DS approach. J. Intell. Fuzzy Syst. 2018, 35, 2. [Google Scholar] [CrossRef]
- Liu, S.G.; Zhang, X.J.; Lan, Y. An Improved Assessment Method for FMEA for a Shipboard Integrated Electric Propulsion System Using Fuzzy Logic and DEMATEL Theory. J. Energy 2019, 12, 3162. [Google Scholar] [CrossRef]
- McElroy, L.M.; Khorzad, R.; Nannicelli, A.P.; Brown, A.R.; Ladner, D.P.; Holl, J.L. Failure mode and effects analysis: A comparison of two common risk prioritisation methods. BMJ Qual. Saf. 2015, 25, 329–336. [Google Scholar] [CrossRef] [PubMed]
- Fattahi, R.; Khalilzadeh, M. Risk evaluation using a novel hybrid method based on FMEA, extended MULTIMOORA, and AHP methods under fuzzy environment. Saf. Sci. 2018, 102, 290–300. [Google Scholar] [CrossRef]
- Li, Z.; Chen, L. A novel evidential FMEA method by integrating fuzzy belief structure and grey relational projection method. Eng. Appl. Artif. Intell. 2019, 77, 136–147. [Google Scholar] [CrossRef]
- Shafiee, M.; Enjema, E.; Kolios, A. An integrated FTA-FMEA model for risk analysis of engineering systems: A case study of subsea blowout preventers. Appl. Sci. 2019, 9, 1192. [Google Scholar] [CrossRef]
- Fang, H.; Li, J.; Song, W. Failure mode and effects analysis: An integrated approach based on rough set theory and prospect theory. Soft Comput. 2020, 24, 6673–6685. [Google Scholar] [CrossRef]
- Chen, L.; Deng, Y. A new failure mode and effects analysis model using Dempster–Shafer evidence theory and grey relational projection method. Eng. Appl. Artif. Intell. 2018, 76, 13–20. [Google Scholar] [CrossRef]
- Tooranloo, H.S.; Ayatollah, A.S.; Alboghobish, S. Evaluating knowledge management failure factors using intuitionistic fuzzy FMEA approach. Knowl. Inf. Syst. 2018, 57, 183–205. [Google Scholar] [CrossRef]
- Arabsheybani, A.; Paydar, P.M.; Safaei, A.S. An integrated fuzzy MOORA method and FMEA technique for sustainable supplier selection considering quantity discounts and supplier’s risk. J. Clean. Prod. 2018, 190, 577–591. [Google Scholar] [CrossRef]
- An, X.; Cai, W.G.; Song, X.J. FMEA coupling evaluation method based on cloud model and collaborative decision. Comput. Integr. Manuf. Syst. 2018, 24, 1179–1190. [Google Scholar] [CrossRef]
- Zh, S.L.; Su, X.L. Evaluation of water resources allocation plan in the Yellow River Basin coupled with game theory and DS evidence theory. J. Northwest A F Univ. (Nat. Sci. Ed.) 2019, 47, 123–133. (In Chinese) [Google Scholar]
- Martin, R.; Zhang, J.; Liu, C. Dempster–Shafer Theory and Statistical Inference with Weak Beliefs. J. Stat. Sci. 2010, 1, 72–87. [Google Scholar] [CrossRef]
- Liu, Y.Q.; Wu, Q. Slab Thickness Deviation Rectification Control of MDF Continuous Press Based on Hierarchical Structure of Synergetic Governance. In Proceedings of the International Conference on Mechatronics and Control, Jinzhou, China, 3–5 July 2014; pp. 855–860. [Google Scholar]
- Nie, W.B.; Liu, W.D.; Hu, K.; Chen, H.; Zheng, T. Process failure risk assessment based on group decision and generalized Hausdorff distance. Comput. Integr. Manuf. Syst. 2015, 21, 2484–2493. (In Chinese) [Google Scholar]
- Nie, W.B.; Liu, W.D.; Wu, Z.Y.; Chen, B.S.; Wu, L.L. Failure mode and effects analysis by integrating Bayesian fuzzy assessment number and extended gray relational analysis-technique for order preference by similarity to ideal solution method. Qual. Reliab. Eng. Int. 2019, 35, 1676–1697. [Google Scholar] [CrossRef]
- Wu, H.; Lin, Y. Risk assessment for a floating attitude tension leg platform by application of a hybrid fuzzy-statistical process control model. J. Zhejiang Univ. Sci. A 2019, 20, 515–532. [Google Scholar] [CrossRef]


| Occurrence (O) | Severity (S) | Detection (D) | Rating |
|---|---|---|---|
| Faults rarely occur | Normal, only weakly affecting certain components | The probability of failure to detect is low | 2, 3 |
| Occasionally, the device can run | The overall performance is reduced | Occasionally, it is not detected | 4, 5, 6 |
| Failure occurs often | The function of the device is basically lost | The probability of failure to operate is high | 7, 8 |
| Failure occurs inevitably | Equipment damage | The probability of not being detected is extremely high | 9, 10 |
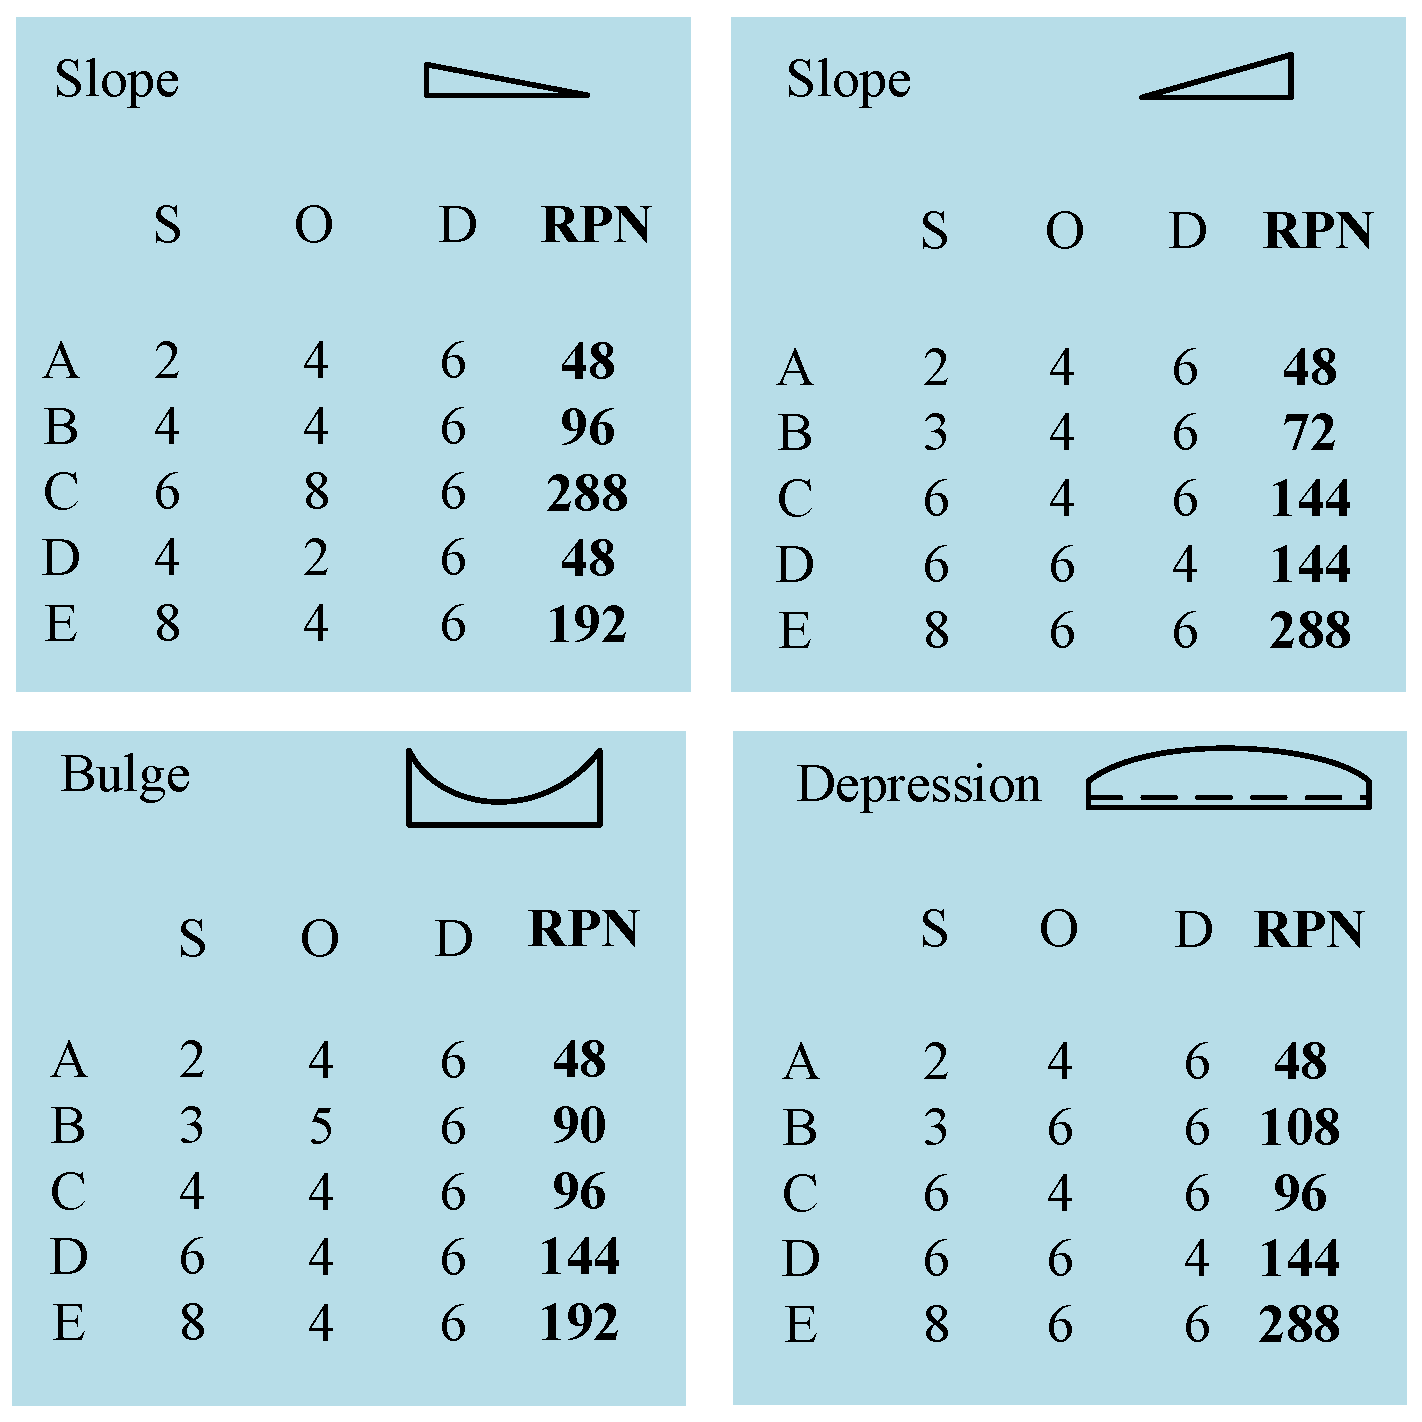
| FM | (S) | (O) | (D) | RPN | FRPN |
|---|---|---|---|---|---|
| FM1 | 2 | 4 | 6 | 48 | 25.2190 |
| FM2 | 4 | 4 | 6 | 96 | 60.3515 |
| FM3 | 6 | 8 | 6 | 288 | 230.7936 |
| FM4 | 4 | 2 | 6 | 48 | 25.2190 |
| FM5 | 8 | 4 | 6 | 192 | 160.3515 |
| FM6 | 2 | 4 | 6 | 48 | 25.2190 |
| FM7 | 3 | 4 | 6 | 72 | 35.6736 |
| FM8 | 6 | 4 | 6 | 144 | 100.6581 |
| FM9 | 6 | 6 | 4 | 144 | 100.6581 |
| FM10 | 8 | 6 | 6 | 288 | 230.7936 |
| FM11 | 2 | 4 | 6 | 48 | 25.2190 |
| FM12 | 3 | 5 | 6 | 90 | 55.1305 |
| FM13 | 4 | 4 | 6 | 96 | 60.3515 |
| FM14 | 6 | 4 | 6 | 144 | 100.6581 |
| FM15 | 8 | 4 | 6 | 192 | 132.7936 |
| FM16 | 2 | 4 | 6 | 48 | 25.2190 |
| FM17 | 3 | 6 | 6 | 108 | 75.8755 |
| FM18 | 4 | 4 | 6 | 96 | 60.3515 |
| FM19 | 6 | 6 | 4 | 144 | 100.6581 |
| FM20 | 8 | 6 | 6 | 288 | 230.7936 |
| Chwila | Sensor Strategy () | RPN () |
|---|---|---|
| FM8 | 0.80 | 0.20 |
| FM9 | 0.09 | 0.70 |
| FM14 | 0.01 | 0.05 |
| FM19 | 0.10 | 0.05 |
© 2020 by the authors. Licensee MDPI, Basel, Switzerland. This article is an open access article distributed under the terms and conditions of the Creative Commons Attribution (CC BY) license (http://creativecommons.org/licenses/by/4.0/).
Share and Cite
Lv, Y.; Liu, Y.; Jing, W.; Woźniak, M.; Damaševičius, R.; Scherer, R.; Wei, W. Quality Control of the Continuous Hot Pressing Process of Medium Density Fiberboard Using Fuzzy Failure Mode and Effects Analysis. Appl. Sci. 2020, 10, 4627. https://doi.org/10.3390/app10134627
Lv Y, Liu Y, Jing W, Woźniak M, Damaševičius R, Scherer R, Wei W. Quality Control of the Continuous Hot Pressing Process of Medium Density Fiberboard Using Fuzzy Failure Mode and Effects Analysis. Applied Sciences. 2020; 10(13):4627. https://doi.org/10.3390/app10134627
Chicago/Turabian StyleLv, Yunlei, Yaqiu Liu, Weipeng Jing, Marcin Woźniak, Robertas Damaševičius, Rafał Scherer, and Wei Wei. 2020. "Quality Control of the Continuous Hot Pressing Process of Medium Density Fiberboard Using Fuzzy Failure Mode and Effects Analysis" Applied Sciences 10, no. 13: 4627. https://doi.org/10.3390/app10134627
APA StyleLv, Y., Liu, Y., Jing, W., Woźniak, M., Damaševičius, R., Scherer, R., & Wei, W. (2020). Quality Control of the Continuous Hot Pressing Process of Medium Density Fiberboard Using Fuzzy Failure Mode and Effects Analysis. Applied Sciences, 10(13), 4627. https://doi.org/10.3390/app10134627