Article

A Multiple Criteria Decision Analysis Framework for Dispersed Group Decision-Making Contexts

1
GECAD—Research Group on Intelligent Engineering and Computing for Advanced Innovation and Development, Institute of Engineering, Polytechnic of Porto, 4200-072 Porto, Portugal
2
ALGORITMI Centre, University of Minho, 4800-058 Guimarães, Portugal
*
Author to whom correspondence should be addressed.
Appl. Sci. 2020, 10(13), 4614; https://doi.org/10.3390/app10134614
Submission received: 30 May 2020 / Revised: 29 June 2020 / Accepted: 30 June 2020 / Published: 3 July 2020
(This article belongs to the Special Issue Multi-Agent Systems 2020)

Abstract

:
To support Group Decision-Making processes when participants are dispersed is a complex task. The biggest challenges are related to communication limitations that impede decision-makers to take advantage of the benefits associated with face-to-face Group Decision-Making processes. Several approaches that intend to aid dispersed groups attaining decisions have been applied to Group Decision Support Systems. However, strategies to support decision-makers in reasoning, understanding the reasons behind the different recommendations, and promoting the decision quality are very limited. In this work, we propose a Multiple Criteria Decision Analysis Framework that intends to overcome those limitations through a set of functionalities that can be used to support decision-makers attaining more informed, consistent, and satisfactory decisions. These functionalities are exposed through a microservice, which is part of a Consensus-Based Group Decision Support System and is used by autonomous software agents to support decision-makers according to their specific needs/interests. We concluded that the proposed framework greatly facilitates the definition of important procedures, allowing decision-makers to take advantage of deciding as a group and to understand the reasons behind the different recommendations and proposals.

1. Introduction

Group Decision-Making (GDM) is typically regarded as a process involving the opinion and interests of a group of people (also known as decision-makers) to collectively achieve a consensual decision for a certain problem [1]. In this context, solving a problem often requires the analysis and comparison of different alternatives as possible solutions through their pros and cons related to different criteria [2]. There are several advantages associated with GDM processes, such as to improve the quality of the decision, to share workloads, to get support among stakeholders, and to train less experienced group members [3,4,5]. In addition, when the decision-making process is performed in group, the chance to detect a problem is higher, and subsequently, the decision-makers can work together to find a solution for that problem. This turns GDM into a more effective and fast process [6]. In order to benefit from these advantages, conditions for the decision-makers to interact, exchange ideas, to understand the reasons behind different preferences, among other important activities, need to be created [7,8], especially when decision-makers are geographically dispersed.
The number of approaches that intend to support decision-making processes anytime and anywhere is increasing [2,9,10]. However, the big majority is still mainly focused on the outcomes and does not allow decision-makers to benefit from the advantages associated with face-to-face GDM. To propose solutions without explaining the motives can be a source of entropy because it makes the decision-making process less transparent, making it difficult for the decision-makers to understand the recommendations/proposals and the current decision context. Consequently, the decision quality is prejudiced.
In this paper, we propose a Multiple Criteria Decision Analysis (MCDA) Framework that intends to help researchers and developers in the development of new MCDA methods mainly designed to operate in GDM contexts with dispersed decision-makers. The proposed framework offers a set of functionalities that helps groups attaining consensual decisions, promoting and facilitating at the same time the access to intelligence, leveraging the creation of knowledge.
The proposed framework was defined to allow the deduction of the reasons behind the different recommendations/proposals. Several important aspects, such as expertise level, credibility, behavior styles, and prediction of decision quality were considered. The framework includes a consistency method to calculate the consistency of different alternatives and all the necessary data to predict the decision quality of the different solutions. In addition, it allows to predict the criteria importance from the decision-makers’ perspective and for each alternative from a global view of the decision problem. In order to make the proposed Framework available to different clients, we developed a microservice that exposes the Framework’s functionalities using a REST API and included it on an existing Consensus-based Group Decision Support System.
To evaluate the proposed MCDA framework, a set of experiments was conducted. The experiments showed that the framework has the necessary material to be extended by MCDA methods and to perform important tasks such as to recommend an alternative(s) as a solution, to recommend an alternative to reject (in order to decrease the decision problem complexity), to explain the reasons behind the different recommendations, to present data about the other decision-makers’ preferences and the possible reasons for their preferences, and to alert decision-makers to think twice about inconsistencies in the evaluation of their preferences regarding alternatives and criteria. In addition, the utility of the framework was demonstrated through an experimental consensus reaching process, namely by autonomous software agents, to make personalized recommendations and to provide personalized information.
The rest of the paper is organized in the following order: in the next section, we present the literature review. In Section 3, we introduce the proposed MCDA framework. In Section 4 we present some scenarios of application. In Section 5, we present the developed microservice and describe some of the Framework’s utilities in a real context. Finally, some conclusions are put forward in Section 6, alongside suggestions of work to be done hereafter.

2. Literature Review

The Consensus Reaching Process is an essential process in GDM events since in most cases it is impossible to reach a consensual decision after the participants’ initial preferences configuration [11]. It consists of a dynamic feedback process that aims to reduce existing conflicts as the group seeks to converge towards a solution [12]. Most existing works consider that a decision becomes consensual when a certain level of Consensus Degree is reached [10,13]. However, reaching consensus can be an extremely complex process, as the participants involved can be highly diverse (differing in their intentions, preferences, motivations, level of expertise, etc. [14,15]).
Different strategies for achieving consensus and which have been applied to many real-world problems, especially in the context of MCDA, such as financial, energy planning, and sustainable development have been proposed [16]. Several authors have addressed the topic of consensus-reaching in GDM and have presented ideas worthy of discussion.
Dong, Zhang [17] studied the impact of consensus in multi-criteria GDM and proposed a consensus-reaching model that considers three main features. The first feature relates to how decision-makers hold individual and different interests regarding each alternative and define their own criteria to evaluate alternatives. In the second feature, decision-makers do not have to reach a consensus regarding the set of criteria defined to evaluate each alternative, but instead, must find the alternative supported by most decision-makers. Finally, the third feature describes the dynamic characteristics of the decision-making process and how individual preferences regarding both sets of available criteria and alternatives can change throughout the decision-making process. The authors applied the proposed model in a resolution framework which includes two processes to obtain a collective solution. In the first process, the individual evaluation matrices are normalized, and the weights of the individual attributes are measured. Each individual alternative is then ranked, and a temporal solution is finally derived. In the second process, the achieved consensus is improved by first measuring the consensus level regarding the obtained collective solution and then designing feedback adjustment rules to help decision-makers modify their individual sets of attributes, alternatives, and preferences.
Kozlowski and Hattrup [18] studied the measurement of interrater reliability in the climate context and compared it with interrater agreement in terms of consensus and consistency. The authors explained how interrater reliability referred to consistency while interrater agreement referred to interchangeability of opinion among raters (consensus). Other authors have studied and compared consensus and consistency in the context of GDM.
Roe, Busemeyer [19] extended a decision theory proposed in [20], originally formulated to explain choice behavior for decision-making under uncertainty and presented a dynamic decision model for multi-alternative problems. The dynamic feature of their model was determined by an initial preference state (bias resulting from previous experience, previous habits, and history of choices) and a feedback matrix (contains all the interconnections and self-connection between choice alternatives). The authors compared their model with other multi-alternative models according to similarity, attraction and compromise effects, and concluded that their model could provide an explanation for each effect and the interactions between each of those effects.
Stemler [21] compared consensus, consistency, and measurement approaches to estimate the rate of agreement between different decision-makers (in this case referred as judges or raters). The author analyzed the different advantages and disadvantages as well as the methods to compute both consensus, consistency, and measurement estimates for interrater reliability.
Moreno-Jiménez, Aguarón [22] developed a Consistency Consensus Matrix (CCM) for GDM to measure the consistency in judgement elicitation using the Analytic Hierarchic Process (AHP). To do so, first the authors considered the definitions developed in [23,24] regarding both preference structures (which corresponds to possible rankings of a set of alternatives) and stability intervals (which corresponds to the interval in which a judgment can vary while still being consistent). Then, the authors defined a row geometric mean as a prioritization procedure and a geometric consistency index to measure the inconsistency level of each judgement. The authors referred to CCM as a tool that could be used as an initial step of a participatory dialogue GDM process and applied to scenarios requiring the interaction between few or several decision-makers. Furthermore, the authors referred that their work could be extended to other multi-criteria decision-making techniques that consider the concept of consistency, and that could allow one to extract valuable knowledge to help achieve consensus.
López, Carrillo [2] studied the relation between consensus and consistency and proposed a web-based multi-criteria group decision support system to solve multi-criteria ranking problems. The two main contributions of their work are (1) the use of multi-objective evolutionary algorithms and multi-criteria aggregation-disaggregation to identify alternatives and criteria parameters that less contribute to the consensus level and (2) the definition of a consistency mechanism based on multi-objective combinatorial optimization to help decision-makers maintain a high consistency level regarding their preferences avoiding self-contradiction and decreasing the significance of rank reversal and incompleteness.
Cabrerizo, Morente-Molinera [25] proposed an approach to support GDM processes using a multi-agent system where each agent’s preferences are represented through a set of linguistic preferences relations. This approach is divided into two steps: in the first step, linguistic terms are transformed into intervals using a performance index that considers the consensus among the group of agents and the consistency of each individual agent assessments. In the second step, all the alternatives are ranked by defining a degree of relation between the alternatives and then transforming that degree into a classification from the best alternative to the worst. The authors recognized that one limitation of their approach was the fact of only considering static sets of alternatives, and that it should be adapted to consider dynamic scenarios with the possibility to include and remove alternatives over time.
Li, Rodríguez [26] explained how most of the existing frameworks that consider consensus degree and individual consistency include a consistency improving process and a consensus reaching process. In the first process, it is ensured that the preferences of the decision-maker are not inconsistent or random. In the second process, it is ensured that the group of decision-makers agree with the preferences given for each alternative. However, the authors refer to the fact that the individual consistency improving process is applied before the consensus reaching process, which can lead to an inconsistent adjustment of preferences before the consensus reaching process. As a result, the consistency improving process is often repeated during the consensus reaching process. Furthermore, they argued that the available frameworks that do not consider these two processes, and manage both consensus and consistency simultaneously, are based on automatic consensus processes that do not consider the decision-makers’ opinions. Then, to avoid repeating the consistency improving process during the consensus reaching process, the authors proposed an approach using a consensus reaching process with individual consistency control. For that, they defined an optimization-based consensus rule to determine the adjustment range of each preference value to assure individual consistency during the consensus reaching process.
The number of proposals that intend to support groups achieving consensual decisions is growing year after year. Currently, there is a special interest in creating strategies to support disperse group decision-making processes and large-scale group decision-making events [10,27]. Despite sharing some characteristics with other methods, namely the consistency analysis (which is similar to the AHP consistency analysis [28]) and the possibility to deal with different types of decision-makers [29], the framework proposed in this work is the only one (to the best of our knowledge) whose main concern is to provide a basis for the development of new MCDA methods. The major differences regarding the existing works are as follows: the possibility to use different strategies to achieve the same goal, which can be used separately or combined; the preferences definition is a simple process (enhancing the usability); all the strategies follow a pattern that allows to deduce the reasons behind the different recommendations and alerts; and the prediction of decision satisfaction, which can be used, among other things, to understand the decision maturity.

3. The Multiple Criteria Decision Analysis Framework

In this section, we present the proposed Multiple Criteria Decision Analysis Framework. First, we start by defining all the entities involved and then, all the algorithms and functions are presented and explained. The framework definition is accompanied by a practical example to facilitate its understanding. The example used from now on concerns the classic example of a group of friends that need to decide on a restaurant to have dinner and is based on the one described in [30]. Table 1 presents all the necessary notations to help understand the framework formalization.

3.1. Definition of the Entities and How They Relate

In a GDM problem, there is a set of decision-makers D M = { d m 1 , d m 2 , , d m n } that (together) have to choose one alternative a i from a set of alternatives A = { a 1 , a 2 , , a m } . There is also a set of criteria C = { c 1 , c 2 , , c p } , and each criterion c j is related to each alternative a i . A decision matrix D is composed by a relation between A and C .
Definition 1.
Let D be the decision matrix D = A × C , where:
  • C is the set of criteria C = { c 1 , c 2 , , c p } ,   p > 1 ;
  • A is the set of alternatives A = { a 1 , a 2 , , a m } , m > 1 .
Rule 1.
a i A , c j C , d c j a i D , each criterion c j C is related to each alternative a i A , so d c j a i is the value of criterion c j in alternative a i . There cannot exist an alternative with values in criteria that are not defined in the problem.
Definition 2.
A criterion c j = { i d c j , t y p e c j , g r e a t c j } consists of:
  • c j C , j { 1 , 2 , , p } ;
  • i d c j is the identification of a particular criterion;
  • t y p e c j is the type of a particular criterion (Numeric, Boolean or Classificatory);
  • g r e a t c j is the greatness associated with the criterion (Maximization, Minimization or Subjective).
The example of choosing a restaurant is composed of 9 criteria, defined as follows:
  • d i s t a n c e = { c 1 , N u m e r i c , M i n i m i z a t i o n } ; //minutes
  • t r a n s p o r t E x p e n s e s = { c 2 , N u m e r i c , M i n i m i z a t i o n } ; //dollars
  • s p e e d O f S e r v i c e = { c 3 ,   N u m e r i c , M i n i m i z a t i o n } ; //minutes
  • q u a l i t y O f T h e F o o d = { c 4 , C l a s s i f i c a t o r y , M a x i m i z a t i o n } ; //good, ok or poor
  • m e a l P r i c e = { c 5 ,   N u m e r i c , M i n i m i z a t i o n } ; //dollars
  • a t m o s p h e r e = { c 6 ,   B o o l e a n , M a x i m i z a t i o n } ; //true or false
  • w i n e = { c 7 ,   B o o l e a n , M a x i m i z a t i o n } ; //true or false
  • c u i s i n e S t y l e = { c 8 ,   C l a s s i f i c a t o r y , S u b j e c t i v e } ; //thai, italian or american
  • h e a l t h y = { c 9 ,   B o o l e a n , M a x i m i z a t i o n } . //true or false
Definition 3.
An alternative a i = { i d a i } consists of:
  • a i A , i { 1 , 2 , , m } ;
  • i d a i is the identification of a particular alternative.
We can now define the desirable set of alternatives:
  • z i n g a r a = { a 1 } ;
  • t h a i P a l a c e = { a 2 } ;
  • n o s h = { a 3 } .
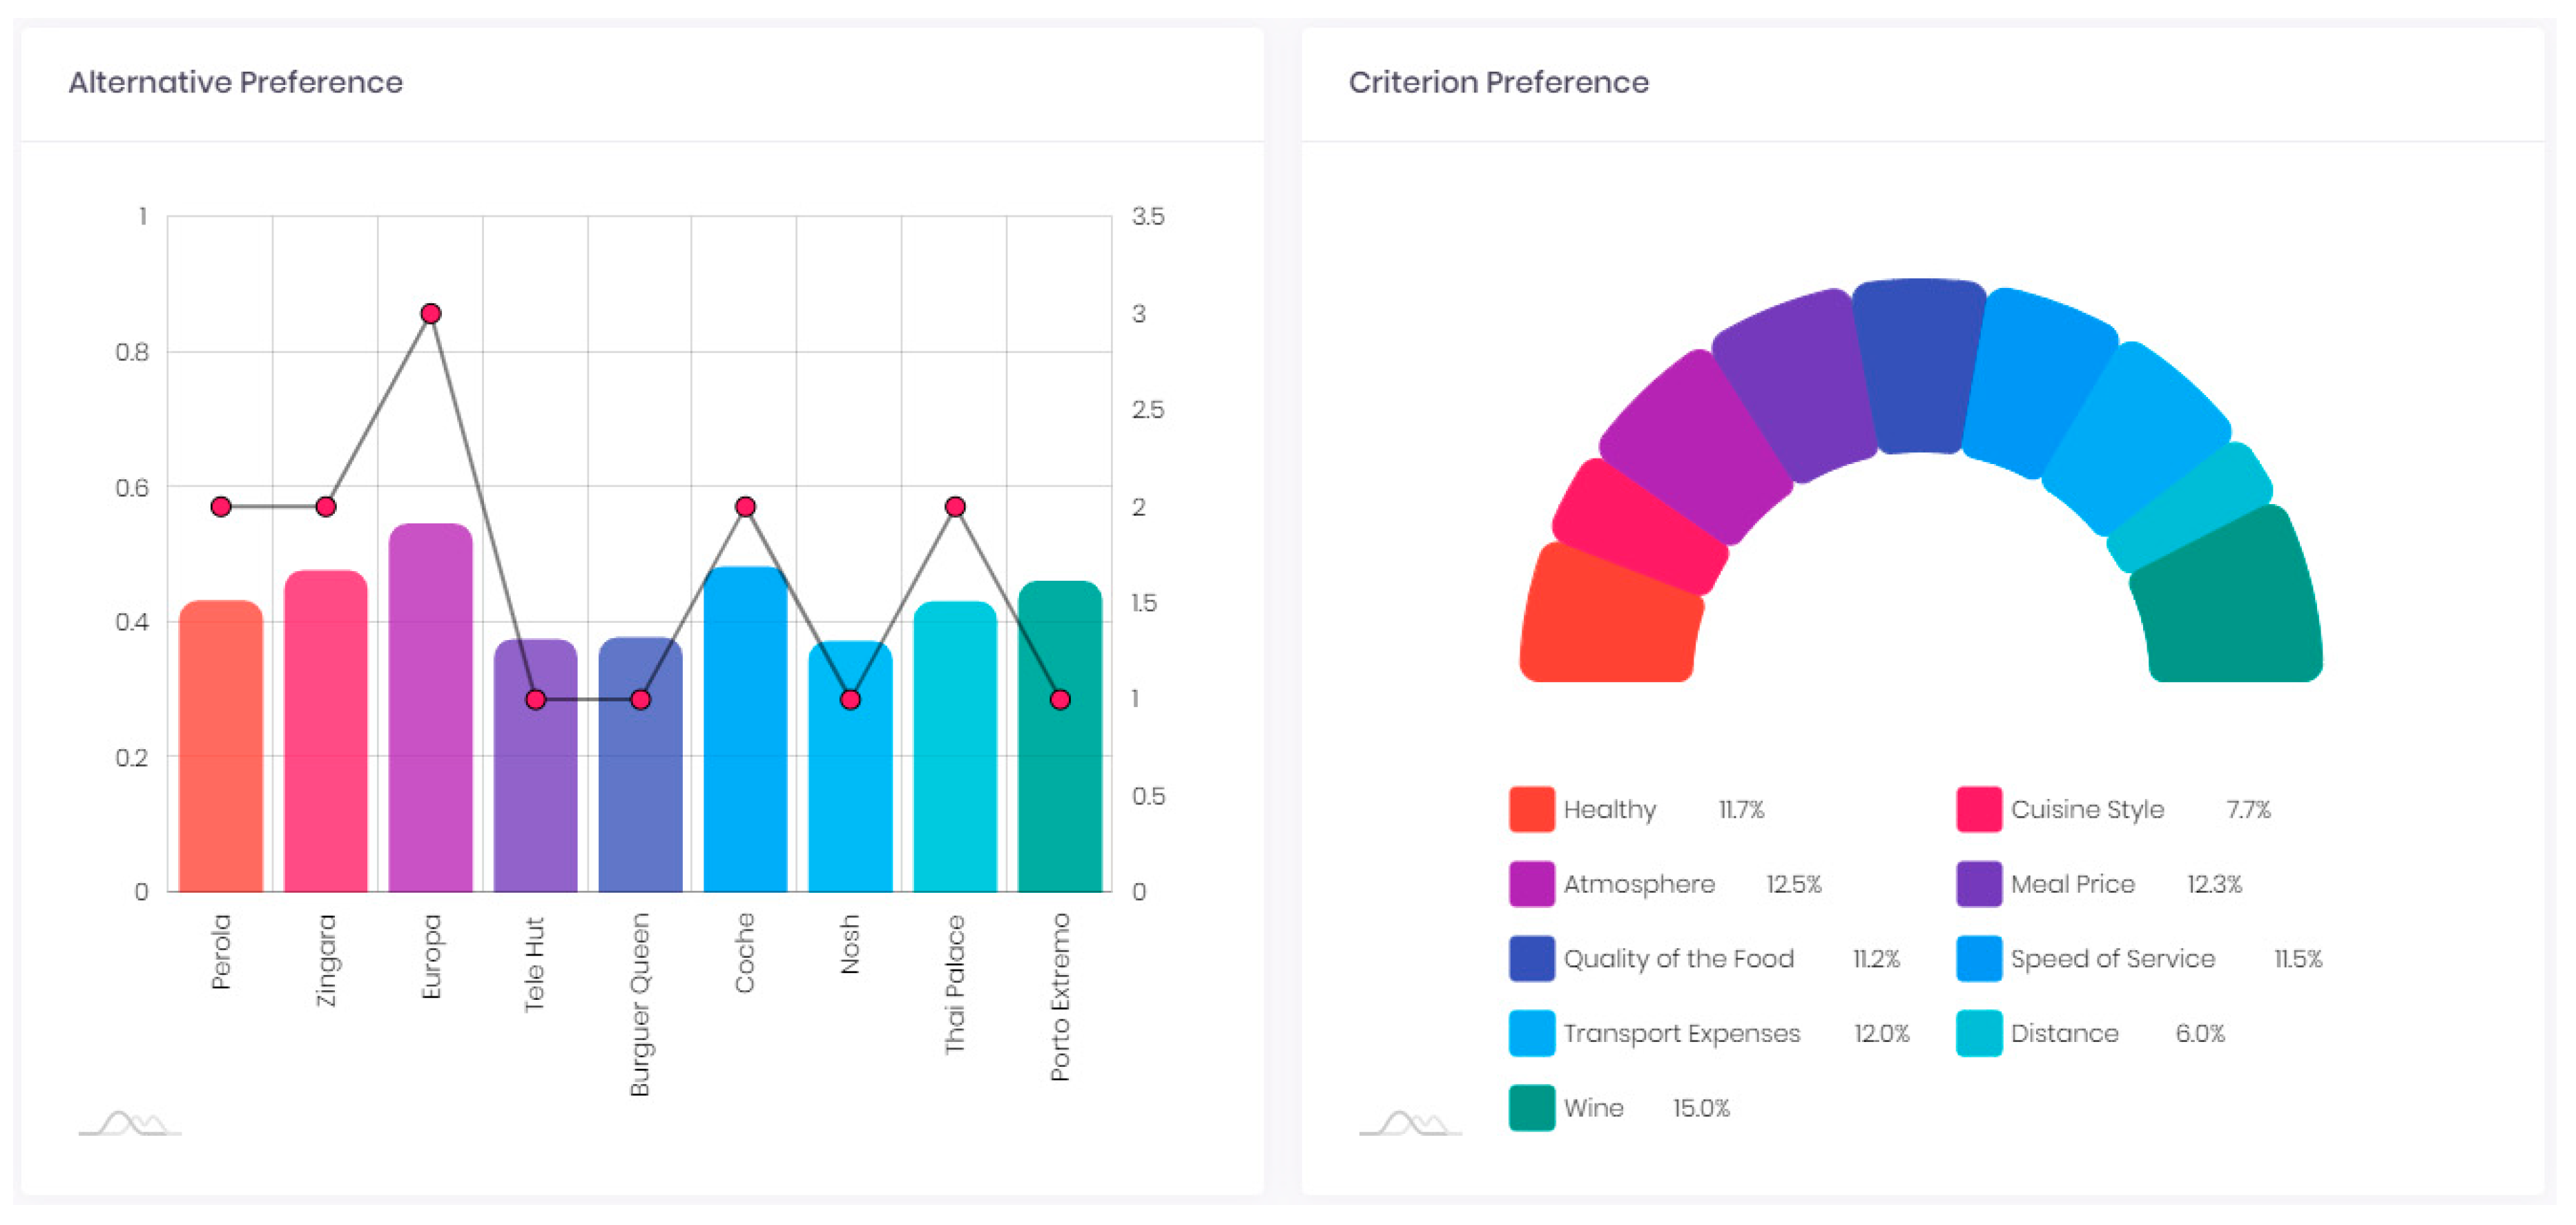
In our example, the decision matrix is as follows:
D = A × C = [ 5 0 90 3 25 1 1 1 1 10 10 60 3 15 1 1 1 1 1 0 15 1 7 0 0 1 0 ]
As can be seen in the example, although the criteria value can be Numeric, Boolean, or Classificatory, internally they are all interpreted as Numeric. When the criterion type is Boolean, we assume f a l s e = 0 and t r u e = 1 , when the criterion type is Classificatory, the scale is converted into the corresponding values (in our example G o o d = 3 , O k = 2 and P o o r = 1 ), and when the criterion greatness is Subjective, the instantiation of each criterion in each alternative is always 1 (as is the case of the criterion cuisineStyle).
Usually, most MCDA methods only consider the decision-makers’ preferences on alternatives and criteria, i.e., the decision process is seen as a fully rational process. However, there are many human particularities that affect and are important in decision processes. According to the winner of 2017 Economics Nobel Prize (Richard Thaler), much more should be considered, and a decision process should not be seen only from a rational perspective. In this work, we follow that vision. We consider the existence of a heterogeneous group of decision-makers and consequently, we contemplate a set of attributes to model each decision-maker according to his/her own particularities, interests, and intentions.
Next, we introduce the decision-maker definition and all the definitions associated with the decision-makers representation.
Definition 4.
Let D M be a set of decision-makers where:
  • D M = { d m 1 , d m 2 , , d m n } , n > 1 .
Definition 5.
Let w a d m k a i be the weight or preference given to a certain alternative a i A by a decision-maker d m k D M .
Rule 2.
A decision-maker d m k can define a set of alternatives weights where:
  • W a d m k = { w a d m k a 1 , w a d m k a 2 , ,   w a d m k a m } , m > 1 ;
  • 0 w a d m k a i 1 , i { 1 , 2 , , m } ;
  • W a d m k = A .
Definition 6.
Let w c d m k c j be the weight or preference given to a certain criterion c j C by a decision-maker d m k D M .
Rule 3.
A decision-maker d m k can define a set of criteria weights where:
  • W c d m k = { w c d m k c 1 , w c d m k c 2 , ,   w c d m k c p } , p > 1 ;
  • 0 w c d m k c j 1 , j { 1 , 2 , , p } ;
  • W c d m k = C .
In order to help decision-makers express their preferences regarding alternatives and criteria [25,31,32], several strategies can be applied. One of the preference structures most used in GDM problems defined under uncertainty, is the so-called fuzzy preference relation [33], but there are others, such as multiplicative preference relation [34] and linguistic preference relation [35]. In this work, we follow the one presented in [36], which consists of classifying the preferences individually according to an adaptation of the Visual Analog Scale, although, due to the alternatives and criteria alignment on the screen, they are unconsciously being visually compared to each other. As we will see later, the decision-makers’ preferences regarding alternatives and criteria are used to define the alternatives and criteria importance according to a specific scale. Decision-makers are not obliged to define a preference for all alternatives and criteria, however, the alternatives and criteria without a defined preference will be (internally) considered as 0.
Definition 7.
A decision-maker d m k = { i d d m k , W a d m k , W c d m k , D M c r e d i b l e d m k , C S d m k , C O d m k , e d m k } consists of:
  • i d d m k is the identification of a particular decision-maker;
  • D M c r e d i b l e d m k is the set of decision-makers that decision-maker d m k considers as credible, D M c r e d i b l e d m k D M ;
    C S d m k is the value of the Concern for Self of decision-maker d m k chosen style of behavior;
  • C O d m k is the value of the Concern for Others of decision-maker d m k chosen style of behavior;
  • e d m k is the expertise level of decision-maker d m k .
Besides the unique identification and the preferences for alternatives and criteria, it is possible to define for each decision-maker d m k the set of decision-makers (from the set of decision-makers involved in the decision process) that he/she considers credible in a specific decision problem. The credibility is multifold, i.e., a decision-maker can identify another decision-maker as credible due to different reasons, such as reputation, expertise level and/or hierarchy. Following the behavior styles proposed by the authors in [15], which can be used to model decision-makers according to their intentions, it is possible to represent the decision-maker’s concerns in attaining his/her own objectives (Concern for Self) and the other decision-makers’ objectives (Concern for Others). This is possible due to the solid “operating values” the authors found for the five behavior styles (see Table 2). The proposed behavior styles vary in four dimensions being two of them Concern for Self and Concern for Others. The “operating values” resulted from a questionnaire, where the authors asked the participants to classify the five behavior styles in the four dimensions. The objective was to understand if the participants had a similar perception of the meaning of each behavior style. The results demonstrated high levels of agreement, which allowed one to define standards for each behavior style.
Lastly, it is possible to define an expertise level for each decision-maker. The decision-maker’s expertise level is expressed in a [0, 1] interval, where 0 means a very low level of expertise and 1 stands for a very high level of expertise.
For our example, let’s consider the existence of three decision-makers:
  • h a r r y = { d m 1 , [ 0.75 , 0.90 , 0.25 ] , [ 0.5 , 0.25 , 0.25 , 0.75 , 0.5 , 0.75 , 0.75 , 0.9 , 0.75 ] ,   [ g e o r g e , j a n e ] , 0.548 , 0.616 , 0.5 } ;
  • g e o r g e = { d m 2 , [ 0.5 , 0.5 , 0.75 ] , [ 0.75 , 0.9 , 0.25 , 0.5 , 0.9 , 0.75 , 0.75 , 0.25 , 0.25 ] ,   [ h a r r y , j a n e ] , 0.548 , 0.616 , 0.5 ;
  • j a n e = { d m 3 , [ 0.90 , 0.75 , 0.25 ] , [ 0.5 , 0.25 , 0.25 , 0.9 , 0.25 , 0.75 , 0.75 , 0.75 , 0.75 ] ,   [ h a r r y , g e o r g e ] , 0.548 , 0.616 , 0.5 } .
Definition 8.
Let W a D M be the set of alternatives weights of a set of decision-makers D M where:
  • W a D M = { W a d m 1 , W a d m 2 , , W a d m n } , n > 1 .
Definition 9.
Let W c D M be the set of criteria weights of a set of decision-makers D M where:
  • W c D M = { W c d m 1 , W c d m 2 , , W c d m n } , n > 1 .
Definition 10.
Let A P D M be an alternatives preference matrix that relates each alternative with the correspondent evaluation made by each decision-maker, where:
  • A P D M = A × W a D M = [ W a d m 1 a 1 W a d m 2 a 1 W a d m n a 1 W a d m 1 a 2 W a d m 2 a 2 W a d m n a 2 W a d m 1 a m W a d m 2 a m W a d m n a m ]
Definition 11.
Let C P D M be a criteria preference matrix that relates each criterion with the correspondent evaluation made by each decision-maker, where:
  • C P D M = C × W c D M = [ W c d m 1 c 1 W c d m 2 c 1 W c d m n c 1 W c d m 1 c 2 W a d m 2 c 2 W c d m n c 2 W c d m 1 c p W c d m 2 c p W c d m n a p ]
So far, the main entities and values that will be used in our example were presented. Next, we will demonstrate how to handle this data in order to create new intelligence, reduce the decision problem’s complexity, and to generate the appropriate recommendations.

3.2. Forecasting the Importance of Each Alternative/Criterion from the Perspective of Each Decision-Maker

The decision-makers’ preferences are no more than a numerical evaluation of alternatives and criteria. Obviously, it allows us to understand the more and less preferred alternatives and criteria. However, that does not say much in terms of how important an alternative/criterion is to a specific decision-maker. To forecast the importance of each alternative/criterion from the perspective of each decision-maker, we start by readjusting the decision-makers’ preferences according to the context, i.e., by including the irrational side of the decision in the math. In order to do so, we ponder the decision-maker’s preferences regarding the decision problem alternatives with the defined level of Concern for Self, Concern for Others, expertise, and with the preferences of decision-makers that he/she pointed as credible.
Definition 12.
The correlation between the decision-maker’s style of behavior, expertise level and decision-makers he/she considers credible is defined as follows:
d m k D M , a i A , w a d m k a i = w a d m k a i × C S d m k × e d m k + ( T P N D ) × C O d m k × e d m k C S d m k × e d m k + C O d m k × e d m k
where:
  • T P is the sum of the weights given to alternative a i by each of the credible decision-makers in D M c r e d i b l e d m k , T P = x = 1 N D w a d m x a i ;
  • N D is the number of credible decision-makers to d m k such that N D = D M c r e d i b l e d m k ;
  • e d m k is the inverse of expertise level of decision-maker d m k (calculated as 1 e d m k ).
Each w a d m k a i is associated with the d m k ’s Concern for Self and expertise level, while the average preference for a i to the decision-makers marked as credible by d m k is associated with the d m k ’s Concern for Others and d m k ’s inverse of expertise level. In this way, after the readjustment, the new w a d m k a i value will reflect not only the decision-makers’ preferences but also the context, their motivations and more.
After readjusting the decision-makers’ preferences, the difference between the alternative/criterion with the highest evaluation and the alternative/criterion with the lowest evaluation is compared, since we believe the evaluation range used by the decision-makers can be an important indicator.
Definition 13.
Let F D i f ( arg ) be a function that returns the difference (according to the preferences defined by d m k ) between the maximum and minimum weights given to alternatives or criteria that belong to a set of weights ( arg is a list of alternatives or criteria weights):
F D i f ( W a d m k ) = { max ( W a d m k ) min ( W a d m k ) ,   i f   max ( W a d m k ) min ( W a d m k ) max ( W a d m k )
F D i f ( W c d m k ) = { max ( W c d m k ) min ( W c d m k ) ,   i f   max ( W c d m k ) min ( W c d m k ) max ( W c d m k )
F D i f ( W a d m k ) returns d i f , the difference (according to the preferences defined by d m k ) between the alternative with the highest weight and the alternative with the lowest weight, while F D i f ( W c d m k ) returns the difference between the criterion with the highest weight and the criterion with the lowest weight. The result of F D i f can be classified into one of the five possible levels presented in Table 3.
The difference (using function F D i f ) between the criterion or alternative with more weight and the criterion or alternative with less weight allows to obtain (according to Table 3) the l value.
Definition 14.
Let F l ( d i f ) be a function that returns the l value for d i f according to Table 3, 0 d i f 1 .
The l value allows to have another look over the preferences defined by the decision-makers. Let us suppose d m y defined the preferences [0.4, 0.4, 0.8] and d m z defined the preferences [0.5, 0.5, 0.9], both for alternatives a 1 , a 2 and a 3 , respectively. Can we say that d m y prefers a 3 more than d m z prefers a 3 ? We believe not, because people have different perceptions of the world around them. That is why we try to understand the decision-makers’ configurations in terms of meaning.
After identifying the l value, we can execute Algorithm 1 to find the predicted importance that each criterion and alternative have to each decision-maker. Remember that this prediction considers the readjustment of the decision-makers’ preferences considering the decision problem as a whole.
Algorithm 1 is also used to classify the importance of each criterion but is applied to each c j C and the weights considered belong to the set Wc DM . After i m p d m k a i (the predicted importance of alternative a i to decision-maker d m k ) and i m p d m k c j (the predicted importance of criterion c j to decision-maker d m k ) have been identified for each alternative and criterion, we can classify them according to their respective value (the meaning of the values is presented in Table 4).
Algorithm 1. Alternatives’ importance classification algorithm.
 1: foreach ( dm k DM )
2:  foreach ( a i A )
3:     imp 1
4:   while ( ( wa dm k a i ( max ( Wa dm k ) imp × F Dif ( Wa dm k ) l ) ) imp < 5 ) do
5:     imp imp + 1
6:   end while
7:    imp dm k a i 6 imp
8:  end foreach
9: end foreach
Coming back to our example, Table 5 presents the predicted importance regarding the decision problem alternatives from the perspective of each decision-maker.
In Table 6, the predicted importance regarding the decision problem criteria from the perspective of each decision-maker is presented.

3.3. Recommending Alternatives to Reject and as Solution

With the calculated importance predicted values, we now have the necessary data to work in the recommendation methods, i.e., the methods to recommend alternatives to reject in order to reduce the decision problem’s complexity and to recommend an alternative as solution.

3.3.1. Recommending based on the Alternatives/Criteria Predicted Importance

The first strategy consists of recommending alternatives to reject and as a solution based on forecasts of importance.
Definition 15.
Let A I m p d m k be the set of importance values for all the alternatives to decision-maker d m k , where:
  • A I m p d m k = { i m p d m k a 1 , i m p d m k a 2 , , i m p d m k a m } , m > 1 ;
  • A I m p d m k = A .
Definition 16.
Let C I m p d m k be the set of importance values for all the criteria to decision-maker d m k , where:
  • C I m p d m k = { i m p d m k c 1 , i m p d m k c 2 , , i m p d m k c p } , p > 1 ;
  • C I m p d m k = C .
Definition 17.
Let A E D M be an alternatives evaluation matrix, where:
  • A E D M = A × W A I m p D M = [ i m p d m 1 a 1 i m p d m 2 a 1 W i m p d m k a 1 i m p d m 1 a 2 i m p d m 2 a 2 i m p d m k a 2 i m p d m 1 a m i m p d m 2 a m i m p d m k a m ]
After defining the evaluation matrix A E D M , we can now execute Algorithm 2, which selects the alternatives with worst classification to be rejected ( s e l e c t e d A l t s T o R e j e c t ) based on their importance value.
Algorithm 2. Algorithm for selecting the alternatives candidate to rejection.
1:  value 1
2: while ( selectedAltsToReject . size ( ) = = 0 value 5 ) do
3:  foreach ( a i A )
4:    flag true
5:   foreach ( dm k DM )
6:    if ( AE DM [ a i ] [ dm k ] > value ) then flag false
7:   end foreach
8:   if ( flag = = true ) then insert a i into selectedAltsToReject
9:   end foreach
10:   value value + 1
11: end while
Algorithm 2 iterates through the A E D M matrix and starts by iterating all the alternatives importance values in order to find at least an alternative whose importance has the lowest possible value (which corresponds to the Insignificant classification, v a l u e = = 1 ) for all the decision-makers. If an alternative is not found, the algorithm reiterates again with an increased value ( v a l u e + + ) and the process is repeated until at least one alternative is found. This means that in the worst-case scenario, all the alternatives will be classified as Very Important by at least one of the decision-makers. In that case, all the alternatives will be selected.
In our example, the Algorithm 2 output is: s e l e c t e d A l t s T o R e j e c t = = [ n o s h ] .
If the intention is to select an alternative to be proposed as a solution, we can execute Algorithm 3, which selects the alternatives with the best classification as candidate solutions ( s e l e c t e d A l t s T o P r o p o s e ) based on their importance value.
Algorithm 3 iterates through the A E D M matrix and starts by iterating all the alternatives importance values in order to find at least an alternative whose importance has the highest possible value (which corresponds to the Very Important classification, v a l u e = = 5 ) for all the decision-makers.
Algorithm 3. Algorithm for selecting the alternatives as candidate solutions.
1:  value 5
2: while ( selectedAltsToPropose . size ( ) = = 0 value 1 ) do
3:  foreach ( a i A )
4:    flag true
5:   foreach ( dm k DM )
6:    if ( AE DM [ a i ] [ dm k ] < value ) then flag false
7:   end foreach
8:   if ( flag = = true ) then insert a i into selectedAltsToPropose
9:   end foreach
10:   value value 1
11: end while
If an alternative is not found, the algorithm reiterates again with a decreased value ( v a l u e ) and the process is repeated until at least one alternative is found. This means that in the worst-case scenario all the alternatives will be classified as Insignificant by at least one of the decision-makers. In this case all the alternatives will be selected.
In our example, the Algorithm 3 output is: s e l e c t e d A l t s T o P r o p o s e = = [ z i n g a r a , t h a i P a l a c e ] .
There may be cases where several alternatives can be added to the s e l e c t e d A l t s T o R e j e c t list or to the s e l e c t e d A l t s T o P r o p o s e list. For those cases, we propose a consistency method that allows to recommend the rejection of the least consistent alternative(s) or the proposal of the most consistent alternative(s).
The consistency method starts by comparing the difference between the importance of c j to a i and the predicted importance of c j to each decision-maker, but only for decision-makers with a predicted importance for c j higher than 3 (criteria with a predicted importance of important or very important). Then, all these differences are added, and the result is divided by D M . Next, we show how the importance of c j to a i is calculated.
First, we start by normalizing D to make the criteria values comparable to each other, i.e., the relevance of each criterion in each alternative. The normalization will allow to understand what reasons make an alternative better than another.
Definition 18.
Let D be a normalized decision matrix such that
d c j a j D , d c j a j = { d c j a j b = 1 A d c j a j 2 ,   g r e a t c j = Maximization , S u b j e c t i v e 1 d c j a j b = 1 A d c j a j 2 ,   g r e a t c j = Maximization
The D for our example is presented in Table 7.
The next step consists of applying to D a process like the one applied to the definition of the alternatives and criteria importance to each decision-maker. For that, for each criterion, we calculate the difference between the instance of c j with the highest value and the instance of c j with the lowest value. For example, F D i f d i s t a n c e = 0.910912919 0.109129194 . Then, we use Table 3 to find the l value, followed by the Algorithm 4 to define the importance levels.
Algorithm 4. The relevance that the value of each criterion c j has in alternative a i based on an overall appreciation of the criterion value in all alternatives.
1: foreach ( a i A )
2:  foreach ( d c j a i D )
3:    imp 1
4:   while ( (   d   c j a i ( max (   d   c a i ) imp × F Dif distance (   d   c a i ) l ) ) imp < 5 ) do
5:     imp imp + 1
6:   end while
7:    imp d c j a i 6 imp
8:  end foreach
9: end foreach
Table 8 presents the importance of each criterion to the existing alternatives.
Definition 19.
Let C I m p a i be the set of importance values of all the criteria to alternative a i , where:
  • C I m p a i = { i m p c 1 a i , i m p c 2 a i , , i m p c p a i } , p > 1 ;
  • C I m p a i = C .
After defining the criteria importance for all the alternatives, we can now proceed to the definition of the consistency method.
Definition 20.
Let F C r i t e r i o n C o n s i s t e n c y ( d m k , c j , a i ) be a function that returns the difference between the importance of a criterion c j C to an alternative a i A and the importance of the same criterion c j C to a decision-maker d m k D M :
F C r i t e r i o n C o n s i s t e n c y ( d m k , c j , a i ) = { 0 , i f   g r e a t c j = S u b j e c t i v e i m p d c j a i i m p d m k c j , i f   i m p d m k c j > 3 0 , i f   i m p d m k c j 3
As previously referred, the consistency method only considers the differences when i m p d m k c j > 3 . After calculating the criteria consistency for each decision-maker, we are now in conditions of defining a consistency matrix for each decision-maker.
Definition 21.
Let C M d m k be the consistency matrix of the decision-maker d m k , where ( F c c stands for F C r i t e r i o n C o n s i s t e n c y ):
  • C M d m k = [ F C C ( d m k , c 1 , a 1 ) F C C ( d m k , c 2 , a 1 ) F C C ( d m k , c p , a 1 ) F C C ( d m k , c 1 , a 2 ) F C C ( d m k , c 2 , a 2 ) F C C ( d m k , c p , a 2 ) F C C ( d m k , c 1 , a m ) F C C ( d m k , c 2 , a m ) F C C ( d m k , c p , a m ) ]
Definition 22.
Let F A l t e r n a t i v e C o n s i s t e n c y ( d m k , a i ) be a function which returns the sum of all consistency values for an alternative a i for the decision-maker d m k :
F A l t e r n a t i v e C o n s i s t e n c y ( d m k , a i ) = j = 1 C F C r i t e r i o n C o n s i s t e n c y ( d m k , c j , a i )
If we apply the F A l t e r n a t i v e C o n s i s t e n c y function to the alternatives presented in s e l e c t e d A l t s T o R e j e c t list for each decision-maker we will get:
  • F A l t e r n a t i v e C o n s i s t e n c y ( h a r r y , n o s h ) = 15 ;
  • F A l t e r n a t i v e C o n s i s t e n c y ( g e o r g e , n o s h ) = 8 ;
  • F A l t e r n a t i v e C o n s i s t e n c y ( j a n e , n o s h ) = 15 .
If we apply the F A l t e r n a t i v e C o n s i s t e n c y function to the alternatives presented in s e l e c t e d A l t s T o P r o p o s e list for each decision-maker we will get:
  • F A l t e r n a t i v e C o n s i s t e n c y ( h a r r y , z i n g a r a ) = 0 ;
  • F A l t e r n a t i v e C o n s i s t e n c y ( g e o r g e , z i n g a r a ) = 6 ;
  • F A l t e r n a t i v e C o n s i s t e n c y ( j a n e , z i n g a r a ) = 0 ;
  • F A l t e r n a t i v e C o n s i s t e n c y ( h a r r y , t h a i P a l a c e ) = 0 ;
  • F A l t e r n a t i v e C o n s i s t e n c y ( g e o r g e , t h a i P a l a c e ) = 9 ;
  • F A l t e r n a t i v e C o n s i s t e n c y ( j a n e , t h a i P a l a c e ) = 0 .
Definition 23.
Let F C o n s i s t e n c y be a function which returns the average of F A l t e r n a t i v e C o n s i s t e n c y for all decision-makers:
F C o n s i s t e n c y ( a i ) = k = 1 D M F A l t e r n a t i v e C o n s i s t e n c y ( d m k , a i ) D M
In our example, F C o n s i s t e n c y ( n o s h ) = 12 , 667 and it would be the alternative proposed to be rejected. Regarding the alternatives to propose as a solution, F C o n s i s t e n c y ( z i n g a r a ) = 2 and F C o n s i s t e n c y ( t h a i P a l a c e ) = 3 , z i n g a r a would be proposed as a possible solution.

3.3.2. Recommending Based on the Prediction of Decision Satisfaction

So far we have presented all the necessary entities and definitions to implement a MCDA method capable of proposing solutions, recommending alternatives to reject and fundamentally, of executing those tasks using a method that deduces the reasons behind those proposals/recommendations. However, it is also essential to predict how the decision quality is perceived from the perspective of each decision-maker and the group. For instance, decision-makers who consider unsatisfactory a certain solution may be advised to review inconsistent assessments or to share with the group the reasons why certain criteria are more important. The discussion about the importance of the criteria may lead decision-makers to consider other perspectives, influencing them to redefine their preferences, promoting consensus. Next, we will introduce a set of definitions that intends to predict the decision quality through the analysis of the decision-makers’ satisfaction. As is evidenced in several studies, the study of the decision-makers’ satisfaction can be a strong indicator of the decision quality [37,38]. The satisfaction analysis allows to understand the impact of a certain choice in a certain time instant according to the context of that time instant. The context is not only the social context or the current dynamics but also a reflection of the decision-makers’ sentiments regarding a possible solution, according to the knowledge they have in that time instant. Therefore, we adapted to this framework a simpler version of the model proposed in [38] that intends to predict the decision-makers’ satisfaction (perception of the decision quality). The used satisfaction scale is presented in Table 9, with the predicted satisfaction belonging to the interval [ 1 ,   1 ] .
Definition 24.
Let F S a t i s f a c t i o n W S B ( d m k , a i ) be a function which returns the predicted satisfaction of decision-maker d m k regarding alternative a i without the inclusion of the decision-maker’s style of behavior ( a y is the decision-maker’s d m k most preferred alternative with the initial weights, i.e., before the readjustment performed in definition 12):
F S a t i s f a c t i o n W S B ( d m k , a i ) = ( 1 | 2 w a d m k a i 1 | ) ( w a d m k a i w a d m k a y ) + 2 w a d m k a i 1
In our example, F S a t i s f a c t i o n W S B ( h a r r y , zingara ) = 0.425 , F S a t i s f a c t i o n W S B ( g e o r g e , zingara ) = 0.25 and F S a t i s f a c t i o n W S B ( j a n e , zingara ) = 0.8 .
Definition 25.
Let F S a t i s f a c t i o n C r e d ( d m k , a i ) be a function which returns the average satisfaction of the D M c r e d i b l e d m k :
F S a t i s f a c t i o n C r e d ( d m k , a i ) = w = 1 D M c r e d i b l e d m k F S a t i s f a c t i o n W S B ( d m w , a i ) D M c r e d i b l e d m k
In our example, F S a t i s f a c t i o n C r e d ( h a r r y , zingara ) = 0.275 , F S a t i s f a c t i o n C r e d ( g e o r g e , zingara ) = 0.6125 and F S a t i s f a c t i o n C r e d ( j a n e , zingara ) = 0.0875 .
Definition 26.
Let F S a t i s f a c t i o n ( d m k , a i ) be a function which returns the predicted satisfaction of a decision-maker d m k regarding the alternative a i with the inclusion of the decision-maker’s Concern for Self and Concern for Others:
F S a t i s f a c t i o n ( d m k , a i ) = F S a t i s f a c t i o n W S B ( d m k , a i ) C S + F S a t i s f a c t i o n C r e d ( d m k , a i ) C O C S + C O
In our example, F S a t i s f a c t i o n ( h a r r y , zingara ) = 0.345619 , F S a t i s f a c t i o n ( g e o r g e , zingara ) = 0.206443 and F S a t i s f a c t i o n ( j a n e , zingara ) = 0.422938 .
Definition 27.
Let F G r o u p S a t i s f a c t i o n ( a i ) be a function which returns the decision-makers D M predicted satisfaction regarding alternative a i :
F G r o u p S a t i s f a c t i o n ( a i ) = k = 1 D M F S a t i s f a c t i o n ( d m k , a i ) D M
In our example, F G r o u p S a t i s f a c t i o n ( zingara ) = 0.325 .

4. Scenarios of Application

In this section, we walk through some of the framework’s functionalities. As mentioned before, GDM processes with dispersed elements are extremely complex. The limitations associated with the communication is one of the main reasons. In order to benefit from the advantages associated with GDM processes in this kind of context (to exchange ideas, to understand the reasons behind other decision-makers’ preferences, to create new intelligence, among others [39]), specific conditions need to be created. First, the support systems should have the capability of understanding that the best decisions generally take time, i.e., the period of time that comprehends the decision process should be respected. Second, regardless of how important it is to propose solutions, the main focus should be to support the process, i.e., how much a decision-maker can benefit from interacting with the system? That means, besides the basic information that can be deduced from the decision-makers’ configurations and through a superficial analysis of their preferences (over alternatives and criteria), the system should include methods to see beyond that data. This framework arises from the need to overcome those limitations and aims to be an important tool for researchers and developers that intend to include mechanisms capable of supporting groups in attaining higher quality decisions in their systems or projects. So, we will show how the framework can be used to get important information for the decision processes, by starting with the simpler tasks and then advancing to the more complex ones.

4.1. Recommending an Alternative(s) to Reject or as a Feasible Solution(s)

First of all, it is important to highlight that all the recommendations and proposals made by a support system can have an enormous impact in the outcome of a decision process, and consequently, in the future of organizations or other entities. So, the planning of these tasks should be rigorous and concrete.
Several strategies can be used to propose a feasible solution. The first strategy consists of using Algorithm 3 to select the alternatives with the best classification (according to their degree of importance) and then, the consistency method to select the most consistent alternative from the list of alternatives with the best classification. The second strategy consists of proposing the alternative with the highest predicted satisfaction as solution. The third strategy consists of using the consistency method to calculate the most consistent alternative and propose it as a solution. Finally, some other strategies can be developed by mixing the previous strategies.
Regarding the recommendation of an alternative(s) to reject to reduce the problem complexity, the same previous strategies can be used but, of course, inversely. The major difference regards the first strategy where Algorithm 2 should be used instead.

4.2. Explaining the Reasons Behind the Different Recommendations/Proposals (to Reject or to Accept)

As have been mentioned before, to be capable of explaining the reasons behind the different recommendations/proposals is a crucial task for preventing the creation of entropy. So, this framework was planned in order to allow a natural deduction of those recommendations/proposals. In this section. we explore only some possible strategies to perform that deduction.
In the context of recommending or proposing alternative(s) as a possible solution, or to reject, two main situations can be identified. The first regards the need to explain the reasons that lead to that proposal. The second regards the need to explain why an alternative a x is proposed over an alternative a y . For both situations, when an alternative(s) is recommended as a possible solution, or to reject, the reasons are obviously related to the predicted satisfaction. That means, according to the decision-makers’ beliefs, the proposed alternative is the best or the worst from the set of available alternatives. It is important to refer that aspects such as, behavior style, expertise level, and credibility are included in the prediction. So, in this case, the framework data structure can be used to present the decision-makers’ expertise levels, their behavior style, their preferences (regarding alternatives and criteria) and the decision-makers that each one marked as credible. There may be cases in which these data can be marked as “private” and the access to this information can be limited. Also, the predicted satisfaction for each decision-maker regarding the recommended alternative can be shown. The prediction of satisfaction or the prediction of decision quality is contextual, i.e., the same solution can have different assessments at different periods of time in terms of satisfaction prediction. A good way of illustrating that is to think of situations in which people make impulsive decisions. In those scenarios, the decision-maker certainly considers his/her decision as good, so, from his/her point of view the quality of decision is high. However, it is common that just a couple of seconds later the person in question regrets his/her decision. This can also happen in GDM, especially when the group suffers from “groupthink”. This issue is easily solved by the proposed framework, because the consistency mechanism can be used to validate the decision consistency. Nevertheless, other strategies can also be used to understand the maturity of the decision.
To understand the reasons behind the proposal of an alternative(s) as a possible solution based on the consistency analysis, several possibilities can be explored. Next is an example of a possibility.

4.2.1. Step 1

The first step consists of selecting all the criteria that have at least an importance of 4 (Table 6) for at least one decision-maker. For that, we use the C I m p d m k of each decision-maker. In our example, the criteria list would then be distance, transportExpenses, qualityOfTheFood, mealPrice, atmosphere, wine, cuisineStyle, and healthy.

4.2.2. Step 2

The second step consists of eliminating the worst values for C I m p a i in the proposed alternative from the list of criteria defined in Step 1. Finally, the criteria with a subjective greatness ( g r e a t c j = S u b j e c t i v e ) and all the criteria with an importance lower than 4 for the proposed alternative must be eliminated ( C I m p a i ). In our example, the criteria list would become: transportExpenses, qualityOfTheFood, atmosphere, wine and healthy.

4.2.3. Step 3

The third and last step consists of ordering the criteria list for the proposed alternative from the most to the less important. In our example, zingara is the proposed alternative because of the criteria transportExpenses, qualityOfTheFood, atmosphere, wine and healthy.
Decision-makers are usually interested in understanding the reasons why an alternative was proposed instead of another. Let us imagine we have to explain why zingara was proposed instead of thaiPalace. For that, we use the consistency matrix ( C M d m k ) of each decision-maker, which in our example are the following:
C M d m 1 = [ 0 0 0 0 0 0 0 0 0 0 0 0 0 0 0 0 0 0 0 0 0 3 0 4 4 0 4 ]
C M d m 2 = [ 2 0 0 0 4 0 0 0 0 4 4 0 0 1 0 0 0 0 0 0 0 0 0 4 4 0 0 ]
C M d m 3 = [ 0 0 0 0 0 0 0 0 0 0 0 0 0 0 0 0 0 0 0 0 0 3 0 4 4 0 4 ]
Remember that each cell on each consistency matrix refers to the calculus of F C r i t e r i o n C o n s i s t e n c y ( a i , c j , d m k ) , the columns to the criteria, and each row to an alternative. So, only the rows of the alternatives being compared are needed:
C M d m 1 = z i n g a r a t h a i P a l a c e [ 0 0 0 0 0 0 0 0 0 0 0 0 0 0 0 0 0 0 ]
C M d m 2 = z i n g a r a t h a i P a l a c e [ 2 0 0 0 4 0 0 0 0 4 4 0 0 1 0 0 0 0 ]
C M d m 3 = z i n g a r a t h a i P a l a c e [ 0 0 0 0 0 0 0 0 0 0 0 0 0 0 0 0 0 0 ]
Now, let us sum the corresponding cells of each decision matrix:
[ 2 0 0 0 4 0 0 0 0 4 4 0 0 1 0 0 0 0 ]
Finally, we just need to select all the criteria with a higher value for the proposed alternative. So, we can say that zingara is a better option than thaiPalace due to the distance and transportExpenses. In addition, decision-makers could have interest in knowing what reasons could make thaiPalace better than zingara, which according to this strategy, would be the mealPrice.

4.3. Presenting Other Relevant Data to the Decision Process

To make conscient and informed decisions, a GDSS must be capable of performing other tasks than the ones previously described. One of them should rely on providing all the necessary information for the decision-makers to reason, understand the context and create new intelligence. So, it is important, for instance, to present data about the other decision-makers’ preferences and the possible reasons for their preferences. Other important tasks should consist of creating alerts to advise decision-makers to think twice about inconsistencies in the evaluation of their preferences regarding alternatives and criteria. Although much more can be implemented, here are some examples of features that can be implemented using the proposed framework in order to fulfill the previously referred tasks:
  • Statistical information and aggregation data on preferences, satisfaction predictions, importance predictions according to the decision-makers’ behavior style, their levels of expertise, the preferences of the decision-makers considered most credible, among others;
  • To measure the consistency level of the alternative evaluation that each decision-maker made;
  • To alert the decision-makers of (too) inconsistent evaluations;
  • To suggest the alternative with greater consistency based on the criteria importance given by the decision-maker;
  • To present the most consistent alternative to the other decision-makers based on the criteria importance given by them;
  • To present statistical information about the criteria importance based on the respective prediction algorithm;
  • To explore the motives behind subjective evaluations through the user’s interaction with the System (in our example, it is possible to anticipate that the inconsistency in the evaluation of an alternative is due to the subjective greatness cuisineStyle criterion);
  • To justify why a decision-maker prefers a particular alternative (in our example, the framework can demonstrate that George prefers nosh because of the distance, transportExpenses and mealPrice criteria);
  • To provide information to the decision-maker to enhance his/her final satisfaction;
  • To explore the decision maturity throughout the process and by predicting individual and group satisfaction.

5. Implementation and Demonstration

The proposed framework was planned and designed to support group decision-making processes from two different perspectives. The first concerns the group’s perspective, i.e., consists of a set of functionalities to support groups in attaining a solution, such as to propose an alternative(s) as a possible solution, to propose an alternative to reject, and to present relevant information. From this perspective, the group is the only entity that matters, and all recommendations, proposals, alerts, information, and knowledge provided intend to aid the group in reaching a decision. The second concerns each decision-maker’s perspective, i.e., the set of functionalities that allows to provide personalized recommendations, alerts, information, and knowledge. From this perspective, each decision-maker is seen as a unique entity that must be supported throughout the decision process in the best possible way. Due to its versatility, the proposed framework can be used by group decision support systems for different purposes and/or as a resource to feed other software applications.
A group decision support system is a complex software application that integrates a great variety of features and functionalities (usually implemented using different programming languages). In order to answer today’s and future demands, scalability and performance are imperative. In [40], we presented a consensus-based group decision support system that was implemented using a Microservices Architecture Pattern. It comprises a Client App, an API Gateway and a set of microservices. Each microservice implements a different business and exposes a set of resources through a RESTful API. The DialogueGames4DGDM microservice consists of a multi-agent system in which agents exchange arguments to anticipate the best solution according to the decision-makers’ preferences [14,41]. Each one of these agents represents a real decision-maker and works in favor of his/her interests. These agents have a short life period because they are solely created to perform the dialogue and they are terminated when the process ends. The MAS4DGDM microservice consists of a multi-agent system with persistent agents. Each agent represents a real decision-maker and includes long-term data about the decision-maker they represent [15,38]. In addition, these agents are considered “Public Agents” because they can be externally accessed through a URI (e.g., https://<host:port>/<agent-unique-name>/<resource-path>). That means, third party software applications can interact with these agents through a RESTful API (using the Multi-Agent Microservices approach) and consume their knowledge and capabilities directly as resources. These agents can communicate with each other and include several strategies to select appropriate information (in the different periods of the decision process) to present to the decision-maker they represent. The DGDM-Manager microservice satisfies the needs regarding the business model, such as POST new decision problems, POST new rounds, GET the list of existing decision problems, etc.
In this work, we implemented a new microservice named MCDAFramework4DGDM, developed using the ASP.NET Core framework, which includes the framework presented in Section 3 and integrated it in the consensus-bases group decision support system previously described. It is composed by dozens of endpoints (43) that allow to benefit from the framework’s functionalities.
Figure 1 presents the consensus-based group decision support system architecture with the MCDAFramework4DGDM microservice.
In order to demonstrate the utility of the developed microservice and consequently of the framework, we put other microservices using the MCDAFramework4DGDM microservice for different purposes: the agents in the DialogueGames4DGDM microservice used the MCDAFramework4DGDM microservice to get new information about the decision problem to use in their dialogues; the agents in the MAS4DGDM microservice used it to present personalized data/information/knowledge to the decision-makers they represent, and finally, the MCDAFramework4DGDM microservice was used in the consensus reaching process to propose solutions and present general information to the group.
A more complex version of the decision problem previously used as an example (to decide on a restaurant to have dinner) was created and the configurations of each decision-maker were simulated, considering 9 alternatives, 9 criteria, and 7 decision-makers. In the created decision problem, it was defined that a solution would only be found if a minimum consensus of 1 was reached. This means that, if it was a real decision process, there were as many rounds as the ones needed to find a total agreement regarding one of the alternatives. However, other stopping criteria (combined or not) could be used, such as maximum number of rounds, minimum consensus needed, minimum group satisfaction needed, and minimum participant satisfaction needed.
Next, some of the data presented to the decision-makers throughout the process in the ClientApp, which was obtained using the MCDAFramework4DGDM, is shown.
At the end of each round, decision-makers have access to 2 screens. The first screen is the “General Information” screen and presents the same data to all decision-makers. The second screen is the “Personal Information” screen in which each decision-maker has access to personalized data.
In Figure 2, we can see the top of the dashboard presented to each decision-maker. It gives access to the “General Information” and “Personal Information” screens and presents a summary of the main elements of each round: the recommended alternative after each round and the respective level of consensus, predicted group satisfaction, and the consistency associated with the recommended alternative. It allows decision-makers to have a general panorama of the decision process.
Figure 3 presents the first two graphs of the “General Information” screen. The graph on the left shows, for each alternative, the number of decision-makers who consider it the best solution and the average preference of all decision-makers regarding that alternative. In the graph on the right, it is possible to verify exactly the same information, but this time regarding each criterion, i.e., the percentage of decision-makers who consider each criterion as the most important/relevant and the average importance attributed by all decision-makers to each criterion.
The elements shown in Figure 4 are also part of the “General Information” screen. The graph on the left shows the importance of each criterion from the perspective of each alternative. Illustrates, in a simplified manner, the criteria in which each alternative is stronger and weaker. The chart on the right serves to recommend alternative(s) as a solution or to be rejected. In addition, it presents, for the recommended alternatives, information on the criteria in which these alternatives are stronger and weaker.
The graph shown in Figure 5 is part of the “Personal Information” screen and allows decision-makers to compare their predicted satisfaction with the group’s predicted satisfaction if each of the alternatives were selected as a solution at that time. This chart also allows decision-makers to reflect on the group’s confidence in a particular solution at a given time, which can be an important indicator, for example, for situations in which the group needs a longer reflection period.
Figure 6 shows two elements that are part of the “Personal Information” screen. The element on the left is a graph that allows the user to view information related to the decision-makers he/she considers credible, in this case, regarding the predicted satisfaction of each one of them, if each of the alternatives were chosen as a solution at a given time. The element on the right presents the dialogue performed by the agents of the DialogueGames4DGDM microservice. It is possible to verify that the agent with the name “[email protected]” said “The most consistent alternative is: Coche.”, which means that this agent used the MCDAFramework4DGDM microservice to collect this information in order to use it in the dialogue.
Finally, Figure 7 presents two elements that are part of the “Personal Information” screen and which allow the decision-maker to view a set of recommendations and alerts made according to his/her interests and preferences (e.g., Concern for Self, Concern for Others, Expertise Level, decision-makers considered credible, preference for alternatives, importance of criteria, etc.) under different perspectives (criteria importance, self-satisfaction, and group satisfaction). In addition, some warnings about alternatives that the decision-maker may be over/undervaluing according to the importance he defined for each criterion are also presented (if they exist). As previously mentioned, the criteria for which each alternative is stronger and weaker are also presented.

6. Conclusions and Future Work

To support GDM processes when participants are dispersed is a complex task. There are several approaches that consist of proposing possible solutions according to the decision-makers’ preferences. However, this is the greatest and sometimes the only concern of the big majority. Such a vision impedes decision-makers to benefit from the recognized advantages associated with GDM processes. In addition, a GDSS that recommends or proposes actions to decision-makers, without being capable of justifying or presenting the necessary information that supports those recommendations or proposals, can transform them into a source of entropy.
In this paper, we propose a Multiple Criteria Decision Analysis Framework that intends to become an important tool for researchers and developers that are interested in developing MCDA methods or consensual approaches to support GDM processes with geographically dispersed participants. The proposed framework was designed to allow the deduction and understanding of the reasons behind the different recommendations or proposals. In addition, it allows the inclusion of several aspects that are important in the GDM context, such as expertise level, credibility, behavior styles, and decision quality prediction.
In order to validate and study the potential of the proposed MCDA framework, a set of application scenarios were tried in experiments. The experiments consisted of analyzing whether the framework had the resources to perform a set of tasks essential to support a GDM process that promotes the decision-makers’ interaction and enhances decision quality, reducing potential entropy sources and allowing decision-makers to benefit from the fact that they are deciding in group. The experiments showed that the proposed framework allows to deduce the reasons why possible proposals or recommendations are made. In addition, it was found that different strategies can be used to accomplish the same task and that a strategy can result in different outcomes. An example is the case where an alternative is proposed as a solution by calculating the group predicted satisfaction or by using the consistency method, which, on either case, originates different justifications for the same task.
We also developed a microservice to expose the framework’s functionalities as resources. The developed microservice is part of a Consensus-based Group Decision Support System which has other microservices for different businesses. The developed microservice was used to feed two other microservices each one containing a multi-agent system, where the agents used the framework to get new knowledge to use in their own dialogues and to support decision-makers with personalized information. As was evidenced in the experiments, the framework provides a lot of different and relevant information, being easy to use by other software clients. The developed microservice was also used in the consensus reaching process in order to propose solutions and alternatives to reject, decreasing the decision’s complexity.
We also concluded that the inclusion of the strategy for predicting the importance of the criteria from the perspective of each decision-maker, as well as the relevance that each criterion has for each alternative, enables the development of future important strategies, both for the creation of recommendations and the perception of the motives that lead to those recommendations. In addition, it provides a very clear view of possible inconsistencies in the evaluation made by decision-makers regarding the importance of alternatives and criteria.
The use of the consistency strategy has also shown to play an important role in what the creation of alerts might be, as well as in identifying possible incorrect or subjective assessments. The generated alerts can therefore help decision-makers to correct certain assessment “mistakes”. In the case of intentional assessments that are identified as inconsistent, it can be concluded that there is subjectivity associated with such assessments, which may, for example, indicate that the decision-maker is evaluating alternatives against criteria that are not present in the problem definition, or, if criteria of subjective greatness exist, these may be the explanation for those assessments.
Finally, there are three aspects that can be anticipated and are worth mentioning, including the satisfaction prediction feature can play a major role in predicting in what kind of situations consensus can be reached, i.e., the satisfaction prediction can help to identify scenarios that, although the decision is one hundred percent consensual, have completely different levels of confidence; satisfaction prediction can also be used to understand the evolution of the decision process and the impact of each actor in the process; and the possibility to deduce the reasons for the recommendations, alerts, and proposals can be used to document decisions, making it possible to analyze in the future the reasons for the decisions taken.
As for future work, we intend to explore how the inclusion of decision satisfaction as a metric to predict decision quality can help decision-makers to understand the evolution of the decision maturity over the process.

Author Contributions

J.C.: Conceptualization, Methodology, Writing—original draft. D.M.: Conceptualization. P.A.: Writing—review & editing. L.C.: Conceptualization. G.M.: Supervision, Funding acquisition, Project administration. P.N.: Supervision. All authors have read and agreed to the published version of the manuscript.

Funding

This research was funded by the GrouPlanner Project (PTDC/CCI-INF/29178/2017) and by National Funds through the FCT—Fundação para a Ciência e a Tecnologia (Portuguese Foundation for Science and Technology) within the Projects UID/CEC/00319/2020, UID/EEA/00760/2020 and the Luís Conceição PhD grant with the reference SFRH/BD/137150/2018.

Conflicts of Interest

The authors declare no conflict of interest. The funders had no role in the design of the study; in the collection, analyses, or interpretation of data; in the writing of the manuscript, or in the decision to publish the results.

References

  1. Carneiro, J.; Alves, P.; Marreiros, G.; Novais, P. Group Decision Support Systems for Current Times: Overcoming the Challenges of Dispersed Group Decision-Making. Neurocomputing 2020. [Google Scholar] [CrossRef]
  2. López, J.C.L.; Carrillo, P.A.Á.; Chavira, D.A.G.; Noriega, J.J.S. A web-based group decision support system for multicriteria ranking problems. Oper. Res. 2017, 17, 499–534. [Google Scholar] [CrossRef]
  3. Huber, G.P. Issues in the design of group decision support sytems. MIS Q. 1984, 8, 195–204. [Google Scholar] [CrossRef]
  4. Bell, D.E. Disappointment in decision making under uncertainty. Oper. Res. 1985, 33, 1–27. [Google Scholar] [CrossRef]
  5. Kaner, S. Facilitator’s Guide to Participatory Decision-Making; John Wiley & Sons: Hoboken, NJ, USA, 2014. [Google Scholar]
  6. Michaelsen, L.K.; Watson, W.E.; Black, R.H. A realistic test of individual versus group consensus decision making. J. Appl. Psychol. 1989, 74, 834. [Google Scholar] [CrossRef]
  7. Hackman, J.R.; Morris, C.G. Group tasks, group interaction process, and group performance effectiveness: A review and proposed integration. In Advances in Experimental Social Psychology; Elsevier: Amsterdam, The Netherlands, 1975; pp. 45–99. [Google Scholar]
  8. Watson, W.E.; Michaelsen, L.K.; Sharp, W. Member competence, group interaction, and group decision making: A longitudinal study. J. Appl. Psychol. 1991, 76, 803. [Google Scholar] [CrossRef]
  9. Palomares, I.; Martinez, L.; Herrera, F. A consensus model to detect and manage noncooperative behaviors in large-scale group decision making. IEEE Trans. Fuzzy Syst. 2013, 22, 516–530. [Google Scholar] [CrossRef]
  10. Ding, R.-X.; Palomares, I.; Wang, X.; Yang, G.-R.; Liu, B.; Dong, Y.; Herrera-Viedma, E.; Herrera, F. Large-Scale decision-making: Characterization, taxonomy, challenges and future directions from an Artificial Intelligence and applications perspective. Inf. Fusion 2020, 59, 84–102. [Google Scholar] [CrossRef]
  11. Wu, Z.; Xu, J. A consensus model for large-scale group decision making with hesitant fuzzy information and changeable clusters. Inf. Fusion 2018, 41, 217–231. [Google Scholar] [CrossRef]
  12. Li, C.-C.; Dong, Y.; Herrera, F. A consensus model for large-scale linguistic group decision making with a feedback recommendation based on clustered personalized individual semantics and opposing consensus groups. IEEE Trans. Fuzzy Syst. 2018, 27, 221–233. [Google Scholar] [CrossRef]
  13. Carneiro, J.; Conceição, L.; Martinho, D.; Marreiros, G.; Novais, P. Including cognitive aspects in multiple criteria decision analysis. Ann. Oper. Res. 2018, 265, 269–291. [Google Scholar] [CrossRef]
  14. Carneiro, J.; Martinho, D.; Marreiros, G.; Novais, P. Arguing with behavior influence: A model for web-based group decision support systems. Int. J. Inf. Technol. Decis. Mak. 2019, 18, 517–553. [Google Scholar] [CrossRef]
  15. Carneiro, J.; Saraiva, P.; Martinho, D.; Marreiros, G.; Novais, P. Representing decision-makers using styles of behavior: An approach designed for group decision support systems. Cogn. Syst. Res. 2018, 47, 109–132. [Google Scholar] [CrossRef]
  16. Greco, S.; Figueira, J.; Ehrgott, M. Multiple Criteria Decision Analysis; Springer: Berlin/Heidelberg, Germany, 2016. [Google Scholar]
  17. Dong, Y.; Zhang, H.; Herrera-Viedma, E. Consensus reaching model in the complex and dynamic MAGDM problem. Knowl.-Based Syst. 2016, 106, 206–219. [Google Scholar] [CrossRef]
  18. Kozlowski, S.W.; Hattrup, K. A disagreement about within-group agreement: Disentangling issues of consistency versus consensus. J. Appl. Psychol. 1992, 77, 161. [Google Scholar] [CrossRef]
  19. Roe, R.M.; Busemeyer, J.R.; Townsend, J.T. Multialternative decision field theory: A dynamic connectionst model of decision making. Psychol. Rev. 2001, 108, 370. [Google Scholar] [CrossRef] [PubMed]
  20. Busemeyer, J.R.; Townsend, J.T. Decision field theory: A dynamic-cognitive approach to decision making in an uncertain environment. Psychol. Rev. 1993, 100, 432. [Google Scholar] [CrossRef]
  21. Stemler, S.E. A comparison of consensus, consistency, and measurement approaches to estimating interrater reliability. Pract. Assess. Res. Eval. 2004, 9, 1–19. [Google Scholar]
  22. Moreno-Jiménez, J.; Aguarón, J.; Escobar, M. The core of consistency in AHP-group decision making. Group Decis. Negot. 2008, 17, 249–265. [Google Scholar] [CrossRef]
  23. Moreno-Jimenez, J.M.; Vargas, L.G. A probabilistic study of preference structures in the analytic hierarchy process with interval judgments. Math. Comput. Model. 1993, 17, 73–81. [Google Scholar] [CrossRef]
  24. Aguarón, J.; Moreno-Jiménez, J.M.A. Local stability intervals in the analytic hierarchy process. Eur. J. Oper. Res. 2000, 125, 113–132. [Google Scholar] [CrossRef]
  25. Cabrerizo, F.J.; Morente-Molinera, J.A.; Pedrycz, W.; Taghavi, A.; Herrera-Viedma, E. Granulating linguistic information in decision making under consensus and consistency. Expert Syst. Appl. 2018, 99, 83–92. [Google Scholar] [CrossRef]
  26. Li, C.-C.; Rodríguez, R.M.; Martínez, L.; Dong, Y.; Herrera, F. Consensus building with individual consistency control in group decision making. IEEE Trans. Fuzzy Syst. 2019, 27, 319–332. [Google Scholar] [CrossRef]
  27. Tang, M.; Liao, H. From conventional group decision making to large-scale group decision making: What are the challenges and how to meet them in big data era? A state-of-the-art survey. Omega 2019, 102141. [Google Scholar] [CrossRef]
  28. Saaty, T.L. How to make a decision: The analytic hierarchy process. Eur. J. Oper. Res. 1990, 48, 9–26. [Google Scholar] [CrossRef]
  29. Palomares, I.; RodríGuez, R.M.; MartíNez, L. An attitude-driven web consensus support system for heterogeneous group decision making. Expert Syst. Appl. 2013, 40, 139–149. [Google Scholar] [CrossRef]
  30. Atkinson, K.; Bench-Capon, T.; Walton, D. Distinctive features of persuasion and deliberation dialogues. Argum. Comput. 2013, 4, 105–127. [Google Scholar] [CrossRef] [Green Version]
  31. Morente-Molinera, J.A.; Wikström, R.; Herrera-Viedma, E.; Carlsson, C. A linguistic mobile decision support system based on fuzzy ontology to facilitate knowledge mobilization. Decis. Support. Syst. 2016, 81, 66–75. [Google Scholar] [CrossRef]
  32. Herrera, F.; Herrera-Viedma, E. Linguistic decision analysis: Steps for solving decision problems under linguistic information. Fuzzy Sets Syst. 2000, 115, 67–82. [Google Scholar] [CrossRef]
  33. Palomares, I.; Martinez, L. A semisupervised multiagent system model to support consensus-reaching processes. IEEE Trans. Fuzzy Syst. 2013, 22, 762–777. [Google Scholar] [CrossRef]
  34. Saaty, T.L. What is the analytic hierarchy process? In Mathematical Models for Decision Support; Springer: Berlin/Heidelberg, Germany, 1988; pp. 109–121. [Google Scholar]
  35. Herrera, F.; Herrera-Viedma, E.; Verdegay, J. A sequential selection process in group decision making with a linguistic assessment approach. Int. J. Inf. 1995, 80, 1–17. [Google Scholar] [CrossRef]
  36. Carneiro, J.; Martinho, D.; Marreiros, G.; Novais, P. A general template to configure multi-criteria problems in ubiquitous GDSS. Int. J. Softw. Eng. Its Appl. 2015, 9, 193–206. [Google Scholar] [CrossRef]
  37. Higgins, E.T. Making a good decision: Value from fit. Am. Psychol. 2000, 55, 1217. [Google Scholar] [CrossRef]
  38. Carneiro, J.; Saraiva, P.; Conceição, L.; Santos, R.; Marreiros, G.; Novais, P. Predicting satisfaction: Perceived decision quality by decision-makers in web-based group decision support systems. Neurocomputing 2019, 338, 399–417. [Google Scholar] [CrossRef]
  39. Carneiro, J.; Alves, P.; Marreiros, G.; Novais, P. A Conceptual Group Decision Support System for Current Times: Dispersed Group Decision-Making. In Proceedings of the International Symposium on Distributed Computing and Artificial Intelligence, Ávila, Spain, 26–28 June 2019; Springer: Berlin/Heidelberg, Germany, 2019. [Google Scholar]
  40. Carneiro, J.; Andrade, R.; Alves, P.; Conceição, L.; Novais, P.; Marreiros, G. A Consensus-based Group Decision Support System using a Multi-Agent MicroServices Approach. In Proceedings of the 19th International Conference on Autonomous Agents and MultiAgent Systems, Auckland, New Zealand, 9–13 May 2020. [Google Scholar]
  41. Carneiro, J.; Martinho, D.; Marreiros, G.; Jimenez, A.; Novais, P. Dynamic argumentation in UbiGDSS. Knowl. Inf. Syst. 2018, 55, 633–669. [Google Scholar] [CrossRef]
Figure 1. Consensus-Based Group Decision Support System Architecture (adapted from [40]).
Applsci 10 04614 g001
Figure 2. The top of the dashboard presented to each decision-maker.
Applsci 10 04614 g002
Figure 3. Graphs/elements of the “General Information” screen.
Applsci 10 04614 g003
Figure 4. Graphs/elements of the “General Information” screen.
Applsci 10 04614 g004
Figure 5. Graph of the “Personal Information” screen.
Applsci 10 04614 g005
Figure 6. Elements of the “Personal Information” screen.
Applsci 10 04614 g006
Figure 7. Elements of the “Personal Information” screen.
Applsci 10 04614 g007
Table 1. Notation correspondence.
TerminologyNotation
Set of decision-makers D M
Decision-maker d m k
Set of alternatives A
Set of criteria C
Alternative a i
Criterion c j
Decision matrix D
Weight or preference given to a certain alternative a i by a decision-maker d m k w a d m k a i
Set of alternatives weights of a decision-maker d m k W a d m k
Weight or preference given to a certain criterion c j by a decision-maker d m k w c d m k c j
Set of criteria weights of a decision-maker d m k W c d m k
Set of alternatives weights of a set of decision-makers W a D M
Set of criteria weights of a set of decision-makers W c D M
Alternatives preference matrix that relates each alternative with the correspondent evaluation made by each decision-maker A P D M
Criteria preference matrix that relates each criterion with the correspondent evaluation made by each decision-maker C P D M
Predicted importance of alternative a i to decision-maker d m k i m p d m k a i
Set of importance values for all the alternatives to decision-maker d m k A I m p d m k
Predicted importance of criterion c j to decision-maker d m k i m p d m k c j
Set of importance values for all the criteria to decision-maker d m k C I m p d m k
Set of importance values for all the alternatives of a set of decision-makers A I m p D M
Set of importance values for all the criteria of a set of decision-makers C I m p D M
Alternatives evaluation matrix A E D M
Normalized decision matrix D
Consistency matrix of the decision-maker d m k C M d m k
Table 2. The operating values of Concern for Self and Concern for Others for the 5 behavior style in [0, 1] interval (adapted from [15]).
Behavior StyleConcern for SelfConcern for Others
Dominating0.9470.171
Obliging0.1970.873
Avoiding0.1080.090
Compromising0.5480.616
Integrating0.7770.846
Table 3. F D i f levels.
Level ( l ) F D i f
5 d i f 0.80
4 0.60 d i f < 0.80
3 0.40 d i f < 0.60
2 0.20 d i f < 0.40
1 d i f < 0.20
Table 4. Predicted importance classification and scale.
Value i m p Definition
5VIVery Important
4IImportant
3MMedium
2NINot Important
1INInsignificant
Table 5. Alternatives predicted importance to each decision-maker.
Alternatives\Decision-MakersHarryGeorgeJane
zingara555
thaiPalace555
nosh343
Table 6. Criteria predicted importance to each decision-maker.
Criteria\Decision-MakersHarryGeorgeJane
distance353
transportExpenses151
speedOfService111
qualityOfTheFood535
mealPrice351
atmosphere555
wine555
cuisineStyle515
healthy515
Table 7. Normalized values for each criterion in each alternative on the given example.
Criteria/AlternativesZingaraThaiPalaceNosh
distance0.5545645970.1091291940.910912919
transportExpenses101
speedOfService0.1758366160.4505577440.862639436
qualityOfTheFood0.6882472020.6882472020.229415734
mealPrice0.1662033180.4997219910.766536929
atmosphere0.7071067810.7071067810
wine0.7071067810.7071067810
cuisineStyle0.5773502690.5773502690.577350269
healthy0.7071067810.7071067810
Table 8. The importance of each criterion to the existing alternatives.
Criteria/AlternativesZingaraThaiPalaceNosh
distance315
transportExpenses515
speedOfService135
qualityOfTheFood552
mealPrice145
atmosphere551
wine551
cuisineStyle111
healthy551
Table 9. Scale of satisfaction (adapted from [38]).
DesignationInterval
Extremely satisfied [ 0.75 ,   1 ]
Much satisfaction [ 0.5 ,   0.75 ]
Satisfaction [ 0.25 ,   0.5 ]
Some satisfaction [ 0 ,   0.25 ]
Some dissatisfaction [ 0.25 ,   0 ]
Dissatisfied [ 0.5 , 0.25 ]
Very dissatisfied [ 0.75 , 0.5 ]
Extremely dissatisfied [ 1 , 0.75 ]

