Article

Fiber-Optic Bragg Gratings for Temperature and Pressure Measurements in Isotope Production Targets for Nuclear Medicine

1
Fibos Inc., Toronto, ON M3J 3E5, Canada
2
Life Sciences Division, TRIUMF, 4004 Wesbrook Mall, Vancouver, BC V6T 2A3, Canada
3
National Research Council of Canada, Security and Disruptive Technologies Research Centre, 100 Sussex Dr., Ottawa, ON K1A 0R6, Canada
*
Author to whom correspondence should be addressed.
Appl. Sci. 2020, 10(13), 4610; https://doi.org/10.3390/app10134610
Submission received: 31 May 2020 / Revised: 25 June 2020 / Accepted: 30 June 2020 / Published: 3 July 2020
(This article belongs to the Special Issue Beam Diagnostics for Medical Application)

Abstract

:

Featured Application

Use of fiber optics to measure temperature and pressure in a target on a medical cyclotron.

Abstract

A Bragg grating inscribed into an inorganic optical fiber was tested in proton and neutron fields up to doses of 472 Gy. Observation showed that radiation had no effect on the performance of the Fiber Bragg Grating (FBG) used as a gauge measuring temperature and pressure. The FBG sensor was subsequently employed to measure the temperature and pressure inside a liquid isotope production target for nuclear medicine. The fiber Bragg grating measured the temperature and pressure of a water target as a 12 MeV proton beam impinged on it in real time and was tested with beam currents of up to 20 µA.

1. Introduction

Every year, over forty million people worldwide receive nuclear medical imaging (Positron Emission Tomography (PET) or Single-Photon Emission Computed Tomography (SPECT) in the course of their treatment [1]. For many radiopharmaceuticals, the required radioactive isotopes can be produced on a medical cyclotron, using solid [2], liquid [3] and gaseous [4] target materials, enclosed in a metal vessel. Especially in the gas and liquid phase on low energy cyclotrons (up to 24 MeV), the achieved radionuclidic yield is often lower than predicted by nuclear cross sections [4,5,6]. Other effects like target body and transfer line material, density reduction due to temperature increases during irradiation, convective currents and phase changes may have an effect on the recoverable radionuclidic yield [5,6,7,8]. In recent years, several modeling approaches have endeavored to study these aspects [3,4,7,9,10,11,12], but meaningful comparison between experiments is hindered by the lack of observables in the target as reliable and localized temperature and pressure measurements are difficult to conduct. Most often, the pressure is measured either in the target body instead of the actual target gas or liquid [13] or on a line connected to the target volume [5]. As the pressure transducer may be located at a distance of several meters away from the target, its reading may not necessarily reflect the true conditions in the target.
At this point, simulations that can predict the temperature and pressure fields are being developed [3,4,7,9,11,12], but physical measurements of both parameters are needed for validation. Calculations are complicated by the fact that the proton deposition in the target medium affects the target density, which in turn causes a pressure gradient and convective currents. This density gradient can affect the radioactive yield of the isotope being produced.
To address these issues, we investigated new sensors to measure the local temperature and pressure in an isotope production target. We characterized the response of an optical fiber with a Bragg grating to radiation fields. Before exposing the fiber to significant proton-beam current and elevated pressure and temperature in an isotope production target, tests were carried out at lower doses and dose rates at a dedicated proton and neutron test facility to establish the radiation hardness of the bare, unpackaged sensor. After confirming the durability in those radiation fields, we developed functional temperature and pressure sensors and inserted them into the cavity of an isotope production target to measure the circulating fluid temperature and pressure during irradiation.

2. Materials and Methods

2.1. Fibers and Data Acquisition

Fiber-optic sensors offer particular characteristics that are of interest in the application of measuring temperature and pressure in radiation environments. The fiber-optic sensor employed in our experiments was a Fiber Bragg Grating (FBG) fabricated by imprinting a discrete optical pattern into the core of the fiber. A FBG is an interferometric device constructed of a series of periodic variations of the refractory index in the core of the fiber. In the simplest case, when a broadband light is coupled into the core of the fiber, the FBG reflects a unique wavelength of light (Figure 1). This characteristic wavelength (or the Bragg wavelength (λB)) is determined by the effective refractive index (n) of the core and the pitch (Λ) of the refractive index modulation in the core. The sensitivity of a FBG to applied strain and temperature depends on (i) the elastic, thermo-elastic, elasto-optic and thermo-optic properties of the fiber, (ii) the nature of the strain field (e.g., the strain is mainly along the fiber axis or perpendicular to the fiber) and (iii) the temperature field. The relative shift in the Bragg wavelength (ΔλBB) due to an applied homogeneous and isotropic strain (Δε) and a change in temperature (ΔT) can be written as [14]
λ B / λ B = ( 1 p e ) × ε + ( α + ζ ) × T
where
-
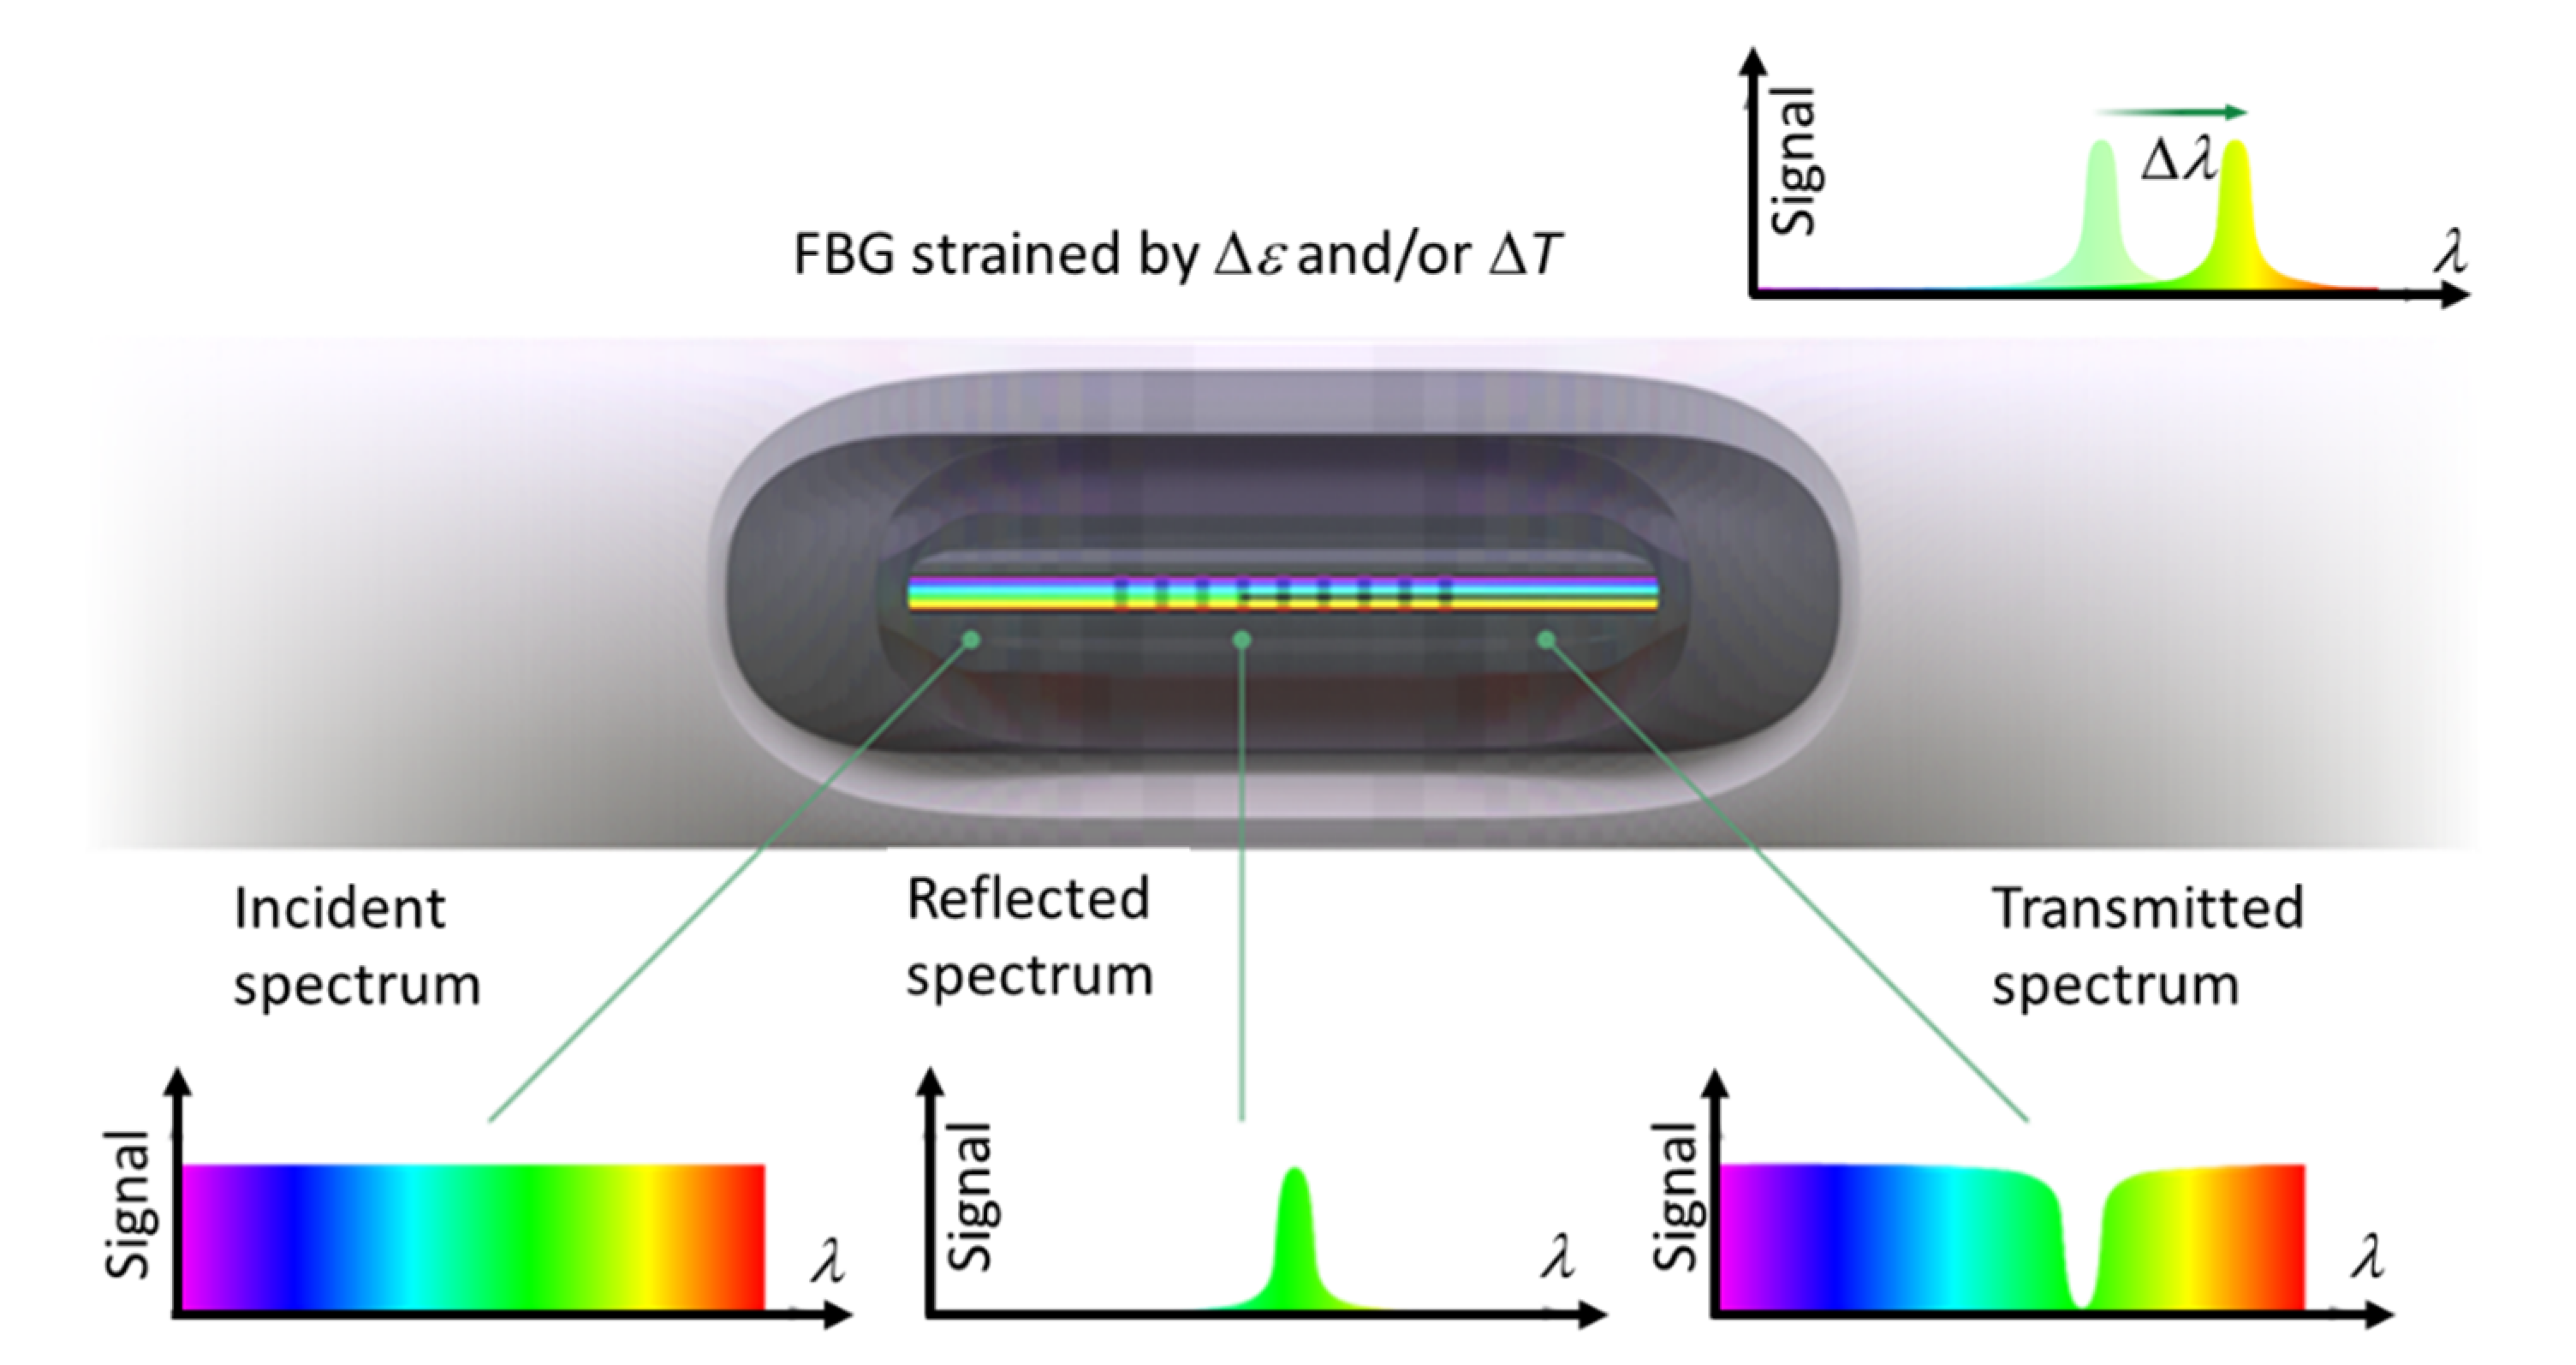
λB is the Bragg wavelength of the FBG when datum strain and temperature is applied to the FBG,
-
ΔλB is the change in λB associated with a change in strain or temperature,
-
pe is the effective strain-optic constant,
-
Δε is the change in strain experienced over the length of the FBG
-
α is the coefficient of thermal expansion of the fiber (i.e.,)
-
ζ is the thermo-optic coefficient (i.e., ζ = 1 n ( n T ) ), and
-
ΔT is a change in temperature of the FBG.
The effective strain-optic constant pe is given by
p e = n 2 2 [ p 12 ν ( p 11 + p 12 ) ]
where p11 and p12 are components of the strain-optic tensor and ν is the Poisson ratio.
Equation (1) shows that in order to measure changes in strain with a FBG it is necessary to account for the FBG’s temperature cross-sensitivity. In this work, two physically separated FBG sensors are used where the first FBG is subjected to both strain and temperature changes and the second FBG is only subjected to temperature changes. By mathematically comparing these two signals, we can infer the temperature-isolated change of strain measurement.
Three different categories of FBGs were employed in the experiments. Their classification differs depending on their FBG inscription technique and fiber design. We also note that in order to improve accuracy in the wavelength measurements, the FBGs under consideration were π-phase-shifted FBGs which have a very narrow passband feature in their transmission/reflection spectra [15]. In the following text, the π-phase-shifted FBGs will be referred to simply as “FBGs”, for brevity. The three categories of FBGs are described below with subheadings defining the category name and shorthand in parenthesis.

2.1.1. Category 1: Ge-Doped Fiber (UV)

Often referred to as standard gratings, Category 1 FBGs are formed in a germanium-doped (Ge-doped) silica fiber using an inscription laser operating in the UV band, typically at ~248 nm. The Type I inscription process exercises the germanium’s reaction to UV radiation thereby increasing the refractive index of the doped silica in the regions where it is exposed to the incident laser. UV gratings are common in the fiber optic sensing industry. UV gratings have a typical operating temperature range <200 °C, above which the modulation of refractive index in the laser-exposed regions decreases, thereby erasing the FBG. In addition, previous research with UV gratings in high radiation environments indicated a potential sensitivity of the FBG wavelength to radiation. Research conducted by Henschel et al. [16] suggested that ionizing radiation interacted with the Ge-dopant and altered the reflected FBG wavelength and the FBG strength as if the UV inscription process were continuing. The radiation caused a change to the refractive index of the entire Ge-doped fiber and therefore attenuated the modulation of the original grating. This saturated the grating and thereby influenced its wavelength and reflectivity.

2.1.2. Category 2: Ge-Doped Fiber (FS)

Category 2 FBGs differ from Category 1 FBGs in their inscription methods. UV FBGs are inscribed with the Type I method and rely on the photosensitivity of the Ge-dopant to cause modulations to the refractive index of the silica fiber. Category 2 FBGs are inscribed with the Type II method which is based on inducing structural changes in the silica matrix by means of femtosecond (FS) laser pulses in order to achieve a change in the refractive index [17]. Instead of a nanosecond or continuous wave inscription laser operating in the UV spectrum, FS gratings are inscribed with an infrared laser operating (λ = ~800 nm) typically using pulse durations in the range of 50–500 femtoseconds. High light intensity levels are thus employed over short durations to achieve the controlled damage. FS FBGs can maintain their optical integrity up to 1000 °C and can be inscribed in a variety of fiber types including common single-mode telecom fibers. As the formation of FS FBGs does not rely on the presence of the Ge-dopant, their sensitivity to ionizing radiation is weaker compared to UV FBGs [18].

2.1.3. Category 3: Pure Silica Fiber (RAD)

The telecom industry has pursued single-mode fiber development for the purpose of low-loss signal communication in high-radiation environments. A readily available fiber design, described as radiation-resilient or radiation-hardened, employs a pure silica core (i.e., there are no dopants in the core). Category 3 FBGs employ the same Type II inscription method as Category 2 FBGs and with the pure silica fiber design provide a specimen made of a single material with no dopants and no photosensitivity requirements.

2.2. FBGs Response to Irradiation

There are numerous reports on testing the durability of fiber optic sensors, in particular FBG-based sensors, to high dosage and high dose rate environments. Studies conducted by Morana et al. on the effects of high dosage γ-radiation on FBG sensors provided insight into the performance expectation of the test specimens incorporated in our experiments [18]. Morana et al. specifically detailed the FBG wavelength shift induced by exposure to 1 MGy and 4 MGy of gamma radiation on Ge-doped and pure silica fibers, respectively, with a dose rate of 50 Gy/s. These results determined the selection of fibers for use in our experiments. Ge-doped fiber was employed in the UV and FS specimens, while pure silica fiber was used in the RAD specimens. In our experiments, the expected radiation induced wavelength shifts derived from the data by Morana et al. was expected to be ±0.040 nm without any consistent direction (higher/lower wavelength). Coupled with the uncertainty of ±0.005 nm in the wavelength measurement by the device used for these tests, the results suggested an expected performance of the RAD test specimen within the measurement uncertainty of the FBG even when the specimens were not exposed to high radiation doses. This further emphasizes the radiation resistance of FBGs and their efficacy for use in the proposed experiments.

2.3. Optical Gauge Amplifier

A Fibos Optical Gauge Amplifier (OGA) was used to conduct wavelength measurements and spectral analysis of the returned wavelength from the FBGs. The OGA scans the wavelength of the connected FBG using a narrow linewidth laser and records the reflected power and wavelength of each FBG specimen. The spectral plots (power vs. wavelength) were used to determine whether the FBGs experienced optical distortion during the experiments. The OGA uses a proprietary technique to measure the FBG’s characteristic wavelength (patent US20180372566A1) which provides wavelength measurements with an uncertainty of ±0.005 nm. The Fibos OGA wavelength measurement is insensitive to changes in the reflected power of the FBG. Research conducted by Morana et al. suggested that exposure to radiation may induce an attenuation of ~0.1 dB/m along the fiber optic cable, therefore reducing the reflected power of a FBG. As the Fibos OGA’s method of wavelength measurement is not affected by the intensity of the FBG’s reflection power, the presented fiber optic measurement system is ideal for applications in a radiation environment where darkening of optically translucent materials can occur.

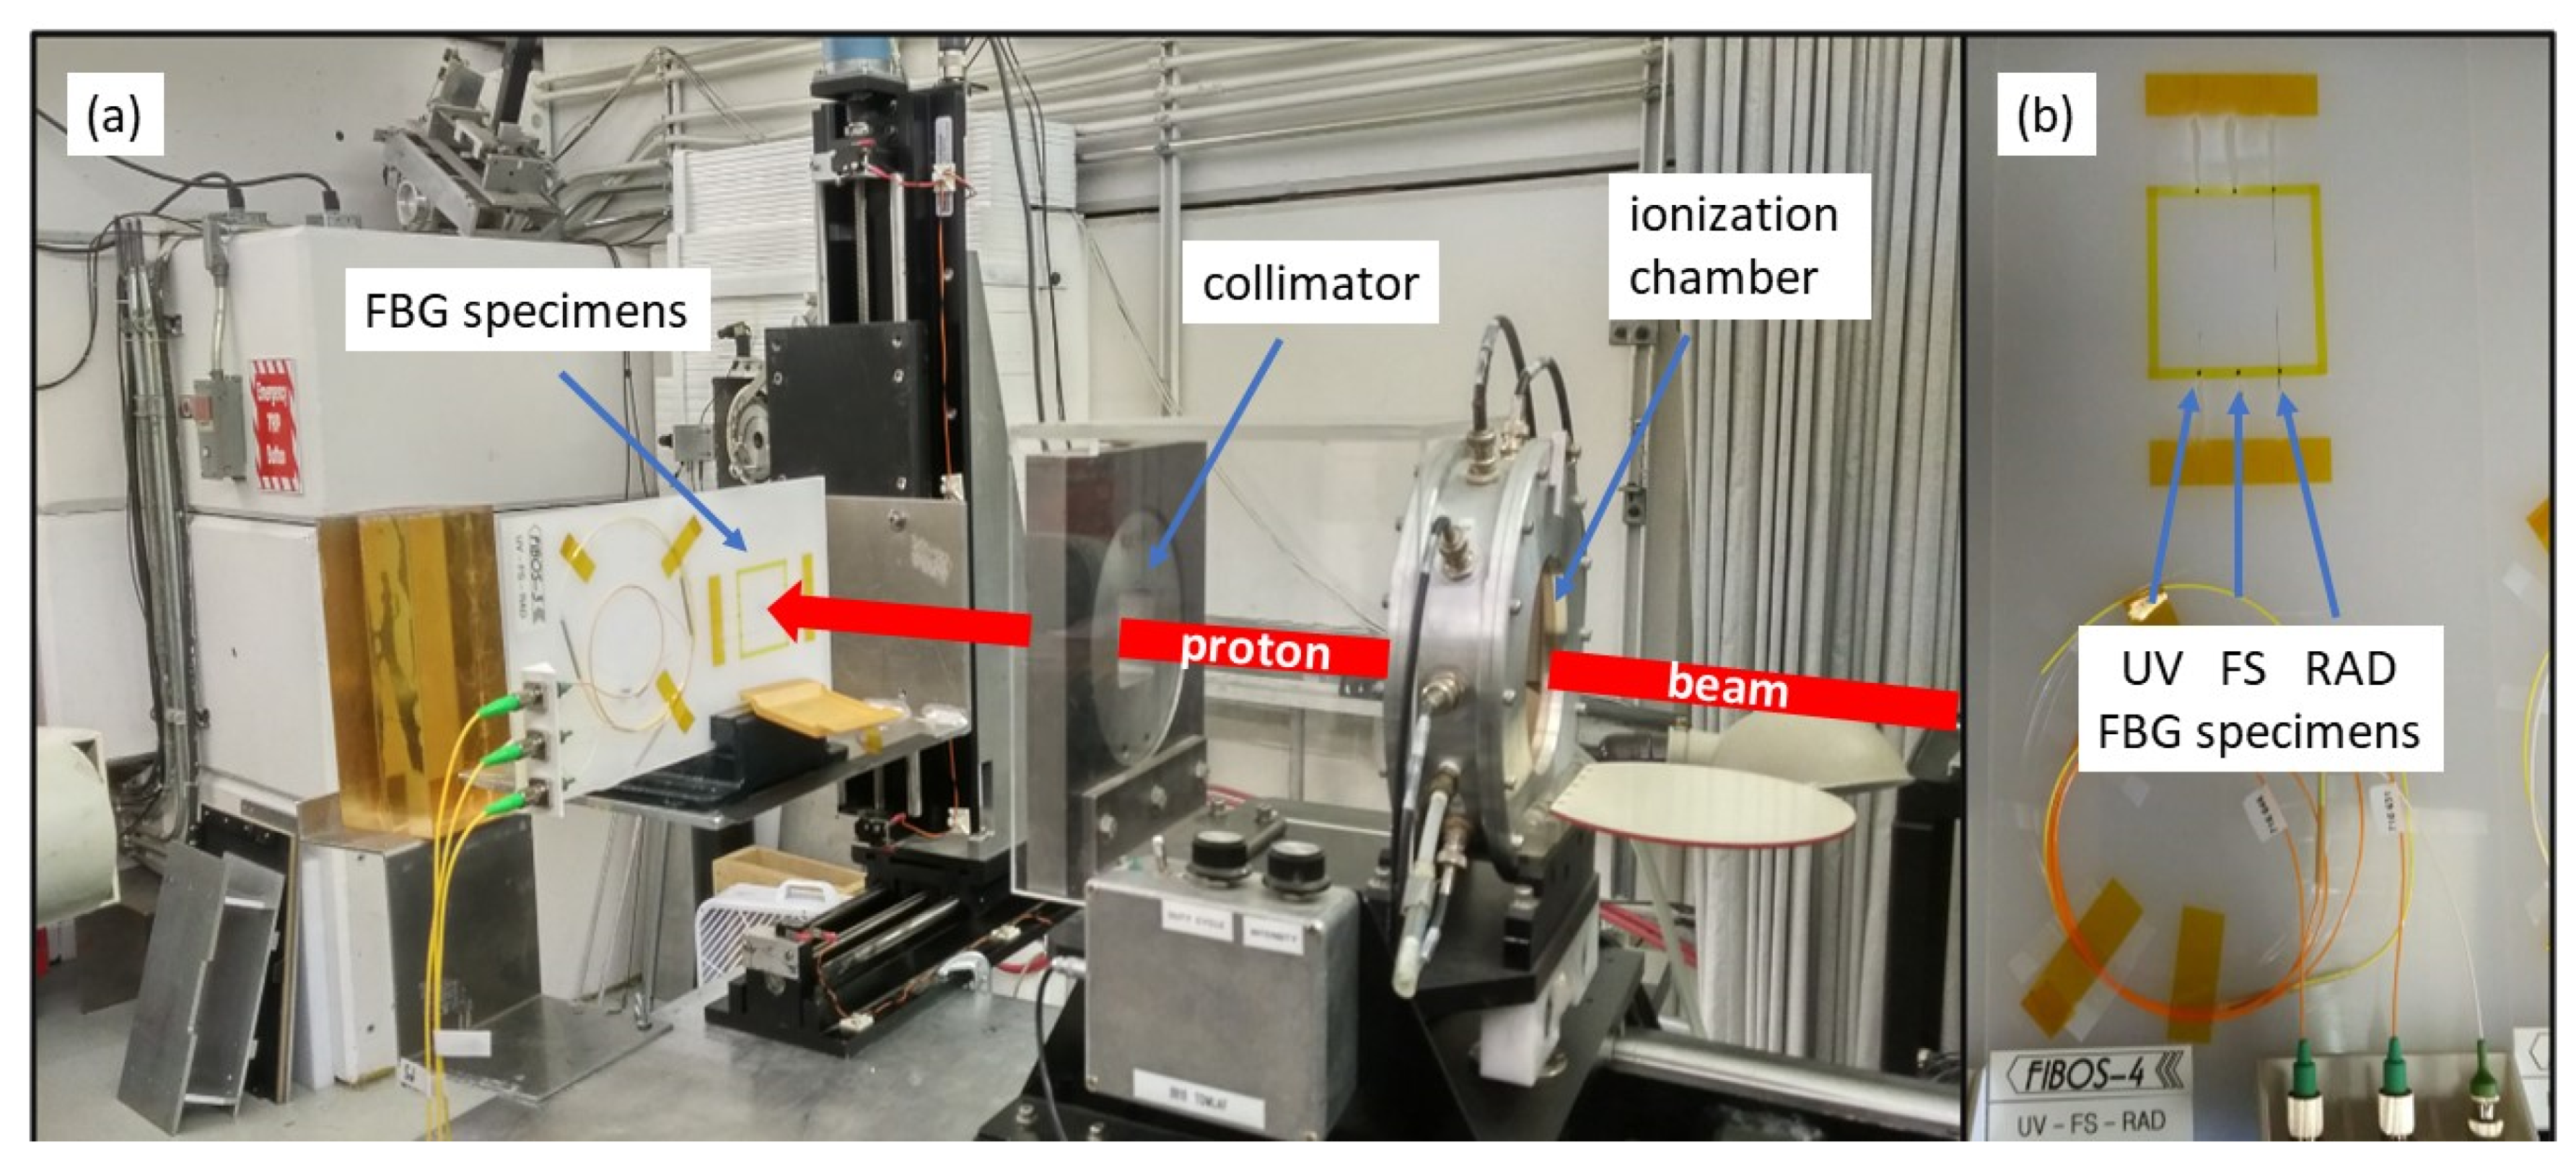
2.4. Proton Irradiation

The Proton Irradiation Facility (PIF) at TRIUMF is located at a lower-energy (70–110 MeV) beam line (2C1) coming from the TRIUMF 500 MeV cyclotron and can deliver beam currents up to 10 nA [19]. Dose rates in the isocenter of the facility can reach up to 1 Gy/s. One of each of the three different categories of FBGs were attached to a plastic test placard and mounted in front of the horizontal beam line (Figure 2). A square field of 5 cm × 5 cm was used to irradiate all three fibers simultaneously. The different samples were each exposed to different proton energies (9, 13.5, 20, 35 and 64 MeV). For each of these energies several total doses were accumulated (5, 10 and 60 Gy) with three different dose rates (100, 500 and 1000 mGy/s) for a total of 45 irradiations (Table 1). FBG spectra were collected by the OGA for assessment before, during and after each irradiation.

2.5. Neutron Irradiation

The TRIUMF Neutron Facility (TNF) utilizes a beam dump at the end of one of the 500 MeV beam lines (beam line 1A) from the TRIUMF 500 MeV cyclotron [20]. Neutrons with an energy spectrum from 0 up to 400 MeV are generated by the final beam stop on this beam line from the spallation reaction on an aluminum plate absorber surrounded by a water moderator. The beam is actively monitored via a neutron detector. Over the course of these experiments, the neutron flux measured was 3.47 ± 0.06 × 10⁶ n/(cm2 s) where n is the number of neutrons with an energy greater than 10 MeV. This corresponds to a dose rate of 3.16 × 10⁻⁴ Gy/s.
The beam is accessible by a vertical shaft about 5 m below the local monitoring room. To place the fibers into the beam path, the plastic test placard with the three fibers was mounted onto an additional support plate, which was then lowered into the beam by means of a pulley on tracks. The support plate was marked with an outline of the approximate profile of the beam obtained from previous experiments at TRIUMF. The beam profile was 15.2 cm in the horizontal and 5.1 cm in the vertical direction, respectively. A black plastic bag was used to cover the fibers before placing them in the beam position to reduce ambient background light. Specimens of the three different FBG categories were irradiated to different dose levels (up to 60 Gy). The specimens were monitored before, during and after the irradiation for a shift in frequencies.

2.6. Isotope Production Irradiation on a Medical Cyclotron

The TR13 cyclotron at TRIUMF, a 13 MeV self-shielded, negative hydrogen ion cyclotron, is used for medical isotope production [5,6]. Irradiations were performed in a water-cooled aluminum-body target [21] with an internal chamber volume of approximately 0.9 mL (8 mm deep by 12 mm diameter). The target was completely filled with naturally abundant, deionized water, sealed off and operated in nonreflux mode. The target was separated from the cyclotron vacuum by a double-foil helium-cooled window. SRIM [22] simulations indicated that the proton energy incident into the target water was 12 MeV. The target was electrically isolated, which allowed the measurement of the impinging proton current. During the irradiation, secondary particles were created in the target, mainly X rays and gamma rays, alpha particles and neutrons.
The target body had a compression fitting port for inserting a 1/16” diameter temperature probe into the irradiation volume and a second 1/16–27 NPT female port for a pressure transducer. A FBG-based temperature probe was constructed using the RAD configuration FBG and inserted into the target volume. The FBG temperature probe was inserted in two different ways: first so that it traversed the diameter of the cylindrical chamber and second that it was flush with the target wall, i.e., not intercepting the proton beam. A FBG-based pressure transducer was constructed using the RAD configuration of FBG and attached to a T-fitting on the 1/16–27 NPT port. The global reference pressure in the system was recorded with a MEAS XPC10-X-500PG pressure transducer also connected to the same the T-fitting. The irradiations were performed by gradually stepping up the beam current to 20 µA on target, allowing the temperature to settle for each step. Temperature and pressure were recorded by the FBG-based devices [23] alongside the reference system.

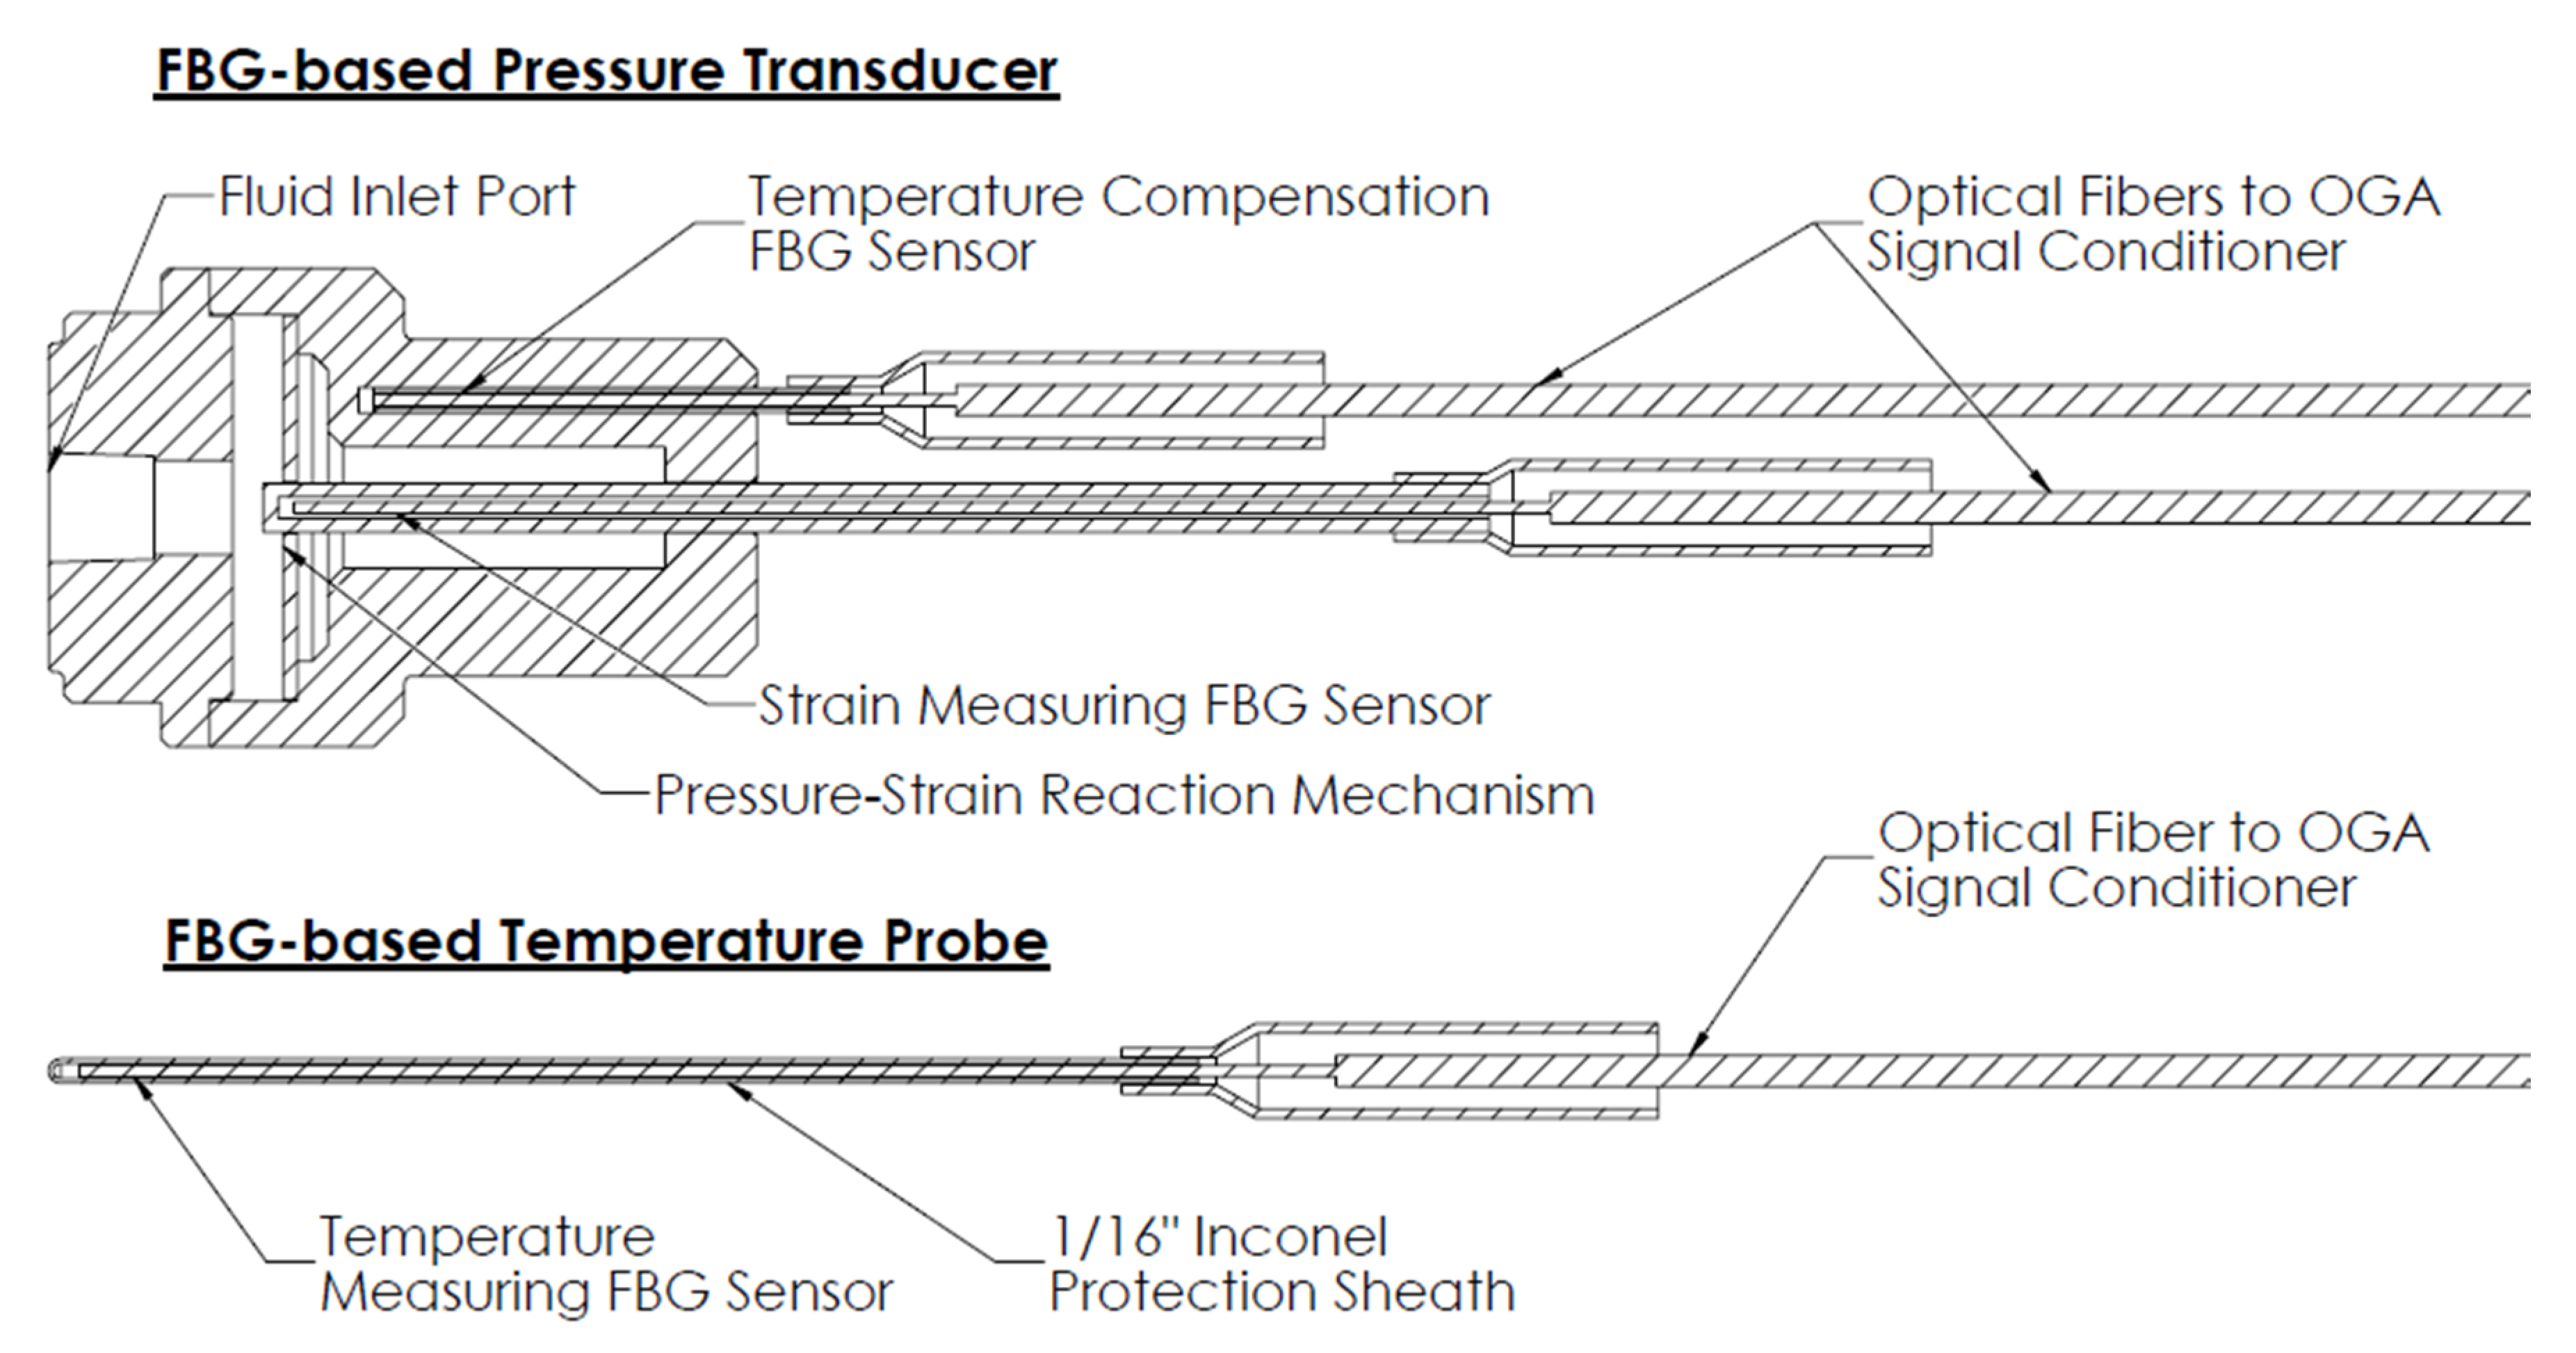
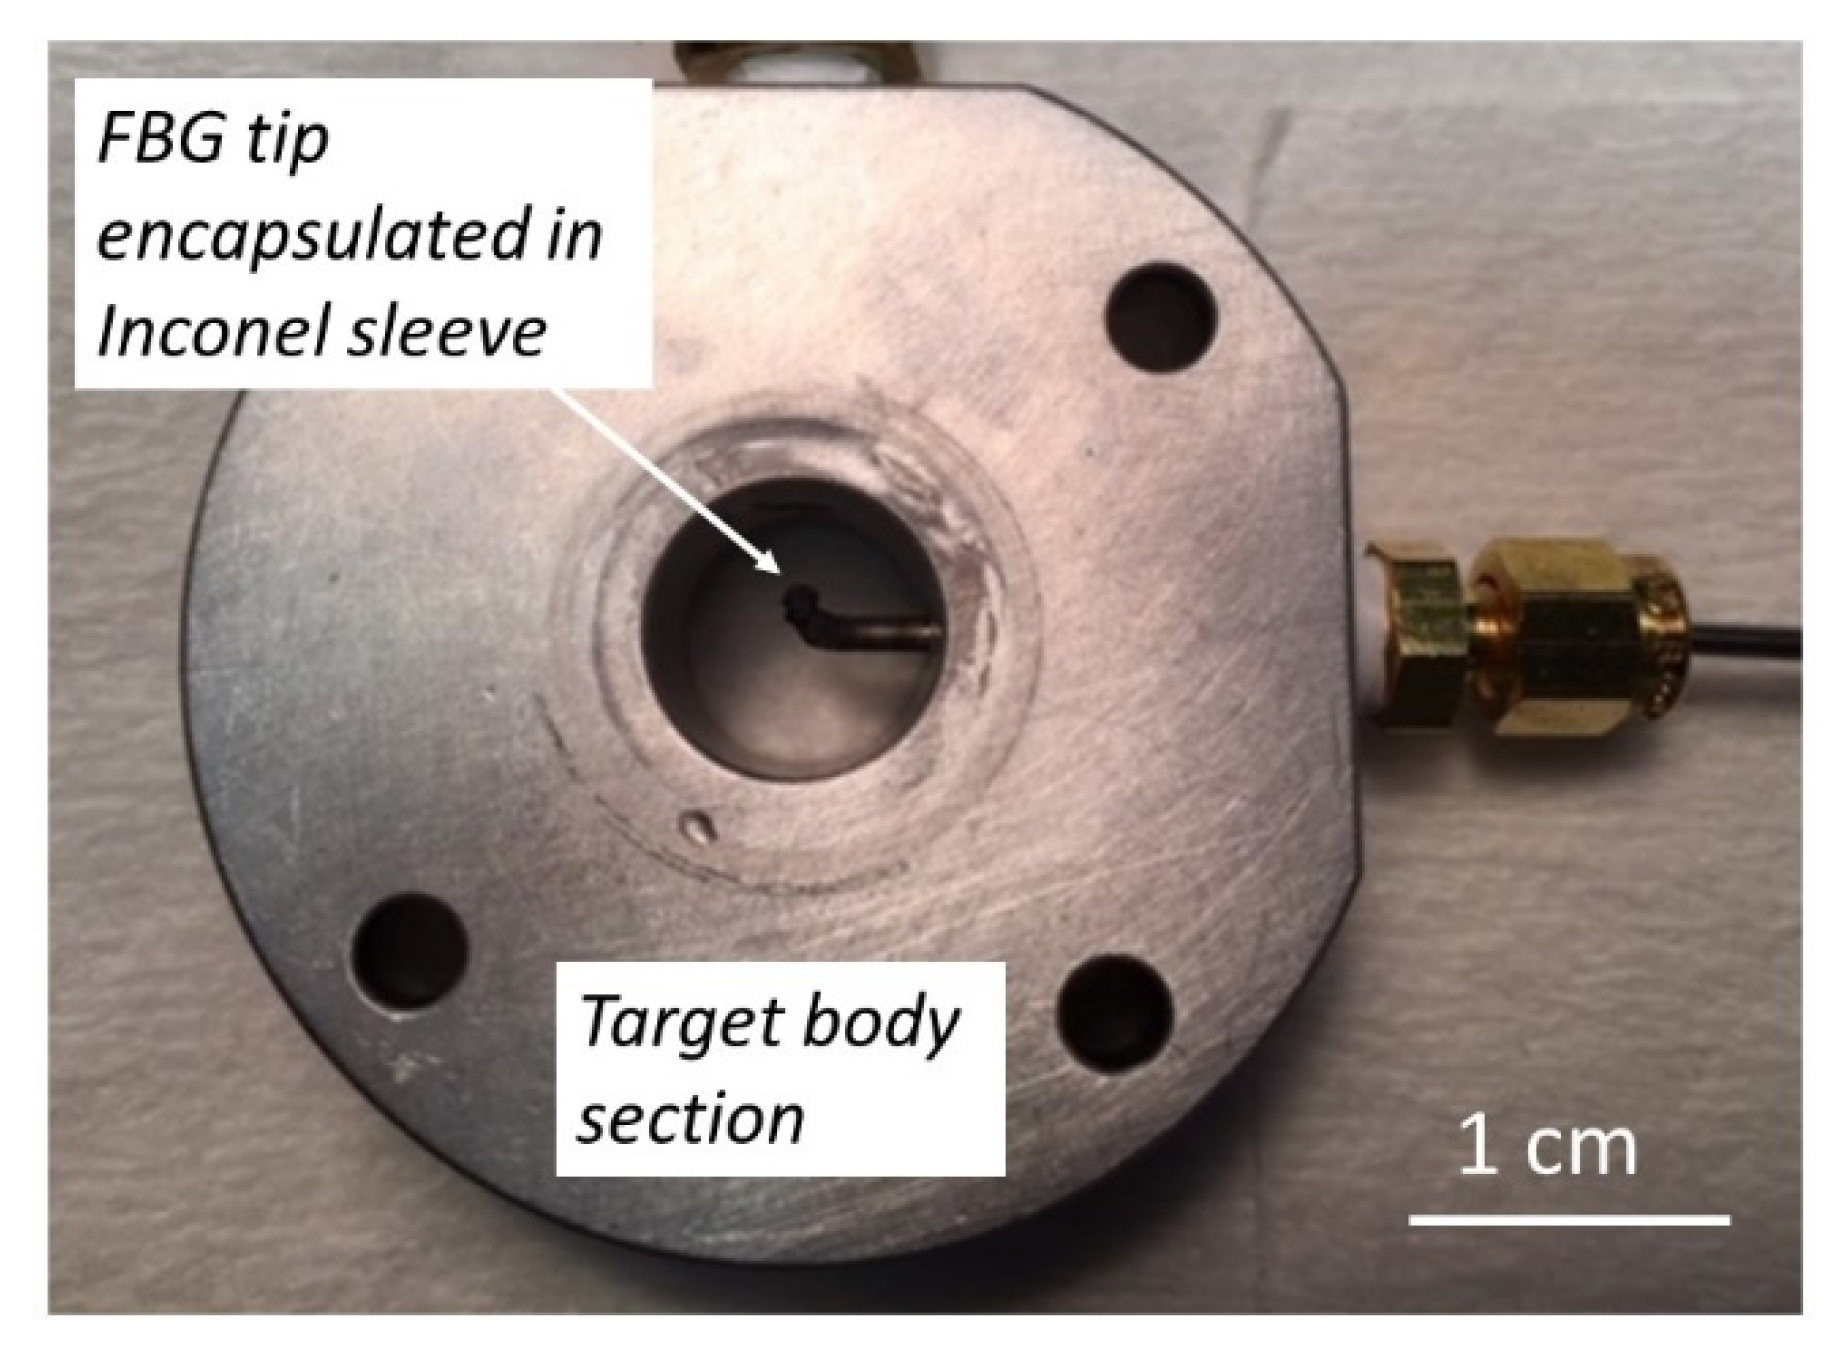
2.6.1. FBG-Based Temperature Probe and Pressure Transducer

For this experiment, a custom FBG-based temperature probe was developed that employed the RAD configuration FBG as a temperature sensor. In order to collect fluid temperature in the isotope production target with the FBG sensor, the fiber had to be mechanically protected during irradiation from the rapidly mixing liquid. Furthermore, it needed to be mounted in a leak-tight configuration. The custom FBG-based temperature probe used in the experiments mimicked the form generally used in handheld thermocouple sensors. A 1/16” outer diameter closed end Inconel protection tube was slid over the fiber. The FBG sensor was located at the closed end of this protection tube with the FBG’s measurement location placed <10 mm from the tip of the probe. The protection tube was 150 mm long and terminated with a fitting through which the fiber transitioned into a fiber optic cable via a connector. The FBG temperature probe was calibrated using a Fluke 9103 dry well and a Guildline 9540a resistance temperature detector with a reported measurement uncertainty of ±0.2 °C over the operating range of the test. The FBG temperature probe was inserted into the production target and sealed with a 1/16” brass compression fitting.
A custom FBG-based pressure transducer employing two RAD configuration FBGs was also developed. One acted as a strain gauge, the second as a temperature sensor. A stainless-steel mechanism with a diaphragm exposed to the pressurized fluid (Figure 3) was designed. This diaphragm was laser welded to a shaft in the diaphragm’s center, oriented perpendicular to its surface. When the diaphragm was deflected by an increase in fluid pressure, the shaft was compressed. The FBG was attached to the shaft and thereby experienced a contraction of its length. A second FBG was embedded into the housing of the pressure transducer to provide a temperature compensation device. This FBG allowed for the measurement of the temperature of the transducer’s body and was used during the calibration process and during operation to compensate the pressure output signal for temperature fluctuations. When applied fluid pressure increased, a negative wavelength shift was observed by the strain FBG. When the transducer body temperature increased, both the strain and temperature FBGs experienced a positive wavelength shift. The implementation of Equation (1) facilitated the mathematical comparison of the signals conducted in post processing which produced temperature compensated pressure readings. Due to differences in the thermal time constants of the strain and temperature FBGs, this temperature compensation worked effectively at steady state conditions. The pressure transducer was calibrated using a Fluke 2271A industrial pressure calibrator and a Tenney environmental chamber. The transducer was calibrated from 0 to 500 psi with a reported measurement uncertainty of ±1.25 psi (±0.25% FSO).

2.6.2. Interpretation of Wavelength Shift

Fiber optic sensors employing FBGs can be sensitive to both changes in strain and changes in temperature depending on the mechanical design of the sensor. As it was mentioned earlier, one FBG cannot inherently decouple the effects of strain and temperature from the measurement of its characteristic wavelength. For that reason, judgement must be used when analyzing changes in characteristic wavelength and attributing them to discrete experimental parameters. When a FBG is installed in a device in a strain isolated manner, it can be assumed that changes in wavelength are caused by changes in temperature. In this function, the FBG will report a change in wavelength vs. temperature with a sensitivity of ~ 0.010 nm/°C in temperature environments from −20 to 200 °C. When a FBG is installed in a device with the intention of measuring strain, it is impossible to remove the FBG’s inherent temperature sensitivity. In order to conduct a strain-only measurement, temperature compensation is typically provided by using a secondary temperature measurement system. The FBG test specimens subjected to irradiation did not incorporate any temperature compensation system and therefore, wavelength shifts due to temperature were expected to be included in any observations of the total wavelength shift. Wavelength measurements conducted before and after irradiation were collected while specimens were stabilized to ambient room temperature. Fluctuations of room temperature within a range of ±2.0 °C are expected. They would cause fluctuations of ±0.020 nm observed in the FBG wavelength.

3. Results and Discussion

3.1. Proton and Neutron Irradiations

Proton irradiation experiments were comprised of exposing five placards to varying proton beams. The placards featured one specimen of each of the three categories of FBGs installed in a strain relieved manner in a designated target. Spectra of each FBG specimen were collected before, during and after irradiation to assess the impact of the irradiation on two key parameters: changes to the reflected power of the FBG, labelled as Radiation Induced Absorption (RIA), and changes to the characteristic wavelength (i.e., Bragg wavelength) of the FBG, labelled as Radiation Induced Shift (RIS). Overall, no statistically significant effect was observed due to proton irradiation on any of the test placards or in any of the three categories of FBGs. All variations in reflectivity or characteristic wavelength were either attributed to observed fluctuations in ambient air or placard temperature in the experimental environment or typical fluctuations seen in FBG testing that were insignificant for the purpose of this experiment.

3.1.1. Radiation Induced Absorption

During the proton irradiation, the Fibos OGA was employed as a tool to measure the spectral characteristics of the FBG as well as track the wavelength of the sensors during the test, see Figure 4. Radiation induced absorption (RIA) was assessed as a comparison between the maximum FBG reflectivity immediately prior to the first dose and that measured immediately after each dose. The analysis of test results concluded that there were no significant changes to the reflectivity of the FBGs during any of the proton irradiations. Any changes to reflectivity over the course of the experiment were found to be within the expected range observed during disconnecting and reconnecting of the fiber optic connectors (±1 dB). Neither the UV, FS nor RAD test specimens demonstrated any statistically significant relationship between dose or dosage rate and RIA. This result was in agreement with the observations of Morana et al. who reported ~0.1 dB/m of RIA with 50 times higher dose rates and ~8.5 times higher accumulated dose. With the presented test specimens only exposing 1 m of fiber to radiation, a 0.1 dB loss in reflectivity would have been not observable given the repeatability error of the system.

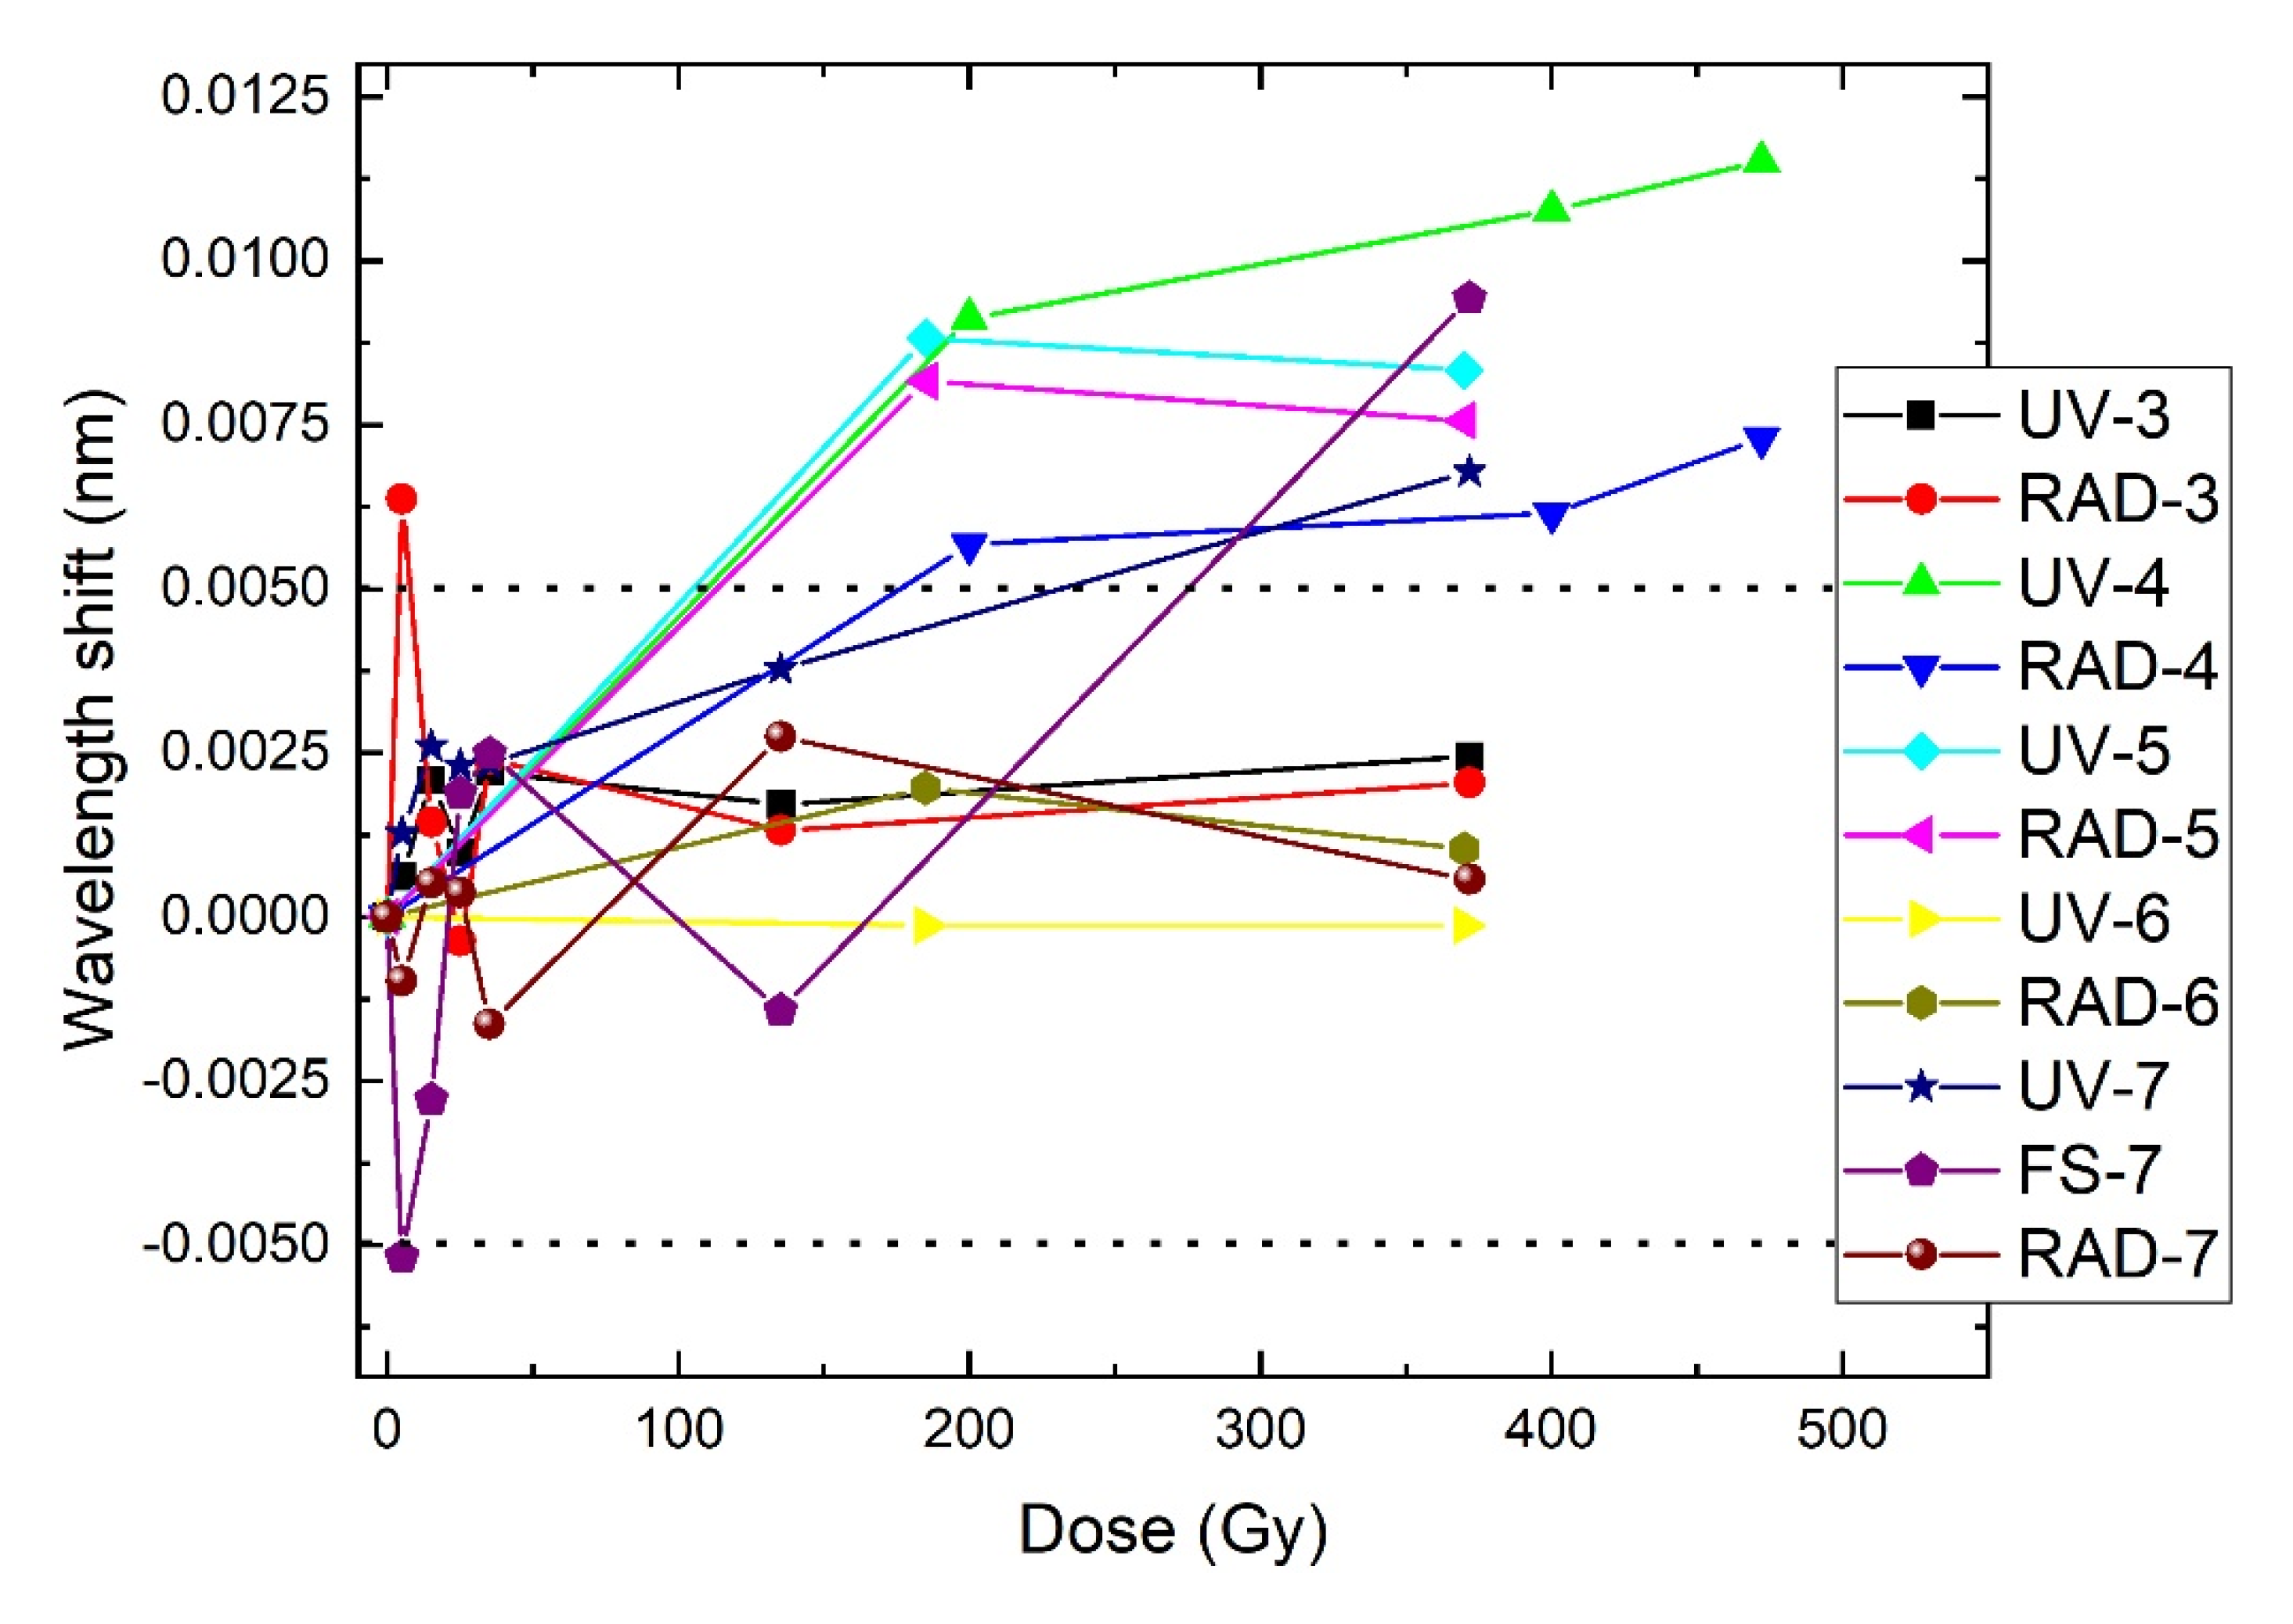
3.1.2. Radiation Induced Wavelength Shift

The primary measurement scheme of the OGA is to automatically detect the characteristic wavelength of the connected FBG and track its wavelength. The OGA conducted these wavelength measurements with an uncertainty of ±0.005 nm [17]. To evaluate Radiation Induced Wavelength Shift (RIS), the OGA was used to record the characteristic wavelength of the FBG immediately prior to any irradiation, actively during the irradiation and immediately after each dose step. The results of this evaluation conducted during the proton irradiations are illustrated in Figure 5. The locus of results indicate no significant statistical correlation between RIS and dose when the following conditions are considered: 0.010 nm of RIS could be reasonably justified by a mere 1.0 °C increase in the temperature of the test placard as the test placard absorbs the dose and warms and the ±0.005 nm measurement uncertainty of the OGA. The observed RIS results are in agreement with those of Morana et al. as the RIS across their three relevant test cases was less than ±0.040 nm with dose rates 50 times higher and an accumulated dose ~8.5 times higher [18]. The reported range of wavelength deviations in Figure 5 was less than ±0.010 nm throughout the test. Based on previous experience, wavelength fluctuations of less than ±0.010 nm over the course of a multi-hour test are typical and therefore it was concluded that any RIS is insignificant.
One test placard accommodating one of each FBG category was also exposed to the neutron irradiation. Similar to the proton irradiation experiments, no radiation effect on the FBGs’ performance was observed due to neutrons. All wavelength shifts were attributed to normal temperature fluctuations in the experimental environment.

3.2. Comparison of FBG Categories

The results of the RIA and RIS evaluations supported that there was no statistically relevant correlation between attenuation or Bragg wavelength and integrated dose or dose rate. As such, it may further be concluded that there was no statistically significant difference in the behavior of the three FBG categories: UV, FS and RAD. Previously published research, including the work by Morana et al., indicated that the Ge-dopant found in the UV and FS specimens would react when exposed to gamma radiation in a manner that increases the photosensitivity of the fiber [18]. This reaction would particularly impact the UV gratings as the UV inscription process relies on the photosensitivity of the fiber. As such, it would be expected that with a high enough dose, the UV specimens would see RIS. In conclusion, there is no discernable difference in RIS between the three grating categories as seen in Figure 5. This would suggest that either the accumulated doses were not high enough to cause a noticeable RIS or the expected RIS from gamma irradiation does not correlate with the observed RIS from proton or neutron irradiation.

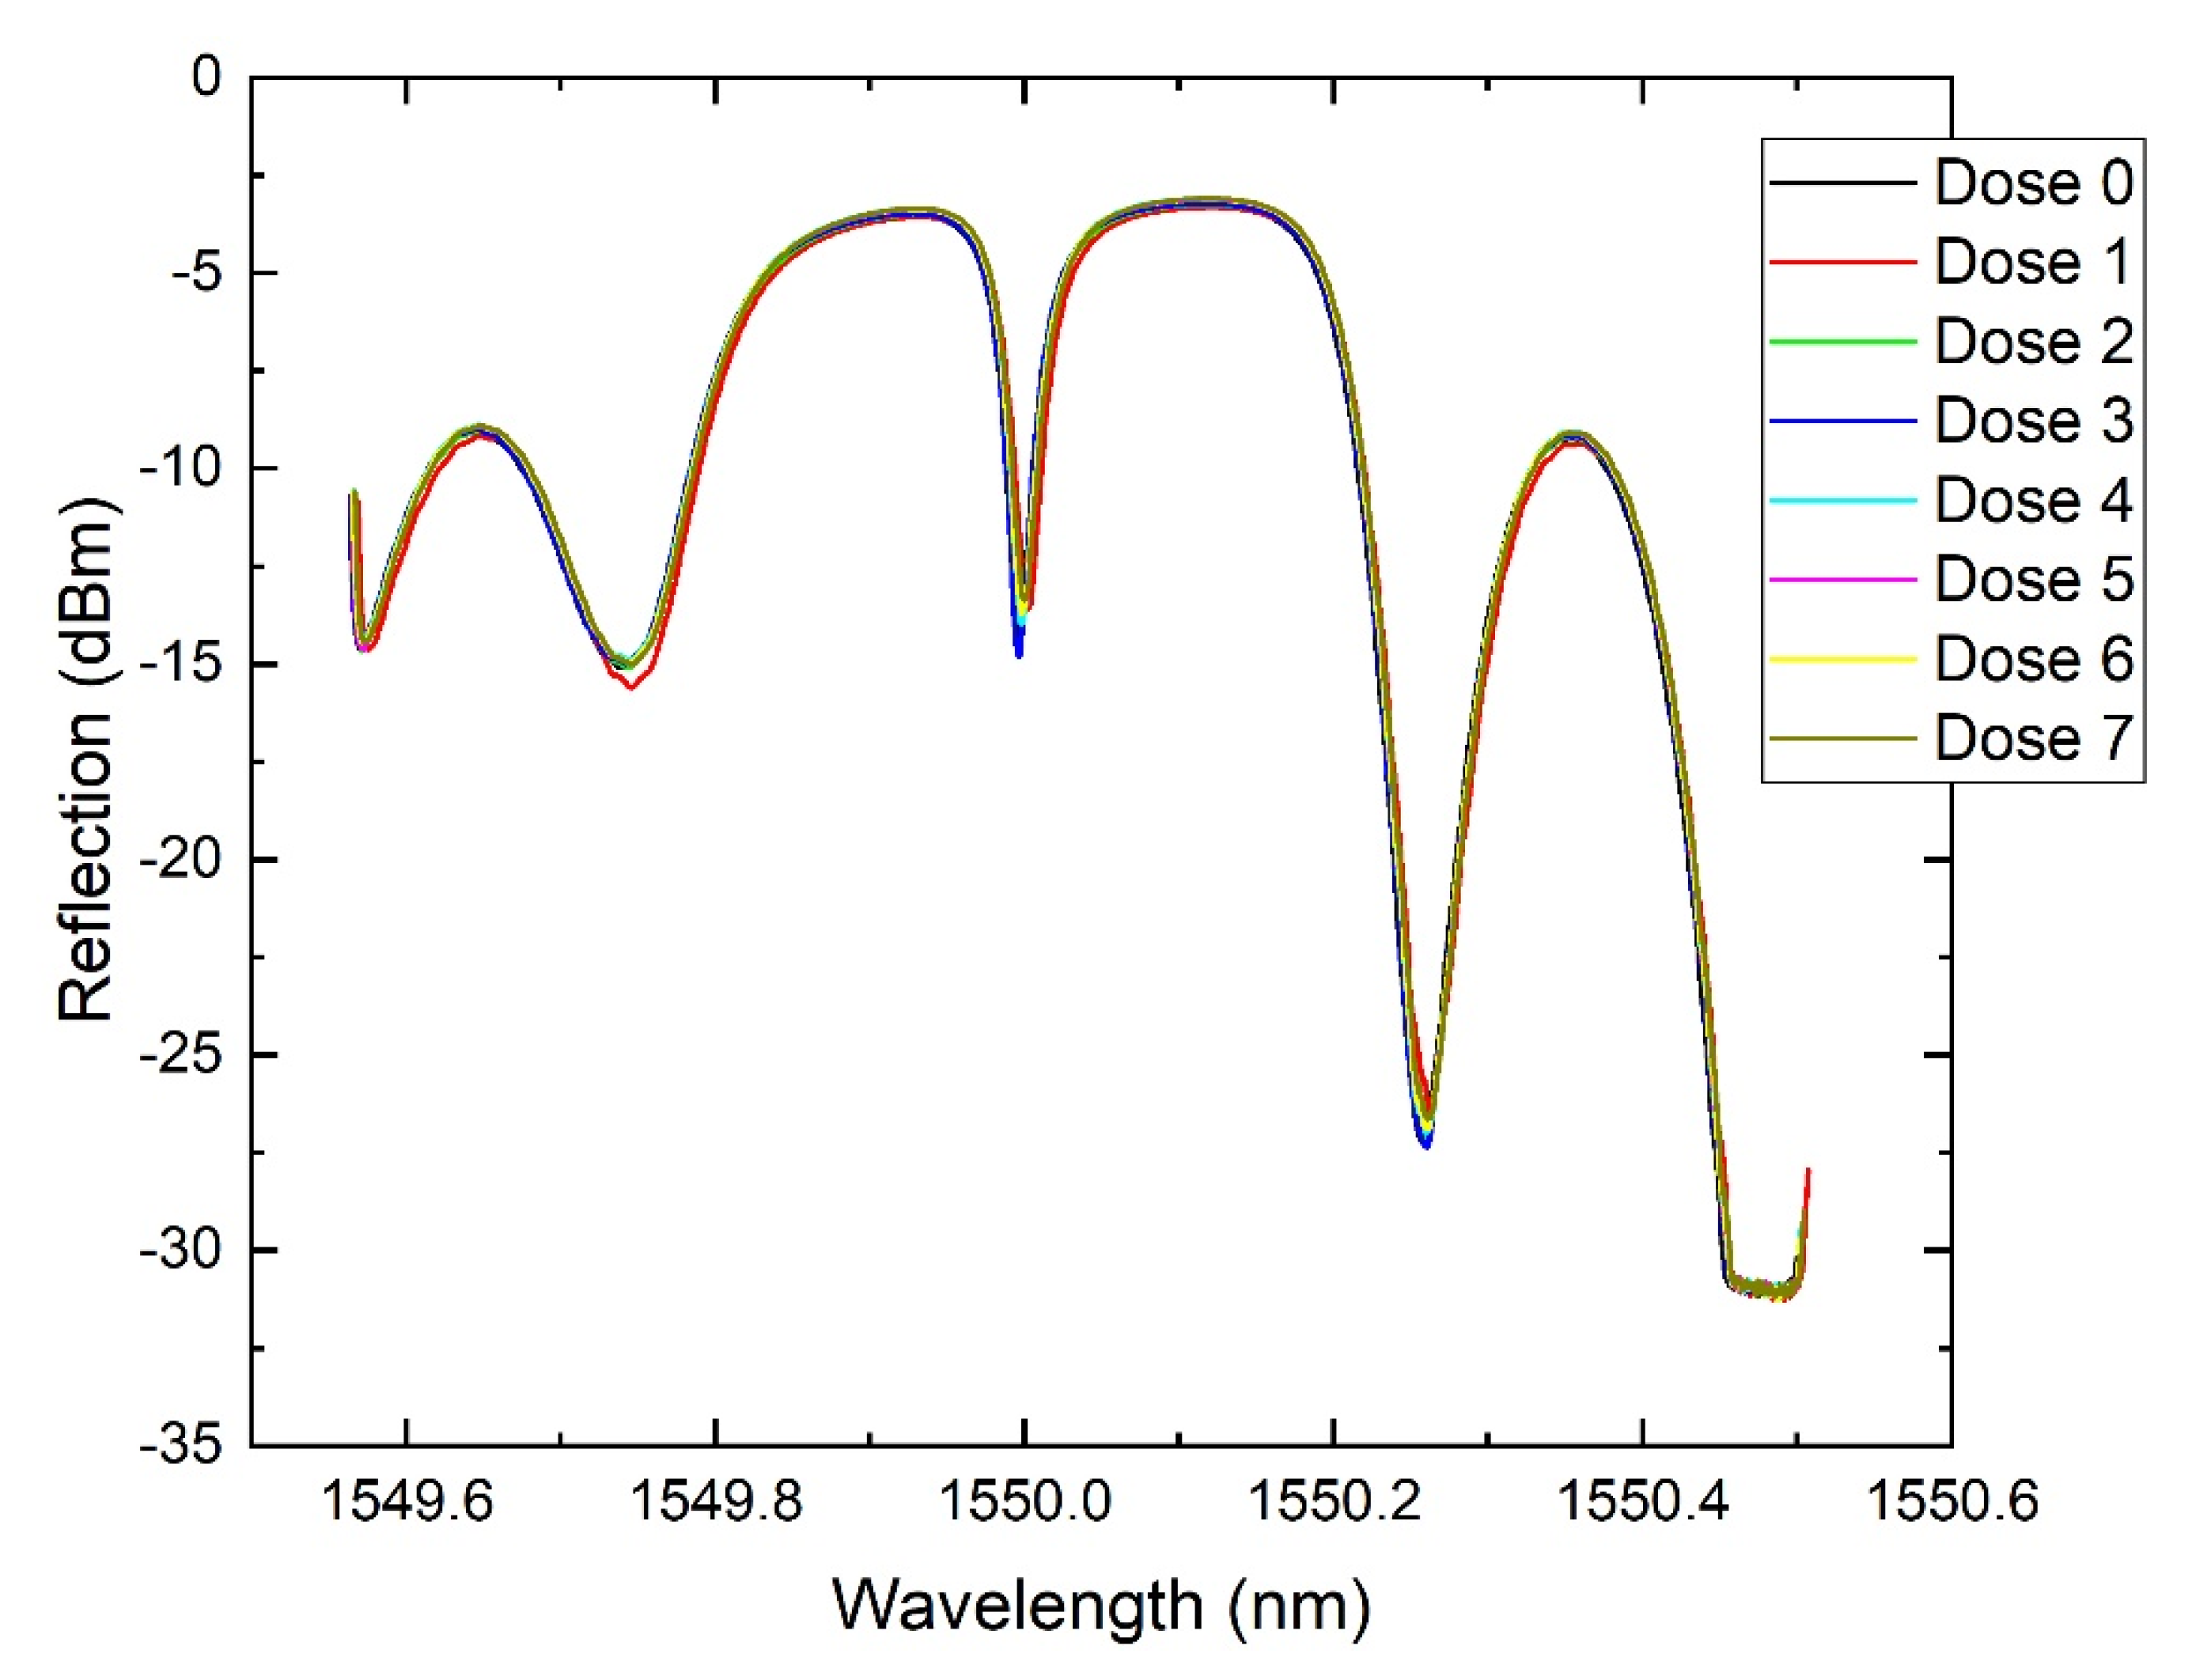
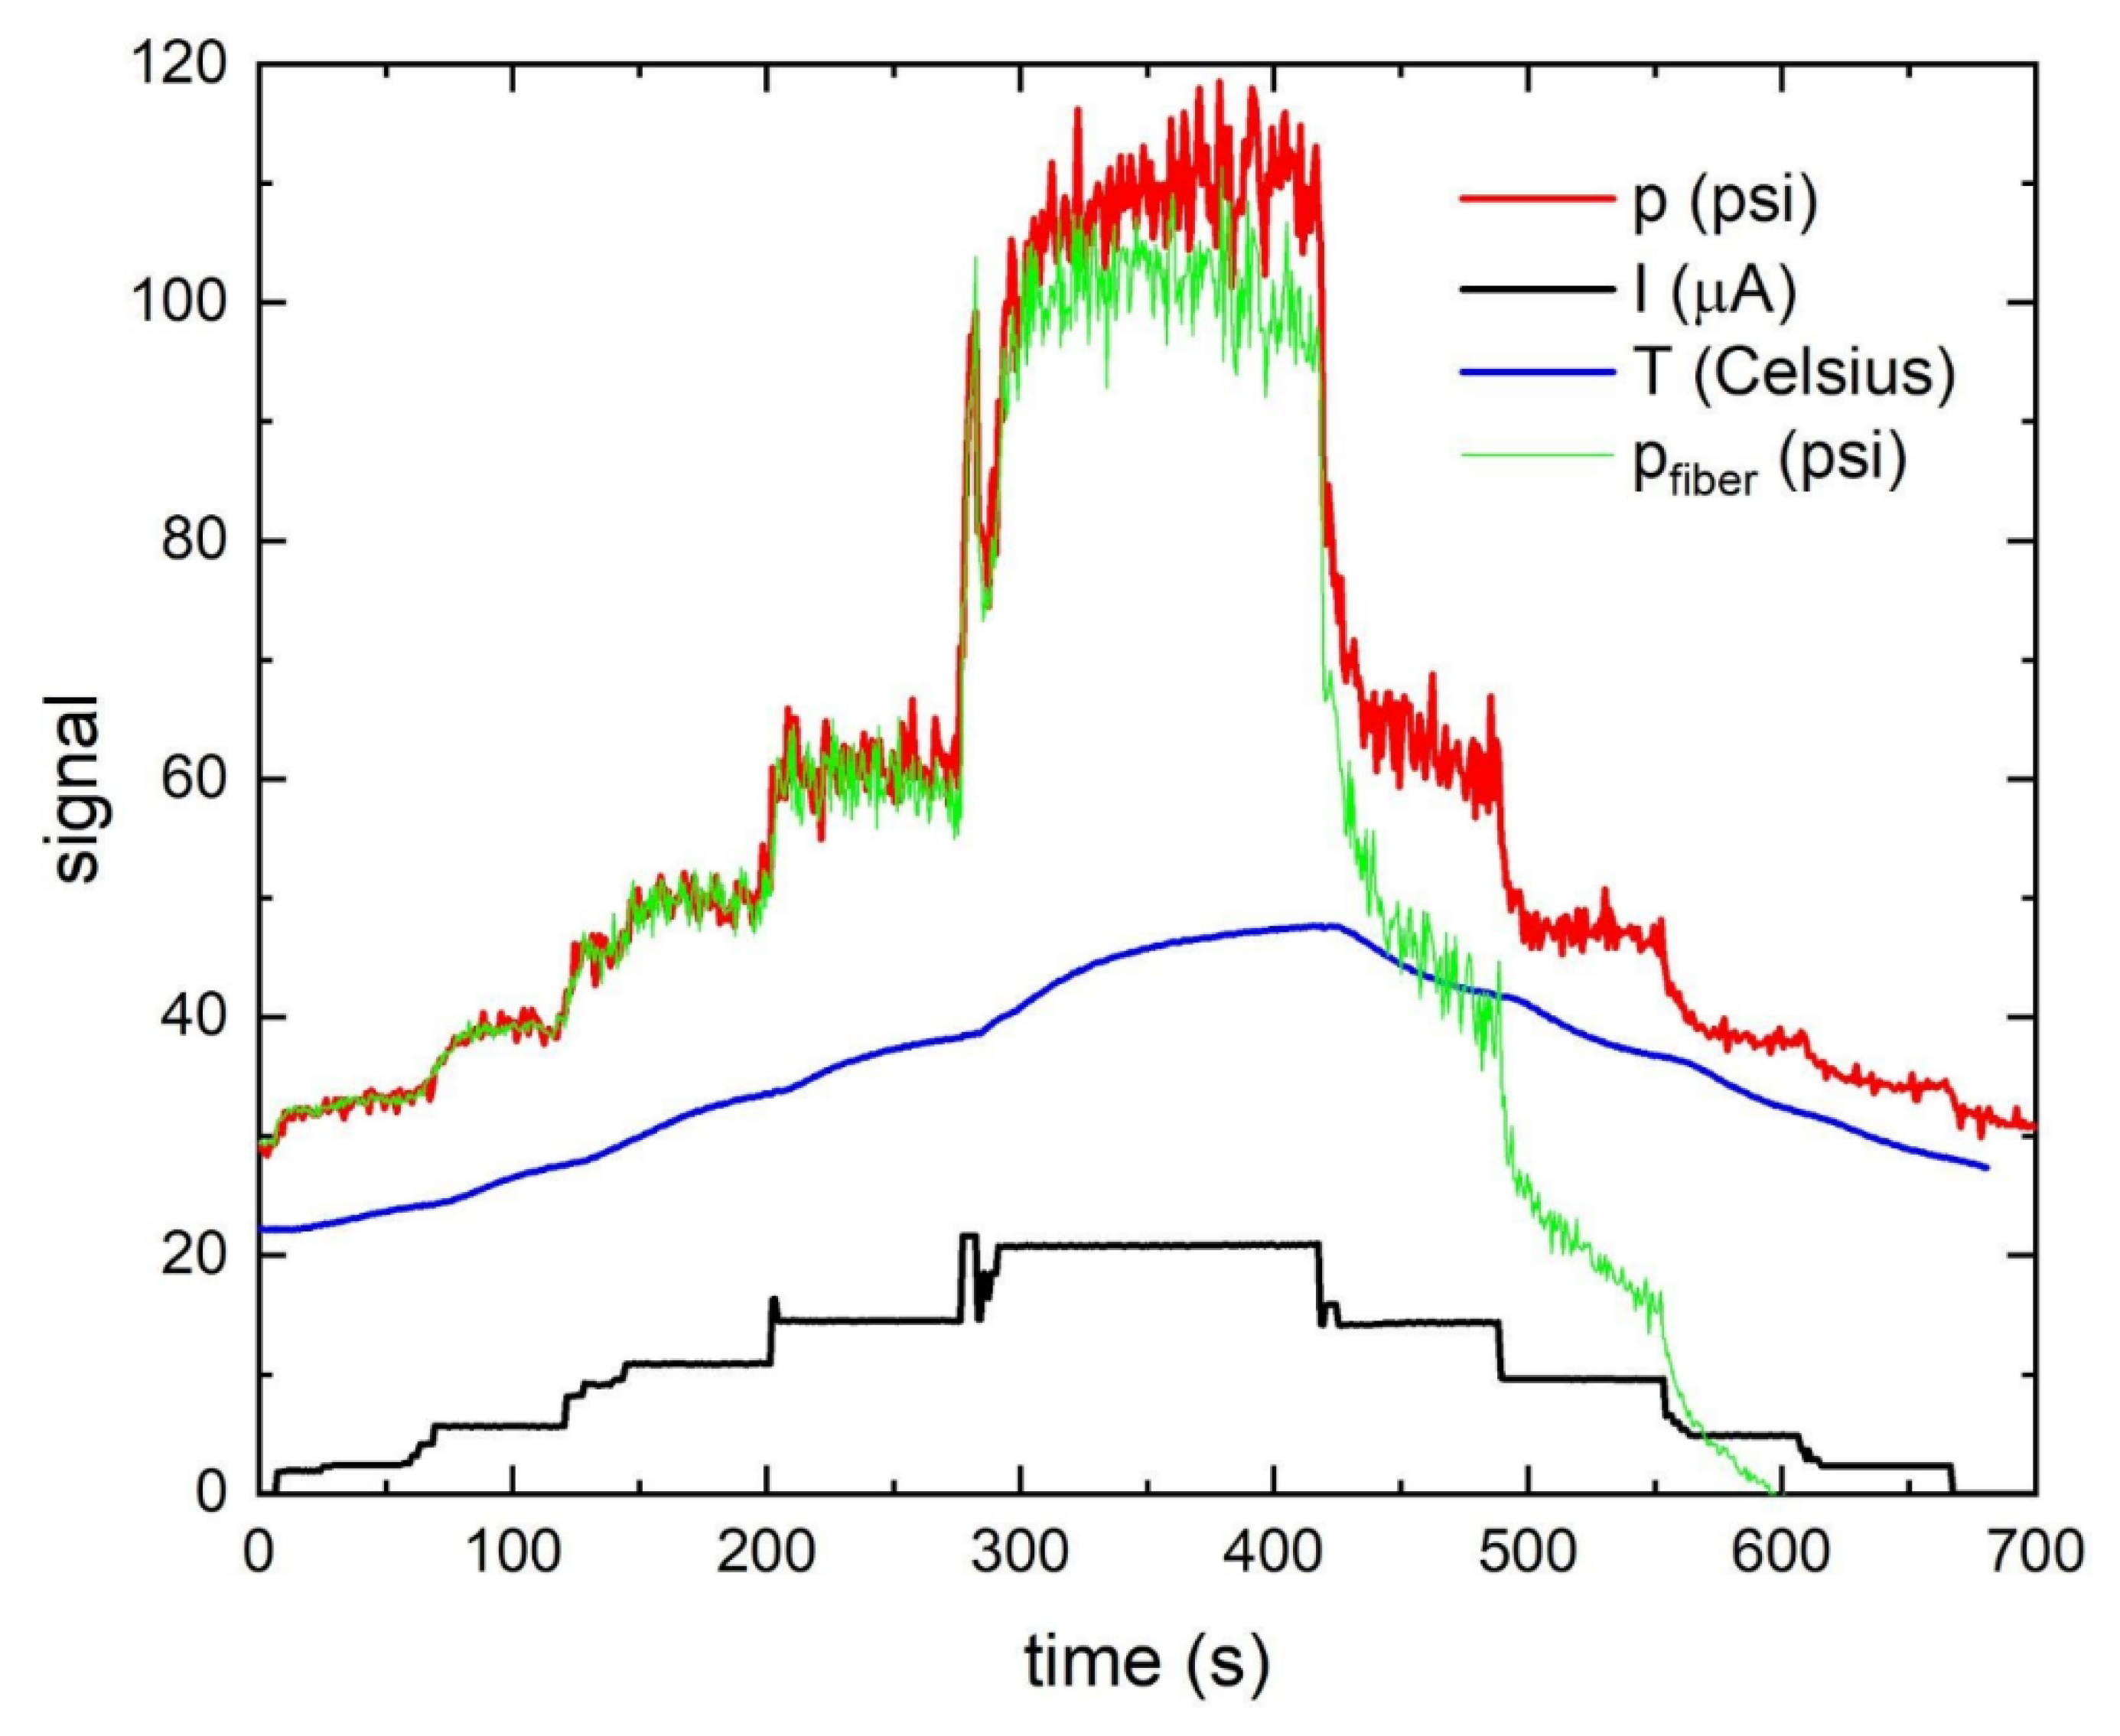
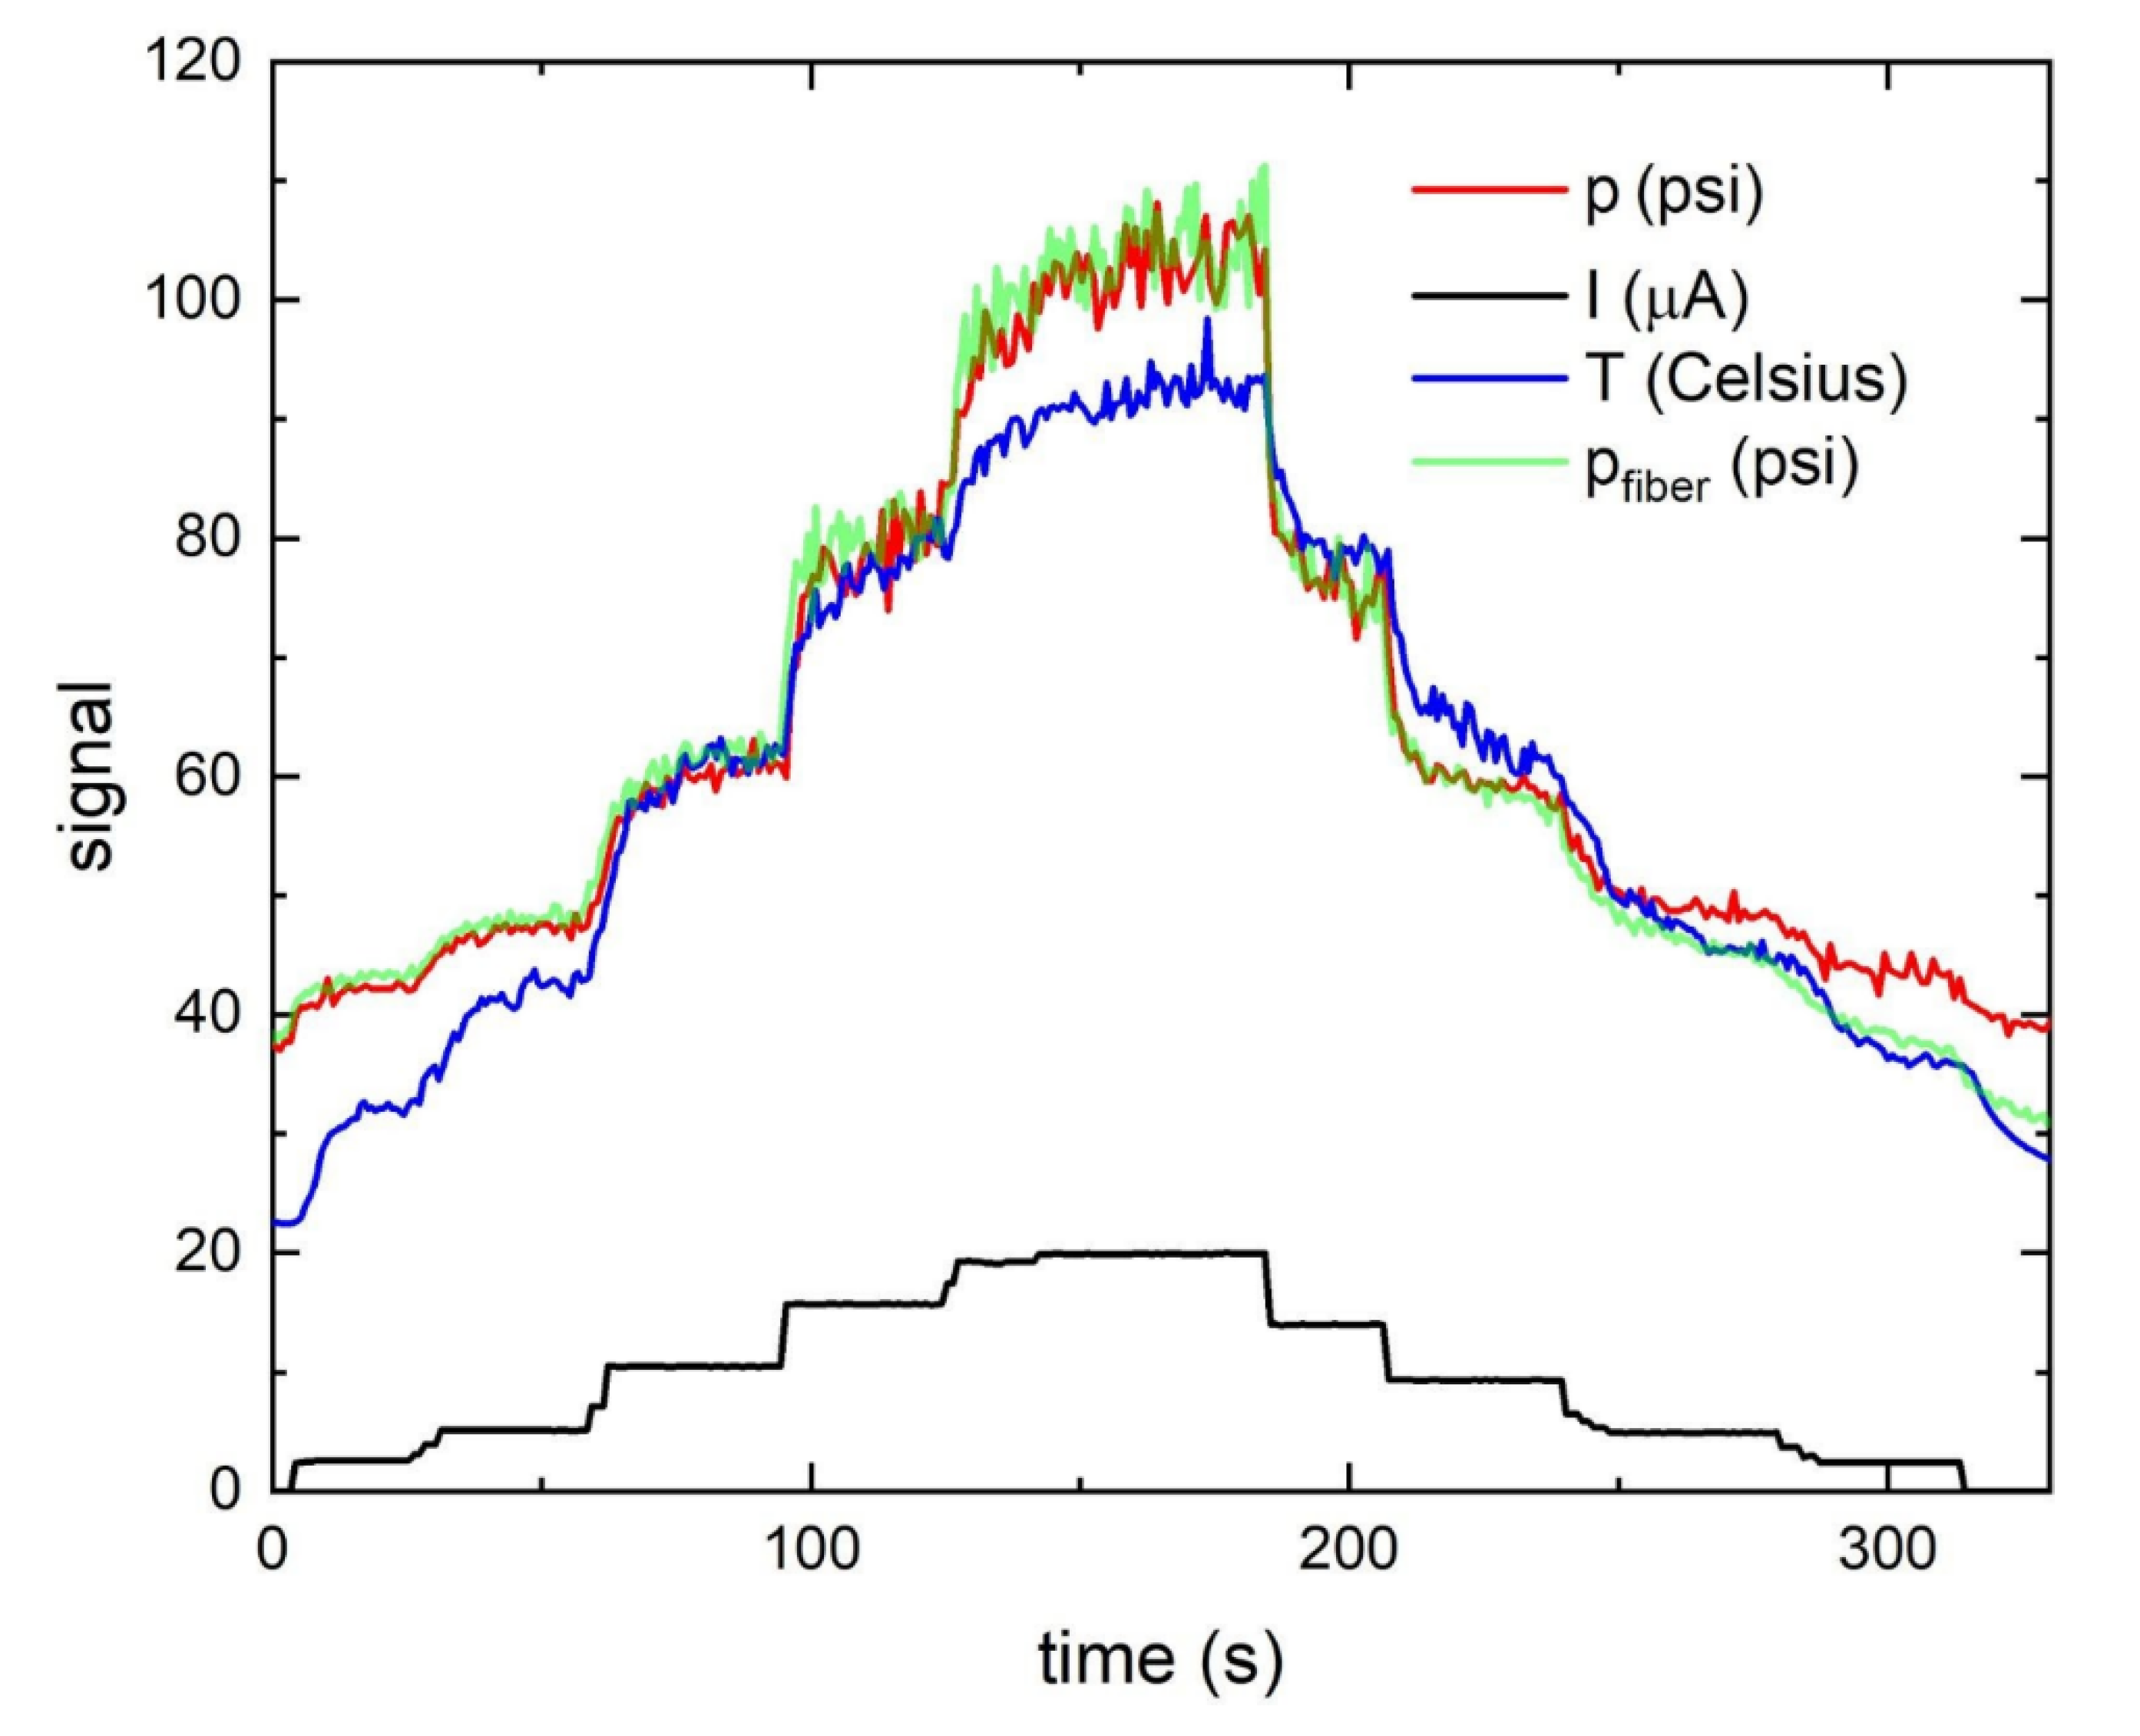
3.3. Isotope Production Irradiation

Two main isotope production experiments were conducted. In the first irradiation, the FBG-based temperature probe was inserted such that the tip of the probe touched the target-body wall diametrically opposed to its insertion port. At the start of the irradiation, the temperature probe reported a value of 22.2 °C which agreed with the expected temperature of the target body when water cooled. The beam current was increased in small steps and increases in temperature and pressure as reported by the FBG-based sensors were observed. The increasing current corresponded to increases in fluid temperature and consequently pressure associated with heating of the fluid within the enclosed target body. The observed increases in temperature and pressure occurred almost instantaneously with the increase in beam current. The FBG temperature probe produced a signal that appeared to exhibit attenuated dynamics compared to what was expected. Further, considering that the water pressure is physical coupled to its temperature in this enclosed volume, it was expected that the FBG temperature probe would report a temperature signal similarly dynamic to that of the FBG-based and reference pressure transducers. It was concluded that since the temperature probe was inserted such that its tip was in contact with the aluminum wall of the target body, it was not measuring exclusively the fluid temperature but also the temperature of the target body, which attenuated the fluctuations in observed temperature. At the full beam current of 20 µA, the observed temperature rose to 47.67 °C. It was concluded that this reading was lowered by the temperature of the target-body wall and therefore it was not representative of the temperature of the target fluid exposed to the full beam current. The beam current decreased at around 400 s and the pressure and temperature measurements decreased as well. The observed data is illustrated in Figure 6.
During the first isotope production experiment, the FBG-based pressure transducer reported a fluid pressure in agreement with the reference pressure transducer readings for the first ~300 s of the test. Beyond the 300 s mark, the FBG-based transducer began to report pressure readings that were lower than those of the reference pressure transducer—a disagreement that continued to increase between the two signals. Investigation into this behavior suggested that the difference in time constants between the strain FBG and the temperature FBG inside the pressure transducer caused errors in the temperature compensation scheme. The temperature compensating FBG in the pressure transducer was separated from the strain FBG by a thermal mass. Based on the signals recorded, it was concluded that the pressure transducer was overcompensating for temperature. It had originally been calibrated under steady-state temperature and pressure conditions and the changing temperature during the experiment exacerbated the device’s sensitivity to transient conditions in the temperature compensation scheme. Further analysis and recalibration of the pressure transducer may be required to also accommodate transient temperature conditions. The divergence from the reference pressure reading that occurred beyond 300 s may be due to the delay between the actual rise of the temperature in the liquid and the response of the temperature compensation by the FBG inside the pressure transducer. The temperature compensation scheme based on Equation (1) assumes no time delay in the response of the two input signals; therefore, inadequately compensated increases in body temperature of the pressure transducer would be realized as decreases in the reported pressure value. As the pressure transducer warmed, the correction due to the increase in temperature may not have been subtracted correctly from the pressure signal. The disagreement between the pressure readings was expected to only be temporary and to revert back to an error of 0 psi once the FBG-based pressure transducer returned to a steady-state temperature. This was observed during the experiment by pressure readings collected several minutes after the conclusion of the test and at the beginning of the subsequent test once transducer temperatures stabilized.
The second isotope production irradiation experiment was conducted following the same protocol as the first one with the FBG-based temperature probe now retracted by 2 mm so that its tip was removed from the wall of the target body. The proton beam current was increased stepwise to the same maximum value but with shortened dwell times at each set point. The temperature and pressure measurements are illustrated in Figure 7. The retracted temperature probe reported dynamic readings compared to the first experiment. This agreed with the assumption that in the previous experiment the temperature probe reading was affected by the thermal mass of the target body. With the temperature probe inserted into the target liquid, the temperature readings demonstrated the same level of dynamic behavior as both the FBG-based and reference pressure transducer signals, which confirmed that the fluid temperature and pressure were physically coupled. The dynamic temperature signal was understood to be a measurement of the cavitation and convection currents that occur in a liquid target. At a beam current of 20 µA, the highest measured temperature in the target water was 94.75 °C. The same behavior of divergence between the FBG-based and reference pressure transducer signals occurred at around 300 s into the test, as observed in the first experiment. Overall, the experiment successfully demonstrated the efficacy of the FBG-based temperature probe and pressure transducer in proton beam applications. More design and calibration developments are required to improve accuracy of the pressure readings. No significant performance degradation due to exposure to proton radiation was observed.
A subsequent experiment was conducted to explore the behavior of the FBG-based temperature probe in an empty target cavity, i.e., the proton beam was allowed to strike the inserted probe without the thermal mass and cooling provided by the target water. As expected, the temperature sensor reacted to the increased beam current immediately with a significantly shorter response than when the target water was present. When the beam current was set to 10.5 µA, the FBG-based temperature probe reported a value of 129.70 °C when the signal was suddenly lost. The target was disassembled to investigate the cause of the failure. Inspection of the individual components revealed that the Inconel sheath of the sensor had melted and deformed, thereby mechanically destroying the fiber and FBG, see Figure 8. It should be noted that while the Inconel sheath has a melting temperature ~1250 °C, the FBG-based temperature sensor can operate in temperatures up to 1000 °C.

4. Conclusions

We tested three different categories of π-FBG-based fiber optic sensors in proton and neutron radiation fields. All three categories demonstrated excellent resilience to irradiation. No Radiation Induced Attenuation (RIA) or Radiation Induced Wavelength Shift (RIS) were observed in neither radiation fields up to an accumulated dose of 472 Gy. Following these promising results, a temperature probe and pressure transducer were successfully developed using the femtosecond engraved π-FBG sensor in pure silica core radiation-hardened fiber; the sensor was used to measure the temperature and pressure of a liquid in an isotope production target irradiated on a medical cyclotron. Pressures up to 110 psi and temperatures up to 129 °C were measured. As a discrepancy between the pressure measurement of our fiber and a conventional pressure gauge was observed after reaching maximum pressure, further work is required to improve the temperature compensation of the pressure transducer to accommodate for transient temperature conditions during operation. Despite these shortcomings, the presented FBG-based temperature probe and pressure transducer successfully demonstrated their viability for providing real-time local temperature and pressure measurements during isotope production.

Author Contributions

Conceptualization, M.B. and C.H.; Formal analysis, M.B., M.H., C.H., S.S.Z. and C.H.; Funding acquisition, M.B. and C.H.; Methodology, M.B., M.H., C.H., D.G., S.M., S.S.Z. and C.H.; Project administration, C.H.; Resources, M.B. and C.H.; Software, M.B.; Supervision, S.S.Z. and C.H.; Visualization, M.B.; Writing—original draft, M.B. and C.H.; Writing—review and editing, M.B., M.H., C.H., D.G., S.M., S.S.Z. and C.H. All authors have read and agreed to the published version of the manuscript.

Funding

TRIUMF receives funding via a contribution agreement with the National Research Council of Canada. This research was funded by the Natural Sciences and Engineering Research Council (NSERC) of Canada via the Discovery Grant program, grant number RGPIN 2016-03972.

Acknowledgments

In this section you can acknowledge any support given which is not covered by the author contribution or funding sections. This may include administrative and technical support, or donations in kind (e.g., materials used for experiments).

Conflicts of Interest

The authors declare no conflict of interest.

References and Note

  1. Nuclear Energy Agency Medical Radioisotopes. 2017. Available online: https://www.oecdnea.org/med-radio/ (accessed on 10 May 2020).
  2. Robertson, A.; Lobbezoo, A.; Moskven, L.; Schaffer, P.; Hoehr, C. New target design to produce Ac-225 at TRIUMF. Instruments 2019, 3, 18. [Google Scholar] [CrossRef] [Green Version]
  3. Jahangiri, P.; Doering, R.; Ferguson, S.; Li, K.; Buckley, K.; Benard, F.; Martinez, D.M.; Hoehr, C. Modeling the pressure rise of a liquid target on a medical cyclotron: Steady-state analysis. Appl. Radiat. Isot. 2017, 120, 22. [Google Scholar] [CrossRef] [PubMed]
  4. Jahangiri, P.; Zacchia, N.; Buckley, K.; Benard, F.; Schaffer, P.; Martinez, D.M.; Hoehr, C. An analytical approach of thermodynamic behaviour in a gas target system on a medical cyclotron. Appl. Radiat. Isot. 2016, 107, 252. [Google Scholar] [CrossRef] [PubMed]
  5. Buckley, K.R.; Huser, J.; Jivan, S.; Chun, S.K.; Ruth, T.J. 11C-methane production in small volume, high pressure gas targets. Radiochim. Acta 2000, 88, 201–205. [Google Scholar] [CrossRef]
  6. Buckley, K.R.; Jivan, S.; Ruth, T.J. Improved yield for the in-situ production of [11C]CH4 using a niobium target chamber. Nucl. Med. Biol. 2004, 31, 825–827. [Google Scholar] [CrossRef] [PubMed]
  7. Stokely, M. Testing and Analysis of Advanced Thermosyphon Target Systems for Production of Aqueous [18F]Fluoride via 18O(p,n)18F. Ph.D. Thesis, North Carolina State University, Raleigh, NC, USA, 2008. [Google Scholar]
  8. Peeples, J.; Stokely, M.H.; Poorman, M.C.; Magerl, M.; Wieland, B.W. Visual observation of boiling in high power liquid target. AIP Conf. Proc. 2012, 1509, 76–80. [Google Scholar]
  9. Peeples, J.; Stokely, M.H.; Doster, J.M. Thermal performance of batch boiling water targets for 18F production. Appl. Radiat. Isot. 2011, 69, 1349–1354. [Google Scholar] [CrossRef] [PubMed]
  10. Alvord, C.W.; Ruggles, A.E.; West, C.D. Calculations of attainable superheats and predicted embryonic flux rates in commercial water isotope targets. Appl. Radiat. Isot. 2008, 66, 1781–1787. [Google Scholar] [CrossRef] [PubMed]
  11. Peeples, J.; Magerl, M.; O′Brien, E.; Doster, J.; Bolotnov, I.; Wieland, B.; Stokely, M. High current C-11 gas target design and optimization using multi-physics coupling. AIP Conf. Proc. 2017, 1845. [Google Scholar] [CrossRef]
  12. Faugl, T.; Stokely, M.; Wieland, B.; Bolotnov, I.; Doster, J.; Peeples, J.; Poorman, M. Modeling a water target with proton range and target density coupling. In Proceedings of the WTTC 15 Proceedings, Prague, Czech Republic, 18–24 August 2014. [Google Scholar]
  13. Hong, B.H.; Kang, J.; Jung, I.S.; Ram, H.G.; Park, Y.S.; Cho, H.H. Self-overcoming of the boiling condition by pressure increment in a water target irradiated by proton beam. Nucl. Instrum. Methods Phys. Res. A 2013, 728, 6–10. [Google Scholar] [CrossRef]
  14. Othonos, A. Fiber Bragg gratings. Rev. Sci. Instrum. 1997, 68, 4309–4341. [Google Scholar] [CrossRef]
  15. Hnatovsky, C.; Grobnic, D.; Mihailov, S.J. High-temperature stable π-phase-shifted fiber Bragg gratings inscribed using infrared femtosecond pulses and a phase mask. Opt. Express 2018, 26, 23550–23564. [Google Scholar] [CrossRef] [PubMed]
  16. Henschel, H.; Hoeffgen, S.K.; Krebber, K.; Kuhnhenn, J.; Weinand, U. Influence of fiber composition and grating fabrication on the radiation sensitivity of fiber Bragg grating. IEEE Trans. Nucl. Sci. 2008, 55, 2235–2242. [Google Scholar] [CrossRef]
  17. Mihailov, S.J.; Grobnic, D.; Hnatovsky, C.; Walker, R.B.; Lu, P.; Coulas, D.; Ding, H. Extreme environment sensing using femtosecond alser-inscribed fiber Bragg gratings. Sensors 2017, 17, 2909. [Google Scholar] [CrossRef] [PubMed] [Green Version]
  18. Morana, A. Gamma-Rays and Neutrons Effects on Optical Fibers and Bragg Gratings for Temperature Sensors, Optics/Photonic. Ph.D. Thesis, Université Jean Monnet–Saint Etienne, Saint-Étienne, France, 2013. NNT: 2013STET4023 (In English). [Google Scholar]
  19. Belanger-Champagne, C.; Blackmore, E.; Lindsay, C.; Hoehr, C.; Trinczek, M. Simulation and measurements of collimator effects in proton and neutron radiation testing for single event effects. IEEE Trans. Nucl. Sci. 2020, 67, 161. [Google Scholar] [CrossRef]
  20. Blackmore, E. Development of a Large Area Neutron Beam for System Testing at TRIUMF. In Radiation Effects Data Workshop; Stitute of Electrical and Electronics Engineers: Montreal, QC, Canada, 2009; pp. 157–160. [Google Scholar]
  21. Li, K.; Jahangiri, P.; Zacchia, N.; Uittenbosch, T.; Buckley, K.; Martinez, D.M.; Hoehr, C. Modular design for a liquid target. AIP Conf. Proc. 2017, 1845, 020013. [Google Scholar]
  22. Ziegler, J.; Ziegler, M.; Biersack, J. SRIM—The stopping and range of ions in matter (2010). Nucl. Instrum. Methods Phys. Res. B 2010, 268, 1818–1823. [Google Scholar] [CrossRef] [Green Version]
  23. For general information see www.fibos.ca.
Figure 1. Fiber Bragg Grating (FBG) operating principle. For details, see text.
Applsci 10 04610 g001
Figure 2. (a) TRIUMF experimental setup. FBG test specimen at left of image with proton beam line proceeding from right to left. (b) Example of UV, FS and RAD grating specimens mounted on plastic placard.
Applsci 10 04610 g002
Figure 3. Diagram of custom FBG-based temperature probe and pressure transducer developed for isotope production experiments.
Applsci 10 04610 g003
Figure 4. Collected spectra of specimen RAD03 from test Set 3 illustrating the reflection power of the FBGs vs. dose. The “characteristic FBG wavelength” denotes the central wavelength of the narrow passband feature at 1550 nm that is always present in the spectra of π--FBGs. The resolution of the Optical Gauge Amplifier (OGA) is 0.01 pm.
Applsci 10 04610 g004
Figure 5. Radiation Induced Wavelength Shift as observed for test specimens exposed to proton radiation in tests Set 3–7. Left-side y axis lists Radiation Induced Shift (RIS) measured in nanometers as measured by the OGA. The approximate temperature shift that would be equivalent to the observed RIS if the FBGs were reacting only to a change in temperature is approximately 1 °C for a wavelength shift of 0.01 nm. The dotted lines denote the OGA measuring uncertainty.
Applsci 10 04610 g005
Figure 6. Results from the first isotope production experiment illustrating the results of an irradiation of naturally abundant purified water. The black curve shows the proton beam current. The red curve represents the readings of the reference pressure transducer attached to the target body. The green curve shows the readings of the Fibos FBG-based pressure transducer. The blue curve illustrates the readings of the Fibos FBG-based temperature probe in contact with the target body wall. The unit of the individual signals is listed in the legend.
Applsci 10 04610 g006
Figure 7. Results from the second isotope production experiment illustrating the results of an irradiation of naturally abundant water. The black curve shows the set point proton beam current. The red curve represents the readings of the reference pressure transducer attached to the target body. The green curve illustrates the readings of the Fibos FBG-based pressure transducer. The blue curve shows the readings of the Fibos FBG-based temperature probe which was inserted 11 mm into the water without touching the opposite wall of the target body. The unit of the individual signals is listed in the legend.
Applsci 10 04610 g007
Figure 8. FBG-based temperature probe inserted in the target body after irradiation in an empty target cavity. The damaged tip can be seen in the center of the target.
Applsci 10 04610 g008
Table 1. Proton and neutron irradiation experiments.
SetRadiationEnergy [MeV]Dose Steps [Gy]Flux [mGy/s]
1None (control)000
2Neutrons0–4001, 5, 10, 20, 35, 60fixed
3Protons95, 10, 60100, 500, 1000
4Protons13.55, 10, 60100, 500, 1000
5Protons205, 10, 60100, 500, 1000
6Protons355, 10, 60100, 500, 1000
7Protons645, 10, 60100, 500, 1000

