Article

A Smartphone-Based Cell Segmentation to Support Nasal Cytology

1
Department of Computer Science, University of Bari, 70125 Bari, Italy
2
Department of Computer Science, University of Torino, 10124 Torino, Italy
3
Department of Computer Science, University of Pisa, 56127 Pisa, Italy
*
Author to whom correspondence should be addressed.
Appl. Sci. 2020, 10(13), 4567; https://doi.org/10.3390/app10134567
Submission received: 24 May 2020 / Revised: 24 June 2020 / Accepted: 29 June 2020 / Published: 30 June 2020
(This article belongs to the Special Issue Advances in Image Processing, Analysis and Recognition Technology)

Abstract

:
Rhinology studies the anatomy, physiology, and diseases affecting the nasal region—one of the most modern techniques to diagnose these diseases is nasal cytology, which involves microscopic analysis of the cells contained in the nasal mucosa. The standard clinical protocol regulates the compilation of the rhino-cytogram by observing, for each slide, at least 50 fields under an optical microscope to evaluate the cell population and search for cells important for diagnosis. The time and effort required for the specialist to analyze a slide are significant. In this paper, we present a smartphones-based system to support cell segmentation on images acquired directly from the microscope. Then, the specialist can analyze the cells and the other elements extracted directly or, alternatively, he can send them to Rhino-cyt, a server system recently presented in the literature, that also performs the automatic cell classification, giving back the final rhinocytogram. This way he significantly reduces the time for diagnosing. The system crops cells with sensitivity = 0.96, which is satisfactory because it shows that cells are not overlooked as false negatives are few, and therefore largely sufficient to support the specialist effectively. The use of traditional image processing techniques to preprocess the images also makes the process sustainable from the computational point of view for medium–low end architectures and is battery-efficient on a mobile phone.

1. Introduction

Thanks to the numerous studies in the field of computer vision applied to the medical and biomedical field, we now have many additional tools to support specialists in their tasks [1,2,3,4,5]. Modern technologies have improved the acquisition, transmission, and analysis of digital images. A growing benefit is also provided thanks to the spread of fast network connections for smartphones, allowing for the exchange of large amounts of clinical data also useful for remote diagnosis or follow-up [6,7,8].
Segmentation and contour extraction are important steps towards the analysis of digital images in the medical field, where such images are routinely used in a multitude of different applications [9]. Segmentation algorithms, based on structural analysis, continue to be used, often as an ensemble of segmentation techniques, especially in critical applications, such as lesion localization [10,11]. Other approaches, based on biased normalized cuts or light techniques, are also devised [12,13]. Many studies have also been conducted in the segmentation and classification of cells from digital images. Almost all studies are in the field of hematology. An interesting study into the classification of white blood cells (WBCs) is reported in [14]. In some studies, only segmentation aspects are discussed [15,16], while a neural network-based classifier of cytotypes in the hematological smear of a healthy subject was described in [17]: starting from digital scans of hematological preparations, it showed over 95% accuracy. Many other papers report interesting results about this last theme [18,19,20].
One of the fields that can benefit from the above technologies is nasal cytology, a branch of otolaryngology, which is gaining increasing importance in the diagnosis of nasal diseases due to the simplicity of the diagnostic examination and its effectiveness. In fact, the global spread of the nasal diseases is significant: allergic rhinitis is estimated to affect 35% of the world’s population and the World Health Organization considers it a growing epidemic form as, in a few years, 50% of children may be allergic. Rhinosinusitis affects 4% of the world’s population, and nasal polyposis 5%. Non-allergic vasomotor rhinitis affects 15% of people [21].
To the best of our knowledge, to date, there are no public or private laboratories that carry out the examination of the cell population of the nasal mucosa routinely, as instead it is done for hematological tests. This is for different reasons: firstly, because diagnostics based on nasal cytology have grown recently; secondly, because economic interest is still residual; finally, because the spectrum of diagnosable pathologies is not as extensive as in other fields of medicine. Typically, a rhinocytologist who wants to benefit from a cytological study must independently arrange a set of personal instruments, or, more frequently, carry out direct microscopic observation and manual cell counting using a special rhinocytogram.
Methods and techniques designed for hematology cannot be used directly for nasal cytology; for example, the WBC appear in almost all cases as isolated from each other, while nasal mucosa cells often appear amassed in the smear.
The first studies about the automatic extraction and classification of the cells of the nasal mucosa are reported in [22,23,24] where a diagnostic support system provides cell counting automatically—it uses segmentation algorithms to extract cells and a convolutional neural network to classify them. The sampling process and the diagnosis remain human activities, carried out by the specialist, but the whole time and effort are reduced considerably, letting the accuracy of the diagnoses remain unchanged or even be improved. To the best of our knowledge, there are no further contributions in the literature.
The further request of the stakeholders is to considerably reduce the cost of the analysis and of the instrumentation with the aim of increasing the capillarity of the analysis itself. Therefore, the challenge we have been given is to carry out the entire evaluation of the cell population on a mass device, such as a smartphone, fully automatically (as shown in Appendix A). Devices with limited resources will interact with the surrounding environment and users. Many of these devices will be based on machine learning models to decode meaning and the behavior behind sensors’ data, to implement accurate predictions and make decisions [25]. Several research papers have focused on the possibility of bringing artificial intelligence to devices with limited resources and there have been efforts in decreasing the model’s inference time on the device. Machine learning developers focus on designing models with a reduced number of parameters in the Deep Neural Network model, thus reducing memory and execution latency, while aiming to preserve accuracy, as far as possible. It is evident that, at the moment, there are several problems to overcome, first among which is the limitation of the computational capacity of mobile architectures [26,27,28,29,30,31,32,33,34].
In this paper a novel system based on a smartphone is presented to support rhinocytologists during cell observation. It carries out cell extraction from the digital image of the microscopic fields. Once this is done, the specialist can independently evaluate the segmented cells or send them to the Rhino-cyt platform [2], which will also perform the fully automatic classification, giving back the final rhinocytogram. This way he significantly reduces the time for diagnosis.

2. Rhino-Cytology

Nasal cytology is a very useful diagnostic method in rhino-allergology—it allows for the detection of cellular variations of an epithelium exposed to acute/chronic irritations or inflammations of different nature and makes it possible to diagnose some nasal pathologies [35,36]. The strengths of this methodology lie in the simplicity of the diagnostic examination; in fact, it is totally painless, safe, and fast, as it can be conducted in an outpatient clinic. Starting from the assumption that the nasal mucosa of the healthy individual consists normally of only four cytotypes, cytological diagnostics is based on a fundamental axiom that states that, if other cells, such as eosinophils, mastcells, bacteria, spores, and fungal hyphae, are present in the rhinocytogram, then the individual can be affected by a nasal pathology. A quantitative analysis of the pathological cells contained in the nasal mucosa and their state of rest or activation allows for the indication of a targeted therapy to the patient [37].

2.1. A. The Cytodiagnostic Technique

The diagnostic examination is accomplished through the following three main phases:
  • Sampling: Consists of collecting a sample of nasal mucosa containing the superficial cells. It is carried out using a disposable plastic curette, called nasal scraping, or a simple nasal swab is preferred for smaller patients;
  • Processing: The material collected is placed on a slide and dried in the open air. Then, the slide is stained using the May Grunwald–Giemsa method, which provides the cells with the classic purple staining and highlights all the cytotypes present in the nasal mucosa. Usually, the complete staining procedure takes about 20–30 s with rapid staining techniques;
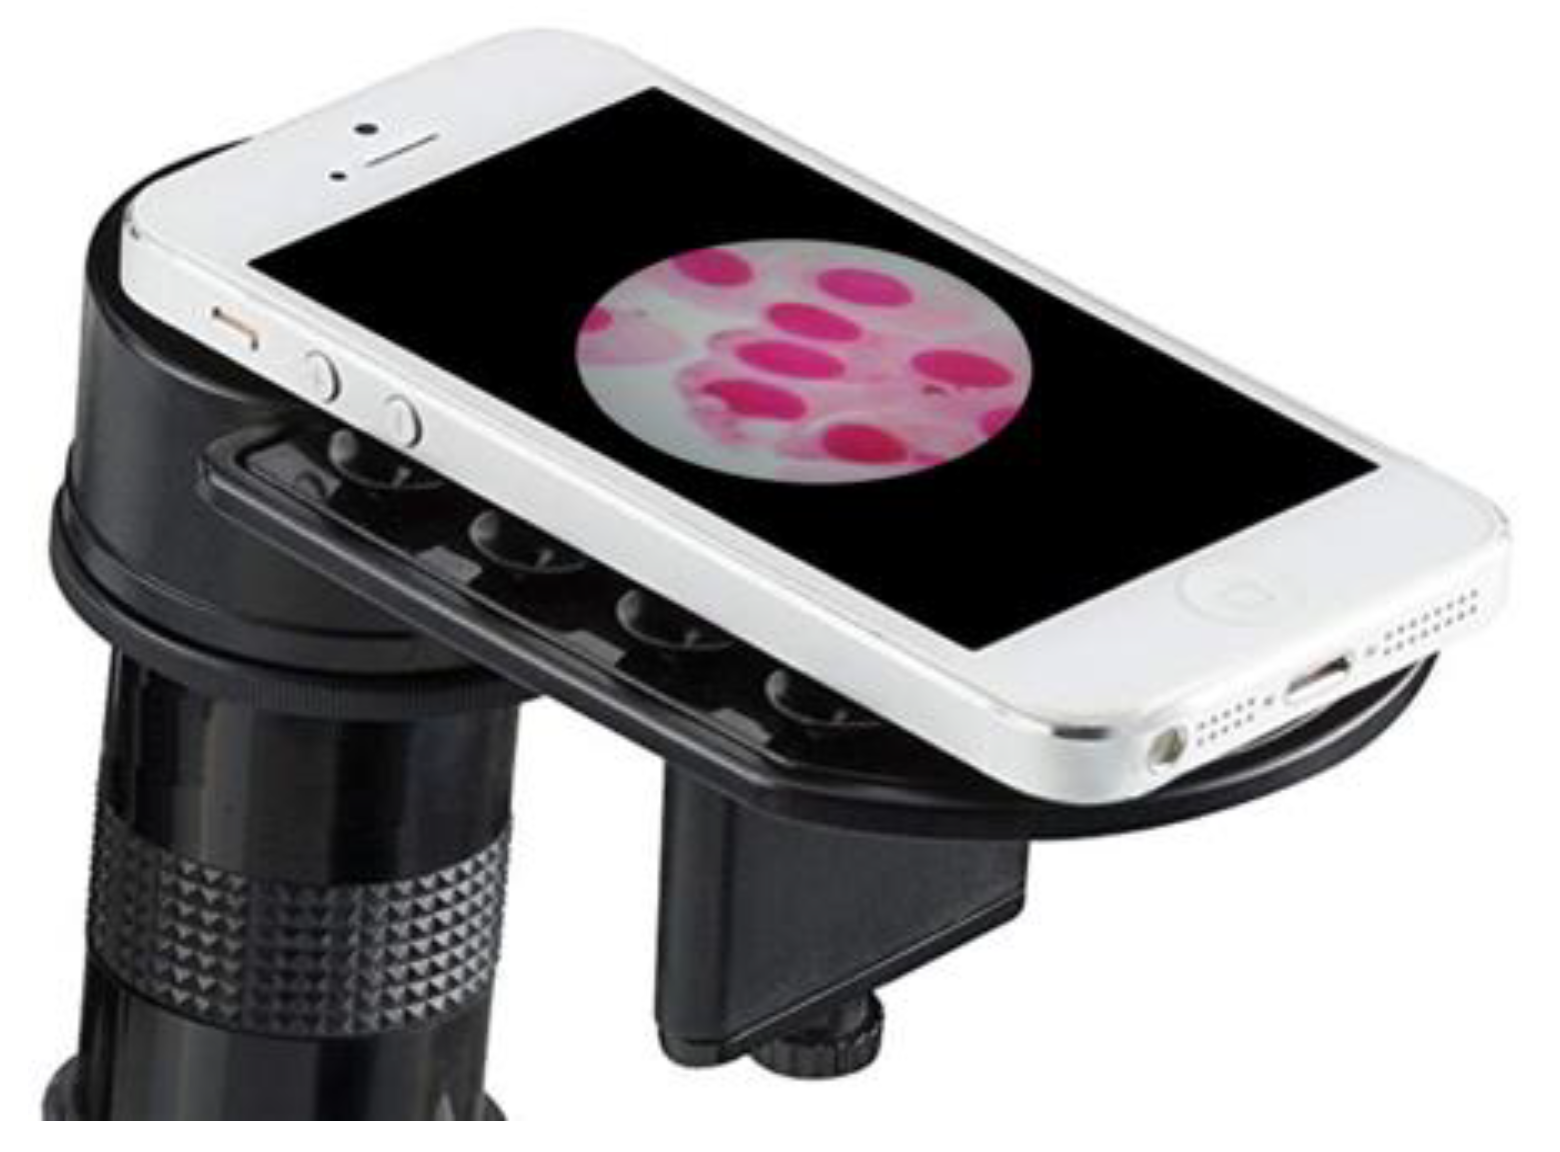
  • Microscopic observation: An optical microscope is used, mainly connected to a special camera to view the cells on a monitor. The diagnostic protocol involves viewing and analyzing 50 digital images for each slide, called fields, usually at 1000X magnification.
The cell count allows a diagnosis to be made simply by counting the cells present in the 50 analyzed fields. This process allows the specialists to draw up a diagnostic report.

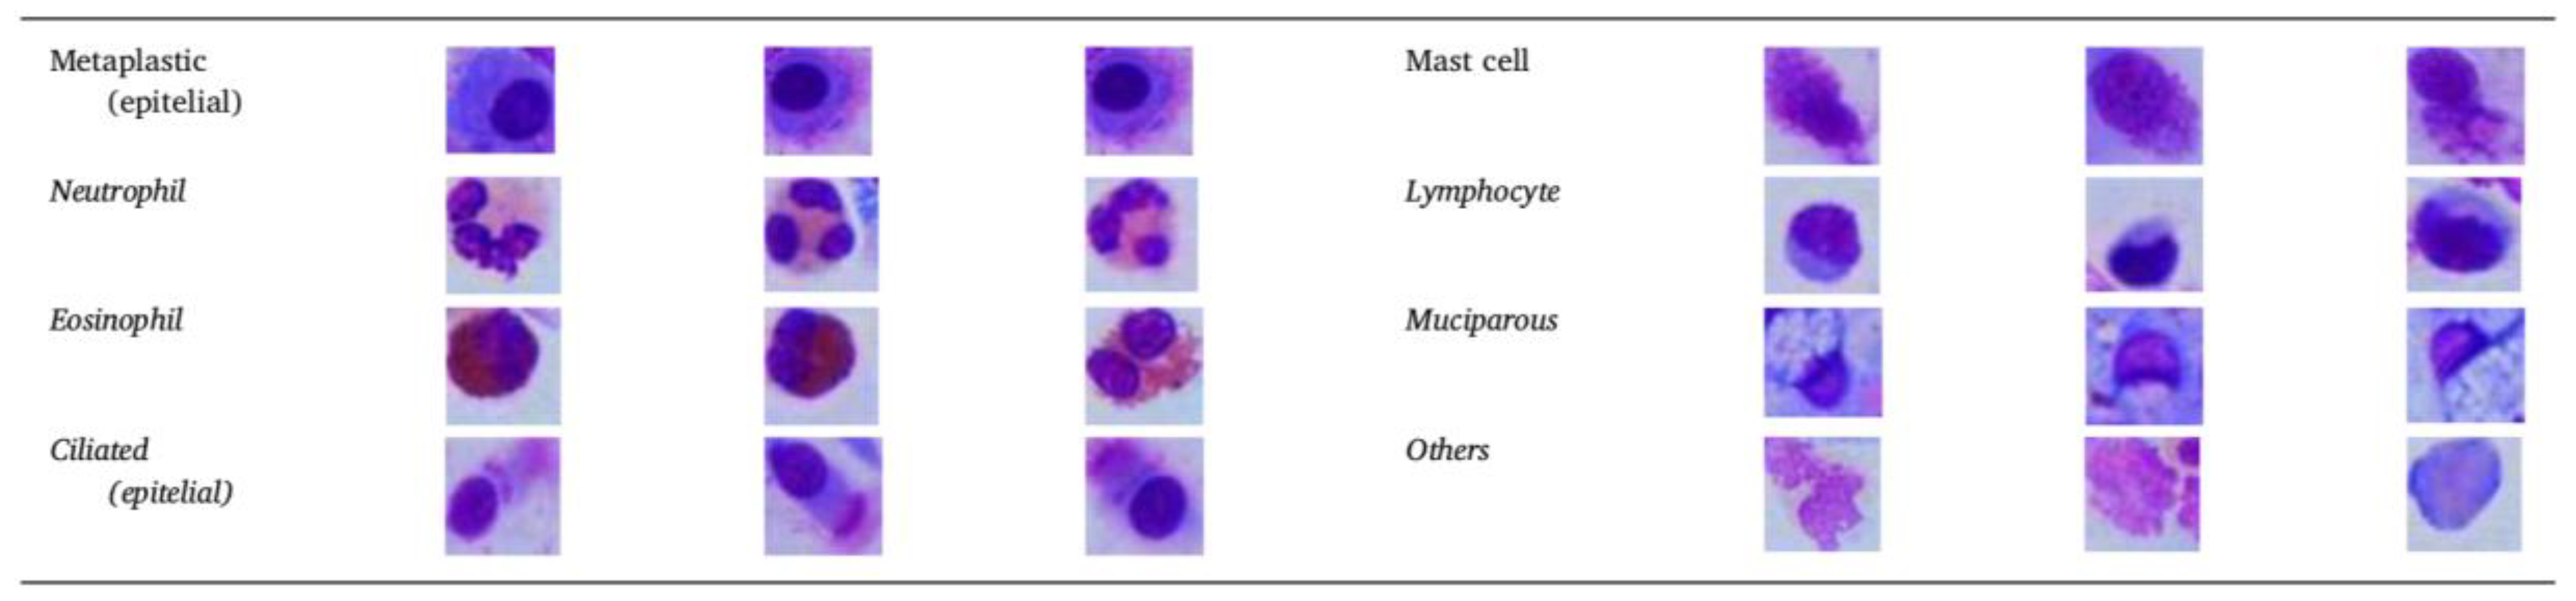
2.2. B. Types of Cells Involved

Different types of cells are considered in the diagnosis of nasal diseases. Considering the diversity of the cells present in the nasal mucosa, it is, therefore, appropriate to draw up a classification of the different cytotypes present both in a healthy individual and in an individual with a pathology. The nasal mucosa cells belonging to a cytotype show some elements with high similarity; however, each cytotype appears quite different from all the others. These features allow their automatic classification [23]. A brief description of the appearance of each of the cells located in the nasal mucosa is reported below, and corresponding sample images are shown in Figure 1:
Ciliated: Among the most common cytotypes of the nasal mucosa are ciliated cells. They have a polygonal shape and a nucleus situated at various heights from the basement membrane. The apical region, the seat of the ciliary apparatus, is recognized as a well-represented body that includes a large part of the cytoplasm and the nucleus;
Muciparous (goblet cells): The muciparous cell is in the shape of a cup and is a unicellular gland. The nucleus is always situated in the basal position (the strengthener of the nuclear chromatin is typical) while the vacuoles, containing mucinous granules, are located above the nucleus, giving the mature cell its characteristic chalice shape;
Neutrophil: characterized by a polylobate nucleus, whose lobes are joined by very thin strands of nuclear material within the cytoplasm, which contains finely colored granules;
Eosinophil: usually has a bilobed nucleus and acidophilous granules that intensely stain with eosin (hence the name) as an orange-red color;
Mast cell: a granulocyte with an oval nucleus, covered in purple.
The nasal mucosa of a healthy individual normally contains ciliated, mucipara, striated, basal, and sporadic neutrophils cells. In the nasal epithelium, there can also be different types of inflammatory cells, where each of them can be a sign of a nasal pathology. They are known as immunophlogosis cells (eosinophils, mast cell, lymphocyte). Additionally, a significant presence of neutrophils is interesting—knowing the functions they perform helps motivate different therapeutic strategies [37]. Here, metaplastic cells have been merged into one class (epithelial) with ciliated cells because their nuclei are similar and this merging does not influence the diagnostic protocol.

3. Image Acquisition and Processing

Thanks to the large number of contexts in which digital image processing has been successfully in experimentation, its use has also increased in medicine that is becoming highly dependent on it and represents fundamental pillars of modern diagnosis [38,39,40,41,42].
The images of the smears used in this experimentation, supplied by the Policlinico di Bari, have been acquired with a Samsung Galaxy S6 Edge smartphone with a 16 Mpixel digital rear camera, with a photo resolution of 5312 × 2988 pixels and an aperture of F / 1.9. A specific smartphone adapter was also used, as shown in Figure 2. The system proposed here is based on image enhancement, segmentation, and morphological processing [43], which allows for the extraction of the cells present in the photo acquired by the smartphone camera and will be dealt with in this paper shortly.

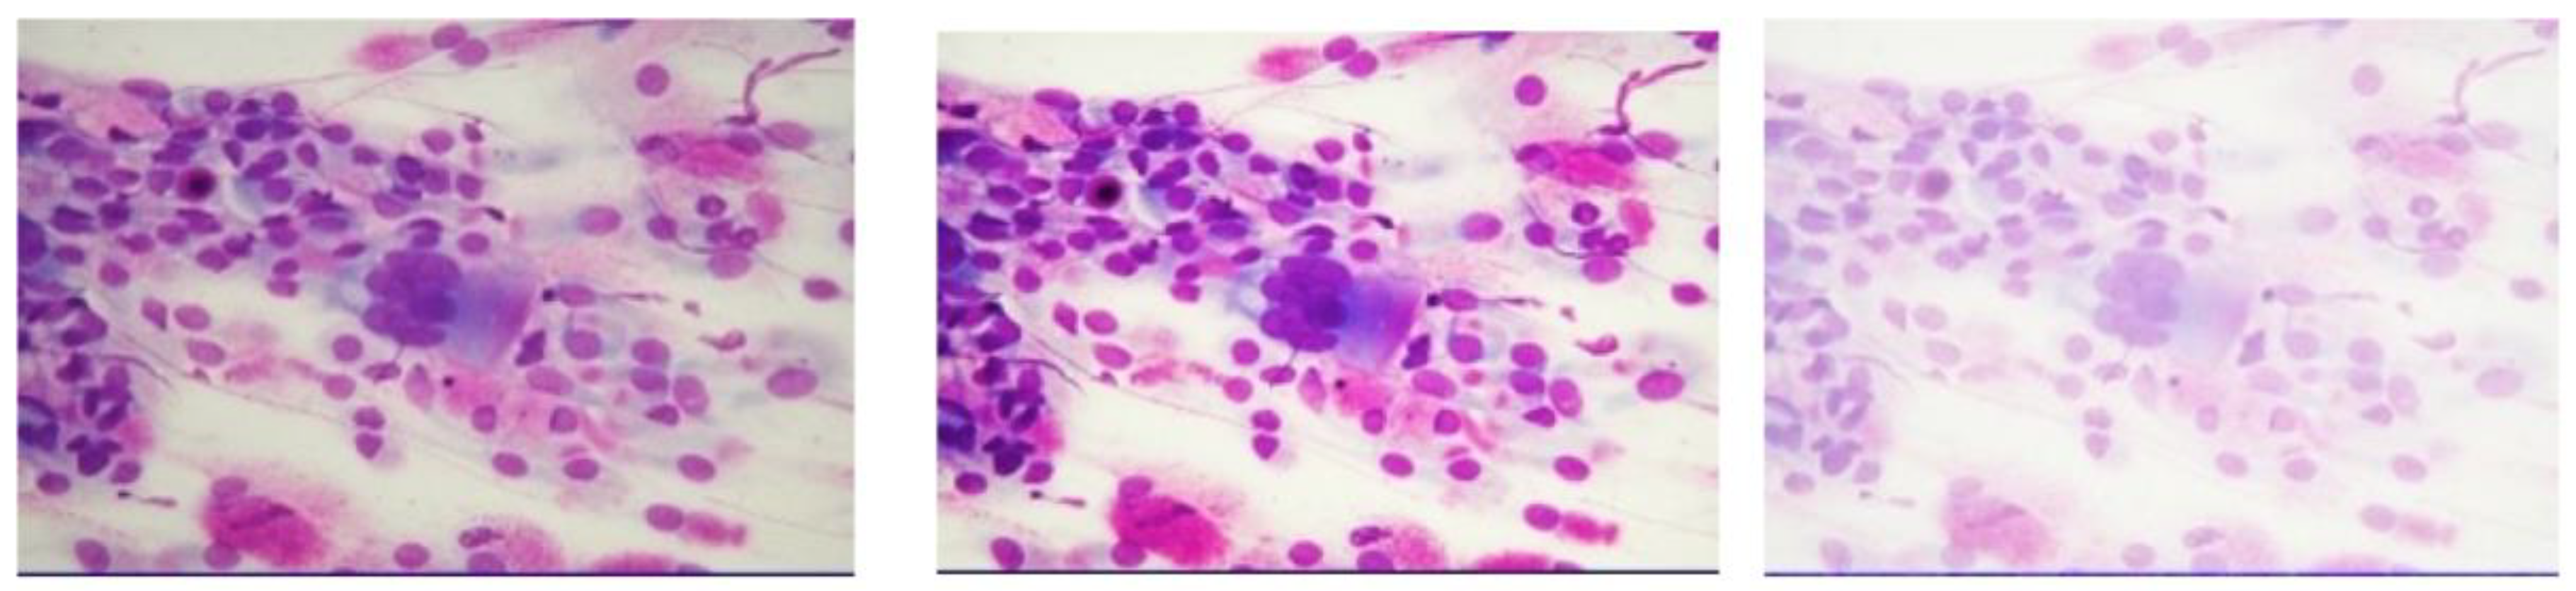
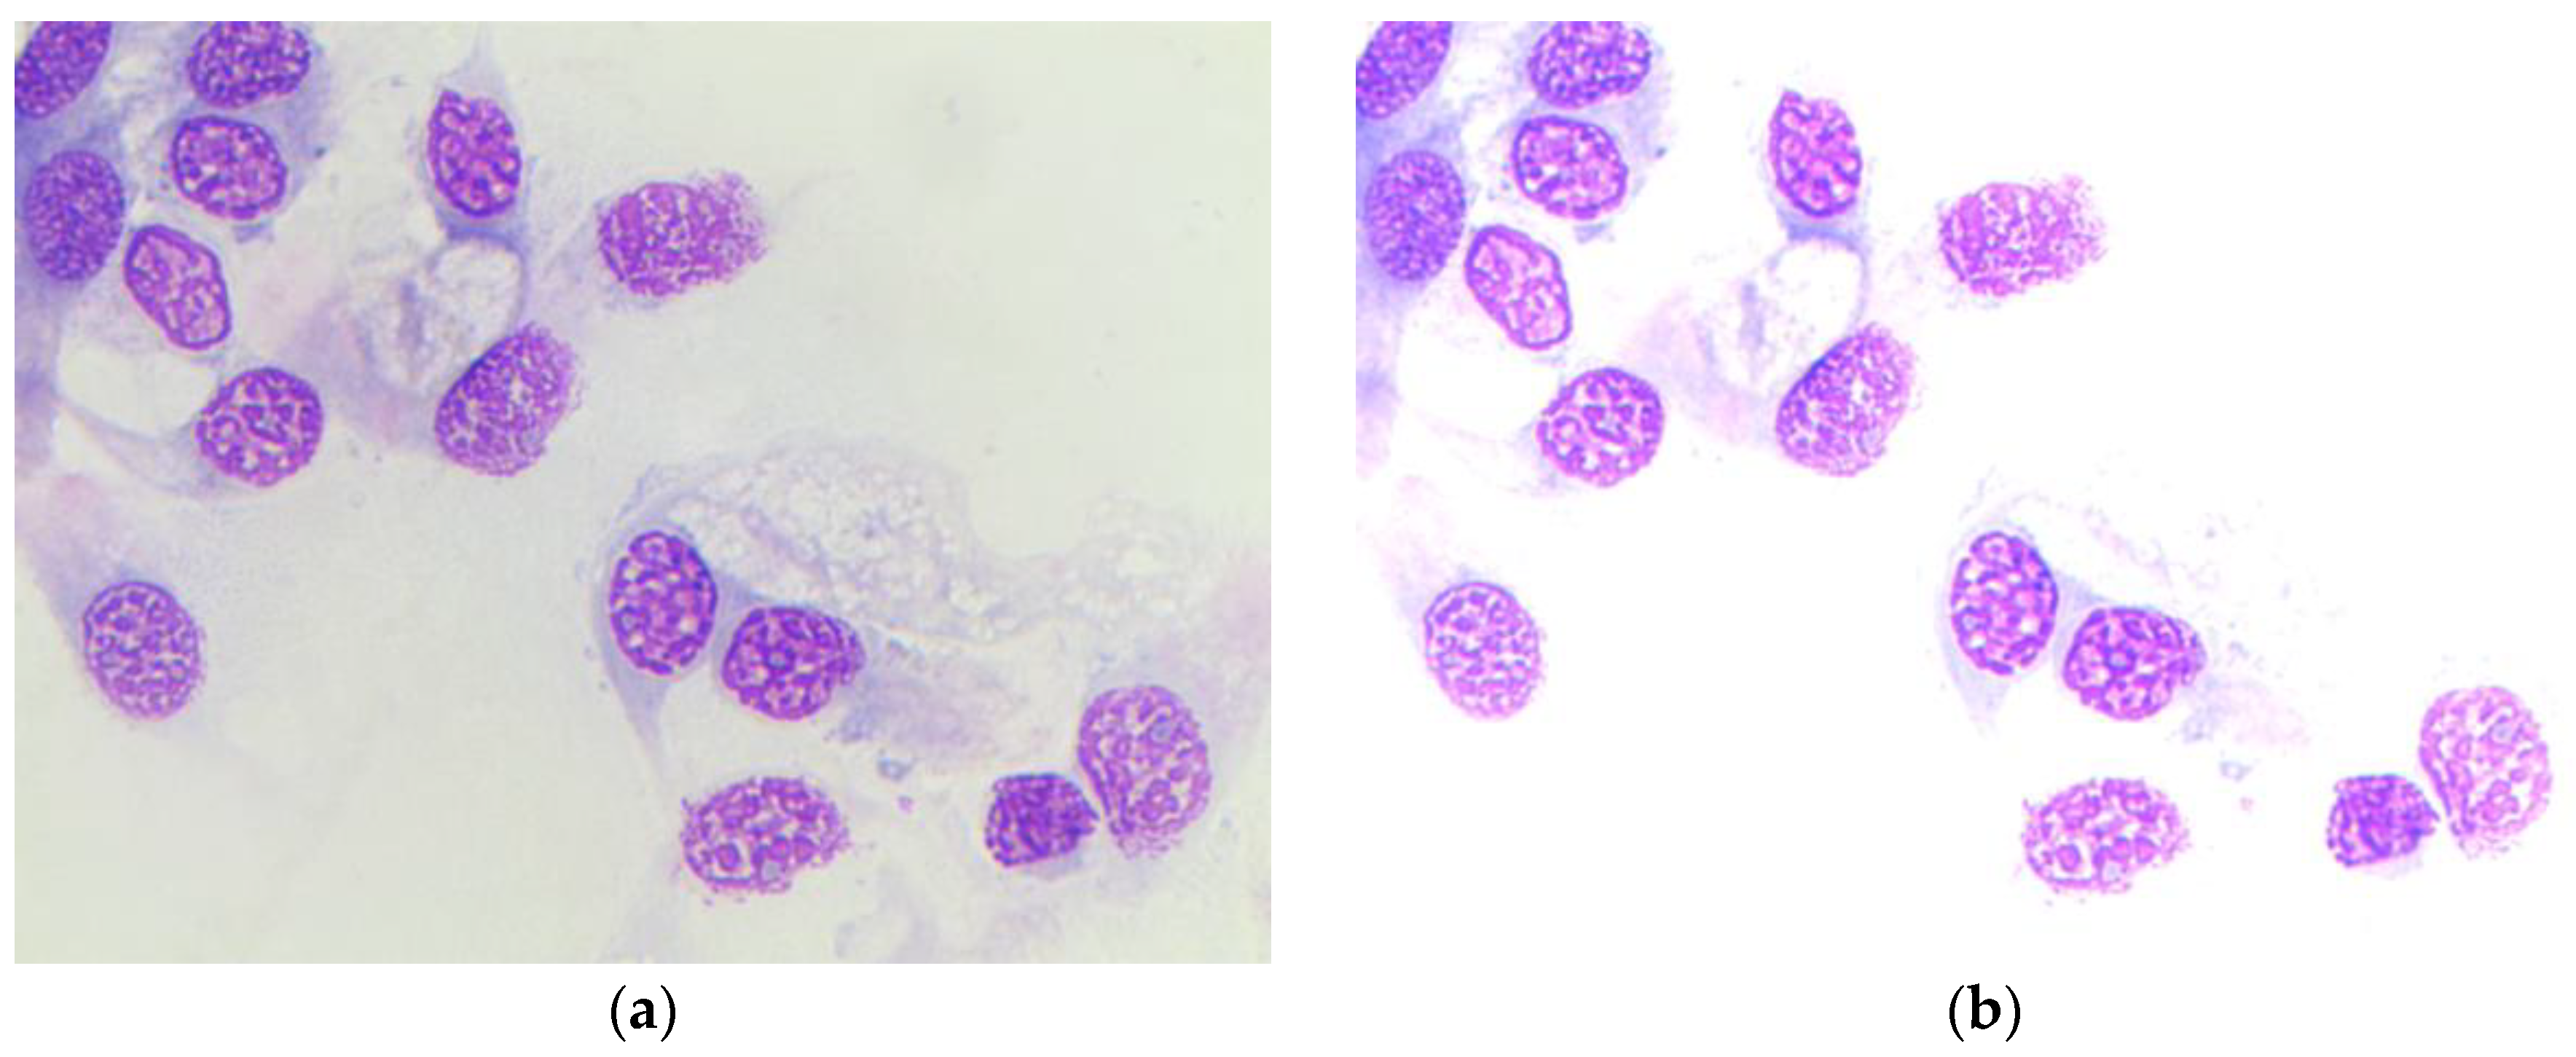
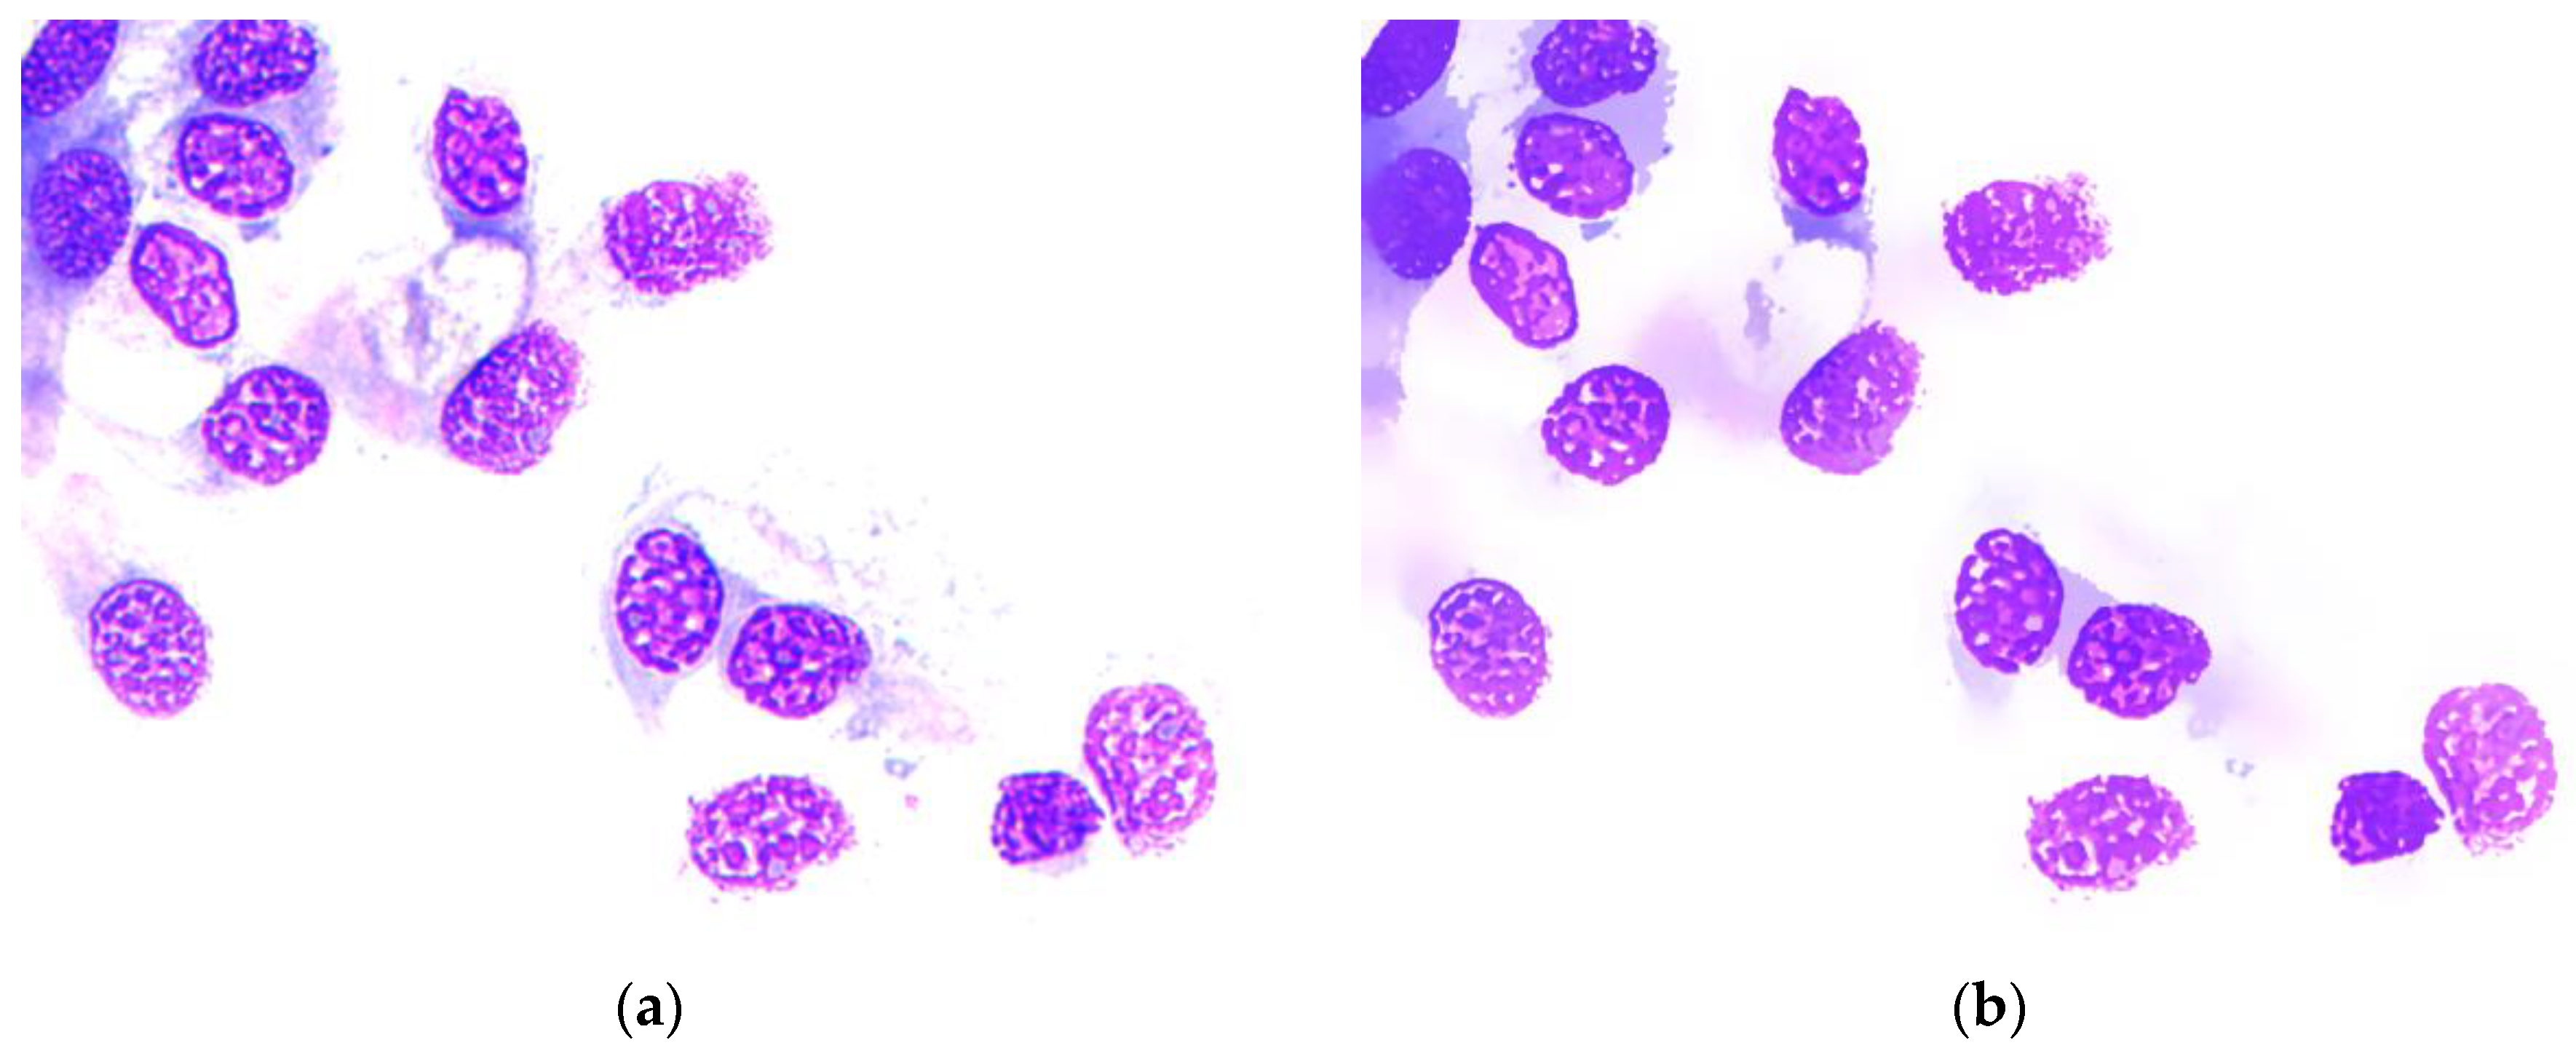
3.1. Image Enhancement

There are several definitions of image enhancement in the literature but the one that best fits the context states that this process allows for the improvement of the quality and information contained in an original image before it is processed [44,45,46]. The result of this pre-process represents an improved image that highlights some features more relevant than others both for the visual and automated systems, which otherwise would not be visible in the original image; therefore, an image will be easier to interpret in certain contexts.
Image enhancement involves several aspects of an image: those that will be dealt with in this work concern brightness (or luminance), contrast (the difference between the pixel of higher and lower intensity), and saturation.
In Figure 3, the effects of image enhancement techniques on an image of nasal cells with low brightness and contrast are evident. The central image appears sharper and this brings many advantages, as the cells appear more visible and highlighted due to the increased contrast. The image on the right is too bright and needs the so-called gamma correction.
Gamma correction hides brightness defects in an image using a non-linear function based on the following transformation:
o = ( I 255 ) Y 255
where the γ is called gamma and the I and O values indicate the input value of the pixel and the output value of the non-linear function, respectively. This correction is often used to manipulate contrast in medical images, especially to highlight specific characteristics in an image with low lighting and low contrast.

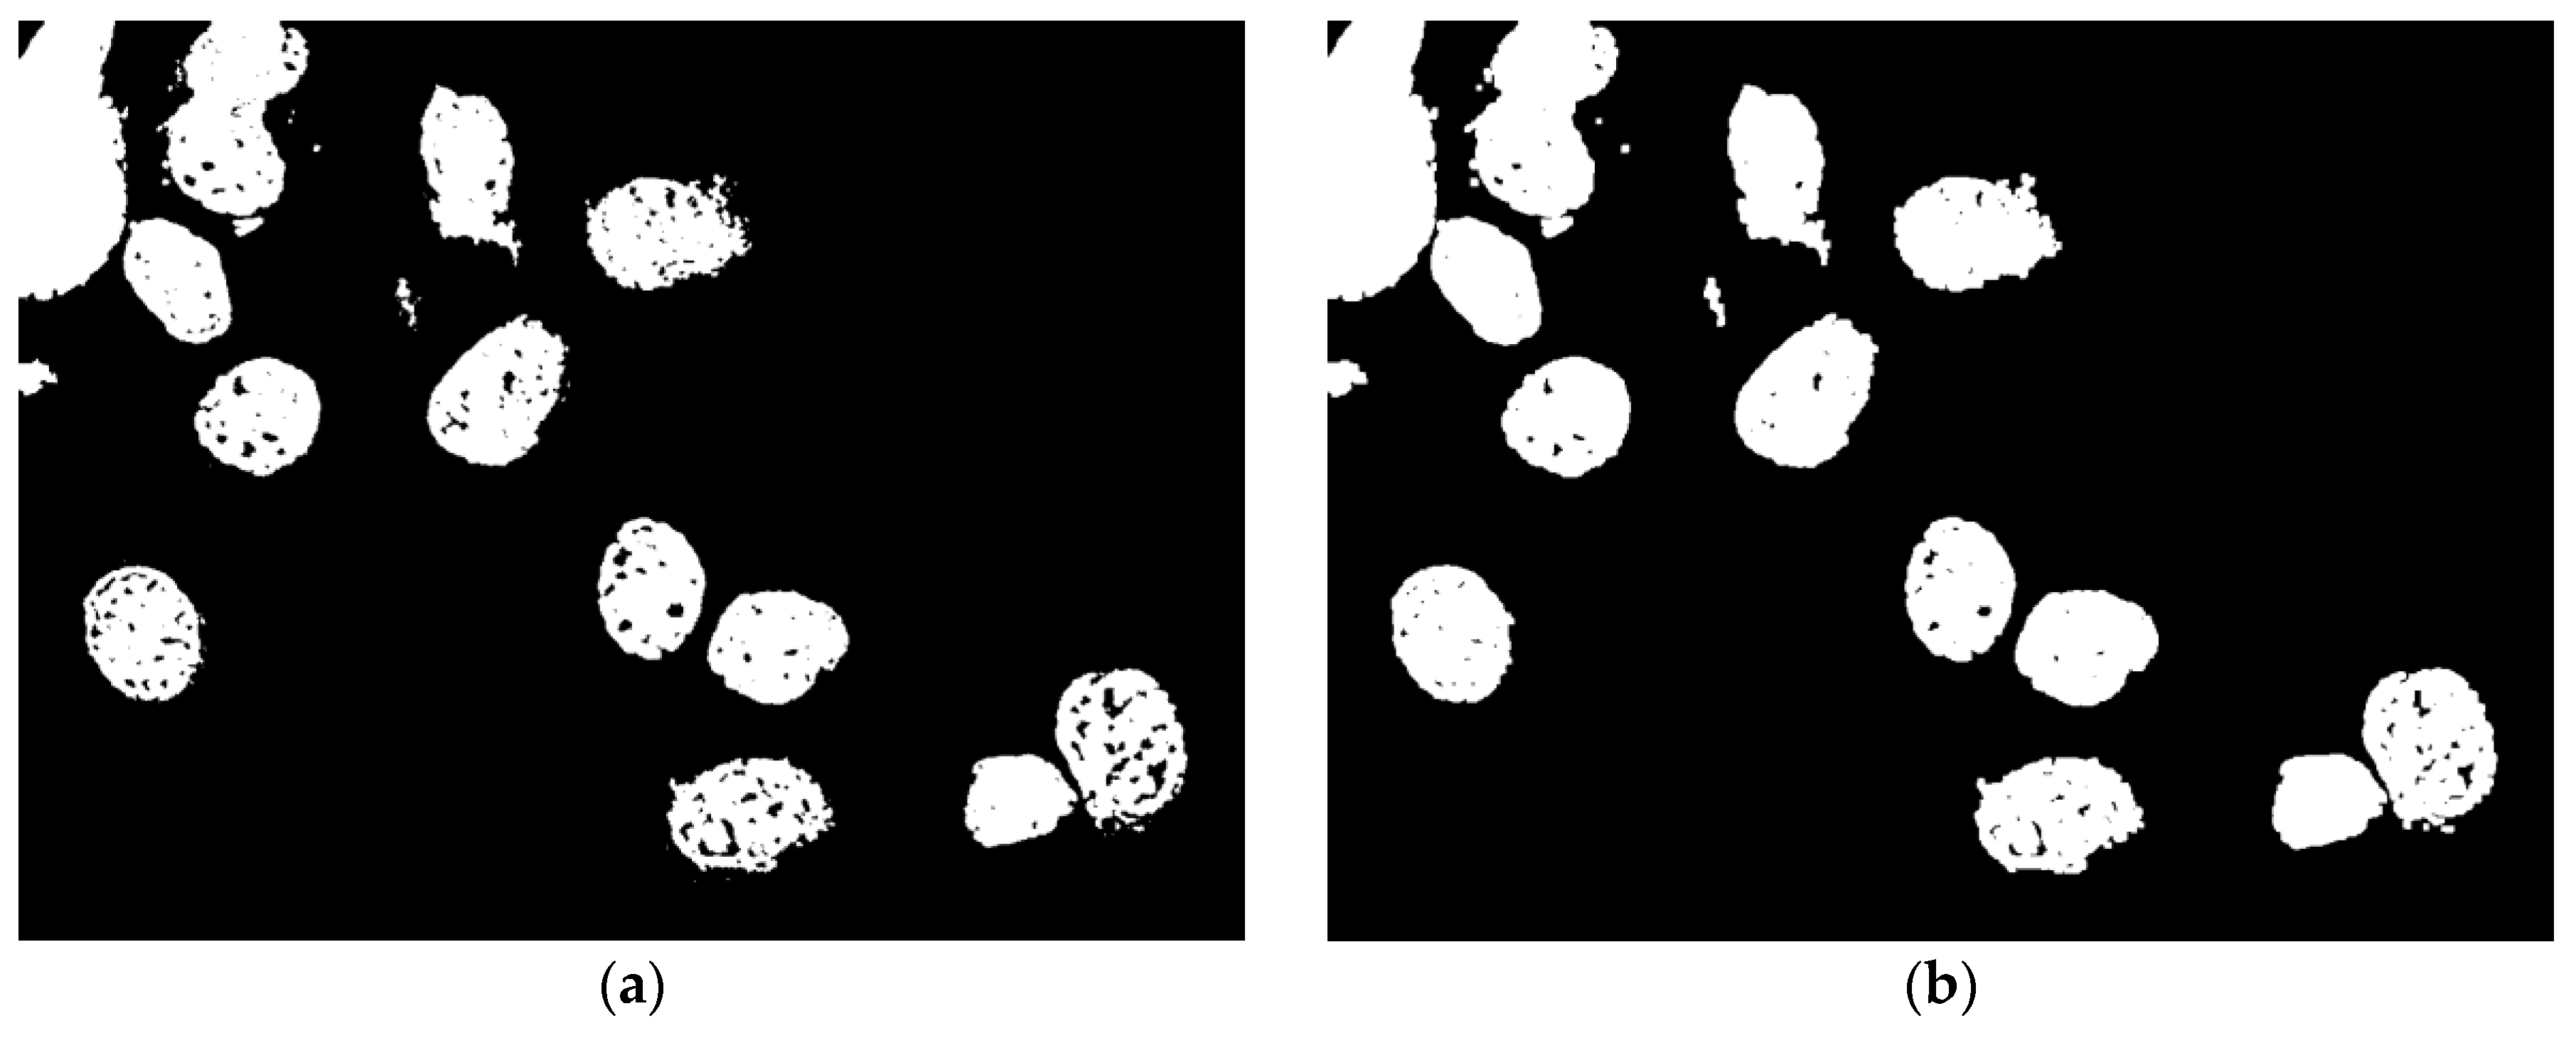
3.2. Image Segmentation

Image segmentation partitions a digital image into a finite number of different regions, where region means a set of interconnected pixels. A significant number of image segmentation techniques allow the partitioning of a digital image [12,47], some of which have been considered in this project.
Images from the whole smear were taken and analyzed, as explained above, in smaller regions, called fields. In terms of pixels, all fields have the same size. Many attempts were made to choose an optimal dimension of each digital image to speed up processing—ultimately, the fields were resized to 1024 × 768 pixels, which proved to be a fair compromise.
Cell extraction was essentially based on the chromatic characteristics of cells, especially nuclei. For example, neutrophils show a blue-violet core, eosinophils show pink granules, and lymphocytes show a very large nucleus of blue color. Mean Shift filtering makes an image with color gradients and fine-grain texture flattened. In order to set up the system to recognize images of slides prepared with different techniques in the future, experiments were conducted here using grayscale images for the segmentation phase based on the Otsu algorithm. Then, morphological operations and the watershed algorithm were applied, followed by labeling, marking the different “objects” with different shades of color to facilitate subsequent classification. The Canny algorithm was considered as an alternative in rare cases when watershed provides unsatisfying results (e.g., split cells). In these cases, giving the responsibility to the user to manually adjust thresholds, segmentation showed better results than watershed. Of course, this option is considered a marginal one.

3.2.1. Mean Shift

The unsupervised learning Mean Shift algorithm is based on clustering and is also applied to digital images [48,49,50,51]. This algorithm, transforms the digital image in Figure 4a, passing through surface construction, as shown in Figure 4b, and cluster detection, in a multidimensional space, as in Figure 4c, where the points represent all pixels assigned to a specific cluster.

3.2.2. Otsu Segmentation
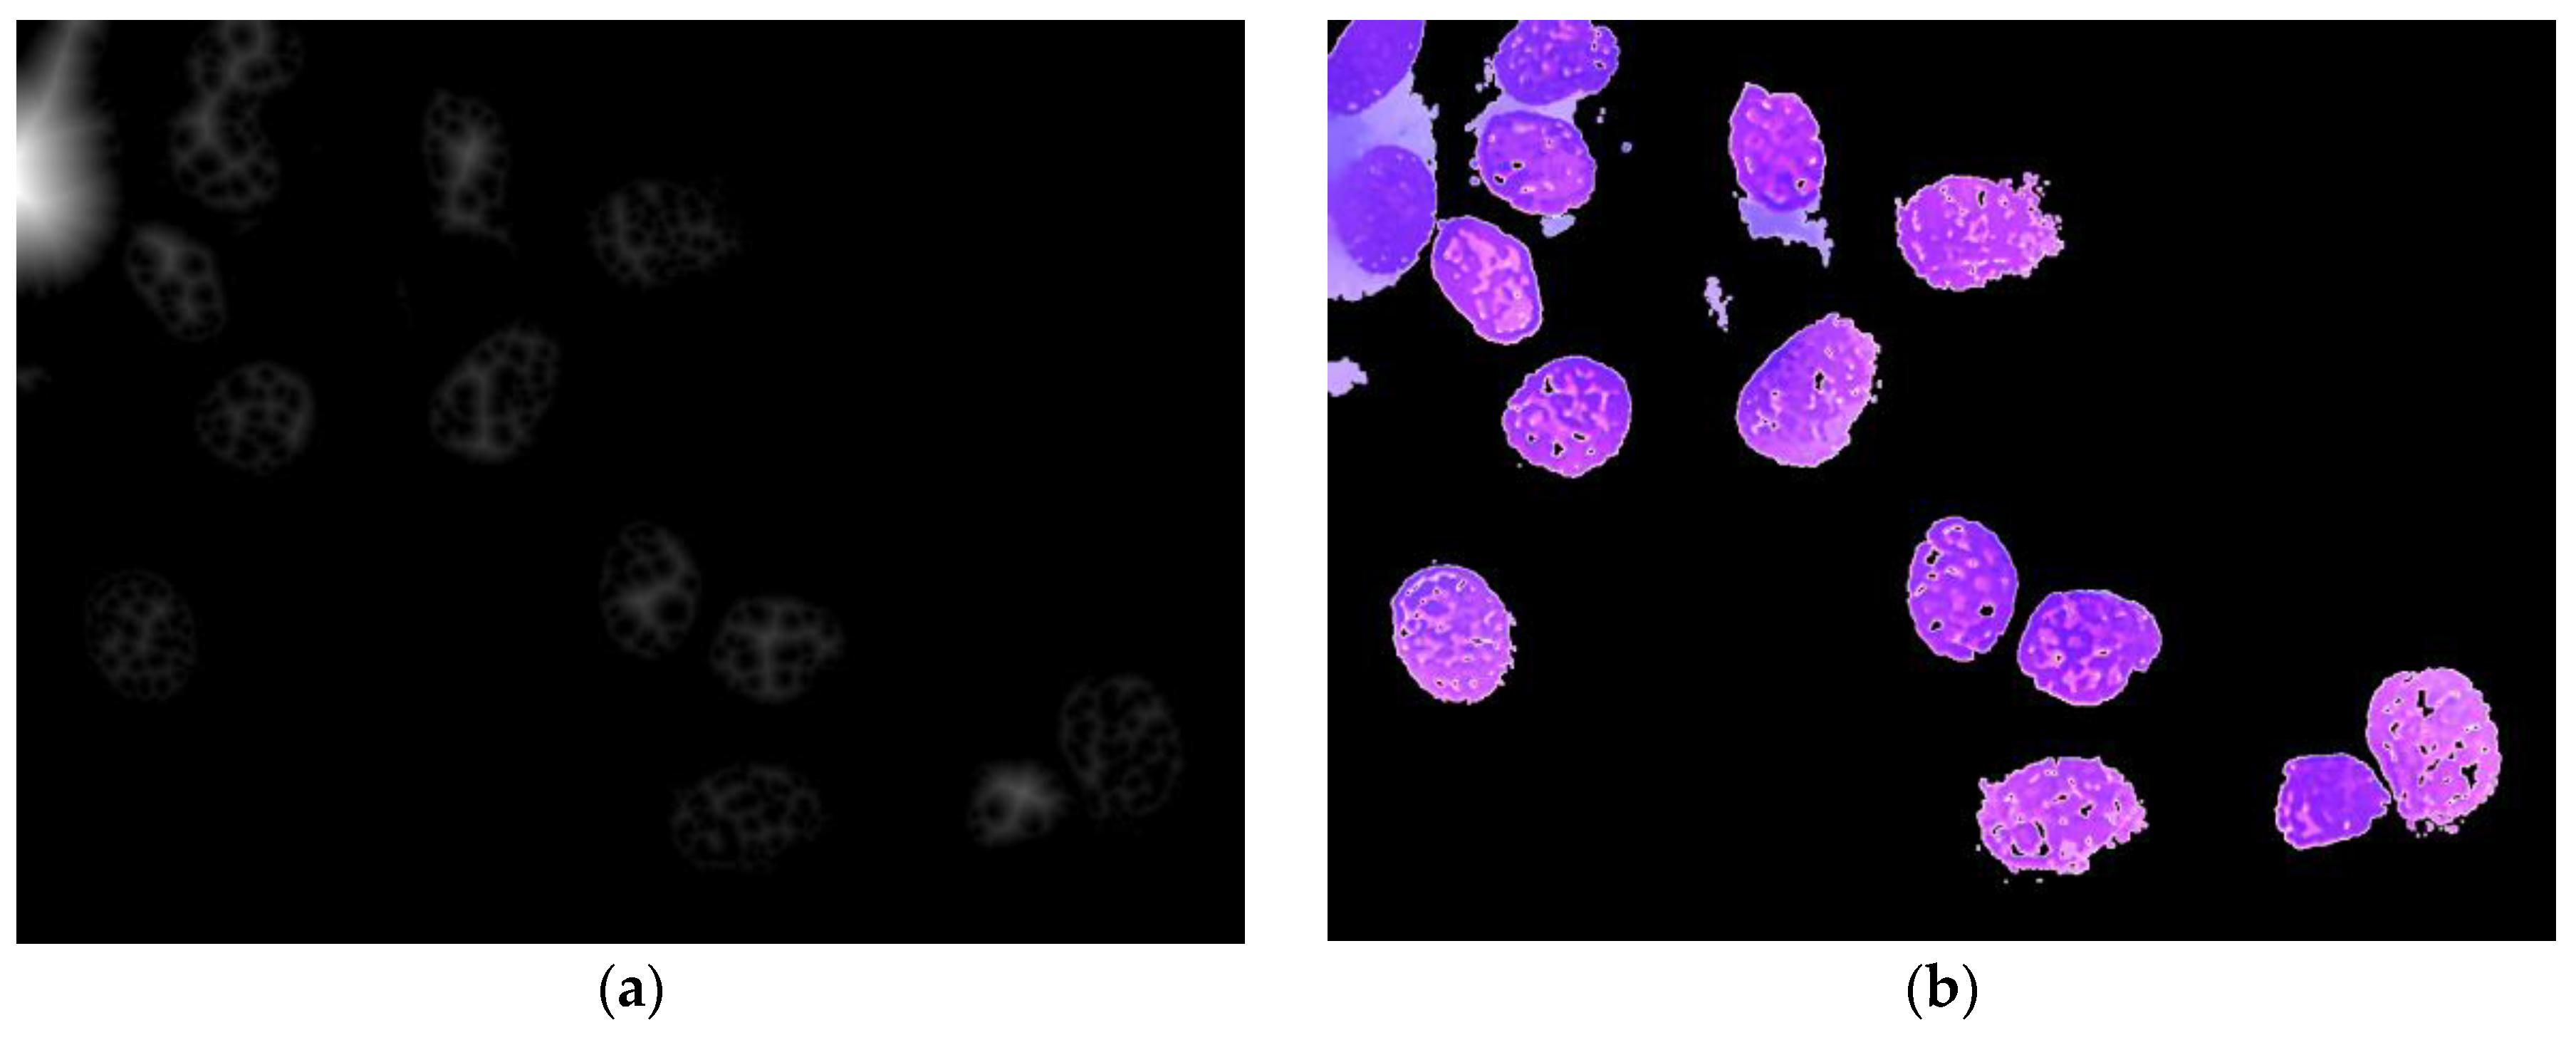
The Otsu method is a global threshold algorithm. The result obtained represents a binary image. To ensure optimal separation between background pixels and object pixels, and thus effective segmentation, it is necessary to maximize the inter-class variance [52].

3.2.3. Watershed

Watershed performs a digital image partitioning in different regions, especially when there are image elements that are very close to each other or even connected. The resulting image shows higher pixel intensities of each object in the center areas.

3.2.4. Canny Edge Detector

The Canny algorithm finds and recognizes the contours of objects. It takes five steps during which the grayscale input image undergoes several intermediate transformations. The result obtained represents a binary digital image with only the contours highlighted by strongly marked pixels [53,54].

3.3. Morphological Image Processing
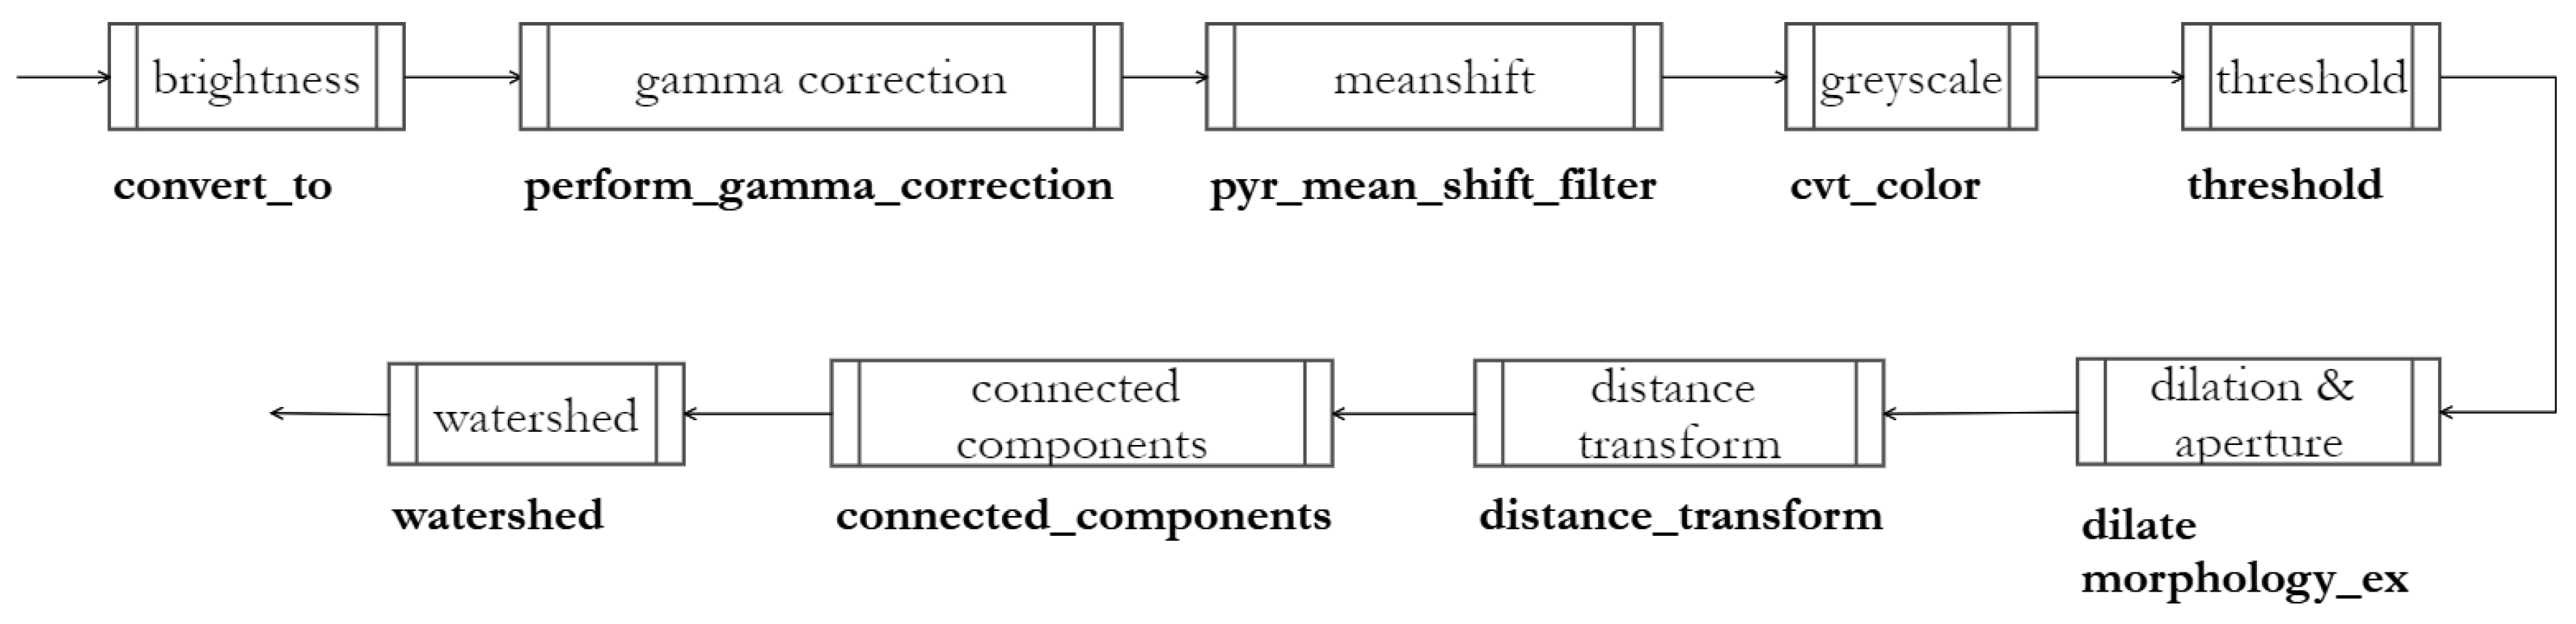
Morphological image processing alters the structure and geometric shape of an object and applies morphological operations to that portion of the image at each kernel position [55,56]. The morphological operation used in this work is dilation. It acts mainly near the contours of the cells by adding pixels and making it thicker. Expansion reduces and eliminates possible holes inside the cells, often due to binarization defects.

4. Methods

The software we have designed executes the image processing introduced above, allowing for the identification of cellular elements and their extraction from an RGB digital image, acquired with the smartphone camera. In particular, the following steps are applied.

4.1. Increase in Brightness and Contrast

A preliminary process of image enhancement improves the quality of the original image. In particular, both brightness and contrast are increased so as to reduce or eliminate the light color halos around the cells caused by the staining process of the cytodiagnostic examination, which would otherwise have compromised the detection process in the subsequent stages. The transformation applied to each RGB channel for each pixel (x,y) in the starting image is:
g ( x , y ) = α f ( x , y ) + β
where α and β are the so-called gain and bias, respectively, which are parameters that regulate brightness and contrast, as shown in Figure 5. They were empirically determined: α = 1.5e, β = 6.

4.2. Gamma and Mean Shift Correction

Image brightness is “gamma-corrected”, further increasing image contrast by making the color shades of the nuclei more saturated; moreover, the Mean Shift algorithm is applied to make the coloring of the cell nuclei more homogeneous, as shown in Figure 6.

4.3. Otsu Binarization

After grayscale conversion, segmentation is made with automatic threshold to separate cells, as shown in Figure 7. To improve image quality and correct any defects due to Otsu’s binarization, such as holes in cell nuclei, the process benefits from the use of aperture in combination with dilation.

4.4. Identification of Markers, Watershed

After marker identification (Euclidean Distance Transform and local maxima detection), the Watershed algorithm is applied, as shown in Figure 8. To improve the performance of the Watershed algorithm, the bandwidth h was defined by studying the range of variation of the cell size by means of a micrometer, a high precision gauge with a typical sensitivity of a hundredth of a millimeter.

4.5. Cropping

The final step of the proposed system carries on ROI detection basing on their area, in order to reduce non-cell regions that can be improperly highlighted. In fact, only regions that have an area included in a specific range (a1, a2) are extracted; range values depend on the image resolution. As explained above, we resized the original images to 1024 × 768 pixels and then determined the range experimentally, setting a1 = 80 and a2 = 250. Examples of the cropped cells after applying this operation are given in Figure 9. Figure 10 shows images of the designed app, and in Figure 11 the software pipeline related to cell extraction is reported.

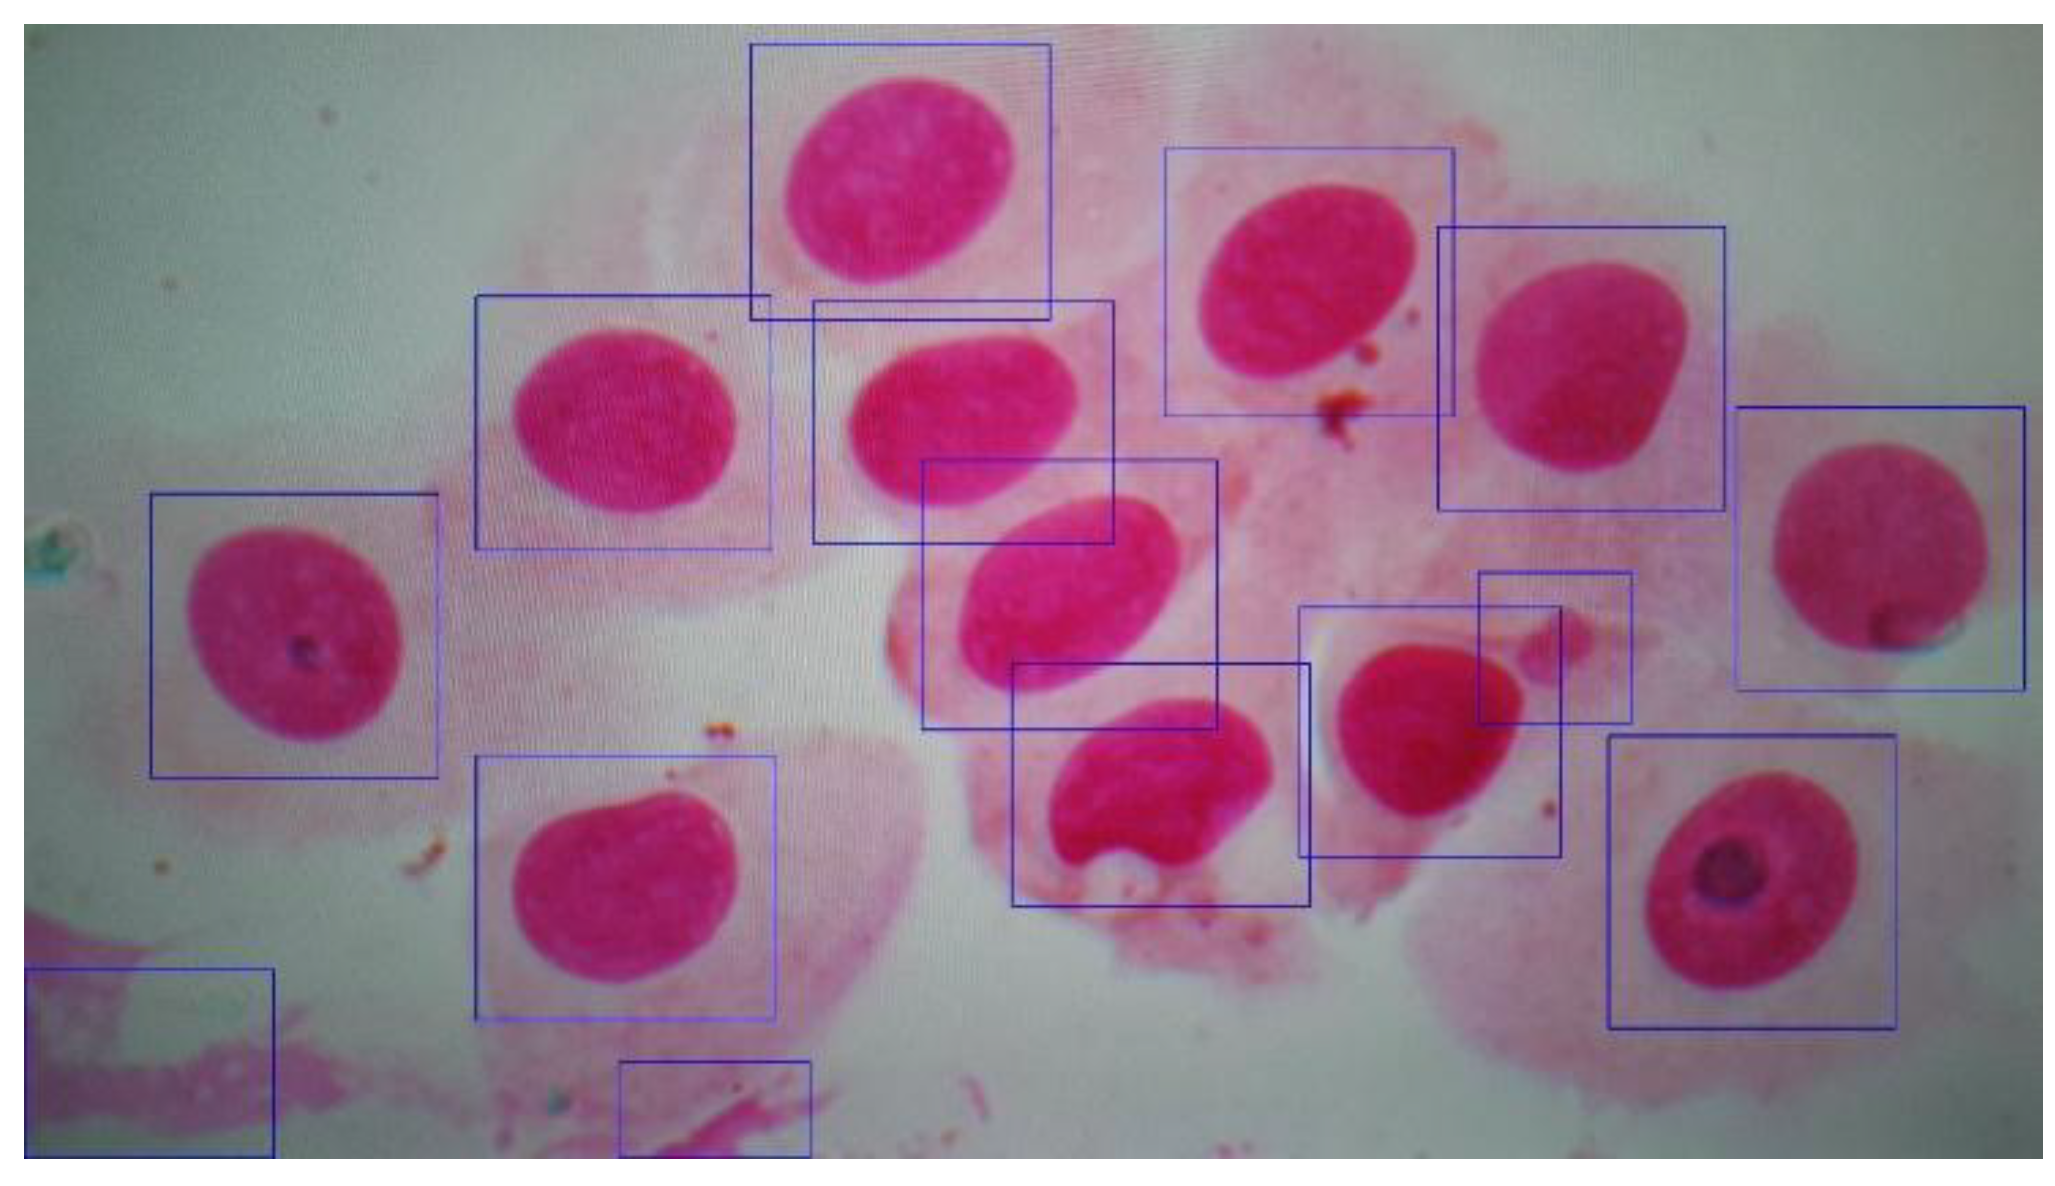
5. Experimental Results

The cell extractor here described has been tested on 75 digital images representing fields, first performing a standard cell observation and manual counting for each field, and then taking into consideration the cells detected through the system proposed in this paper.
In Figure 12 a qualitative example of the working system for one of the 75 images is reported. The result in terms of the detected cells is shown with a blue bounding box around the segmented objects. The performance of this system is reported in Table 1—all cells and non-cells on the 75 slides were also manually labeled by domain experts, to obtain the ground truth.
With reference to Table 1, TP represents cells correctly extracted, FN lost cells, FP non-cells improperly extracted, and TN non-cells discarded.
Starting from these assumptions, the system performances are summarized here:
Accuracy0.860
Sensitivity (Recall)0.959
Specificity0.405
Precision0.881
F-score0.918
The measure that must mainly be taken into consideration is certainly sensitivity, which quantifies the avoidance of false negatives. The value 0.96 is satisfactory because it shows that actual positives are not overlooked, as false negatives are few. The FN detected refer, for the vast majority, to heavily-massed cells that the same experts do not consider during the observation. In fact, the manual protocol defined by the experts is tolerant of the typical presence of clusters and specifies that at least 50 fields must be taken into account, increasing them during the observation if they find the excessive presence of clusters or almost empty fields. All of this takes significant effort. In reference to this, and also with the system we have designed, the specialist can increase the number of fields to be acquired and analyzed, proving to be flexible. Even the number of false positives does not worry us because the cells and the other “objects” extracted are classified manually or through the Rhino-cyt platform, which discards the FP with great accuracy.
A final remark should be given about the execution time. Time to process a set of 50 fields manually may exceed half an hour or more. It depends largely on the expertise of the specialist and on the specific field density and cell agglomeration [57].
Time to process a single field automatically may vary depending on how dense the field is. We observed an elapsed time of 4.2 s to process the field in Figure 4, 4.1 s to process the field in Figure 5, and 2.1 s for the field in Figure 9. We estimated the average processing time on 10 slides of differing densities, obtaining 2.9 ± 1.1 s. This result was obtained with a low-end/low-cost smartphone, Xiaomi Redmi Note 7, but of course, it largely depends on the device hardware. In this phase, we really focused on demonstrating the feasibility of the proposed approach in terms of segmentation effectiveness (i.e., the extraction of the cells and getting the approval of specialists about the efficacy and usefulness of this system). Then, it is worthwhile to invest in research and the development of technologies, such as those presented in this paper, while software efficiency can be pursued, but it might not be necessary, given that higher-end smartphones are increasingly more powerful and cheaper.

6. Conclusions

The advancements in the nasal cytology field and the evolution of smartphone technology have allowed for the realization of this project. The aim of designing a system that would support the specialist during the observation phase of the slides has been reached through the development of this system, able to acquire an image from the digital microscope and to extract the cellular elements. The main advantages of this application is that the cell counting activity is faster than the manual process, together with its ease of use and the possibility of sharing images obtained from the observed fields. In fact, the cell images extracted can be sent directly to a specific server, which automatically classifies and counts them, such as the Rhino-Cyt system [23]. A possible use of this system could also be in combination with a microscope, which allows for the automatic sliding of the slide. The specialist could manage the sliding and acquire the photo, as necessary. We are now setting ourselves two main goals. The first is to pursue effective full classification on the board and the second is to integrate other diagnostic tools, such as the one just published in the literature, which aims to diagnose dyskinesia of the hair cells of the nasal mucosa [58].

Author Contributions

Conceptualization, G.D. and P.R.F.; data curation, L.S. and F.D.; formal analysis, F.D. and D.D.P.; methodology, G.D., F.D. and L.S.; project administration, G.D.; resources, G.D.; software, P.R.F. and D.D.P; validation, S.L.; writing—original draft, G.D. and D.D.P.; writing—review and editing, G.D., P.R.F., D.D.P. All authors have read and agreed to the published version of the manuscript.

Funding

This research received no external funding.

Conflicts of Interest

The authors declare no conflict of interest.

Appendix A

As we have written in the introduction section, to the best of our knowledge, to date, there are no public or private laboratories that carry out the examination of the cell population of the nasal mucosa routinely, as instead it is done for hematological tests. The first studies about the automatic extraction and classification of the cells of the nasal mucosa were published by some of the authors of this paper. Now, specialists would prefer to carry out the entire evaluation of the cell population on a personal device, such as a smartphone, fully automatically, with the aim of increasing the screening and routine monitoring of nasal disease through cytology.
The use of a smartphone-based system also guarantees the preservation of the privacy and security of patient information. On the other hand, it makes it possible to send patient data and images to the Electronic Medical Record [8] to follow-up with the patient or to obtain a “second opinion”, an increasingly widespread practice. However, this further possibility is reserved for patients who request it and, for these, a security protocol should be used. When the classification is carried out completely on the smartphone, nothing must be transferred remotely; however, several problems have to be overcome first, among all the limitations of the computational capacity of mobile architectures.
Our system is based on well-known algorithms in the literature—not state-of-the-art, but effective enough for our purpose. These are already sustainable from a computational point of view from medium–low end architectures, such as the Xiaomi, used for this experimentation. The use of traditional image processing techniques to preprocess the image is also battery-efficiently on a mobile phone.
At this stage, the system designed and described in this paper is limited to the extraction of cells from the microscopic field. Once this is done, the specialist can decide to manually evaluate the segmented cells or to send them to the Rhino-cyt platform for a fast classification. So, the system is already very useful.

Appendix B

As can be seen from Figure A1, the system presents a modular architecture, composed of several interacting objects or classes. The structure of the application has been designed to ensure a two-layer division—the presentation layer and the status of the business logic. The first layer includes the Java classes that play the role of activities, having the task to show the screens with the GUI and to define the various behaviors of the application, based on the user interaction with the interfaces. The second layer belongs to the Java classes that implement the algorithm proposed in the previous paragraphs and accesses the file system of the smartphone, playing the role of operating classes for the back-end. Below are described the main modules and methods.
Figure A1. Software architecture.
Applsci 10 04567 g0a1
MainActivity represents the main class, as well as the activity that is activated by the Android operating system, invoking the onCreate method. Other methods of MainActivity are fastCapture, multiCapture, galleryOpen, and infoHowto, invoking other activities that are part of the application, described below. Additionally, quit and checkPermissions methods are invoked, respectively, to close the application and to check if permissions have been granted to allow the app to access the device memory, take pictures, and use the Internet connection.
FastCaptureActivity and Capture are both part of the presentation layer, and represent, respectively, the function that allows you to take a single photo and immediately extract the cellular elements to send, and one of its internal classes. FastCaptureActivity, after its invocation with the onCreate method, uses its inner-class Capture to activate the camera and display the frames captured by the latter, with which it will be possible to capture the digital images to submit to the extraction function. The first of the main methods of the Capture class is takePicture that acquires the photo and, after converting it from Bitmap type to Mat type, it stores it in a variable that will be the input of the algorithm of detection and extraction.
MultiCaptureActivity and MultiCapture, are similar to the previous classes with the only difference being that the MultiCaptureActivity class allows you to take any number of photos, acquired thanks to the MultiCapture class that temporarily saves them in a data structure (ArrayList) and provides them all together with the detection and extraction algorithm.
GalleryActivity and FullScreenActivity deal with the visualization of the cells extracted from the algorithm. In particular, the first deals with the loading of the images extracted, accessing the memory of the device, and their visualization in a gallery, in which all the previews of the extracted cells that will be selectable and shareable will be displayed. In particular, the shareImages and deleteImage methods are used, respectively, to share the selected cells and to delete them from the device memory. The reloadAdapter method is used to update the gallery screen after sharing or deleting images, simply reloading the images from the memory. FullScreenActivity is the activity that is invoked by GalleryActivity every time you press on a preview. This activity allows the full screen display of the selected cell.
InfoActivity displays a screen with instructions on how to use the application correctly.
WatershedSegmentation and MultiWatershed are the internal classes belonging, respectively, to FastCaptureActivity and MultiCaptureActivity activities. They are instantiated every time the process of identification and the extraction of cellular elements from the photo(s) taken are started. Their most important methods are detected, which represents the process related to the identification of the cells, proposed in the algorithm described above, the extract method that extracts the elements identified by the previous method, creating a new image for each of them representing only the region of interest that circumscribes the cell, the enlargeRoi method that allows the user to enlarge the area of the region of interest around the cell, and finally the performGammaCorrection method, invoked by the detect method for the gamma correction. Both classes access the smartphone file system and save the cells in the /Pictures/Segmentation/Session directory. This path will be created automatically the first time you launch the application.
Each of the above activities is associated with a layout defined in XML.

References

  1. Dimauro, G.; Caivano, D.; Bevilacqua, V.; Girardi, F.; Napoletano, V. VoxTester, software for digital evaluation of speech changes in Parkinson disease. In Proceedings of the 2016 IEEE International Symposium on Medical Measurements and Applications, MeMeA, Benevento, Italy, 15–18 May 2016; ISBN 9781467391726. [Google Scholar] [CrossRef]
  2. Bevilacqua, V.; Brunetti, A.; Trotta, G.F.; Dimauro, G.; Elez, K.; Alberotanza, V.; Scardapane, A. A Novel Approach for Hepatocellular Carcinoma Detection and Classification Based on Triphasic CT Protocol. In Proceedings of the IEEE Congress on Evolutionary Computation, San Sebastian, Spain, 5–8 June 2017. [Google Scholar] [CrossRef]
  3. Rubaiat, S.Y.; Rahman, M.M.; Hasan, M.K. Important Feature Selection & Accuracy Comparisons of Different Machine Learning Models for Early Diabetes Detection. In Proceedings of the 2018 International Conference on Innovation in Engineering and Technology (ICIET), Dhaka, Bangladesh, 27–28 December 2018; pp. 1–6. [Google Scholar] [CrossRef]
  4. Dimauro, G.; Bevilacqua, V.; Colizzi, L.; Di Pierro, D. TestGraphia, a Software System for the Early Diagnosis of Dysgraphia. IEEE Access 2020, 8, 19564–19575. [Google Scholar] [CrossRef]
  5. Hasan, M.K.; Aziz, M.H.; Zarif, M.I.I.; Hasan, M.; Hashem, M.M.A.; Guha, S.; Love, R. HeLP ME: Recom-mendations for Non-invasive Hemoglobin Level Prediction in Mobile-phone Environment. JMIR mHealth uHealth 2020, in press. Available online: https://preprints.jmir.org/preprint/16806/accepted (accessed on 20 June 2020).
  6. Gigantesco, A.; Giuliani, M. Quality of life in mental health services with a focus on psychiatric rehabilitation practice. Annali dell’Istituto Superiore di Sanita 2011, 47, 363–372. [Google Scholar] [CrossRef]
  7. Dimauro, G.; Caivano, D.; Girardi, F.; Ciccone, M.M. The Patient Centered Electronic Multimedia Health Fascicle-EMHF. In Proceedings of the 2014 IEEE Workshop on Biometric Measurements and Systems for Security and Medical Applications (BIOMS), Rome, Italy, 17 October 2014; ISBN 9781479951758. [Google Scholar] [CrossRef]
  8. Dimauro, G.; Girardi, F.; Caivano, D.; Colizzi, L. Personal Health E-Record—Toward an enabling Ambient Assisted Living Technology for communication and information sharing between patients and care providers. In Ambient Assisted Living; Springer: Cham, Switzerland, 2018; ISBN 9783030059200. [Google Scholar] [CrossRef]
  9. Maglietta, R.; Amoroso, N.; Boccardi, M.; Bruno, S.; Chincarini, A.; Frisoni, G.B.; Inglese, P.; Redolfi, A.; Tangaro, S.; Tateo, A.; et al. Automated hippocampal segmentation in 3D MRI using random undersampling with boosting algorithm. Pattern Anal. Appl. 2016, 19, 579–591. [Google Scholar] [CrossRef] [Green Version]
  10. Celebi, M.E.; Wen, Q.; Hwang, S.; Iyatomi, H.; Schaefer, G. Lesion border detection in dermoscopy images using ensembles of thresholding methods. Skin Res. Technol. 2013, 19, e252–e258. [Google Scholar] [CrossRef] [Green Version]
  11. Rasche, C. Melanoma Recognition with an Ensemble of Techniques for Segmentation and a Structural Analysis for Classification. arXiv 2018, arXiv:1807.06905. [Google Scholar]
  12. Dimauro, G.; Simone, L. Novel biased normalized cuts approach for the automatic segmentation of the conjunctiva. Electronics 2020, 9, 997. [Google Scholar] [CrossRef]
  13. Rasche, C. Fleckmentation: Rapid segmentation using repeated 2-means. IET Image Process. 2019, 13, 1940–1943. [Google Scholar] [CrossRef]
  14. Piuri, V.; Scotti, F. Morphological classification of blood leucocytes by microscope images. In Proceedings of the 2004 IEEE International Conference on Computational Intelligence for Measurement Systems and Applications, Boston, MA, USA, 14–16 July 2004; pp. 103–108. [Google Scholar] [CrossRef]
  15. Qiao, G.; Zong, G.; Sun, M.; Wang, J. Automatic neutrophil nucleus lobe counting based on graph representation of region skeleton. Cytom. Part A 2012, 81A, 734–742. [Google Scholar] [CrossRef]
  16. Li, Q.; Wang, Y.; Liu, H.; Wang, J.; Guo, F. A combined spatial-spectral method for auto- mated white blood cells segmentation. Opt. Laser Technol. 2013, 54, 225–231. [Google Scholar] [CrossRef]
  17. Bevilacqua, V.; Buongiorno, D.; Carlucci, P.; Giglio, F.; Tattoli, G.; Guarini, A.; Sgherza, N.; de Tullio, G.; Minoia, C.; Scattone, A.; et al. A supervised CAD to support telemedicine in hematology. In Proceedings of the 2015 International Joint Conference on Neural Networks, Killarney, Ireland, 12–17 July 2015. [Google Scholar] [CrossRef]
  18. Zheng, Q.; Milthorpe, B.K.; Jones, A.S. Direct neural network application for automated cell recognition. Cytometry 2004, 57A, 1–9. [Google Scholar] [CrossRef] [PubMed]
  19. Osowski, S.; Siroi, R.; Markiewicz, T.; Siwek, K. Application of support vector machine and genetic algorithm for improved blood cell recognition. IEEE Trans. Intrum. Meas. 2009, 58, 2159–2168. [Google Scholar] [CrossRef]
  20. Theera-Umpon, N.; Gader, P.D. System-level training of neural networks for counting white blood cells. IEEE Trans. Syst. Man Cybern. Part C Appl. Rev. 2002, 32, 48–53. [Google Scholar] [CrossRef]
  21. Bousquet, J.; Schünemann, H.J.; Samolinski, B.; Demoly, P.; Baena-Cagnani, C.E.; Bachert, C.; Bonini, S.; Boulet, L.P.; Bousquet, P.J.; Brozek, J.L.; et al. Allergic Rhinitis and its Impact on Asthma (ARIA): Achievements in 10 years and future needs. World Health Organization Collaborating Center for Asthma and Rhinitis. J. Allergy Clin. Immunol. 2012, 130, 1049–1062. [Google Scholar] [CrossRef] [Green Version]
  22. Dimauro, G.; Girardi, F.; Gelardi, M.; Bevilacqua, V.; Caivano, D. Rhino-Cyt: A System for Supporting the Rhinologist in the Analysis of Nasal Cytology. Lect. Notes Comput. Sci. 2018, 619–630. [Google Scholar] [CrossRef]
  23. Dimauro, G.; Ciprandi, G.; Deperte, F.; Girardi, F.; Ladisa, E.; Latrofa, S.; Gelardi, M. Nasal cytology with deep learning techniques. Int. J. Med. Inform. 2019, 122, 13–19. [Google Scholar] [CrossRef]
  24. Dimauro, G.; Deperte, F.; Maglietta, R.; Bove, M.; La Gioia, F.; Renò, V.; Simone, L.; Gelardi, M. A Novel Approach for Biofilm Detection Based on a Convolutional Neural Network. Electronics 2020, 9, 881. [Google Scholar] [CrossRef]
  25. Merenda, M.; Porcaro, C.; Iero, D. Edge Machine Learning for AI-Enabled IoT Devices: A Review. Sensors 2020, 20, 2533. [Google Scholar] [CrossRef]
  26. Lee, D.D.; Seung, H.S. Learning in intelligent embedded systems. In WOES’99, Proceedings of the Workshop on Embedded Systems on Workshop on Embedded Systems, Cambridge, MA, USA, 29–31 March 1999; USENIX Association: Berkeley, CA, USA, 1999; p. 9. [Google Scholar]
  27. Haigh, K.Z.; Mackay, A.M.; Cook, M.R.; Lin, L.G. Machine Learning for Embedded Systems: A Case Study; Technical Report; BBN Technologies: Cambridge, MA, USA, 2015. [Google Scholar]
  28. Chen, J.; Ran, X. Deep Learning With Edge Computing: A Review. Proc. IEEE 2019, 107, 1655–1674. [Google Scholar] [CrossRef]
  29. Sze, V.; Chen, Y.H.; Emer, J.; Suleiman, A.; Zhang, Z. Hardware for machine learning: Challenges and opportunities. In Proceedings of the 2017 IEEE Custom Integrated Circuits Conference (CICC), Austin, TX, USA, 30 April–3 May 2017; pp. 1–8. [Google Scholar]
  30. Howard, A.G.; Zhu, M.; Chen, B.; Kalenichenko, D.; Wang, W.; Weyand, T.; Andreetto, M.; Adam, H. MobileNets: Efficient Convolutional Neural Networks for Mobile Vision Applications. arXiv 2017, arXiv:1704.04861. [Google Scholar]
  31. Iandola, F.N.; Han, S.; Moskewicz, M.W.; Ashraf, K.; Dally, W.J.; Keutzer, K. SqueezeNet: AlexNet-level accuracy with 50x fewer parameters and <0.5MB model size. arXiv 2016, arXiv:1602.07360. [Google Scholar]
  32. Valueva, M.; Valuev, G.; Semyonova, N.; Lyakhov, P.; Chervyakov, N.; Kaplun, D.; Bogaevskiy, D. Construction of Residue Number System Using Hardware Efficient Diagonal Function. Electronics 2019, 8, 694. [Google Scholar] [CrossRef] [Green Version]
  33. Dimauro, G.; Impedovo, S.; Pirlo, G.; Salzo, A. RNS architectures for the implementation of the ‘diagonal function’. Inf. Process. Lett. 2000, 73, 189–198. [Google Scholar] [CrossRef]
  34. Dimauro, G.; Impedovo, S.; Modugno, R.; Pirlo, G.; Stefanelli, R. Residue-to-binary conversion by the “quotient function”. In IEEE Transactions on Circuits and Systems II: Analog and Digital Signal Processing; IEEE: Piscataway, NJ, USA, 2003; Volume 50, pp. 488–493. [Google Scholar] [CrossRef]
  35. Gelardi, M. Atlas of Nasal Cytology for the Differential Diagnosis of Nasal Diseases; Edi. Ermes: Milano, Italy, 2012; ISBN 9781467530354. [Google Scholar]
  36. Gelardi, M.; Iannuzzi, L.; Quaranta, N.; Landi, M.; Passalacqua, G. Nasal cytology-Pratical aspects and clinical relevance. Clin. Exp. Allergy 2016, 46, 785–792. [Google Scholar] [CrossRef]
  37. Gelardi, M. Citologia Nasale. Available online: http://www.citologianasale.eu/citologia.htm (accessed on 20 June 2020).
  38. Paulista, U.E.; Em, P.D.E.P.; Biológicas, C. The Electrical Engineering Handbook; CRC Press: London, UK, 1997; ISBN 978-0133354492. [Google Scholar]
  39. Covington, M.A. Overview of image processing. In Digital SLR Astrophotography; Cambridge University Press: Cambridge, UK, 2009; pp. 145–164. ISBN 978-0-511-37853-9. [Google Scholar]
  40. Dimauro, G.; Guarini, A.; Caivano, D.; Girardi, F.; Pasciolla, C.; Iacobazzi, A. Detecting clinical signs of anaemia from digital images of the palpebral conjunctiva. IEEE Access 2019, 7, 113488–113498. [Google Scholar] [CrossRef]
  41. Dimauro, G.; Baldari, L.; Caivano, D.; Colucci, G.; Girardi, F. Automatic Segmentation of Relevant Sections of the Conjunctiva for Non-Invasive Anemia Detection. In Proceedings of the 2018 3rd International Conference on Smart and Sustainable Technologies (SpliTech), Split, Croatia, 26–29 June 2018; pp. 1–5. [Google Scholar]
  42. Hasan, M.K.; Haque, M.; Sakib, N.; Love, R.; Ahamed, S.I. Smartphone-based Human Hemoglobin Level Measurement Analyzing Pixel Intensity of a Fingertip Video on Different Color Spaces. Smart Health 2018, 5–6, 26–39. [Google Scholar] [CrossRef]
  43. Shih, F.Y. Image Processing and Mathematical Morphology: Fundamentals and Applications; CRC Press: Boca Raton, FL, USA, 2017; ISBN 9781315218557. [Google Scholar]
  44. Bankman, I. Handbook of Medical Image Processing and Analysis; Elsevier: Amsterdam, The Netherlands, 2008; p. 1393. ISBN 9780123739049. [Google Scholar]
  45. Dimauro, G. A new image quality metric based on human visual system. In Proceedings of the 2012 IEEE International Conference on Virtual Environments Human-Computer Interfaces and Measurement Systems (VECIMS) Proceedings, Tianjin, China, 2–4 July 2012; pp. 69–73. [Google Scholar] [CrossRef]
  46. Dimauro, G.; Altomare, N.; Scalera, M. PQMET: A digital image quality metric based on human visual system. In Proceedings of the 4th International Conference on Image Processing Theory, Tools and Applications (IPTA), Paris, France, 14–17 October 2014; pp. 1–6. [Google Scholar] [CrossRef]
  47. Kaur, D.; Kaur, Y. Various Image Segmentation Techniques: A Review. Int. J. Comput. Sci. Mob. Comput. 2014, 3, 809–814. [Google Scholar]
  48. Comaniciu, D.; Meer, P. Mean shift: A robust approach toward feature space analysis. IEEE Trans. Pattern Anal. Mach. Intell. 2002, 24, 603–619. [Google Scholar] [CrossRef] [Green Version]
  49. Fukunaga, K.; Hostetler, L.D. The Estimation of the Gradient of a Density Function, with Applications in Pattern Recognition. IEEE Trans. Inf. Theory 1975, 21, 32–40. [Google Scholar] [CrossRef] [Green Version]
  50. Cheng, Y. Mean Shift, Mode Seeking, and Clustering. IEEE Trans. Pattern Anal. Mach. Intell. 1995, 17, 790–799. [Google Scholar] [CrossRef] [Green Version]
  51. Nedrich, M. Mean Shift Clustering. Available online: https://spin.atomicobject.com/2015/05/26/mean-shift-clustering/ (accessed on 20 June 2020).
  52. Otsu, N. A threshold selection method from gray-level histograms. IEEE Trans. Syst. Man Cybern. 1996, 9, 62–66. [Google Scholar] [CrossRef] [Green Version]
  53. Sahir, S. Canny Edge Detection Step by Step in Python. Available online: https://towardsdatascience.com/canny-edge-detection-step-by-step-in-python-computer-vision-b49c3a2d8123 (accessed on 20 June 2020).
  54. Canny, J. A Computational Approach to Edge Detection. IEEE Trans. Pattern Anal. Mach. Intell. 1986, 8, 679–698. [Google Scholar] [CrossRef]
  55. Dougherty, E.; Lotufo, R.A. Hands-on Morphological Image Processing; SPIE Press Book: Bellingham, DC, USA, 2003; ISBN 9780819447203. [Google Scholar]
  56. Efford, N. Morphological Image Processing, in Digital Image Processing: A Practical Introduction Using Java; Pearson Education: Harrow, UK, 2000; ISBN 978-0201596236. [Google Scholar]
  57. Dimauro, G.; Bevilacqua, V.; Fina, P.R.; Buongiorno, D.; Brunetti, A.; Latrofa, S.; Cassano, M.; Gelardi, M. Comparative Analysis of Rhino-Cytological Specimens with Image Analysis and Deep Learning Techniques. Electronics 2020, 9, 952. [Google Scholar] [CrossRef]
  58. Renò, V.; Sciancalepore, M.; Dimauro, G.; Maglietta, R.; Cassano, M.; Gelardi, M. A novel approach for the automatic estimation of Ciliated cells Beating Frequency. Electronics 2020, 9, 1002. [Google Scholar] [CrossRef]
Figure 1. Nasal cells.
Applsci 10 04567 g001
Figure 2. Image acquisition.
Applsci 10 04567 g002
Figure 3. Image Enhancement. Original image (on the left); image with contrast enhancement (in the center); image with brightness enhancement (on the right) that needs gamma-correction.
Applsci 10 04567 g003
Figure 4. A cell field (a), surface construction (b), and cluster detection (c).
Applsci 10 04567 g004
Figure 5. Input image (a), output image of brightness enhancement step (b).
Applsci 10 04567 g005
Figure 6. Output images of gamma correction step (a) and mean shift (b).
Applsci 10 04567 g006
Figure 7. Output images of Otsu’s binarization (a) and morphological operations (b).
Applsci 10 04567 g007
Figure 8. Output images of Euclidean Distance Transform (a) and Watershed detected cells (b).
Applsci 10 04567 g008
Figure 9. Original image (left) and extracted cells (right).
Applsci 10 04567 g009
Figure 10. App home page (a), app field gallery (b).
Applsci 10 04567 g010
Figure 11. Cell extraction pipeline with methods—see “detect()” in Appendix B.
Applsci 10 04567 g011
Figure 12. Cell detection.
Applsci 10 04567 g012
Table 1. Cell detecting performance.
Confusion Matrix
True Condition
Predictedpositivenegative
Positive1224166
Negative52113

