Abstract
Tomographic imaging technology is a geophysical inversion method. According to the ray scanning, this method carries on the inversion calculation to the obtained information, and reconstructs the image of the parameter distribution rule of elastic wave and electromagnetic wave in the measured range, so as to delineate the structure of the geological body. In this paper, teleseismic tomography is applied by using seismic travel time data to constrain layered crustal structure where Fast Marching Methods (FMM) and the subspace method are considered as forward and inverse methods, respectively. Based on the travel time data picked up from seismic waveform data in the study region, the P-wave velocity structure beneath Northeast China down to 750 km is obtained. It can be seen that there are low-velocity anomalies penetrating the mantle transition zone under the Changbai volcano group, Jingpohu Volcano, and Arshan Volcano, and these low-velocity anomalies extend to the shallow part. In this paper, it is suggested that the Cenozoic volcanoes in Northeast China were heated by the heat source provided by the dehydration of the subducted Pacific plate and the upwelling of geothermal matter in the lower mantle. The low-velocity anomaly in the north Songliao basin does not penetrate the mantle transition zone, which may be related to mantle convection and basin delamination. According to the low-velocity anomalies widely distributed in the upper mantle and the low-velocity bodies passing through the mantle transition zone beneath the volcanoes, this study suggests that the Cenozoic volcanoes in Northeast China are kindred and have a common formation mechanism.
1. Introduction
Tomographic imaging technology is a geophysical inversion interpretation method, which uses medical Computed Tomography (CT) for reference.
Tomographic technology is to use slice images to describe the specific shape of objects. This technology was first used in medical X-ray imaging of human organs, named CT imaging. In addition to medical CT imaging, tomographic technology has been widely used in many disciplines, such as atmospheric science, marine science, biology, and geophysics [1]. Among them, using seismic data to image the earth’s interior is one of the core research contents of geophysics and even geoscience [2].
Computer science developed very fast in the 1970s, and many computing devices have been used in earth science. Seismologists first introduced tomographic technology into seismology in 1974, and published the first work related to seismic tomographic imaging from 1976 to 1977 [3,4]. Seismic tomography is similar to medical CT, which is also based on a large number of cross-path constraints [5]. In the process of seismic tomography, the stations receiving seismic wave rays cannot be moved [6]. The underground rays received by seismic tomography come from all directions, therefore, the arrangement of seismic receivers can consider dense lines or scattered grids [7]. The seismic tomographic source can be a source of artificial explosion or a passive source similar to the source of natural earthquakes. The scope of the study extends from a small local area to a global area [8]. Generally speaking, the study of the local area is often related to engineering problems, such as refraction tomography [9]. However, in the large-scale tomographic study, more attention has been paid to the study of flame mechanism, geodynamics related to mantle plume and plate subduction [10,11,12].
The main difference between local and teleseismic tomography lies in the location of the earthquake. In the study of teleseismic tomography, the seismic source is usually thousands of kilometers away from the receiver array [13]. The crust and upper mantle are the target areas, which are located under the receiving array [14]. The study of teleseismic tomography needs an important premise that the velocity inhomogeneity of the lower mantle is that the seismic wave has enough small amplitude and long wavelength. When the condition is satisfied, the wave front of the seismic wave incident in the study area has a small curvature [15]. In Local Earthquake Tomography (LET), teleseismic tomography is usually performed in 3-D [16]. In general, the basis of teleseismic tomography requires the relative travel time residual of the first arrival P-wave, and the parameterization of the model is quite similar to that used in LET, which both have continuous velocity block and node information [17].
In the initial seismic tomographic study, some scholars established a travel time tomographic method based on the relative delay of local seismic events under the stations in the study area, and obtained the crustal P-wave velocity structure near the San Andreas fault in Bear Valley, California, USA in 1974 [18]. In 1977, these scholars completed a further study, using the teleseismic data recorded on the norsar array to retrieve the velocity structure at a depth of 126 km [19]. In 1982, Thomson and gibbons improved the method considering the amplitude of the seismic wave, and constrained the upper mantle velocity model within 150–200 km underground of the norsar area [20]. With the continuous progress of numerical methods in solving linear equations, the improvement of computing power, and the emergence of a large number of seismic stations during the cold war, the available seismic data are increasing. In 1984, the results of global lower mantle tomography were obtained for the first time [21]. Their model takes a constant velocity block as a parameter, and the initial model is composed of a structure with constant lateral velocity, the obtained results come from linear inversion. In teleseismic tomography, the result of linear inversion is more accurate than that of LET or wide-angle inversion [22]. The main reason for this is that the ray path is close to vertical when passing through the model body, and the rate of change of velocity is small. Therefore, many teleseismic tomographic images are processed by linear inversion [23,24,25,26,27].
NE China is located away from the subducting Japan trench for more than 1000 km and is currently bearing the extrusion of the Pacific plate. There are several Cenozoic intraplate volcanoes surrounding the Songliao basin in the middle. From north to south, they are Wudalianchi volcano, Aershan Volcano, Jingpohu Volcano, and Changbaishan Volcano. The North-South Gravity lineament (NSGL), as one of the most important topography lines in China, is considered to constrain the west subduction edge of the Pacific slab in NE China [28]. Different from the classical plate-boundary-related volcanoes on the earth. Changbaishan volcano, the most representative Cenozoic intraplate volcano in NE China, has been controversial in its origin and studied for decades [28,29,30,31,32]. In general, there are two models to explain the origin of Changbaishan Volcano. The dehydration model is presented by the tomographic results that continuous high-velocity zone exists from the Japan subduction trench down to the mantle transition zone beneath Changbaishan volcano and even farther to the Songliao basin, which infers that the subducting stagnant slab is continuous and the heat source comes from the water brought by subduction [28,29,30]. The other model infers that Changbaishan Volcano is originated from a lower mantle because of the image of a gap penetrating the mantle transition zone where low-velocity anomaly exists and extends to the crust [30]. Therefore, the core issue comes to whether there is a gap beneath Changbaishan Volcano. On the one hand, the origin of Changbaishan Volcano is still worth debating, on the other hand, the relationship between other Cenozoic volcanoes in NE China and Changbaishan Volcano was not fully discussed.
In this paper, the P-wave velocity structure with a depth of 750 km under the study region is obtained by using the teleseismic travel time tomographic imaging of natural earthquakes. The study region covered by several seismic arrays fills the upper-most part of Northeast China, including the Songliao basin and Cenozoic volcanoes on both sides [32]. As the ray passes through the bottom of the study model, with the increase of depth, the range of teleseismic rays from all directions is larger. In addition to the crust range with poor ray cross, the ray distribution is better and the resolution is higher in the range including upper mantle, mantle transition zone, and a few lower mantle. Even though there are fewer teleseismic events from the Arctic direction and poor station distribution northern than 48° N, the resolution beneath the north part is still reliable, especially in the upper mantle scale. The original data used in this research institute in Northeast China comes from the waveform data of distant earthquake events received by the arrays in the study region, and two mainstream waveform correlation methods are used: multichannel cross-correlation method and adaptive stacking method to respectively pick up and calculate the inversion data - relative travel time residual. The inversion results show that the distribution of the low-velocity structure of the upper mantle beneath the Cenozoic volcanoes in the study area is of great significance for the interpretation of the special mechanism of the formation of volcanoes in the back arc plate [30,33].
2. Methodology
In the tomographic work of this paper, the FMM is selected as the forward method, while the subspace iterative method is selected as the inversion method [34].
2.1. Fast Marching Method
FMM is an efficient numerical algorithm for solving the Eikonal equation, which belongs to a nonlinear partial differential equation and can be considered as an approximate wave equation. The Eikonal equation can be expressed as:
The physical meaning of the result in the interface evolution problem is the shortest time that it takes for the curve to reach every point in the calculation domain at the velocity . Tracking the level set of t at different heights, it can always give a position of time evolution curve. When F = 1, the solution of the equation represents the distance field in the calculation domain, which is the so-called signed distance function.
FMM uses a special difference quotient instead of the derivative, which can be expressed as the following formula in the three-dimensional case.
where is the first-order forward difference operator for the independent variable x, and is the first-order backward difference operator for the independent variable x.
Under the three-dimensional condition, the cell is a cube, in which , , are the grid points. At the same time, the following formula can be obtained.
The solution of Equation (2) can be expressed as:
2.2. Subspace Method
In many tomographic methods, there are some one-dimensional subspace methods, such as the steepest descent method and conjugate gradient method are all one-dimensional subspace methods, and these methods only perform a line minimization at each iteration. Therefore, we need to consider constructing a subspace method, which can simultaneously perform the minimization along the search direction that together span a subspace of the model space, as shown in Figure 1. According to the above reasons, the subspace iteration method is selected for inversion in this paper.
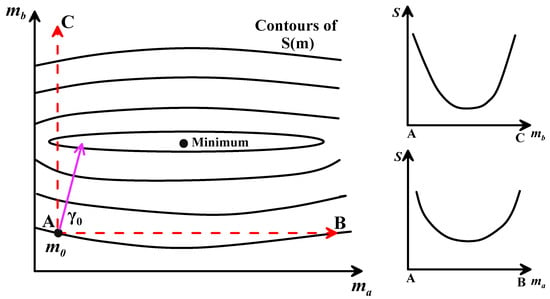
Figure 1.
A contour plot of S(m) which is a function of two parameters of different physical dimensions [14].
The subspace method limits the minimization of the quadratic approximation of the objective function to an n-dimensional subspace of the model space, so that the perturbation occurs in the space spanned by a set of n M-dimensional basis vectors :
μj is the component which determines the length of the corresponding vector aj that minimizes the quadratic form of in the space spanned. A is the M × n projection matrix.
If the objective function is smooth enough, the following formula can be obtained:
where and are gradient vector and Hessian matrix, respectively. Their expression can be expressed as:
where is the Frechet derivative matrix of partial derivatives which is calculated during the solution of the forward modeling. is a data covariance matrix. is a priori model covariance matrix. is referred to as the damping factor.
Through the above formula, the following formula can be obtained:
and locating the minimum of with respect to :
for q = 1, …, n. can be expressed as:
where , and :
At present, there are two popular methods to evaluate the quality of travel time tomographic solution: detection board test and recovery test. The former adds the positive and negative phase anomalies with the same value to the initial model, and then calculates the path and travel time by forward modeling. The resultant relative travel time residual is obtained by the difference between the results and the travel time of the initial model. Then, the initial model is inverted by the resultant relative travel time residual. If the results show a clear and recognizable “checkerboard” between the positive and negative phases, it can be proved that the resolution meets the requirements.
The latter takes the final inversion model as the initial model and performs the inversion again. If the result is similar to the previous one, it is considered that the two are relatively consistent, which proves the reliability of inversion. In this paper, we use these two methods to select the appropriate initial model grid and verify the reliability of the final results.
3. Northeast China
3.1. Data Information
In order to cover Northeast China as much as possible, in this paper we select 286 stations, as shown in Figure 2. These stations cover most areas of Northeast China, including the whole Songliao basin. The interval of longitude and latitude between stations is close to 0.8° with even distribution. The stations are from six arrays, which are represented by different colors. The station details are shown in Figure 3.
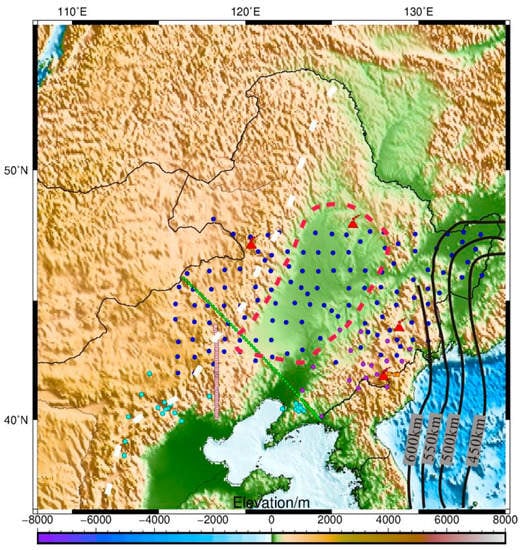
Figure 2.
Station map and geological background selected in this paper.
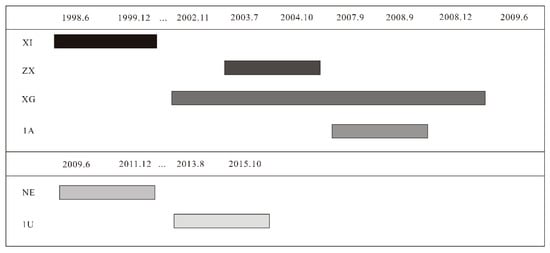
Figure 3.
Time distribution of array recording.
1. The North East China Extended Seismic Array, represented by blue dots, is jointly deployed by China, the United States, and Japan, covering most areas of 42–48° N and 116–134° E, with 127 stations in total. The observation time is from June 2009 to December 2011. In this study, 352 teleseismic events during this period were selected.
2. The XI array represented by purple dots was set up around Changbai Mountain by Wu Daming’s team with 19 stations in total. The observation time was from June 1998 to December 1999. In total, 124 teleseismic events were selected in this study.
3. The 1U array represented by green dots is densely distributed on the North Korean side of Changbai Mountain, the border between China and North Korea, with six stations in total, and the observation time is from August 2013 to October 2015. In total, 287 teleseismic events were selected in this study.
4. The ZX array in the North China Interior Structure Project, represented by pink dots, is densely distributed along the north–south direction, with 47 stations in total. The observation time is from July 2003 to October 2004. In this study, 124 teleseismic events were selected.
5. The XG array represented by light blue dots, some of which are scattered in the border areas of northeast, North China, and the Great Khingan Mountains, and the others are densely distributed in southern Liaoning with 27 stations in total. The observation time is from November 2002 to December 2008. In this study, 333 teleseismic events were selected.
6. The 1A array in the NISP plan represented by the orange dots has 60 stations in total, and the observation time is from September 2007 to September 2008. In this study, 200 teleseismic events were selected.
Firstly, we need to select the waveform data of seismic events, and then take the coordinates (44° N, 124° E) as the center to screen the seismic data received by the above six series of the array, and three methods should be followed in the process of screening.
1. Magnitude/Ms ≥ 5.5;
2. Epicenter distance is more than 30° and less than 90°;
3. Each seismic event requires at least half of the stations to receive signals.
After the appropriate 1151 teleseismic events are delineated, the vertical component waveform data of the first 100 s and the second 200 s of the first P-wave are intercepted and bandpass filtering is performed on these data. Then, the waveform correlation method is used to pick up the relative travel time residuals. For each event, the two results are relatively consistent, and the relative travel time residuals are obtained. The teleseismic distribution received by the above six arrays can be shown in Figure 4. The distribution of teleseismic events used in this study is reasonable. There is also a good location relationship between the teleseismic event and the station. There are enough rays in all directions except the Arctic.
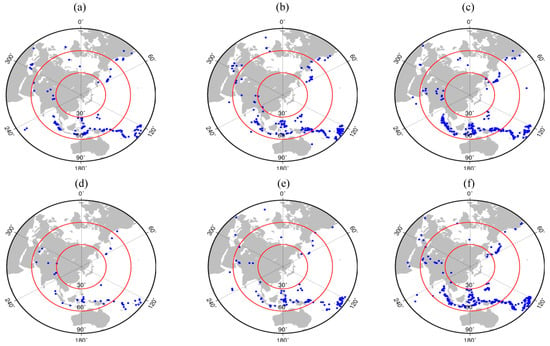
Figure 4.
Distribution of teleseismic events selected by different arrays: (a) 1A; (b) 1U; (c) XG; (d) XI; (e) ZX; (f) NE.
3.2. Picking Up the Relative Travel Time Residuals
The travel time of the seismic wave is the observation data of tomography. In teleseismic tomographic imaging, in order to eliminate the source error and the error outside the model in the study area, it is necessary to reduce the observation travel time by the theoretical travel time to obtain the travel time residual. Then, the final “relative travel time residuals” can be obtained by subtracting the mean value of travel time residuals (Figure 5).
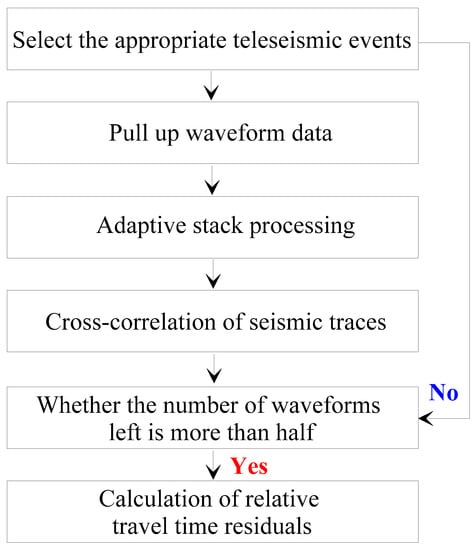
Figure 5.
Flow chart of picking up relative travel time residuals.
Relative travel time residuals correspond to velocity anomalies, and then we use relative travel time residuals for inversion [35]. It will be a very time-consuming work to pick up each waveform data manually. Therefore, seismologists have proposed many accurate and efficient methods to pick up travel time residuals based on waveform correlation [36]. This paper also uses this method to pick up the waveform. The two cross-correlation methods are integrated into a graphical interface, which greatly improves the efficiency of picking up travel time residuals. Because the deployment time of each array selected in this study is scattered, the array data of each uniform sampling rate is picked up separately, as shown in Figure 6. Before picking up the data, bandpass filtering is carried out. The frequency range is 0.01–1 Hz, which avoids filtering out the relative high-frequency information of distant earthquakes, and keeps the first arrival of the P-wave to a high degree. Then, an adaptive stacking code is used to process the waveform and delete the waveform with a low signal-to-noise ratio.
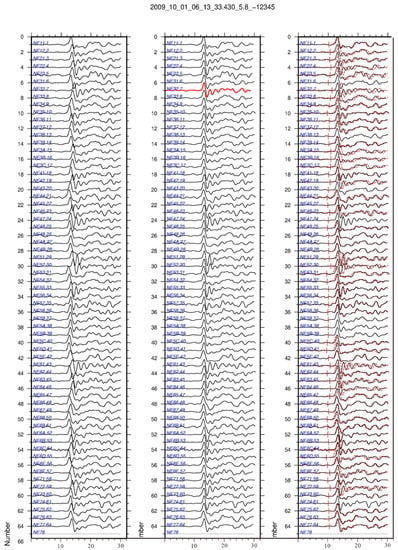
Figure 6.
Schematic diagram of travel time residuals picked up by waveform cross-correlation in teleseismic. The left side is the original waveform arrangement, the middle side is the cross-correlation result, and the right side is the theoretical arrival time.
3.3. Inversion Resolution and Reliability Evaluation
3.3.1. Initial Model
In this paper, the global average velocity model is used as the initial velocity model to calculate the theoretical velocity of each node in the model. This study also tested an initial model, in which the average spacing of each station in the array is 0.8° × 0.8°. The vertical direction has been tested for 50 km.
3.3.2. Checkerboard Test
The test board test (template/chessboard test) is a classic process used to evaluate the reliability of solutions, as shown in Figure 7. This method can add regular positive and negative errors to the initial model to affect the velocity distribution at the nodes and get the synthetic data model. The ray path and travel time residuals are calculated by adding the source information and station location, and then the initial model is inverted by using travel time residuals. Finally, the rationality of the initial model grid setting can be known by comparing the resulting model with the synthetic data model.
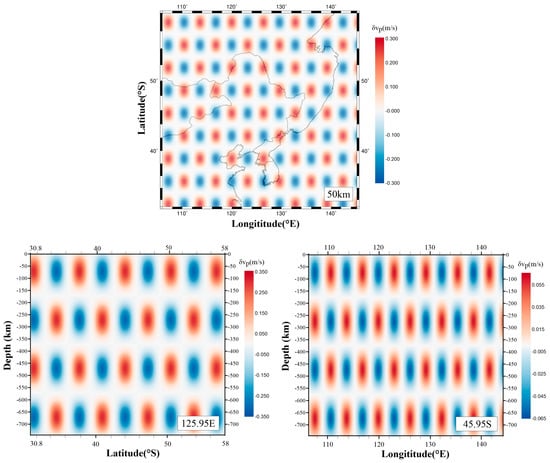
Figure 7.
Initial model with a 0.8° × 0.8° × 50 km grid.
In the test of the test board, the horizontal grids are all selected with a distribution interval of 0.8° × 0.8°. The model with a depth of 50 km is tested, and the input models are respectively added with a velocity disturbance of ±4% and a random error of 0.1%.
In terms of the effect of the test results as shown in Figure 8, the resolution of this study is relatively high for the upper mantle and mantle transition zone, especially for Changbai Mountain and Songliao basin, the key area of this study, which have better test results at different depths. From the results, the reliability of imaging results is high. Therefore, in this paper we select the 0.8° × 0.8° × 50 km grid as parameters, the horizontal resolution is about 1.6° × 1.6°, and the vertical resolution is about 100 km.
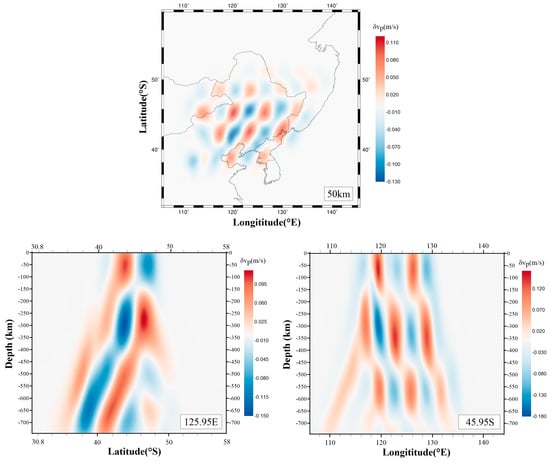
Figure 8.
Test results and inversion results of 0.8° × 0.8° × 50 km grid
3.3.3. Inversion Results
The results of this study are presented in horizontal and vertical sections below. The horizontal slices are divided into 12 representative horizontal slices at 60 km intervals, as shown in Figure 9.
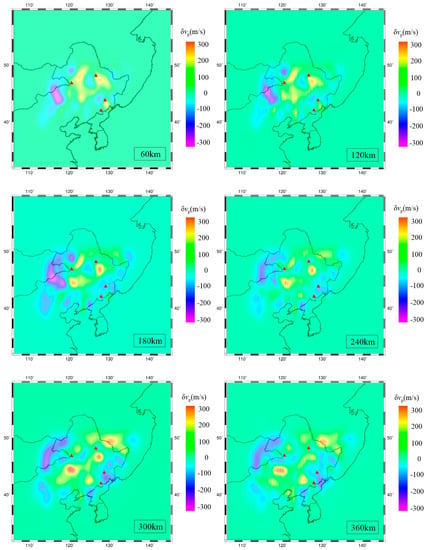
Figure 9.
Horizontal section of P-wave velocity disturbance in the upper mantle of the study area (60–360 km).
On the 60 km depth profile, there is a large range of high-velocity anomaly in the Songliao basin, but there is an independent low-velocity anomaly in the north side. The separation track of high-velocity and low-velocity at the west side of the Songliao basin is consistent with the location of the gravity cascade belt in the Great Khingan Mountains. The Changbai volcano group shows a high low-velocity anomaly as a whole, but there is an obvious high-velocity anomaly on the southeast side of North Korea.
The distribution of velocity disturbance on the 120 km depth profile is basically the same as that of the 60 km depth profile. The range of low-velocity anomaly on the southwest side of the Songliao basin is slightly reduced, and the low-velocity anomaly on the north side still exists independently. At the depth of 120 km, the high-velocity and low-velocity separation tracks in the 60 km depth profile are still distributed along the Greater Khingan Mountains gravity cascade belt. On the 180 km depth profile, the low-velocity anomaly in the north of the Songliao basin seems to be connected with the low-velocity anomaly in the west of the Greater Khingan Mountains, which is strengthened on the 240 km depth profile. The 240 km depth profile shows that the discrete low-velocity anomaly distribution is more connected with each other.
On the 300 km depth profile, the high-velocity anomaly in the Songliao basin is weaker than that in the shallow part. The low-velocity anomaly in the northern part of the Songliao basin forms a ring with the low-velocity body in the Arshan volcano area, and the high-velocity distribution range in the southwest is expanded. The low-velocity distribution area corresponding to the Changbai volcano group, several small volcanoes included, is larger, showing the homology of these volcanoes in the upper mantle. On the 360 km depth profile, it can be seen that the low-velocity disturbance degree and distribution range in the south are reduced, Jingpohu Volcano and the Changbaishan volcano group are connected into a piece at this depth, and the small-scale high-velocity anomaly disappears in the west side of the middle of these volcanoes at the depth of 300 km.
On the depth profiles of 420 km and 480 km, as shown in Figure 10, it can be seen that with the deepening of the depth, the low-velocity abnormal disturbance under the volcano increases, and the low-velocity abnormal disturbance under the Arshan and on the side of the Songliao basin gradually separates. On the 560 km depth profile, it can be seen that the low-velocity anomalies under the west side of the Changbaishan volcano group increase sharply in the disturbance degree and distribution range, and the low-velocity anomalies on the east side also increase in the disturbance degree. This shows that there is a large range of low-velocity anomaly in the mantle transition zone under Changbai Mountain, suggesting the possible source of thermal material in the upper mantle. On the 620 km and 680 km depth profiles, the low-velocity anomalies in the mantle transition zone below the west side of Changbai Mountain are more obvious, and continue to expand along the east-west direction. There are obvious low-velocity anomalies under the east side of the Five-linked-great-pool Lake (FLGPL) volcano group. The velocity disturbance is lower than Changbai Mountain, but the range is larger. In the 740 km depth profile, the distribution of low-velocity anomalies is more discrete than in the mantle transition zone, which may indicate that the upper low-velocity anomalies come from the deeper mantle.
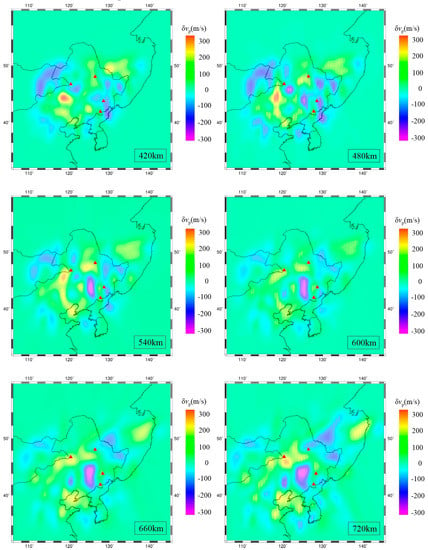
Figure 10.
Horizontal section of P-wave velocity disturbance in the upper mantle of the study area (420–720 km).
As shown in Figure 11 and Figure 12, we can see that the upper mantle in Northeast China shows the characteristics of low-velocity anomaly related to volcanoes distributed in the large-scale high-velocity anomaly. In the range of 42° N to 44° N, there is a common low-velocity anomaly in the mantle transition zone on the west side of the Changbai Mountain volcano group, the black surrounding area in Figure 11. According to the 42° N and 44° N profiles, this anomaly has obvious connectivity with the low-velocity anomaly of the upper mantle and crust, and a large range of high-velocity anomalies are distributed in the mantle transition zone beyond this low-velocity anomaly. The 46° N and the 48° N profiles show that the low-velocity anomalies in the Arshan volcanic area are widely distributed in the upper mantle, but there is no low-velocity anomaly distribution below the mantle transition zone; FLGPL volcano group is located in the northern boundary of the study area, with low resolution, but the low-velocity anomalies below are relatively shallow and independent.
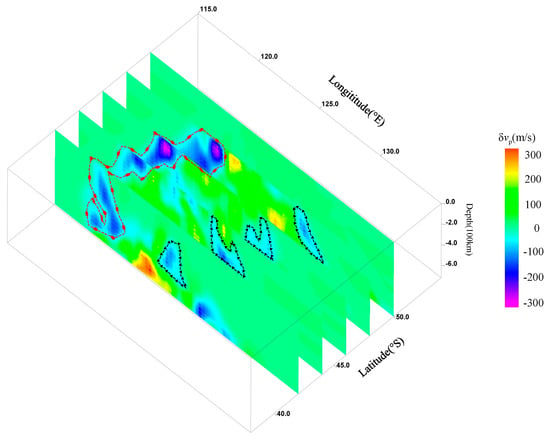
Figure 11.
Five slices in the range of 42° N–50° N from east to west.
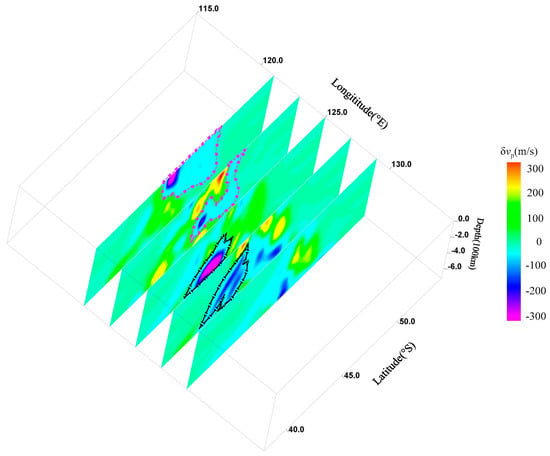
Figure 12.
Five slices in the range of 122° E–130° E from north to south.
The profile along the north–south direction shows that the high-velocity anomalies widely distributed in the Songliao basin are flooding the upper mantle. On the 122° E and 124° E profiles, it can be seen that the low-velocity anomaly under the Arshan is continuously distributed to the mantle transition zone, as shown in the purple surrounding area in Figure 12. On the 126° E and 128° E profiles, we can see that there is a large area of low-velocity anomaly along the upper mantle to the shallow part of the mantle transition zone under Changbai Mountain, which is consistent with the results of the East-West profile as shown in the black surrounding area in Figure 12. The 128° E to 130° E profiles show that a large range of low-velocity anomalies under the FLGPL volcano group come from the east and are separated from the low-velocity anomalies in the west of Changbai Mountain.
4. Discussion
As shown in Figure 13, in the Songliao basin (in red wireframe), the upper mantle generally shows a high-velocity abnormal distribution, which is related to the extensional background of the basin formation, but it is worth mentioning that there is a small range of low-velocity abnormal body in the northern part of the basin, which does not cross continuously the mantle transition zone, so it may be related to the mantle convection. Under the geological background of Cenozoic volcanoes around the basin, many low-velocity anomalies are reasonable results.
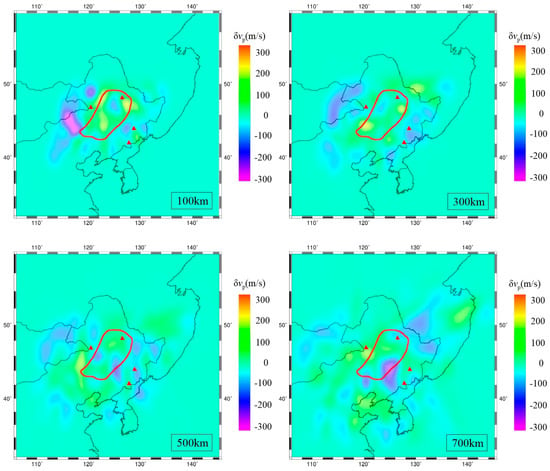
Figure 13.
Horizontal section of P-wave velocity disturbance in the upper mantle of the study area (100–700 km, interval: 200 km).
As can be seen in Figure 14, it is the comparison between the results of this study and the low-velocity area determined by Zhang [31]. We can see the low-velocity anomalies from the mantle transition zone and the upper mantle are continuous from Figure 14. In this study, the low-velocity anomalies of West-Low-Velocity-Zone (WLVZ) and East-Low-Velocity-Zone (ELVZ) in the same position and shape are also observed.

Figure 14.
Section results of the study area, (a) 45° N; (b) 44.5° N.
However, some of the results of this paper are different from Zhang’s anomaly delineation area. The low-velocity anomaly in the east side of this study extends to the lower mantle than that of ELVZ, which may indicate that there is not only one WLVZ gap in the subduction plate beneath Changbai Mountain.
It is worth mentioning that the shallow high-velocity anomaly in the east of the Changbai Mountain is observed in this study. It is speculated that it is related to the data of 1U temporary station in North Korea. The shallow high-velocity anomaly restricts the distribution range of crust mantle low-velocity anomaly in the east of the Changbai Mountain volcano group.
As a large intraplate volcano more than 1000 km away from the subduction trench, the origin of Changbaishan volcano group has always been considered to be related to the subduction of the Pacific plate. Some scholars have put forward the view that a “gap” in the subduction plate provides a channel for hot material from the lower mantle to inject into the upper mantle, and the upwelling of the lower mantle from a “gap” provides the main deep heat source for Changbai Mountain [28]. A researcher used the joint inversion of distant and local earthquakes in 2018 to obtain the continuous distribution of subduction plate images under the northeast area, and no “gap” was found in his result [37]. The continuous subduction plate image supports the “dehydration model in the mantle wedge” proposed by Zhao Dapeng in 2004, that is, the subduction plate carries a large amount of water to heat the upper mantle, and these heated upper mantles in the subduction plate and the continuous recumbent plate form a large area of low-velocity anomaly and wedge-shaped distribution, which is also supported by the tomographic results of many scholars [29,38,39]. The profile obtained in this study shows that there is an obvious low-velocity anomaly in the mantle transition zone under Changbai Mountain, and the result is more consistent with previous conclusions. It is suggested that there is a gap in the mantle transition zone beneath Changbai Mountain, and that the low-velocity anomaly near other mantle transition zones around gap may indicate that upwelling mantle migrates laterally along the top of the mantle transition zone as it passes through the gap, and the ratio of upwelling to downwelling leads to partial melting of the upper mantle and the lower subduction plate at the velocity of 410 km. In recent years, a numerical simulation based on thermodynamic coupling shows that the subduction plate provides enough water for the upper mantle beneath Changbai Mountain. The formation of Changbai Mountain is believed to be closely related to the heating and melting of the upper mantle due to the deep dehydration of the detained plate.
This paper also agrees with the view that the formation of Changbai Mountain is related to the retention, dehydration, and upper mantle convection of the subduction plate in the mantle transition zone. Because the simple plate gap may not be enough to provide enough deep heat source for such a large Changbai Mountain volcano group. Secondly, the existence of the plate gap is closely related to the subduction of the Pacific plate. The formation process of Changbai Mountain is influenced by two kinds of actions.
5. Conclusions
In this paper, the method of data acquisition and reliability evaluation is verified based on the travel time tomographic imaging of distant earthquakes by fast marching method, and then the three-dimensional velocity structure of the upper mantle in Northeast China is obtained by using this method. The results of this study are as follows:
(1) In this study, three-dimensional P-wave velocity disturbance images in the depth range of 750 km in the northeast of China are obtained, showing the high-velocity anomaly and an obvious low-velocity anomaly widely distributed in the upper mantle of the Songliao basin. The phenomenon of partial melting of the upper mantle exists in the lower part of the Songliao basin and Wudalianchi. Although the low-velocity anomalies beneath the mountain are from the lower mantle, different from other volcanoes, they may come from the independent mantle plume on the west side of the mountain, but the mantle convection caused by the mantle wedge is weak.
(2) There are obvious low-velocity anomalies in the mantle transition zone beneath the Changbaishan volcano group and Jingpohu volcano. These low-velocity anomalies come from the deeper lower mantle and have a continuous connection with the upper mantle through the plate gap. The geographical location of the volcano has a good corresponding relationship with these low-velocity anomalies. This indicates that the location of the plate gap restricts the location of the Changbaishan volcano group and Jingpohu volcano. The thermal material provided by the plate, together with the heat source provided by the dehydration in the mantle wedge, plays a decisive role in the formation of the volcano.
(3) The low-velocity anomalies widely distributed in the upper mantle are more or less connected, and the small independent low-velocity anomalies are scattered under the Songliao basin, which indicates that there is more active convection in the upper mantle in the northeast, which suggests that the Cenozoic volcanoes in the northeast have a higher affinity
Author Contributions
Conceptualization, methodology, investigation and writing, Z.J.; formal analysis, project administration, G.Z. All authors have read and agreed to the published version of the manuscript.
Funding
This research was supported by the Major Projects of the National Science and Technology of China (2016YFC0600505) and the National Natural Science Foundation of China under Grant 41574109, 41504085 and 41874136.
Conflicts of Interest
The authors declare no conflict of interest.
Abbreviations
The following abbreviations are used in this manuscript:
| CT | Computed Tomography |
| FMM | Fast Marching Methods |
| LET | Local Earthquake Tomography |
| FLGPL | Five-linked-great-pool Lake |
| WLVZ | West-Low-Velocity-Zone |
| LVZ | Low-Velocity-Zone |
| HVZ | High-Velocity-Zone |
| ELVZ | East-Low-Velocity-Zone |
| NSGL | North-South Gravity lineament |
References
- Devaney, A.J. Geophysical Diffraction Tomography. IEEE Trans. Geosci. Remote Sens. 1984, GE-22, 3–13. [Google Scholar] [CrossRef]
- Tian-Fei, Z. Determination of the three-dimensional seismic structure of the lithosphere using the seismic data. Acta Geophys. Sinica 1982, 6, 500–508. [Google Scholar]
- Şengör, A.M.; Natal’In, B.A.; Burtman, V.S. Evolution of the Altaid tectonic collage and Palaeozoic crustal growth in Eurasia. Nature 1993, 364, 299–307. [Google Scholar] [CrossRef]
- Aki, K.; Lee, W.H.K. Determination of three-dimensional velocity anomalies under a seismic array using first P arrival times from local earthquakes: 1. A homogeneous initial model. J. Geophys. Res. 1976, 81, 4381–4399. [Google Scholar] [CrossRef]
- Humphreys, E.D.; Clayton, R.W. Tomographic image of the southern California mantle. J. Geophys. Res. 1990, 95, 19725–19746. [Google Scholar] [CrossRef]
- Fukao, Y. Seismic tomogram of the Earth’s mantle: Geodynamic implications. Science 1992, 258, 625–630. [Google Scholar] [CrossRef]
- Kennett, B.L.N.; Engdahl, E.R. Traveltimes for global earthquake location and phase identification. Geophys. J. Int. 1991, 105, 429–465. [Google Scholar] [CrossRef]
- Kennett, B.L.; Sambridge, N.M.S.; Williamson, P.R. Subspace methods for large scale inverse problems involving multiple parameter classes. Geophys. J. Int. 1998, 94, 237–247. [Google Scholar] [CrossRef]
- Kennett, B.L.; Engdahl, E.R.; Buland, R. Constraints on seismic velocities in the Earth from travel times. Geophys. J. Int. 1995, 122, 108–124. [Google Scholar] [CrossRef]
- Lippitsch, R.; Kissling, E.; Ansorge, J. Upper mantle structure beneath the Alpine orogen from high-resolution teleseismic tomography. J. Geophys. Res. 2003, 108, 2376. [Google Scholar] [CrossRef]
- Oncescu, M.C.; Burlacu, V.; Anghel, M.; Smalbergher, V. Three dimensional P-wave velocity image under the Carpathian Arc. Tectonophysics 1984, 106, 305–319. [Google Scholar] [CrossRef]
- Popovici, A.M.; Sethian, J.A. 3-D imaging using higher order fast marching traveltimes. Geophysics 2002, 67, 604–609. [Google Scholar] [CrossRef]
- Rawlinson, N.; Sambridge, M. Seismic traveltime tomography of the crust and lithosphere. Adv. Geophys. 2003, 46, 81–198. [Google Scholar]
- Rawlinson, N.; Houseman, G.A.; Collins, C.D.N. Inversion of seismic refraction and wide-angle reflection traveltimes for 3-D layered crustal structure. Geophys. J. Int. 2001, 145, 381–401. [Google Scholar] [CrossRef]
- Seber, D.; Barazangi, M.; Tadili, B.A.; Ramdani, M.; Ibenbrahim, A.; Ben Sari, D. Three-dimensional upper mantle structure beneath the intraplate Atlas and interplate Rif mountains of Morocco. J. Geophys. Res. 1996, 101, 3125–3138. [Google Scholar] [CrossRef]
- Tao, K.; Niu, F.; Ning, J.; Chen, Y.J.; Grand, S.; Kawakatsu, H.; Tanaka, S.; Obayashi, M.; Ni, J. Crustal structure beneath NE China imaged by NECESS Array receiver function data. Earth Planet. Sci. Lett. 2014, 398, 48–57. [Google Scholar] [CrossRef]
- Achauer, U. New ideas on the Kenya rift based on the inversion of the combined dataset of the 1985 and 1989/90 seismic tomography experiments. Tectonophysics 1994, 236, 305–329. [Google Scholar] [CrossRef]
- Nolet, G. Quantitative seismology, theory and methods. Earth-Sci. Rev. 1981, 17, 296–297. [Google Scholar] [CrossRef]
- Aki, K.; Christoffersson, A.; Husebye, E.S. Three-dimensional seismic structure of the lithosphere under Montana Lasa. Bull. Seismol. Soc. Am. 1976, 66, 501–524. [Google Scholar]
- Thomson, C.J.; Gubbins, D. Three-dimensional lithospheric modelling at NORSAR: Linearity of the method and amplitude variations from the anomalies. Geophys. J. Int. 1982, 71, 1–36. [Google Scholar] [CrossRef]
- Owens, T.J.; Zandt, G.; Taylor, S.R. Seismic evidence for an ancient rift beneath the Cumberland Plateau, Tennessee: A detailed analysis of broadband teleseismic P-waveforms. J. Geophys. Res. 1984, 89, 7783–7795. [Google Scholar] [CrossRef]
- Papazachos, C.; Nolet, G. P and S deep velocity structure of the Hellenic area obtained by robust nonlinear inversion of travel times. J. Geophys. Res. Solid Earth 1997, 102, 8349–8367. [Google Scholar] [CrossRef]
- Parsons, T.; Zoback, M.L. Three-dimensional upper crustal velocity structure beneath San Francisco Peninsula, California. J. Geophys. Res. 1997, 102, 5473–5490. [Google Scholar] [CrossRef]
- Parsons, T.; McCarthy, J.; Kohler, W.M.; Ammon, C.J.; Benz, H.M.; Hole, J.A.; Criley, E.E. Crustal structure of the Colorada Plateau, Arizona: Application of ew long-offset seismic data analysis techniques. J. Geophys. Res. 1996, 101, 11173–11194. [Google Scholar] [CrossRef]
- Pearson, F. Map Projections: Theory and Applications; CRC Press: Boca Raton, FL, USA, 1990. [Google Scholar]
- Lutter, W.J.; Nowack, R.L. Inversion for crustal structure using reflections from the PASSCAL Ouachita experiment. J. Geophys. Res. 1990, 95, 4633–4646. [Google Scholar] [CrossRef]
- Lutter, W.J.; Nowack, R.L.; Braile, L. Seismic imaging of upper crustal structure using travel times from the PASSCAL Ouachita experiment. J. Geophys. Res. 1990, 95, 4621–4631. [Google Scholar] [CrossRef]
- Ma, J.; Tian, Y.; Liu, C.; Zhao, D.; Feng, X.; Zhu, H. P-wave tomography of Northeast Asia: Constraints on the Western Pacific plate subduction and mantle dynamics. Phys. Earth Planet. Inter. 2017, 274, 105–126. [Google Scholar] [CrossRef]
- Zhao, D.P.; Lei, J.S.; Tang, R.S. Origin of Changbai Mountain volcano in Northeast China: Evidence of seismic tomography. Chin. Sci. Bull. 2004, 49, 1401–1408. [Google Scholar] [CrossRef]
- Tian, Y.; Zhu, H.; Zhao, D.; Liu, C.; Feng, X.; Liu, T.; Ma, J. Mantle transition zone structure beneath the Changbai volcano: Insight into deep slab dehydration and hot upwelling near the 410-km discontinuity. J. Geophys. Res. Solid Earth 2016, 121, 5794–5808. [Google Scholar] [CrossRef]
- Zhang, F.X.; Wu, Q.J.; Li, Y.H. The travel time tomography study by teleseismic P wave data in the Northeast China area. Chin. J. Geophys. 2013, 56, 2690–2700. [Google Scholar] [CrossRef]
- Tang, Y.; Obayashi, M.; Niu, F.; Grand, S.P.; Chen, Y.J.; Kawakatsu, H.; Tanaka, S.; Ning, J.; Ni, J.F. Changbaishan volcanism in northeast China linked to subduction-induced mantle upwelling. Nat. Geosci. 2014, 7, 470–475. [Google Scholar] [CrossRef]
- Wilde, S.A. Final amalgamation of the Central Asian Orogenic Belt in NE China: Paleo-Asian Ocean closure versus Paleo-Pacific plate subduction—A review of the evidence. Tectonophysics 2015, 662, 345–362. [Google Scholar] [CrossRef]
- Sethian, J.A. Level Set Methods and Fast Marching Methods; Cambridge Univ. Press: New York, NY, USA, 1999. [Google Scholar]
- Rawlinson, N.; Sambridge, M. Wavefront evolution in strongly heterogeneous layered media using the Fast Marching Method. Geophys. J. Int. 2004, 156, 631–647. [Google Scholar] [CrossRef]
- Rawlinson, N.; Houseman, G.A.; Collins, C.D.; Drummond, B.J. Drummond New evidence of Tasmania’s tectonic history from a novel seismic experiment. Geophys. Res. Lett. 2001, 28, 3337–3340. [Google Scholar] [CrossRef]
- Zhao, D.; Hasegawa, A.; Kanamori, H. Deep structure of Japan subduction zone as derived from local, regional, and teleseismic events. J. Geophys. Res. Solid Earth 1994, 99, 22313–22329. [Google Scholar] [CrossRef]
- Wei, W.; Zhao, D.; Xu, J.; Wei, F.; Liu, G. P and S wave tomography and anisotropy in Northwest Pacific and East Asia: Constraints on stagnant slab and intraplate volcanism. J. Geophys. Res. Solid Earth 2015, 120, 1642–1666. [Google Scholar] [CrossRef]
- Liu, Z.; Huang, J.; Yao, H. Anisotropic Rayleigh wave tomography of Northeast China using ambient seismic noise. Phys. Earth Planet. Inter. 2016, 256, 37–48. [Google Scholar] [CrossRef]
© 2020 by the authors. Licensee MDPI, Basel, Switzerland. This article is an open access article distributed under the terms and conditions of the Creative Commons Attribution (CC BY) license (http://creativecommons.org/licenses/by/4.0/).