Article

Spatial-Temporal Variation Characteristics of Vertical Dust Flux Simulated by WRF-Chem Model with GOCART and AFWA Dust Emission Schemes (Case Study: Central Plateau of Iran)

by
Tayyebeh Mesbahzadeh
1,*,
Ali Salajeghe
1,
Farshad Soleimani Sardoo
1,2,
Gholamreza Zehtabian
1,
Abbas Ranjbar
3,
Mario Marcello Miglietta
4,
Sara Karami
3 and
Nir Y. Krakauer
5,*
1
Department of Reclamation of Arid and Mountain Regions, University of Tehran, Tehran 1417414418, Iran
2
Academic Staff at Department of Natural Engineering, University of Jiroft, Kerman 786716116, Iran
3
Atmospheric Science & Meteorological Research Center, Tehran 1497713677, Iran
4
Institute of Atmospheric Sciences and Climate of the Italian National Research Council (ISAC-CNR), Corso Stati Uniti 4, 4-35127 Padova, Italy
5
Department of Civil Engineering, The City College of New York, New York, NY 10031, USA
*
Authors to whom correspondence should be addressed.
Appl. Sci. 2020, 10(13), 4536; https://doi.org/10.3390/app10134536
Submission received: 7 May 2020 / Revised: 19 June 2020 / Accepted: 21 June 2020 / Published: 30 June 2020

Abstract

:

Featured Application

Identify of dust hotspots.

Abstract

Dust and sand storms are among the major threats to central Iran. These phenomena pose irreparable risks to natural ecosystems and human societies, including effects on health. In this study, the spatial and temporal pattern of vertical dust flux (VDF) was used to identify dust sources as well as areas with high potential for dust generation. To simulate VDF, two intense dust storms, from 21 February 2015 and 14 February 2018, were selected using synoptic data and Moderate Resolution Imaging Spectroradiometer (MODIS) images. These dust storms were identified as responsible for a reduction of horizontal visibility to less than 1000 m, using remote sensing tools and Ackerman Dust Index. MODIS images show that these two storms covered most of Central Plateau of Iran. The Weather Research and Forecasting model with chemistry (WRF-Chem) was used to simulate the storms, with either the Global Ozone Chemistry Aerosol Radiation and Transport (GOCART) or Air Force Weather Agency (AFWA) scheme to calculate VDF. Modeled vertical dust fluxes in both events indicate that the Arabian deserts in Saudi Arabia and in southwestern Iran can be identified as main sources of the dust in the central Iranian plateau. The other source of dust is the Hirmand Basin, located in the country of Afghanistan and in the southeast of Iran. The results of VDF simulations indicate that central southeast Iran could be the main dust source of internal origin. Additionally, over seasonal wetlands in Iran, the amount of VDF was simulated to be sometimes over 4000 μg/(m2s), an indication that these areas are sensitive to wind erosion in dry conditions and can be a source of dust. The WRF-Chem results were compared with the horizontal visibility measured in synoptic stations in the area. The results showed that the coefficients of determination of GOCART results with the measured horizontal visibility on 21 February 2015 and 14 February 2018 were 0.72 and 0.76, respectively, while the coefficient values from the simulations with AFWA scheme on 21 February 2015 and 14 February 2018 with the measured horizontal visibility were lower, 0.44 and 0.50, respectively. Modern-Era Retrospective analysis for Research and Applications, version 2 (MERRA2) re-analysis data also showed timing of peak dust levels consistent with the GOCART scheme.

1. Introduction

Dust particles are among the air pollutants that have a significant impact on the radiation budget [1]. They can also reduce air quality and threaten human health [2], and drastically limit horizontal visibility [3,4]. Dust is generated as a result of wind erosion in arid and semi-arid regions. Since Iran is located in the arid belt of the world (approximately 88% of Iran is arid or semi-arid [5]), wind erosion is one of the most important processes of land degradation and landscape change there [6,7,8]. Dust emission occurs in widespread events that are variable in size, time, and particle concentration [9].
Iran is a country with an average annual rainfall of about 243 mm. Most of the country has a dry or semi-arid climate, which has created dry deserts. The deserts of Loot and Kavir are the most important of them. Low rainfall, high evaporation and, as a result, limited soil moisture and poor vegetation are prominent features of these areas. These conditions make the area prone to wind erosion. Wind erosion involves the separation, transfer, and deposition of soil particles by erosive winds [10,11]. Soil drought, lack of vegetation and erosive winds are the main causes of wind erosion, which is more likely to occur in dry and sparsely vegetated areas. Therefore, the dust phenomenon is one of the most important natural hazards of the Central Plateau of Iran. In case of suitable meteorological and hydrological conditions, conditions for dust storms will be promoted.
Numerical prediction models have been designed to simulate dust emissions. Dust storm prediction models have been used operationally in Europe [12], Australia [13], and East Asia [14,15,16,17]. At the U.S. Naval Research Laboratory, the U.S. Navy Mesoscale Prediction System’s Coupled Ocean–Atmospheric Mesoscale Prediction System (COAMPS), with an embedded dust aerosol model [18], has produced three-day forecasts for southwest Asia in real-time runs since March 2003. Due to the climatic and environmental importance of soil dust, considerable efforts have been devoted to simulating the production and transport of soil dust aerosols at regional and global scales [18,19,20,21]. Shao [22] emphasizes a mechanistic model of forces acting on dust particles to predict dust flux. Additionally, Liu et al. [18] used satellite data and horizontal visibility to validate the results of the numerical model of dust prediction.
One such model that is able to simulate dust particle transport and its feedbacks simultaneously with meteorological fields is the Weather Research and Forecasting model coupled to Chemistry chemistry (WRF-Chem) model [23,24]. Extensive studies have been carried out using WRF-Chem. Nabavi et al. [25] examined the sensitivity of WRF-Chem to dust emissions in order to determine dust sensitive areas in West Asia. The results showed that the tested implementation of WRF-Chem was skillful in some regions (Iraq and Syria). Su and Fang [26] examined the response of dust transport in WRF-Chem to dust flux as well as land surface characteristics in predicting the sources of dust in East Asia. Xiaolan and Hongsheng [27] investigated the effects of soil moisture on sand leakage and dust emission observed in Hur Qian sandy lands in China, and Rizza et al. [28] investigated several dust events in the central Mediterranean region of Apulia (southeastern Italy) in order to assess the sensitivity of WRF-Chem to land surface models. Song et al. [29] used the WRF-Chem model to simulate dust emission and evaluate its relationship with climate change in East Asia. Teixeira et al. [30] used WRF-Chem to investigate its sensitivity to vertical resolution during a 22–23 June 2012 dust event over North Africa; results indicated that the model was able to transport particles from the ground to higher layers. Tang et al. [31] examined the spatial and temporal characteristics of dust events and their contribution to the budget of aerosols in Eastern Asia, using WRF-Chem and a parametric tool for dust analysis. The results showed that dust loadings peaked in the afternoon and in summer. Chen et al. [32] simulated dust concentration in East Asia during summer 2010 using WRF-Chem. Additionally, Alizadeh-Choobari et al. [33] used WRF-Chem to show that the direct radiative effects of airborne mineral dust reduce the surface temperature, but warm upper air layers. Additionally, Alizadeh-Choobari et al. [34] used WRF-Chem to model the 120-day wind and dust storm activity pattern over Iran’s Sistan Basin.
Several schemes are available to simulate dust emissions depending on different input parameters. Each of these schemes parameterizes wind erosion in different ways. One of the wind erosion schemes that are widely used to predict dust particles is the Georgia Institute of Technology—Goddard Global Ozone Chemistry Aerosol Radiation and Transport (GOCART) model [19,35]. Another widely used wind erosion scheme is the Air Force Weather Agency (AFWA) model [25,36,37,38].
WRF-Chem is an extended version of the WRF model, which includes a chemistry component [23] and has been widely used to study dust impacts on local to regional scales [39,40,41,42,43,44,45] studies have demonstrated the suitability of the WRF-Chem model to simulate the desert dust cycle [25,32]. However, attention must be paid to the chosen land surface model [28] model vertical resolution [30] and particulate matter distribution [46].
The global erodibility map developed by Ginoux et al. [19] is the only one available by default for dust simulations in WRF/Chem. Such a map works well on large-scale regions (i.e., Sahara Desert, Arabian peninsula) [34]. Zhao et al. [43] investigated the sensitivity of the WRF-Chem simulated dust radiative forcing to dust emission and aerosol schemes. Additionally, modeling of the effect of mineral dust on the wind profile and near-surface wind speed was carried out WRF-Chem model [33].
Additionally, Kargar et al. [47] used the WRF-Chem model to numerically simulate extreme dust storms in eastern Iran. Farhadipoue et al. [48] studied the severe dust storms in west and southwest Iran by the WRF-Chem model. Model outputs showed the good performance of WRF-Chem in simulating the spatial distribution of dust.
In the present study, the most severe dust storms in Iran, which reduced horizontal visibility to less than 1000 m, were selected using data from synoptic stations of the region. Subsequently, these dust storms were evaluated using Moderate Resolution Imaging Spectroradiometer (MODIS) images and the Ackerman index. Then, using the WRF-Chem model and the GOCART and AFWA wind erosion schemes, the spatial and temporal pattern of vertical dust flux and of surface dust concentration were studied and compared with time series of visibility at the surface. The goal of this work is to accurately simulate such severe dust storms in order to determine the external and internal dust sources relevant for these events in Iran. The paper is organized as follows. Materials and methods are presented in Section 2. Results are given in Section 3, while Discussion and Conclusions are drawn in Section 4.

2. Materials and Methods
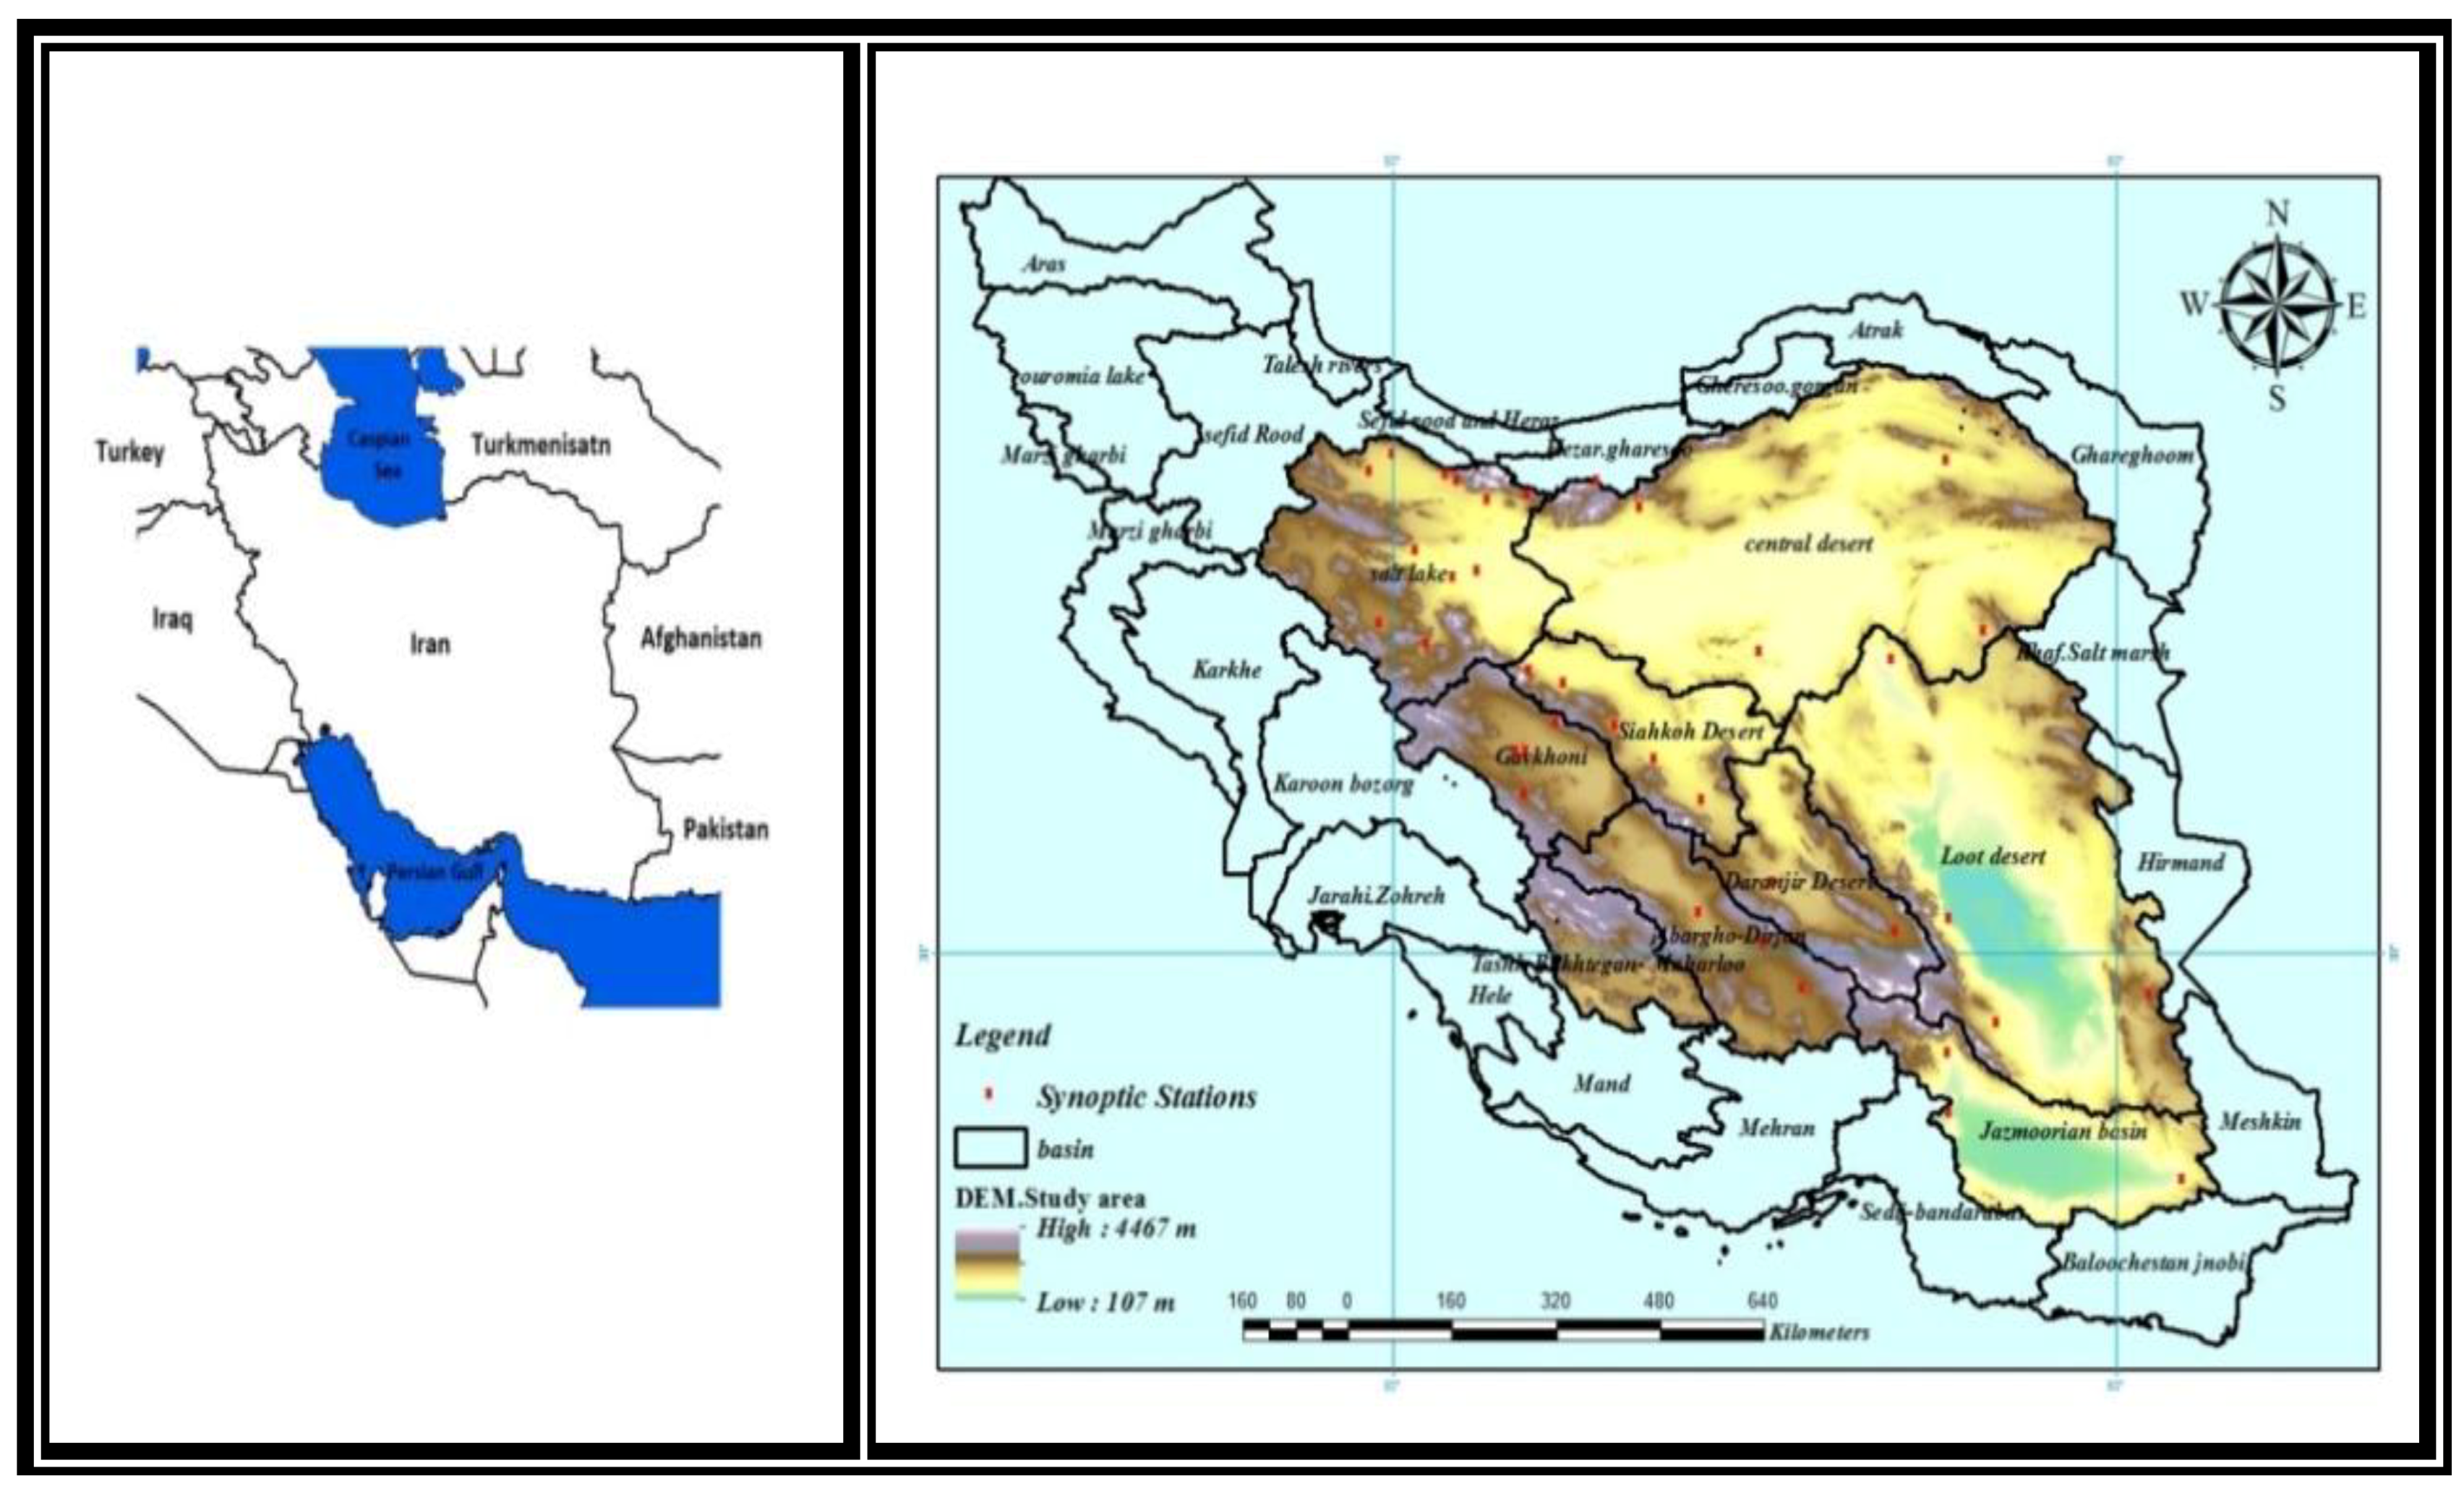
2.1. Study Area

The Central Plateau is Iran’s largest basin, accounting for most of the country’s area and consisting of nine sub-basins, including Loot desert, Central Desert, Jazmoorian, Govkhooni, Salt Lake, Siahkoh Desert, Daranjir Desert, Abargho Desert and Tashk Bakhtegan Maharloo. Rainfall in this area is very low, with an annual average less than 100 mm, and locally as low as 25 mm. On the other hand, the potential evaporation rate in this area is high and in many places it reaches more than 4000 mm/year. As such, the potential evaporation can be as high as 40 to 80 times the annual precipitation [49]. The average relative humidity of the Central Plateau plains is around 30% to 40%, and declines to 15% during the warm season. The mean annual temperature varies between 15 and 30 °C, and the reported maximum and minimum temperatures are 51 and −18 °C, respectively [50].
One of the most common natural events in these areas is dust storms, which can be of external or internal origin. Dust storms of foreign origin originate mostly in the Arabian deserts (Iraq, Syria, and Saudi Arabia), the Qareqoom desert in Turkmenistan. The Hirmand Basin in eastern Iran is an internal dust source, and Sistan’s 120-day storms could also activate the deserts of Loot and Kavir as sources of internal dust.
Most of the dust storms in this region occur in the spring, and the months of June, July, and May show the highest number of dust days [51,52].
In Figure 1, synoptic stations with data on horizontal visibility during dust storms are shown, as well as the geographical location of the main basins.

2.2. Selecting Dust Events

Meteorological codes from 36 synoptic stations were used to select the extreme dust events. Meteorological codes were examined from 2006 to 2018, and the storms with the widest (Dust-associated codes recorded at the most stations), most severe (Severe decrease in horizontal visibility at the synoptic station (below 1000 or below 500 m)), and longest stay (Number of hours or days of dust observed at the stations based on meteorological codes) in the study area were selected. The information on the meteorological codes of synoptic stations is also shown in Table 1.

2.2.1. Synoptic Data

In order to detect and identify dust events, one may use remote sensing technology and synoptic station data. In this research, first, severe dust storms with horizontal visibility less than 1000 m were selected using synoptic data. In this study, 36 synoptic stations located in the study area were used. Table 2 shows information about the synoptic stations.

2.2.2. MODIS Data

Next, MODIS satellite images and tools for analyzing the remote sensing data were used to map these events. MOD021km Terra Sensor MODIS (36 bands) data were downloaded from website [53]. MODIS Characterization in this study including: Spatial resolution: 1 km, temporal resolution: 5 min, MODIS collection 6.1, possessing level 1B.
For the detection of dust storms, MODIS images were downloaded at desired dates and transformed into HDVI format with ENVI5.1 software (5.1 version, L3harris Geospatial Company, Broomfield, CO, USA, 2013). Geometrical corrections and brightness temperatures of the bands were calculated. After receiving and pre-processing MODIS satellite data, the Brightness Temperature Difference (BTD) method [54] was used to detect the presence of dust. This method considers the brightness temperature difference between band 31 (11 μm) and 32 (12 μm) to detect dust storms; the value of zero is considered as the threshold for dust detection (where values less than 0 K indicate dust).
D = BT31 − BT32;   Dust if < 0 K
In this study, because the Aerosol Optical Depth (AOD) of the region on these dates had many missing values due to the presence of clouds, the Ackerman index was used instead.

2.2.3. Determination of Dust Storm Origin Using HYSPLIT

The Hybrid Single Particle Lagrangian Integrated Trajectory (HYSPLIT) model was designed by [55] and has been upgraded over the past few decades. This model is in fact a dual model for calculating dust motion, scattering, and particle simulation. This model is used to simulate dust trajectories and identify areas of origin as well as areas affected by dust storms. HYSPLIT is one of the most widely used models for atmospheric trajectory and dispersion calculations [56,57]. In this study, HYSPLIT calculations were performed online for the identified two events for 24 h integration periods. HYSPLIT was drives by Global Data Assimilation System (GDAS) meteorological fields, available globally at 0.5-degree resolution for 2007–2019.

2.3. WRF-Chem Model

The third version of the Weather Research and Forecasting model coupled to Chemistry (WRF-Chem V3, National Center for Atmospheric research, Boulder, CO, USA, 2011; https://ruc.noaa.gov/wrf/wrf-chem/) was used here. WRF-Chem is a non-hydrostatic limited-area numerical model, able to simulate both meteorological fields and dust particle transport and their reciprocal feedbacks. It is both a research and operational model, which simulates and predicts the atmospheric concentrations of different gases and particles, taking into consideration natural mechanisms and human activities (pollutants) that affect dust particles of different sizes, considering the ways they are emitted and deposited.

2.3.1. Dust Schemes in WRF-Chem

From version 3.7 onwards, the WRF-Chem model provides a choice of dust schemes. The most important dust schemes in the WRF-Chem model are GOCART, AFWA and University of Cologne (UoC) [22,58,59]. In this study, according to the volume of the study and also according to the previous research [60], GOCART and AFWA schemas were considered suitable for this region. As follows:

GOCART Dust Scheme

In the GOCART scheme, the particle source (S) function is defined as the ratio of erodible soil subject to the wind erosion process:
S = ( z max z i z max z min ) 5
where S can be interpreted as the probability of sediment accumulation at point i of height zi; zmax and zmin are the maximum and minimum elevations in a range of 10° × 10° around the grid point, respectively. Dust particle emission fluxes in the GOCART scheme are defined by the following empirical relationship [61]:
{ F p = C G Ss p U 10 2 ( U 10 U t ) ,   U 10 > U t 0         otherwise
where F p is (μg/m2s) represents the emission flux for size bin p, C G is a dimensionality coefficient (μg s2 m−5), ( C G = 1.2 μg s2 m5), sp is the fraction of each particle size class, S is the source function representing the fraction of alluvium available for wind erosion [41] and U t is a threshold velocity at 10 m, U10 is horizontal wind speed at 10 m, and U t is the threshold velocity (m s−1) below which dust emission does not occur and is a function of particle size, air density and surface moisture [41]. Ginoux et al. [19] suggested that U t u t * , where u t * is a threshold friction velocity, using the formula of [62] and considering the effect of soil moisture.

Dust Scheme AFWA

The parameterization method proposed by Marticorena and Bergametti [62] for the dust emission was implemented as a scheme or dust module (AFWA) by the United States (US) Air Force Meteorological Center in the WRF-Chem model. In the AFWA scheme, the correction factor is applied to u * t as follows:
u * t = u * t ( D p ) f ( moisture ) f ( roughness )
where f (roughness) is a drag partition correction—if f (roughness) is 1, it means the surface is smooth; Value decreases with increasing amounts of large rocks, cobbles, vegetation, etc. f (moisture) is the soil moisture content, and Dp is the particle diameter in bin p. Thus, u * t increases with increasing rockiness, vegetation, and other surface types with high roughness. The f (roughness) value for Southwest Asia is currently set to 1, because the great deserts of Saudi Arabia, Iraq, Syria, Iran, etc. are in this region. Vegetation in these areas is very limited, the land surface is bare and wind erosion systems are active in these areas. For these reasons, the f (roughness)t for these areas is estimated to be 1 (smooth surface). Dust emission is restricted to areas with roughness length Z0 ≤ 5 m (typically barren lands and sparsely vegetated surfaces) [63].
In the AFWA scheme, the dust flux H caused by the saltation process on the bare soil surface is obtained from the relation introduced by Kawamura [64] as follows:
H ( D p ) = C ρ a g u * 3 ( 1 + u * t u * ) ( 1 u * t 2 u * 2 )
where C is an empirical constant (0.129), ρ a is the density of air parcel, (g/cm3), g is the acceleration due to gravity (cm/s2), u * and u * t (in units of cm/s) are, respectively, the friction velocity and the threshold friction velocity. The friction velocity is considered instead of 10 m horizontal wind speed as in the GOCART scheme.
In this scheme, the vertical mass flux of dust is calculated based on Marticorena and Bergametti [62] with a correction coefficient.
F bulk = H α   ×   S α = 10 0.134 ( % clay ) 6
where α is the saltation ratio which increases proportionally to the clay percent of the soil and S is the Dust Source function. Additionally, this equation is only valid for 0% < %(clay) < 20%.

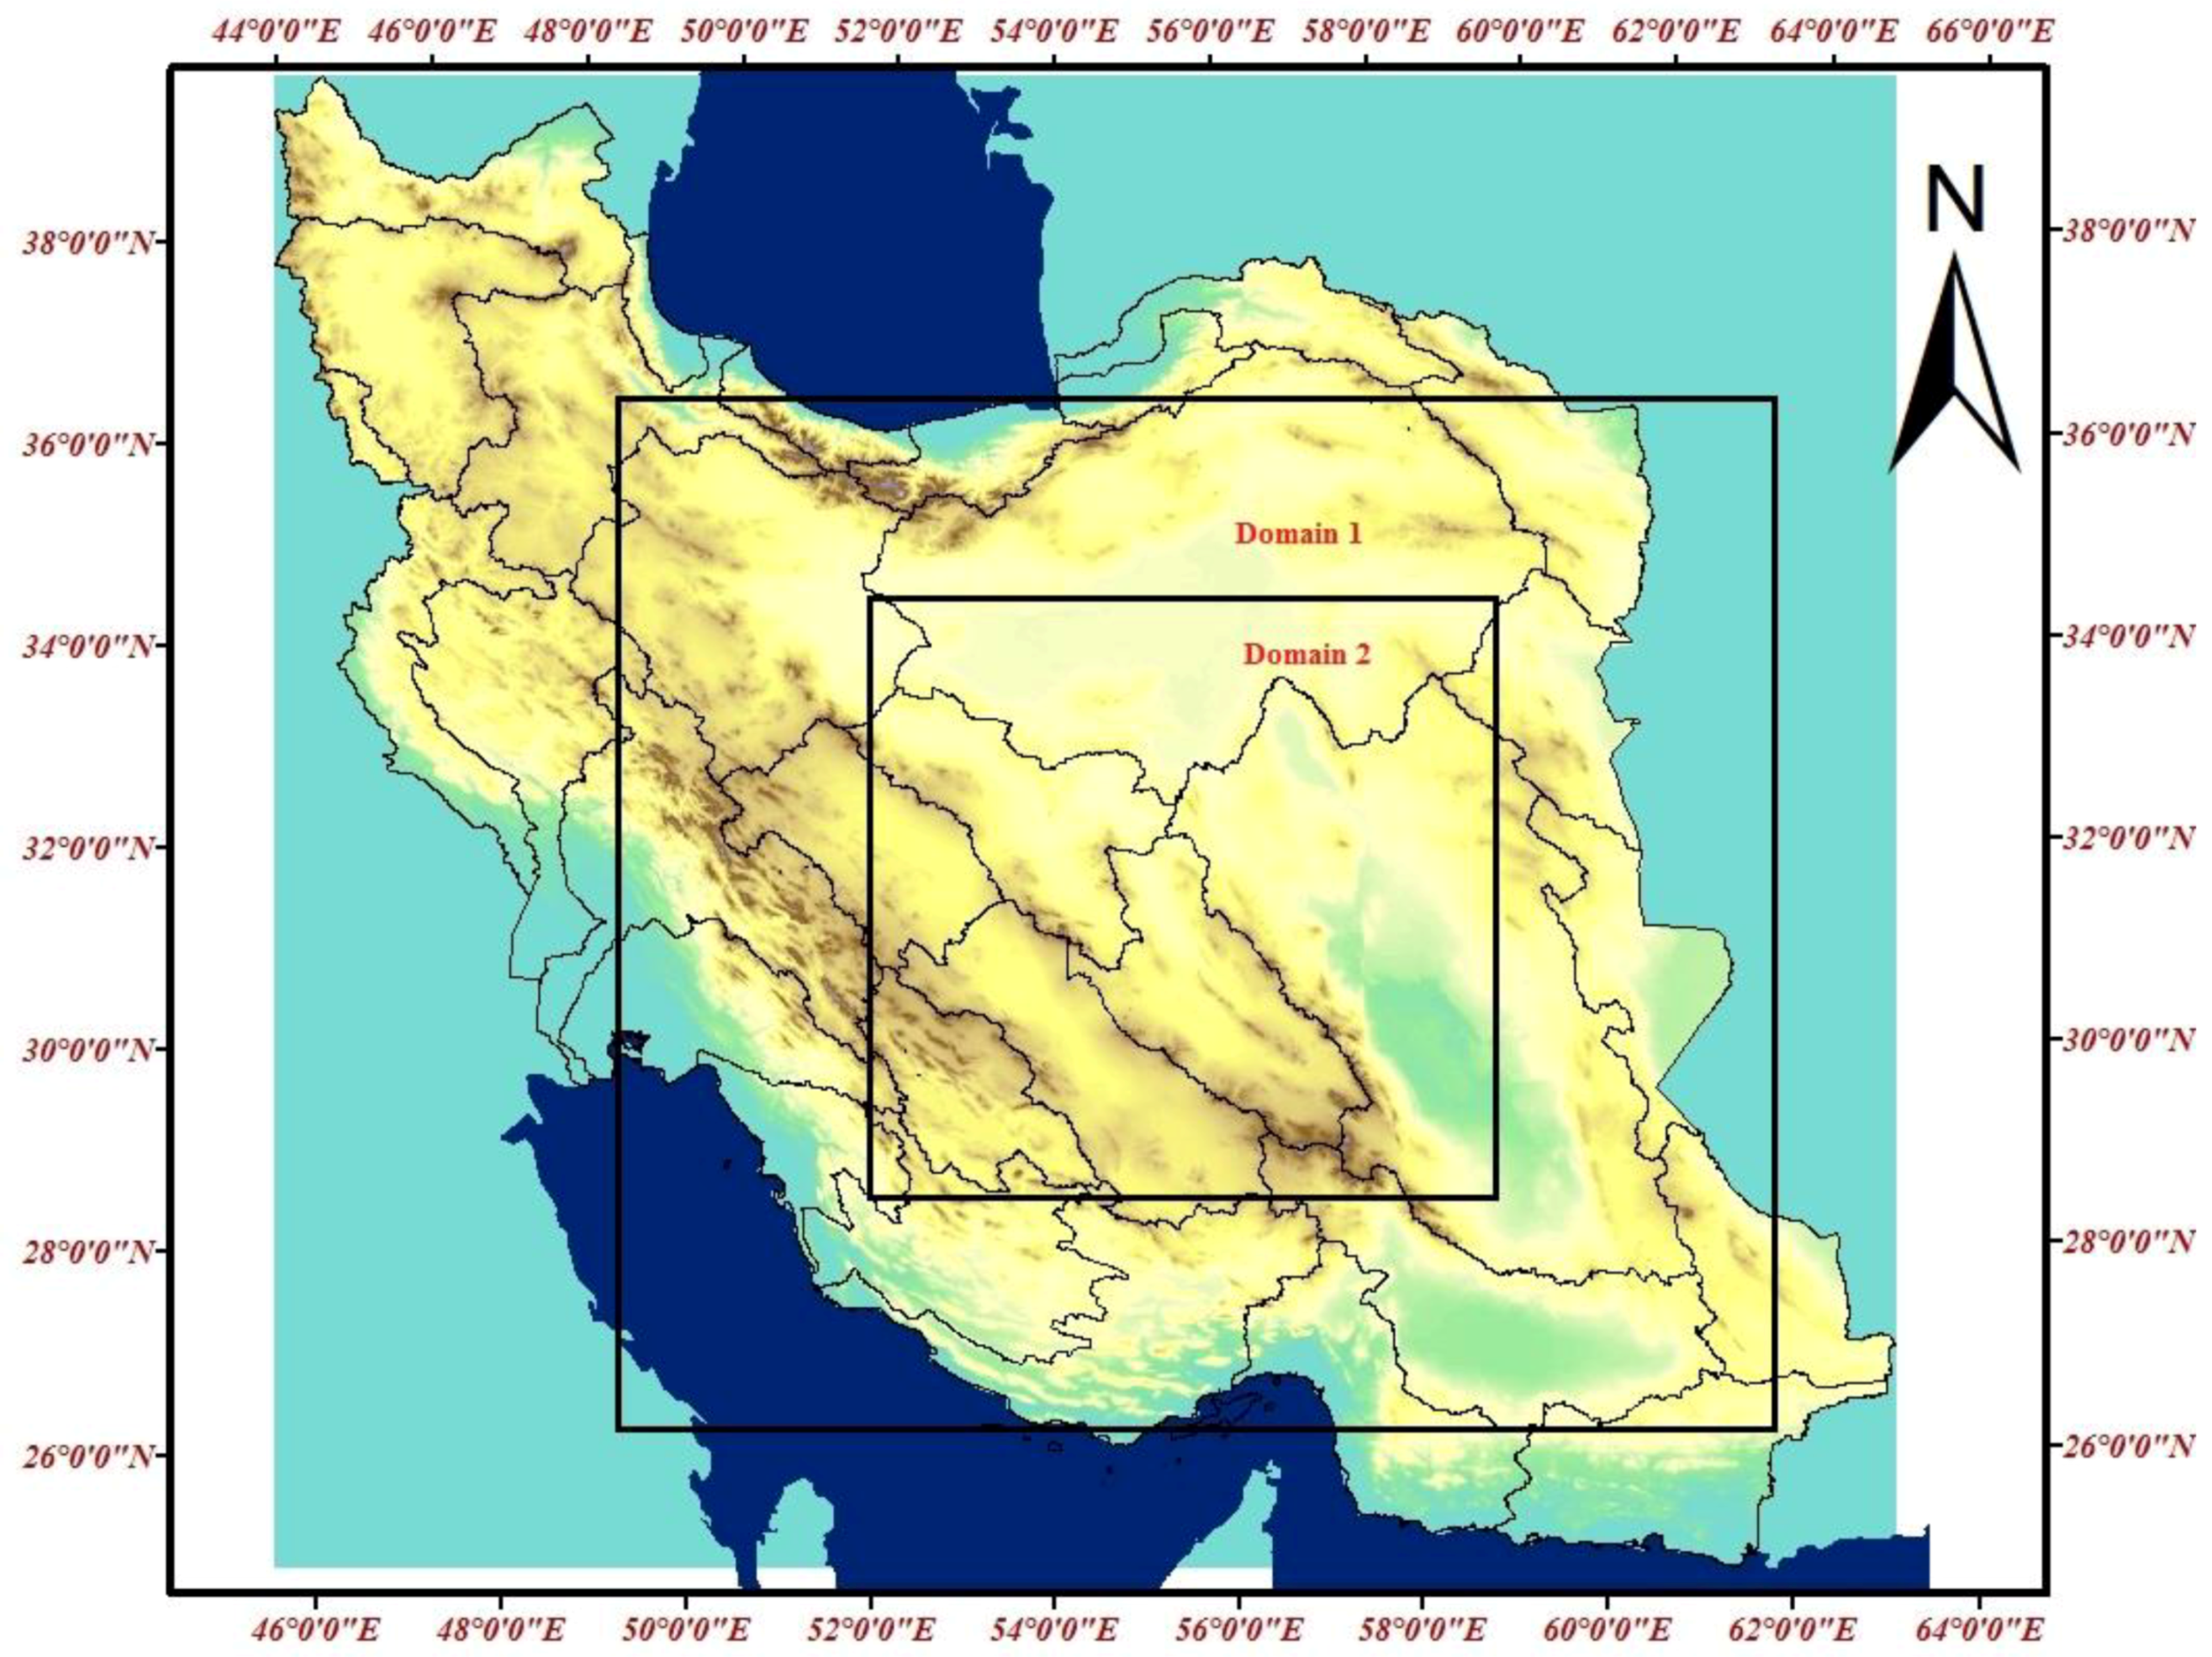
2.3.2. WRF-Chem Model Configuration

In this study, WRF-Chem version 3.9.1 was used to simulate dust storms. Two domains were defined for the model. The first domain was defined in the area with the number of grid points being 90 × 100 and the spacing of 11.2 km. The second domain was defined in the area showed in Figure 2. Initial and boundary conditions were obtained from the National Oceanic and Atmospheric Administration Global Forecast System (NOAA GFS) with horizontal resolution of 0.5° × 0.5° United States Geological Survey (USGS) data were used for static geographic data such as altitude, soil properties, vegetation fraction and land use. Table 3 lists the parameterization schemes used to implement the WRF-Chem model.
Additionally, the distribution of dust particle diameters in WRF-Chem model is shown in Table 4.
To simulate the investigated storms, the model was run starting 24 h before the storm, and the first 3 h of each run were considered as spin-up time. The time interval between networks was 180 s. GFS data with a 6-h time interval was used for initial and boundary conditions. The model output was also saved every 3 h.

2.4. Verification of Results

In this section, the results of GOCART and AFWA wind erosion schemas were validated by comparing observed horizontal visibility with simulated surface concentration. One of the most common methods of validation is the use of the Aerosol Robotic Network (AERONET) [65] and Aerosol Optical Depth (AOD) data. Remote sensing AOD data is not available on the mentioned dates because of the presence of clouds in the area. Additionally, there were no AERONET data in these two dates in the region. Therefore, station observations of horizontal visibility must be used. We also used the Modern-Era Retrospective Analysis for Research and Applications, version 2 (MERRA-2) re-analysis, comparing the surface dust concentration extracted from the schemas with that in MERRA-2 re-analysis data. MERRA-2 is the first long-term global reanalysis to assimilate space-based observations of aerosols and represent their interactions with other physical processes in the climate system [66].

3. Results

3.1. Dust Storm Selectin

For this study, using the values of horizontal visibility, two severe dust storms that occurred in winter were selected. The two cases of 21 February 2015 and 14 February 2018 were detected and simulated. Figure 3 represents the horizontal visibility of some synoptic stations in the study area during the two storms. These two events occurred in very dry winter seasons, during which the rainfall in much of the study area (Central Iranian Plateau) through the day of the event was lower than normal.

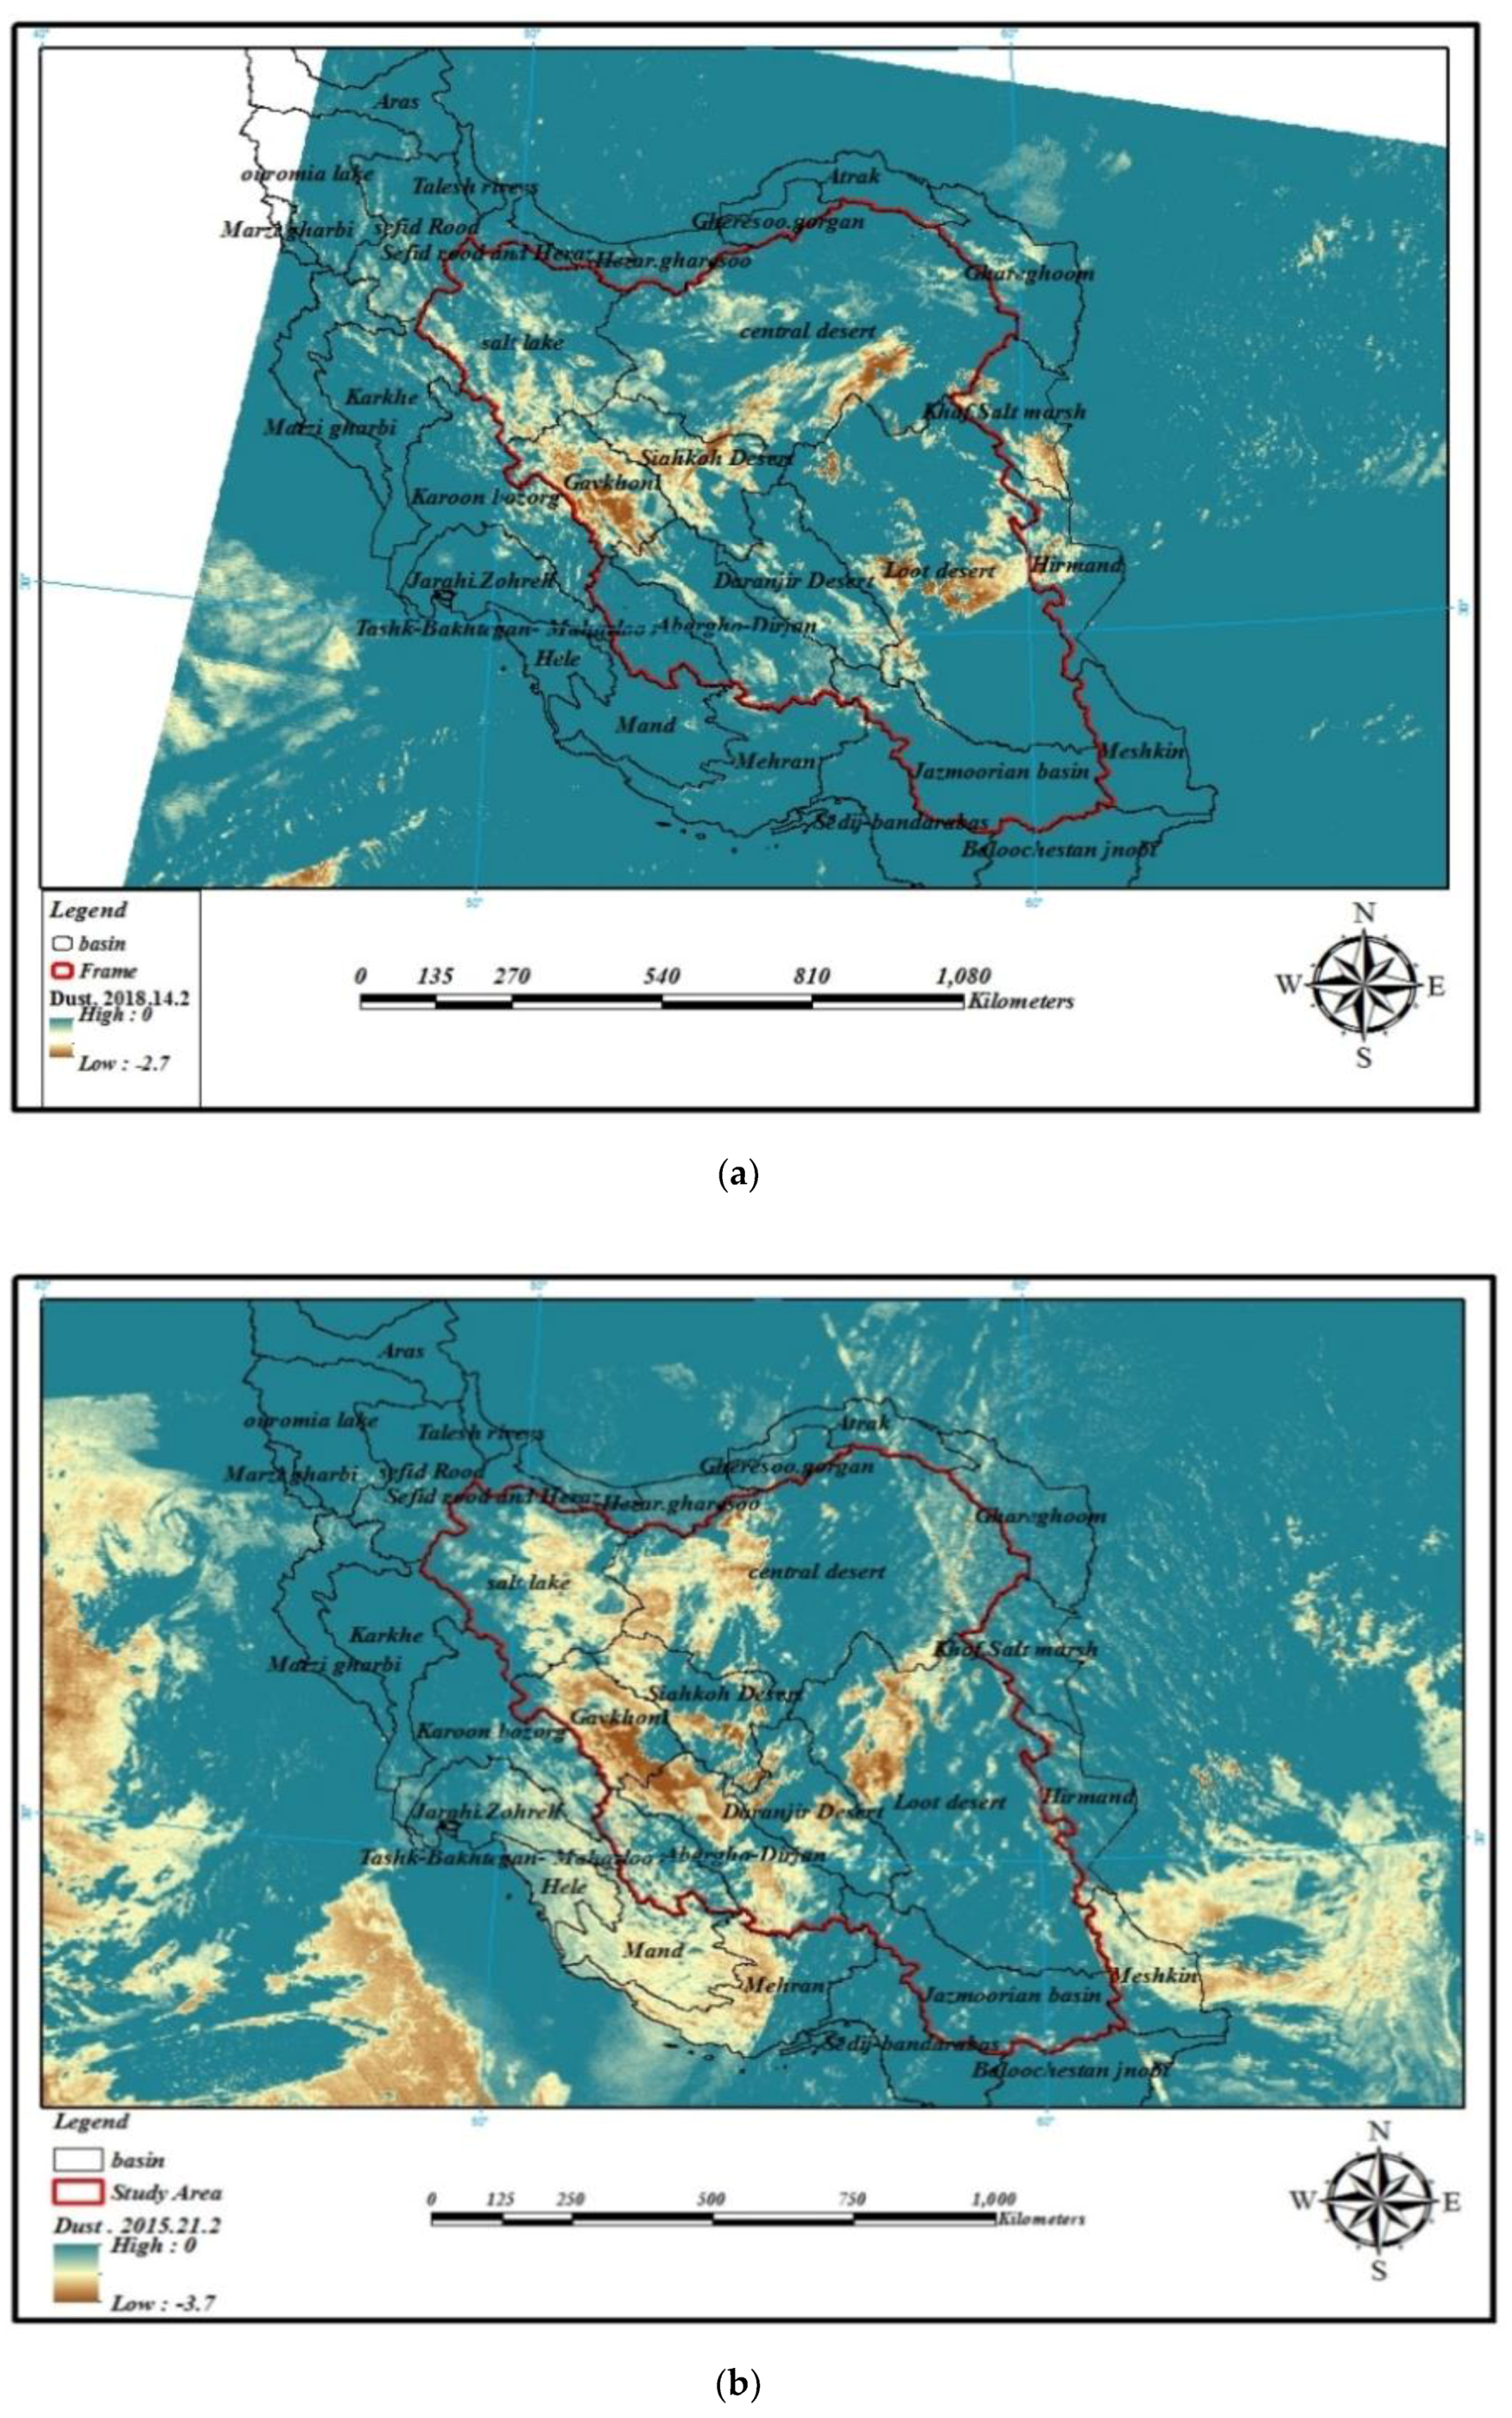
3.2. Detection with MODIS Images

The dust storms of 21 February 2015 and 14 February 2018 were analyzed using the Ackerman index on the MODIS images. The results of the analysis of MODIS images of dust storms are shown in Figure 4.
The MODIS images show that the dust phenomenon occurred on 21 February 2015 and 14 February 2018 in the study area. These images clearly show the spread of dust in the area. The Ackerman index reaches −3.7 on 21 February 2015, indicating the high intensity and volume of dust concentration in the study area. However, this index reaches −2.7 on 14 February 2018, which indicates a lower volume of dust concentration in the Central Plateau region of Iran.
Back trajectory analysis supports the origin of air reaching Central Iran during these days (Figure 5). The results show that Arabian deserts affect Iran’s atmosphere during dust storms. Figure 5 shows that the storm on 21 February 2015 originated in the Arabian Desert, which can be identified as a storm of outside origin. Additionally, the storm of 14 February 2018, which was observed in the eastern stations of the study area, originated from the southwest of Iran (probably the Arabian deserts).

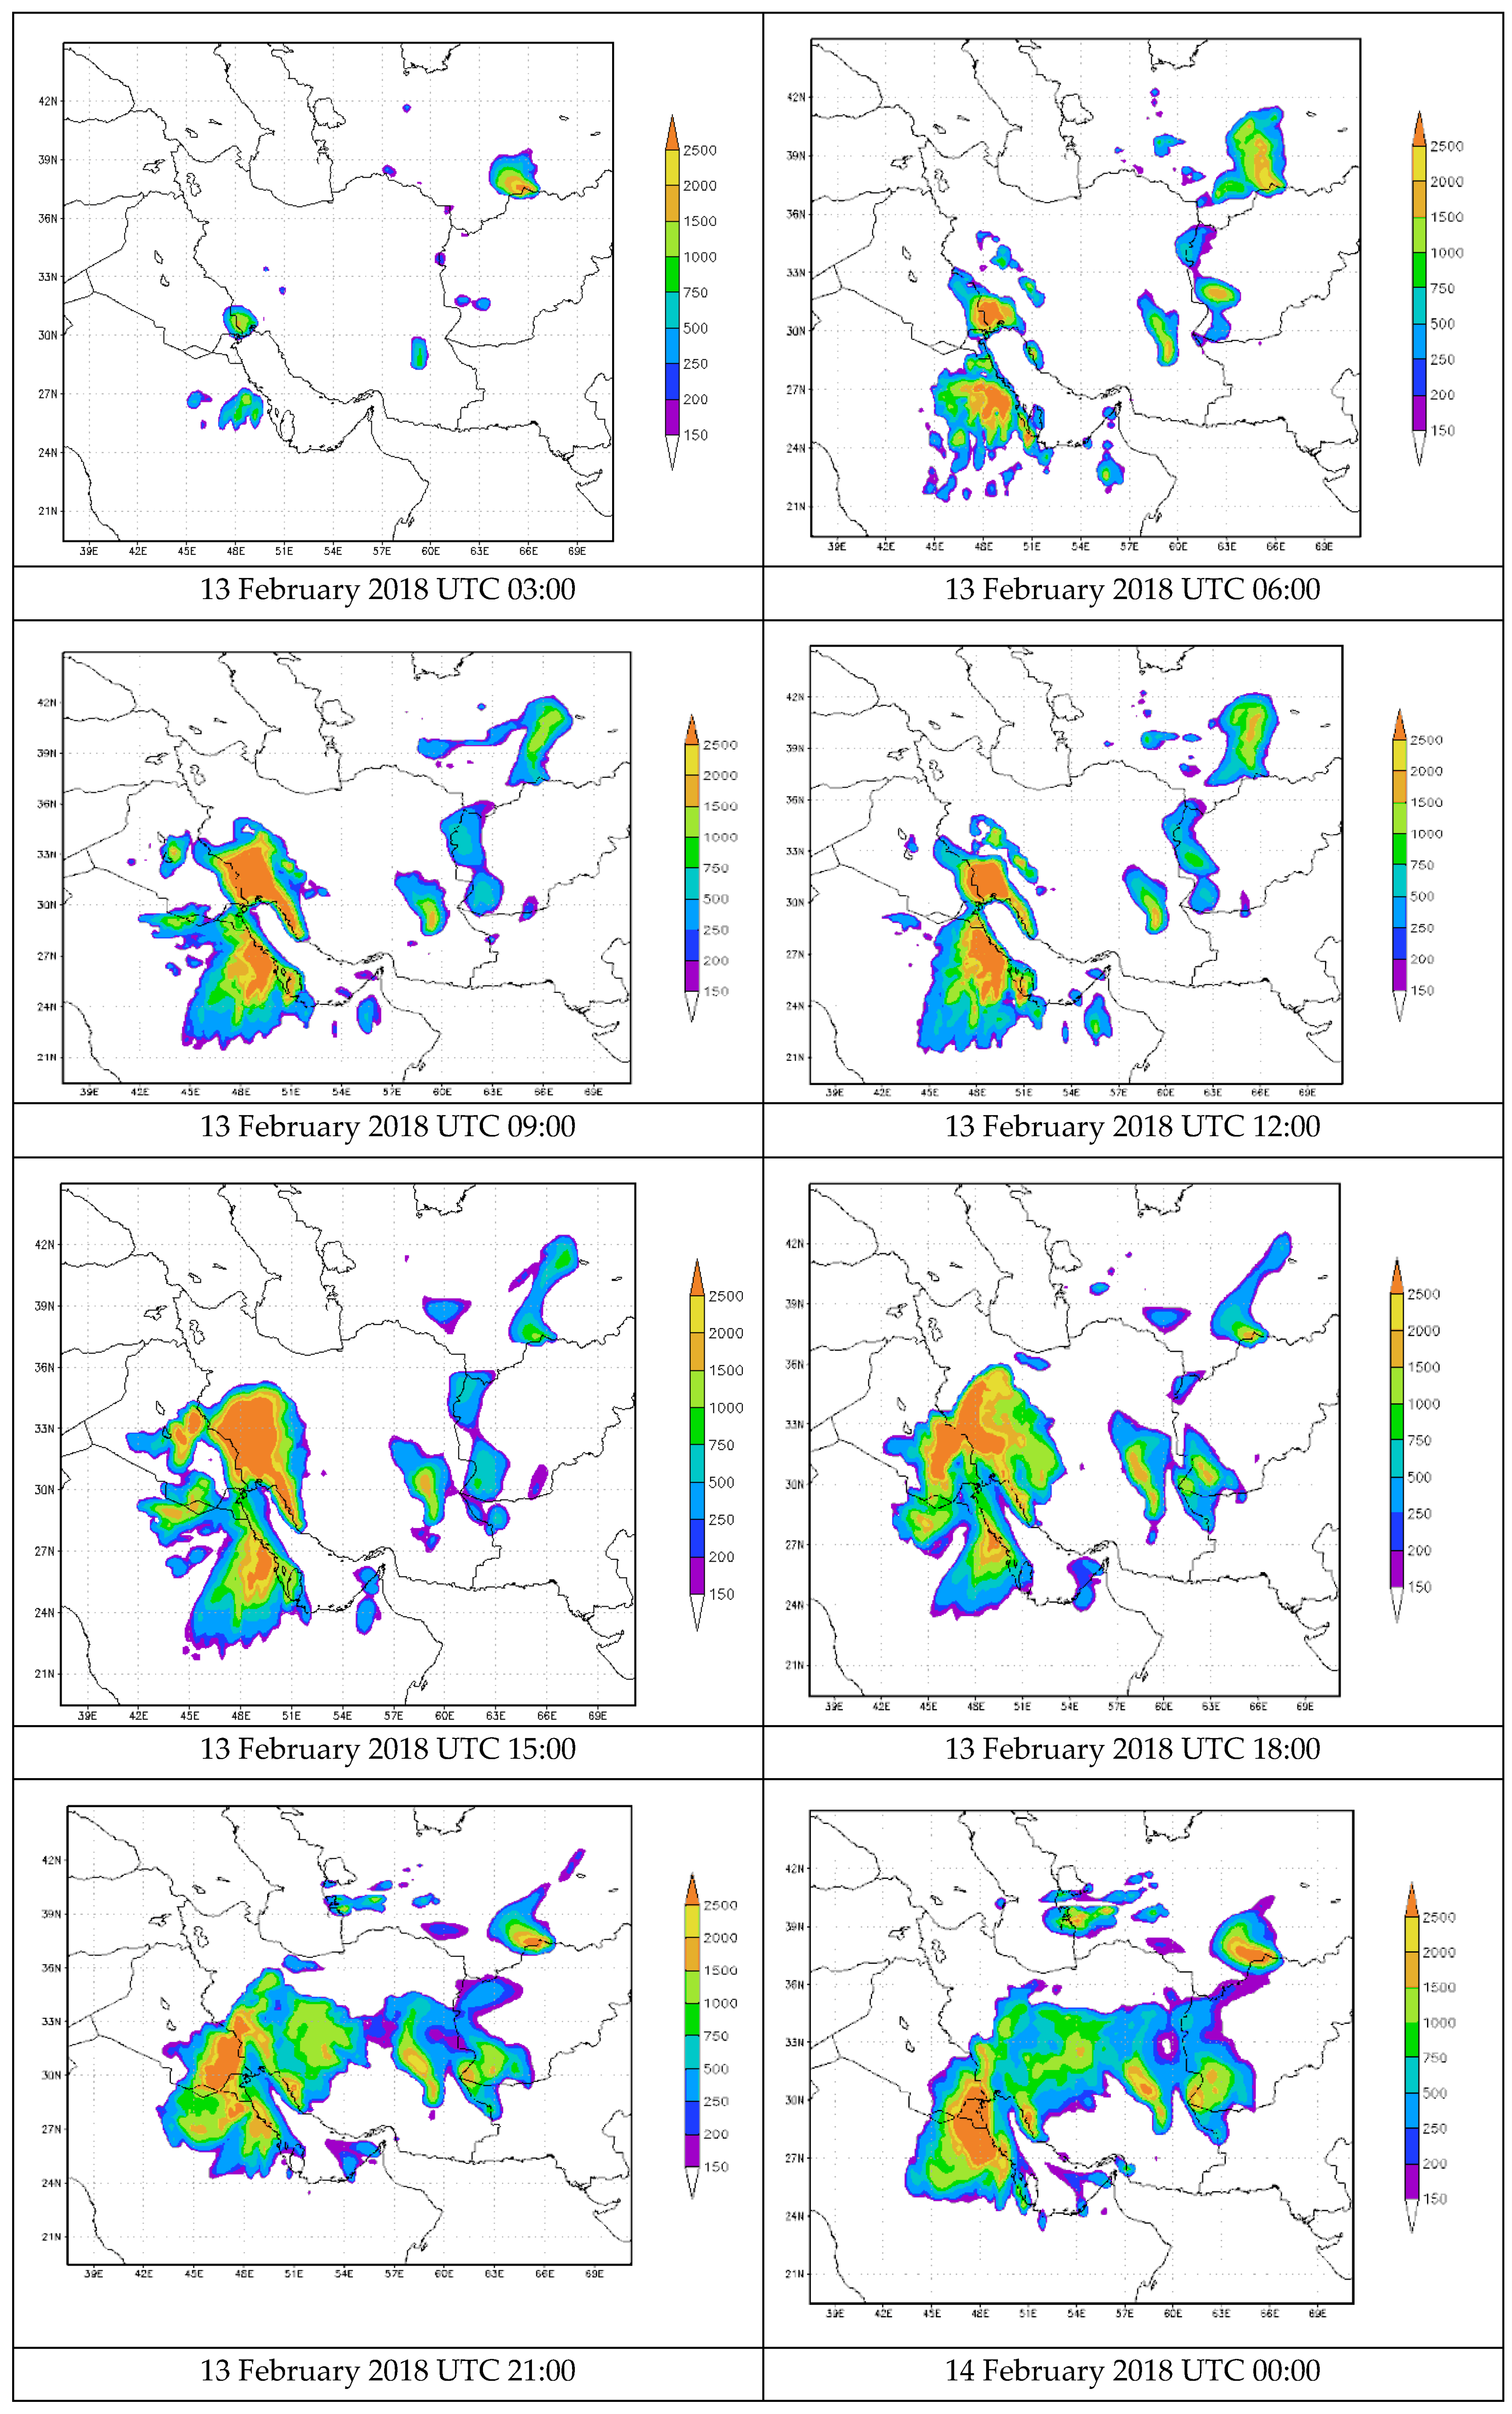
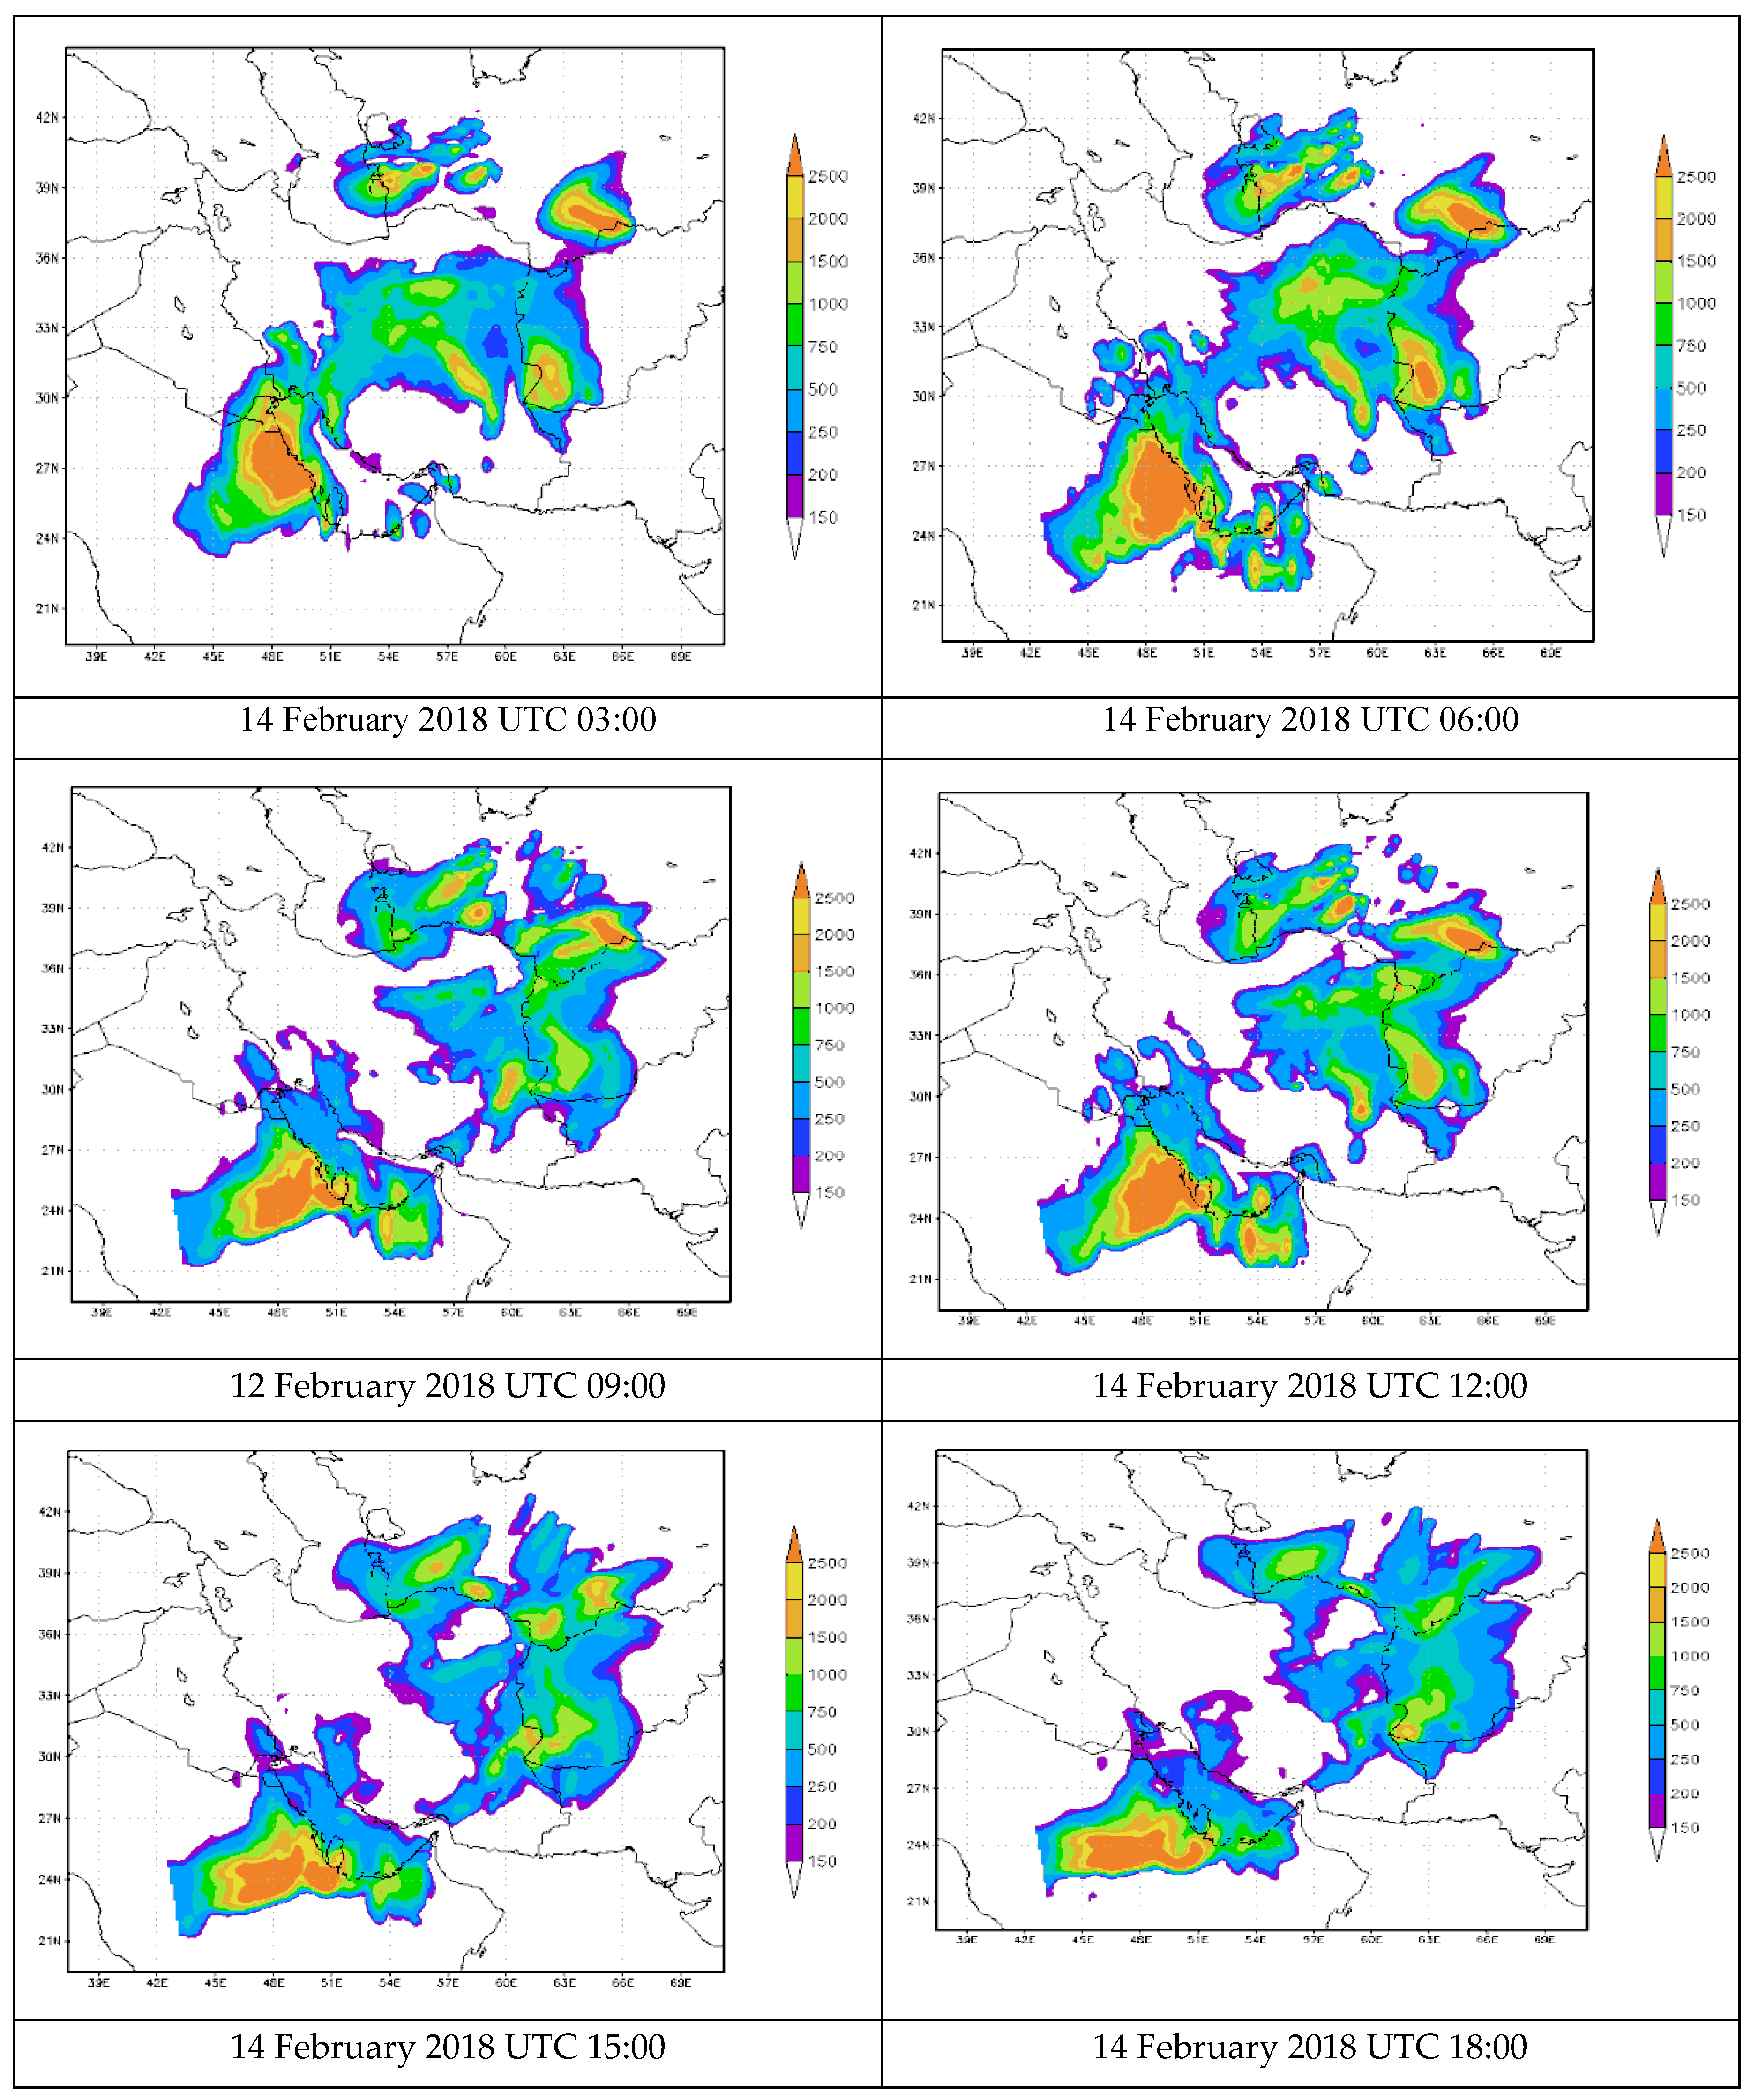
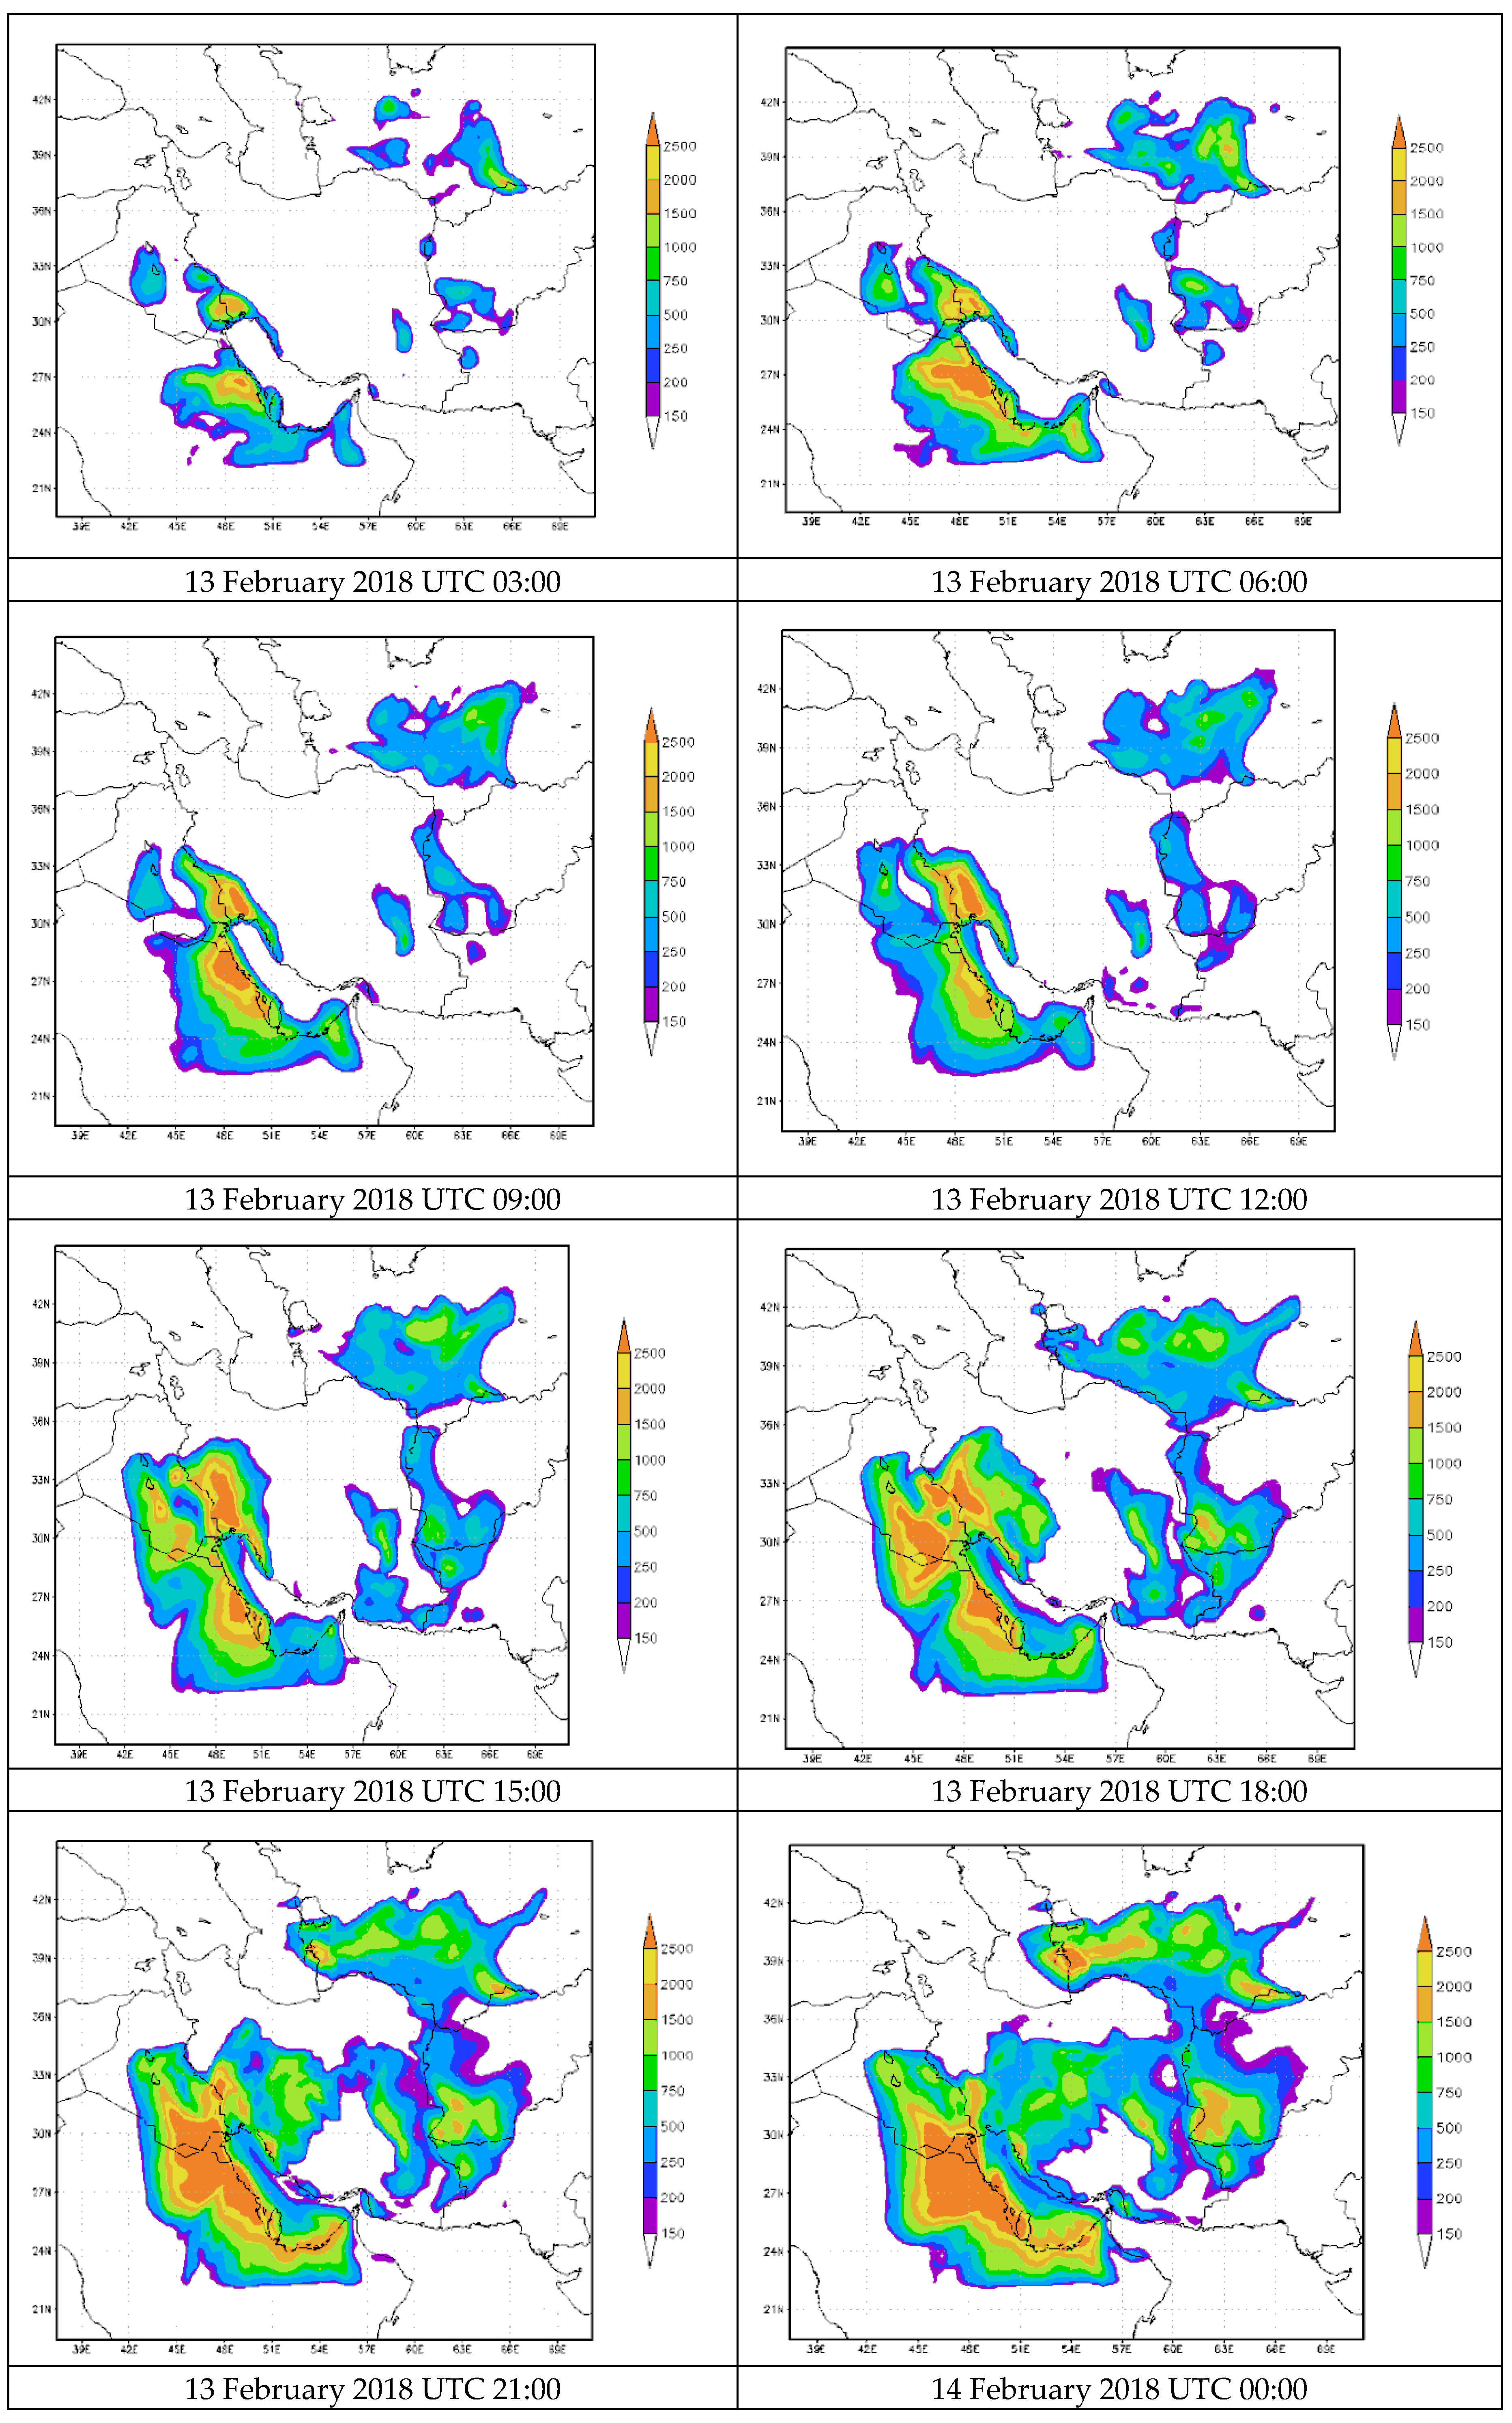
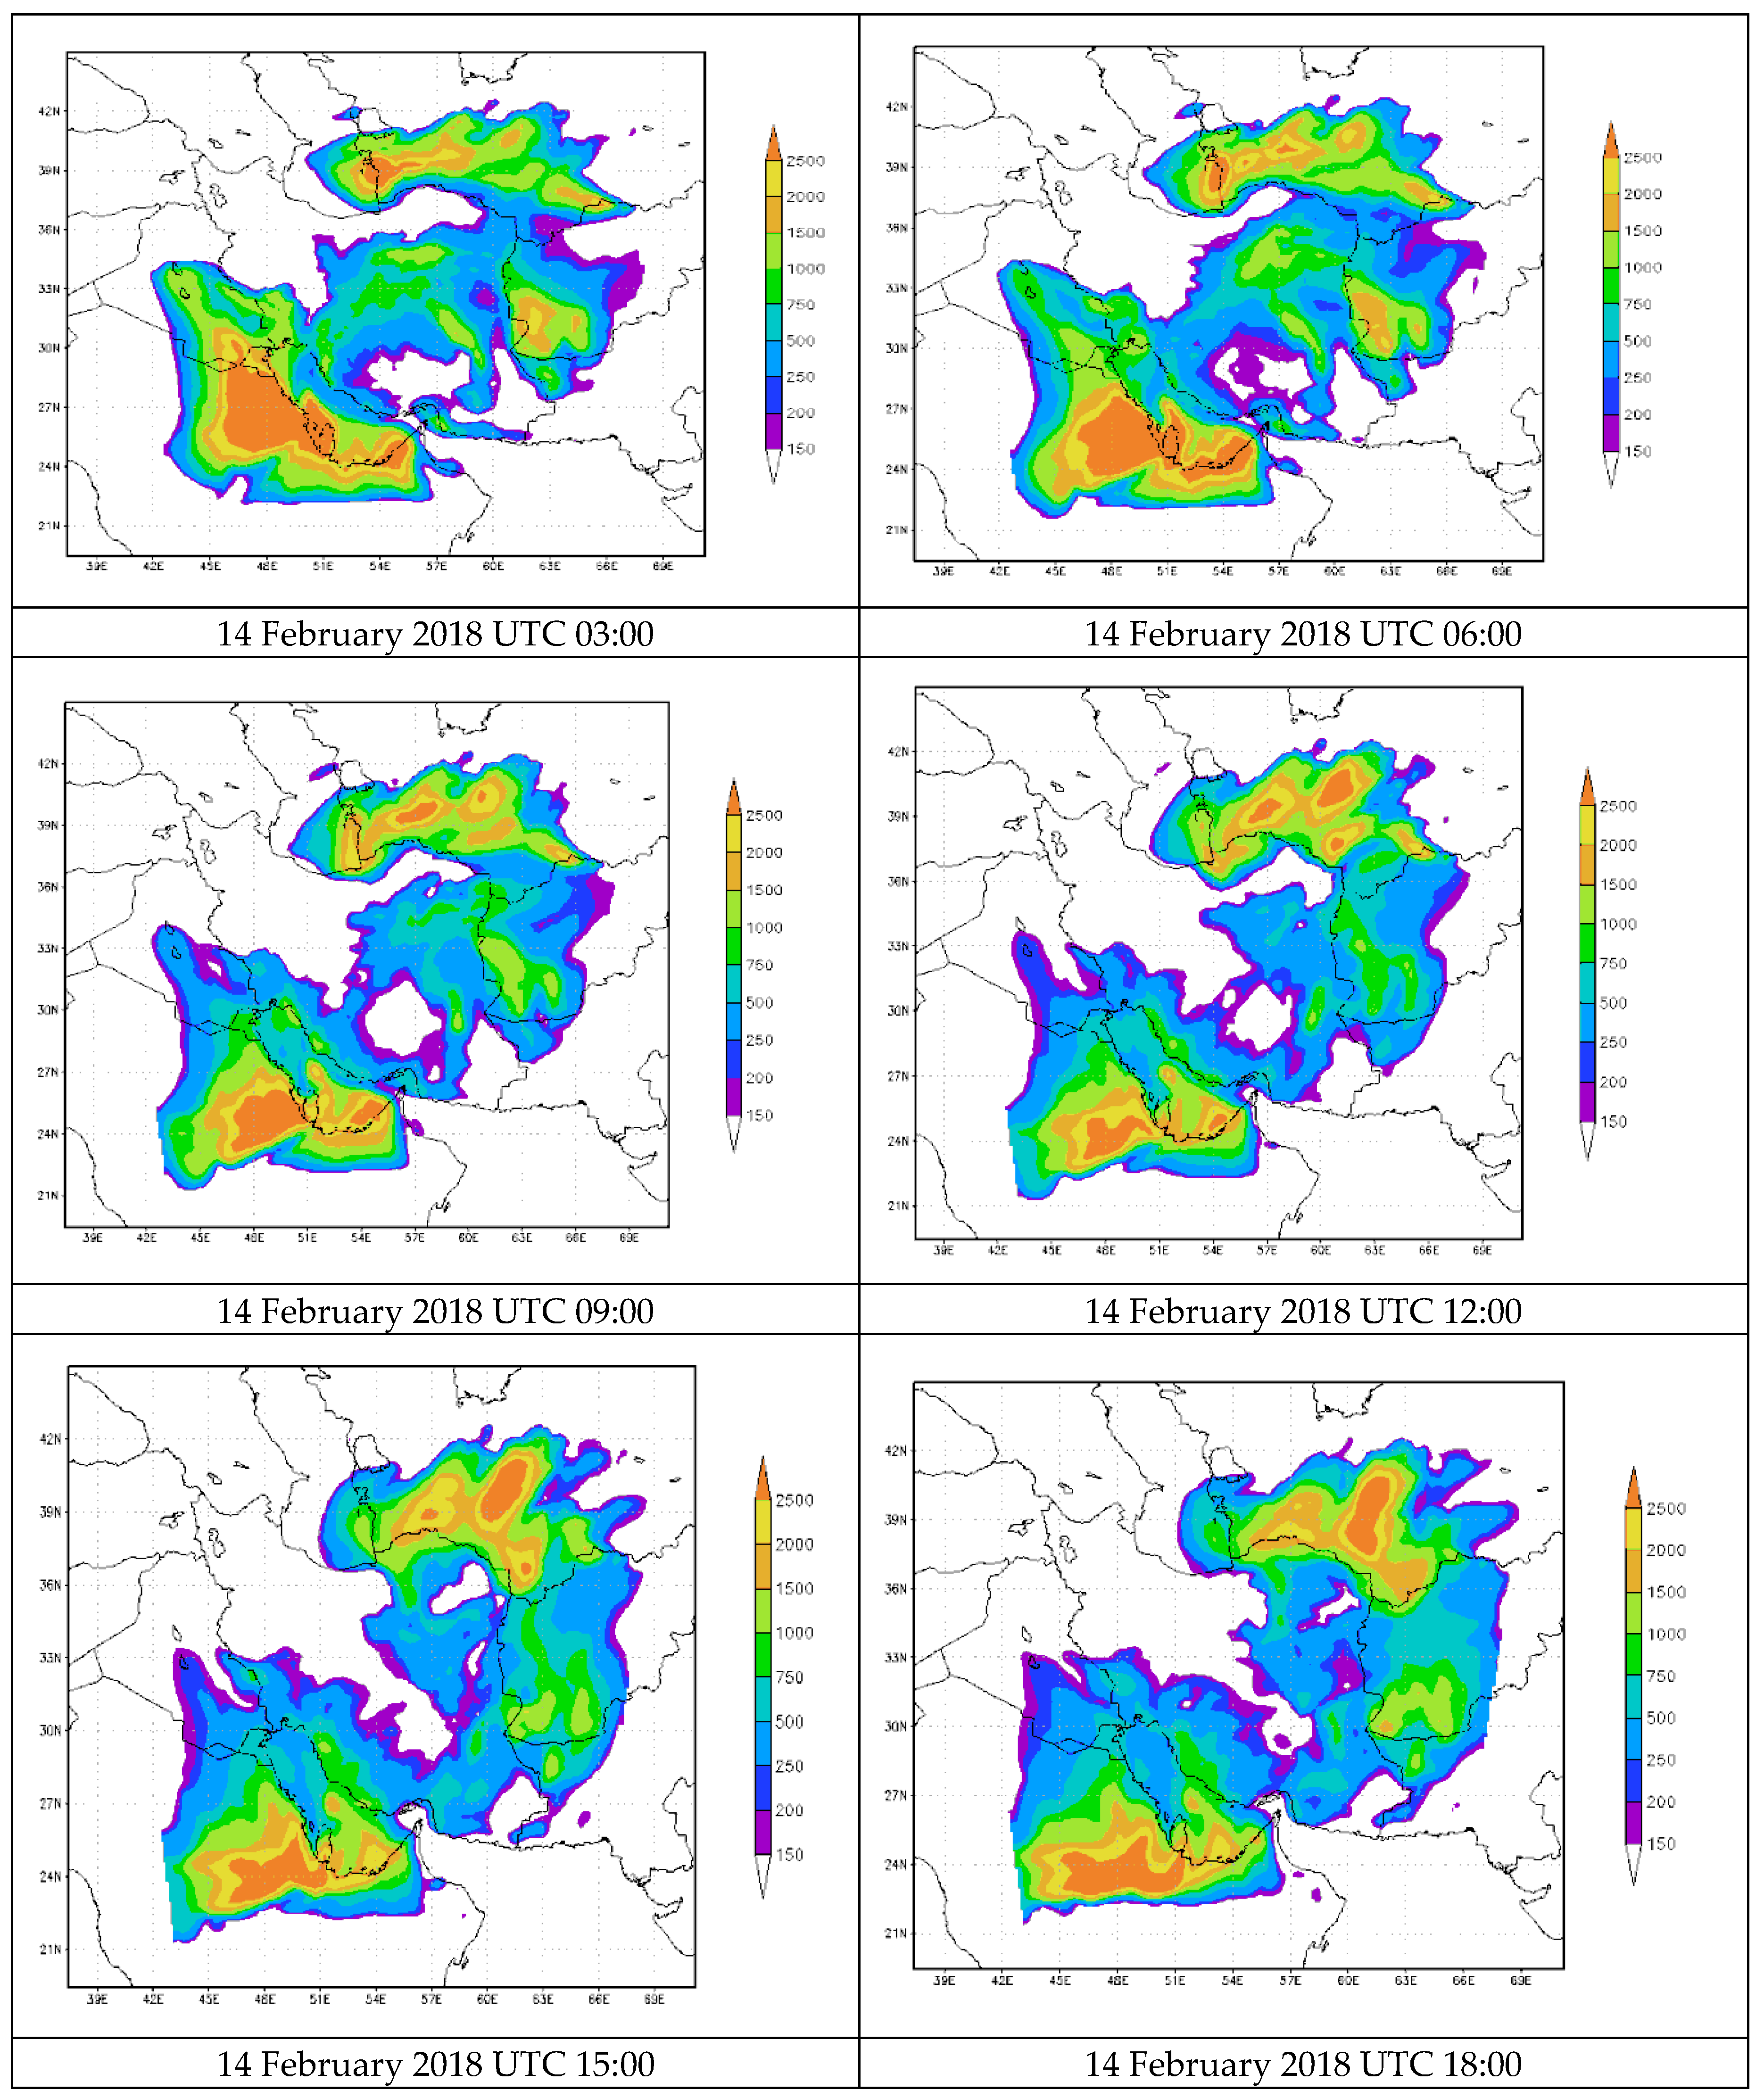
3.3. Simulation of Dust Storm on 14 February 2018

Vertical dust flux represents the potential for soil particles to rise and detach; in other words, places with large vertical dust flux can be identified as dust sources.

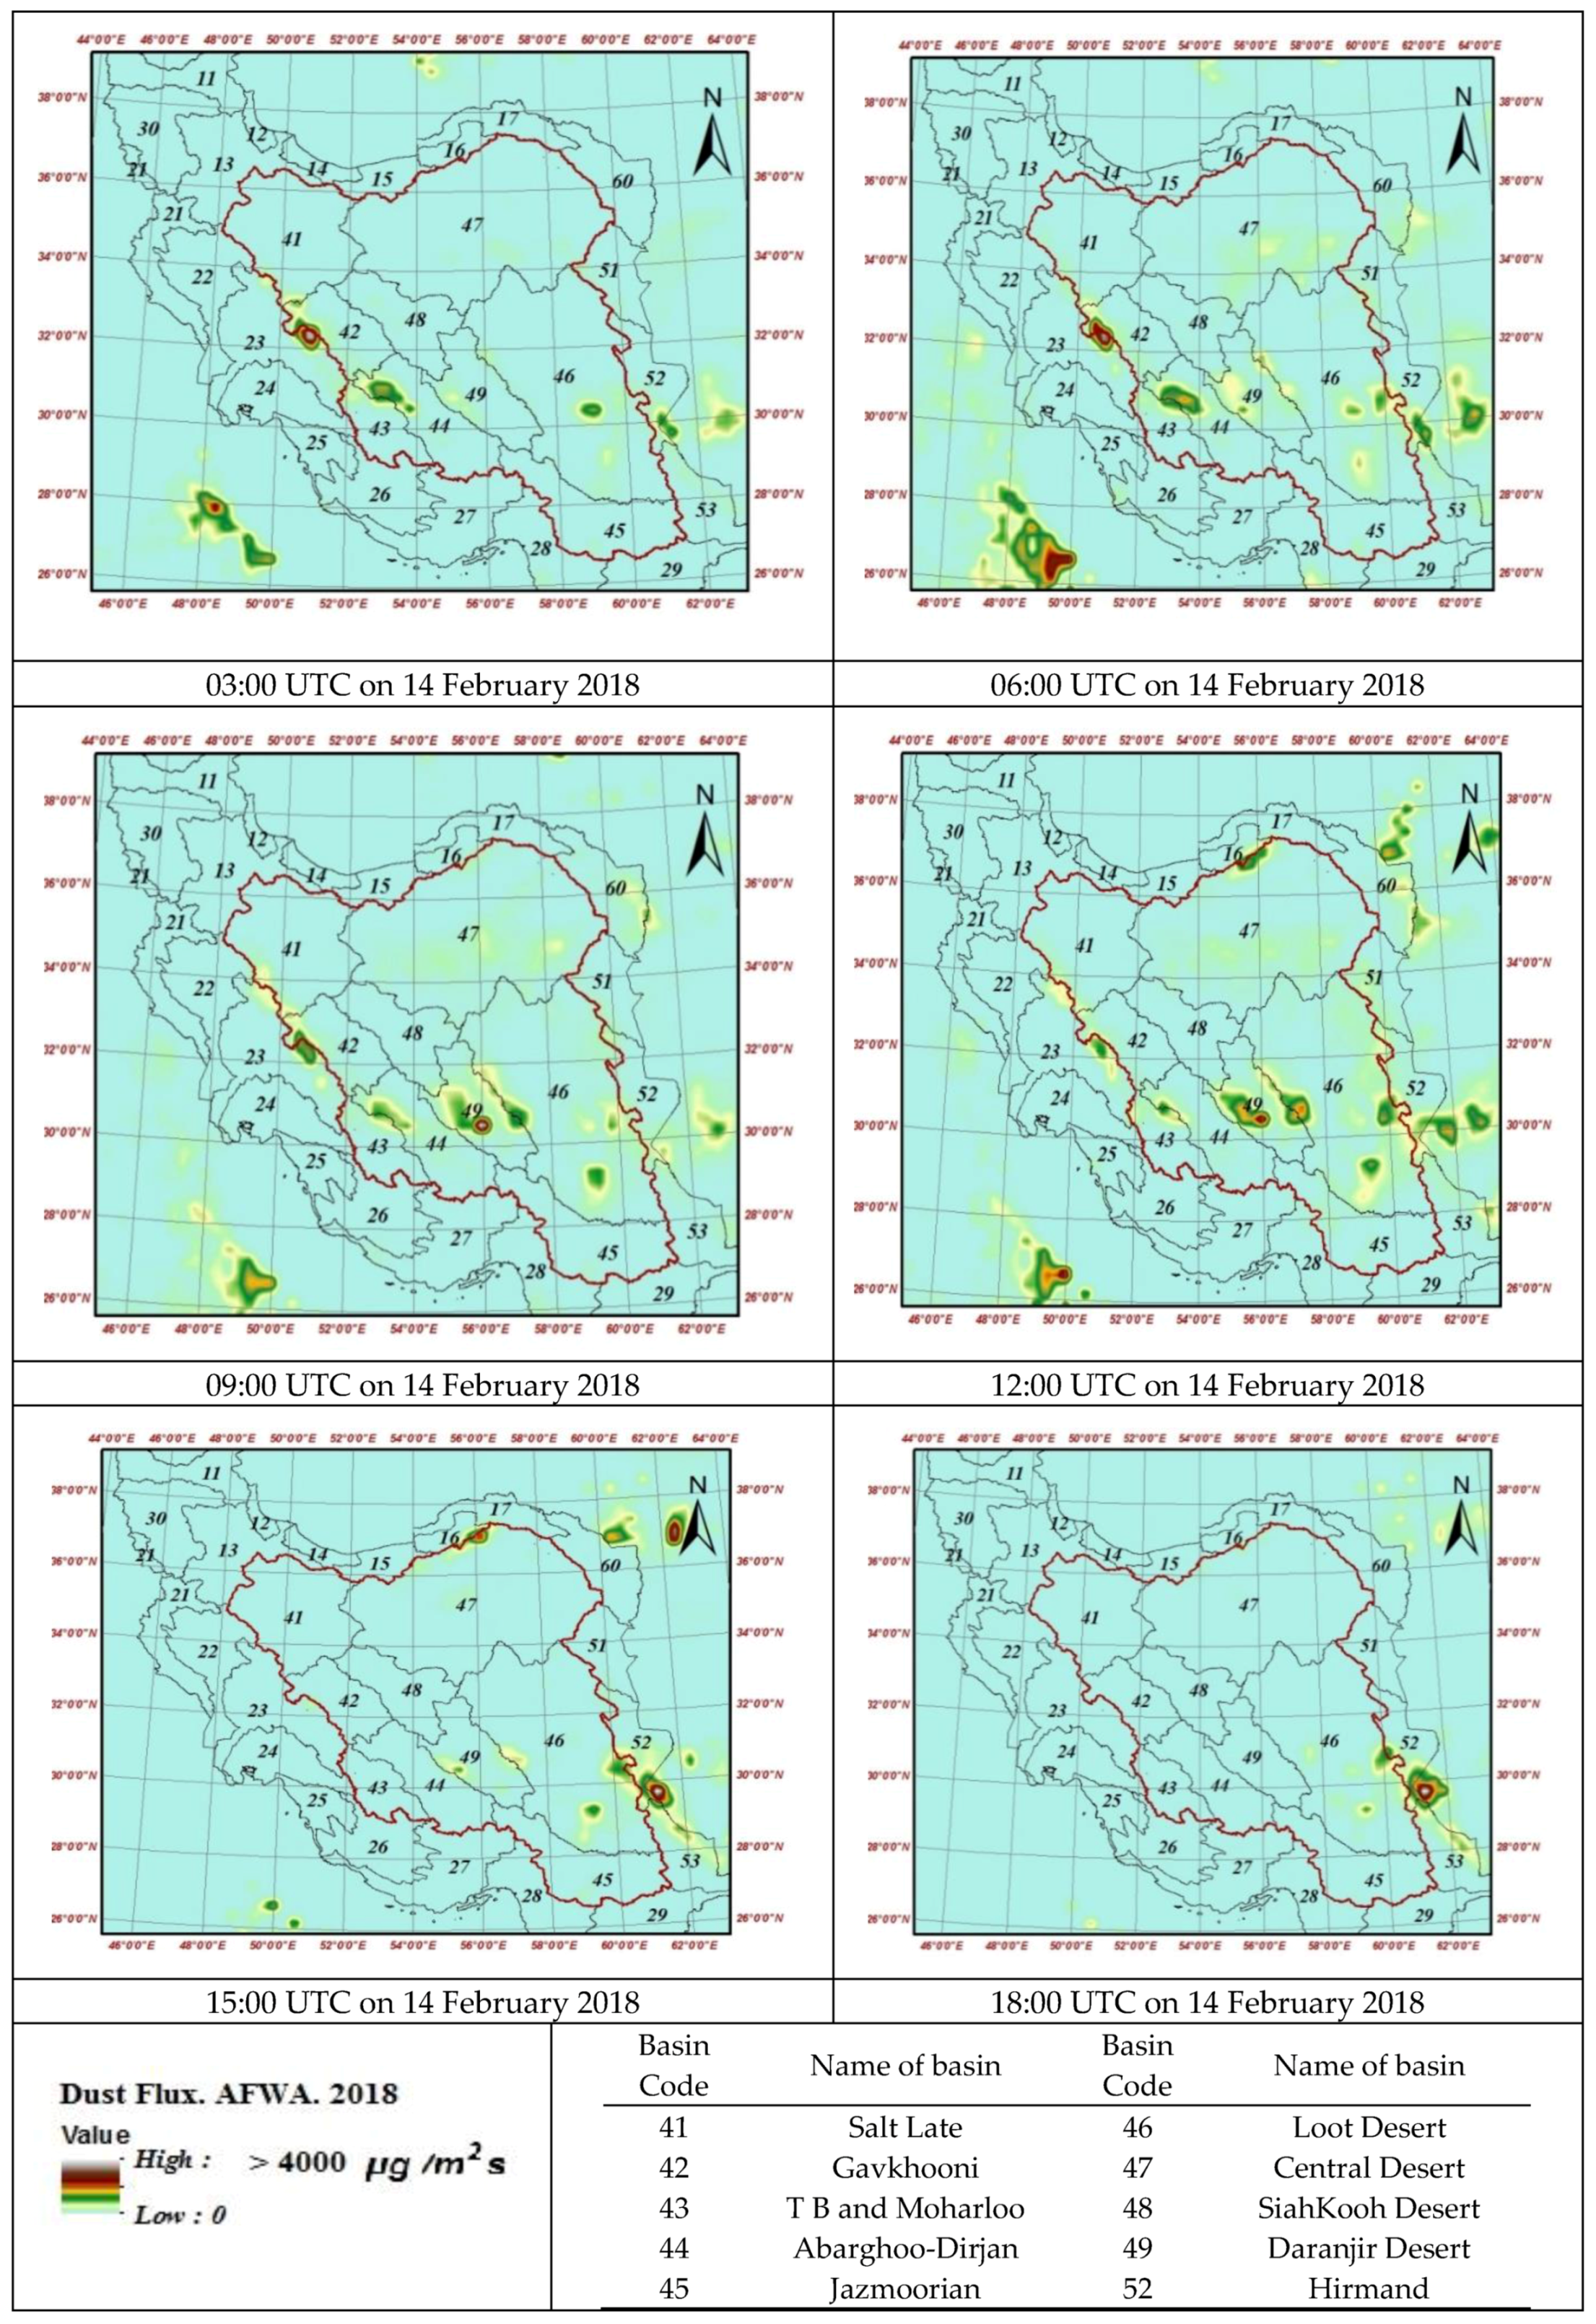
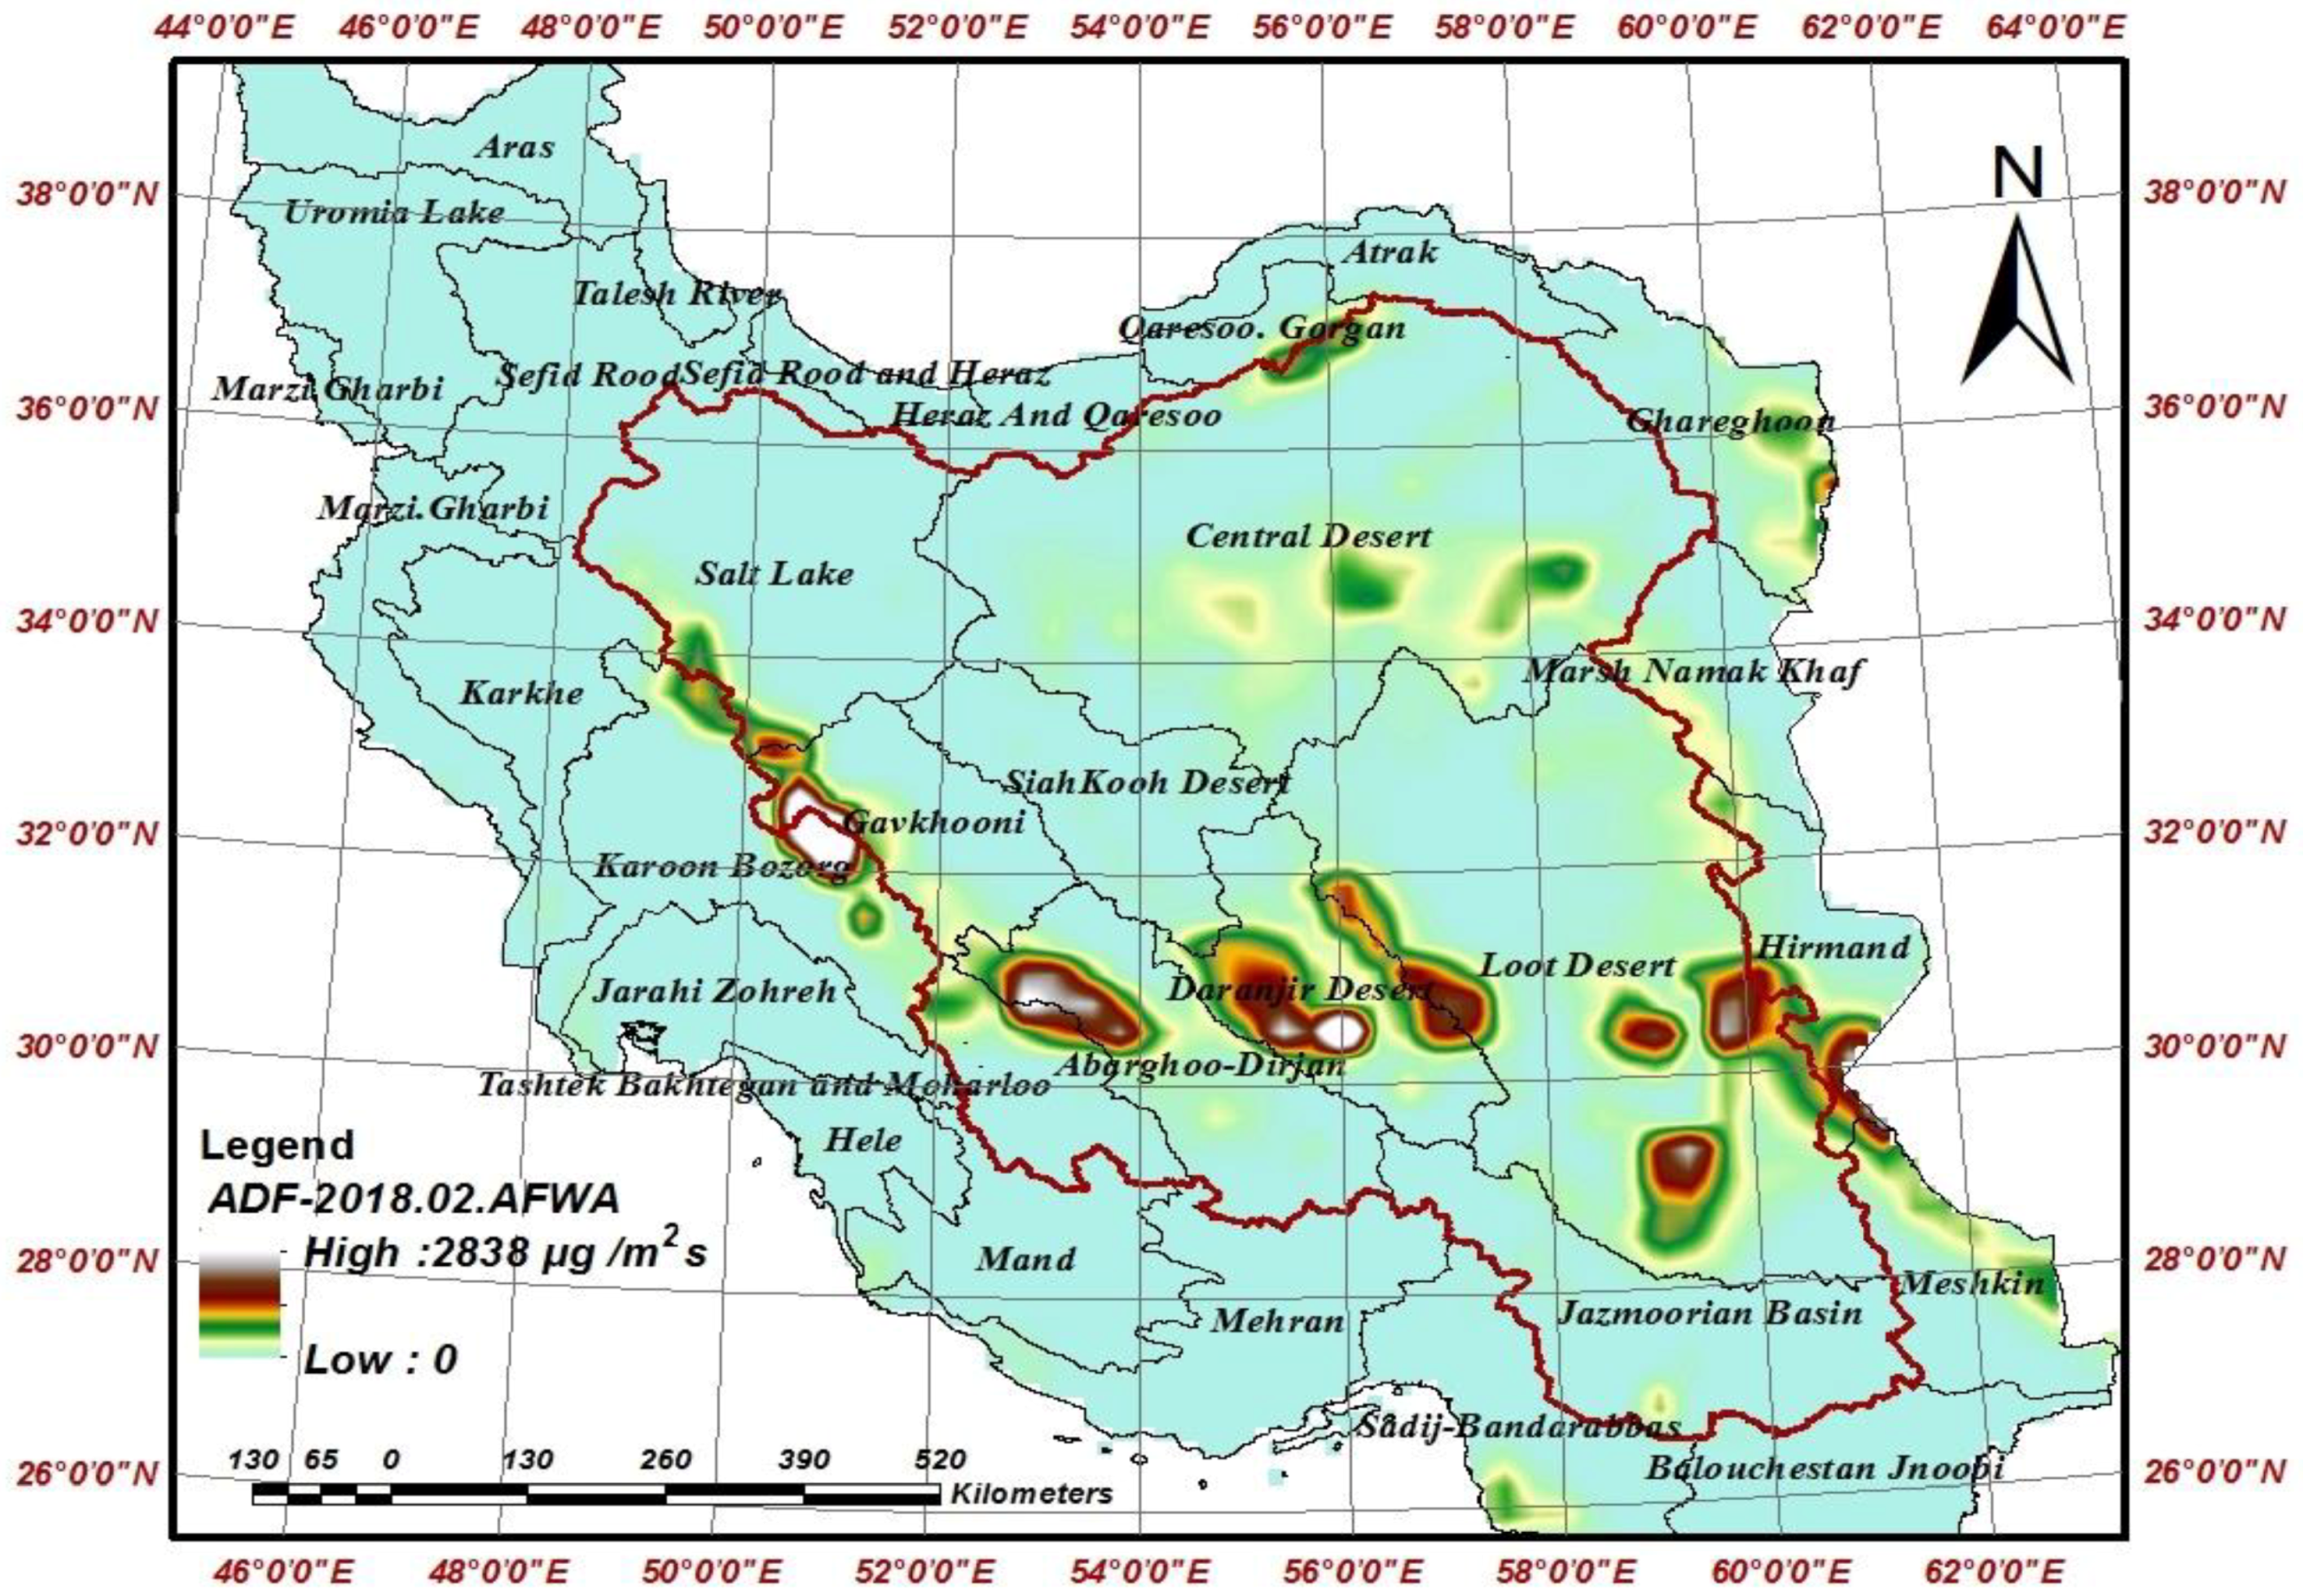
3.3.1. Spatial Pattern of Vertical Dust Flux Using AFWA Wind Erosion Scheme

Figure 6 shows the three-hour vertical dust flux for 14 February 2018 storm simulated by the AFWA scheme. One may see that the model is able to reproduce the distribution of dust storm in MODIS image at 09:00 UTC; in particular, the peak of concentration in central Iran and in its south-eastern part are well detected.
The analysis of the vertical dust flux maps on 14 February 2018 using AFWA Wind Erosion Model in the Central Plateau of Iran shows a dust source in the south-western part of the Arabian Desert mainly from 6:00 to 9:00 UTC on 14 February 2018, and another source in Central Iran. This is shown more clearly in Figure 6, where the average spatial pattern of dust flux during the event is shown. As one may see, the dust flux reaches as high as 2838 µg/(m2s). The most dust rise is in parts of the Gavkhouni wetland and Salt Lake, as shown in Figure 7. During winter, which is generally a wet season, these areas should have a wet surface; however, the results show that if the soil moisture is reduced, as was the case in 2018, the region may serve as a source of dust as well, potentially becoming a dust hotspot.

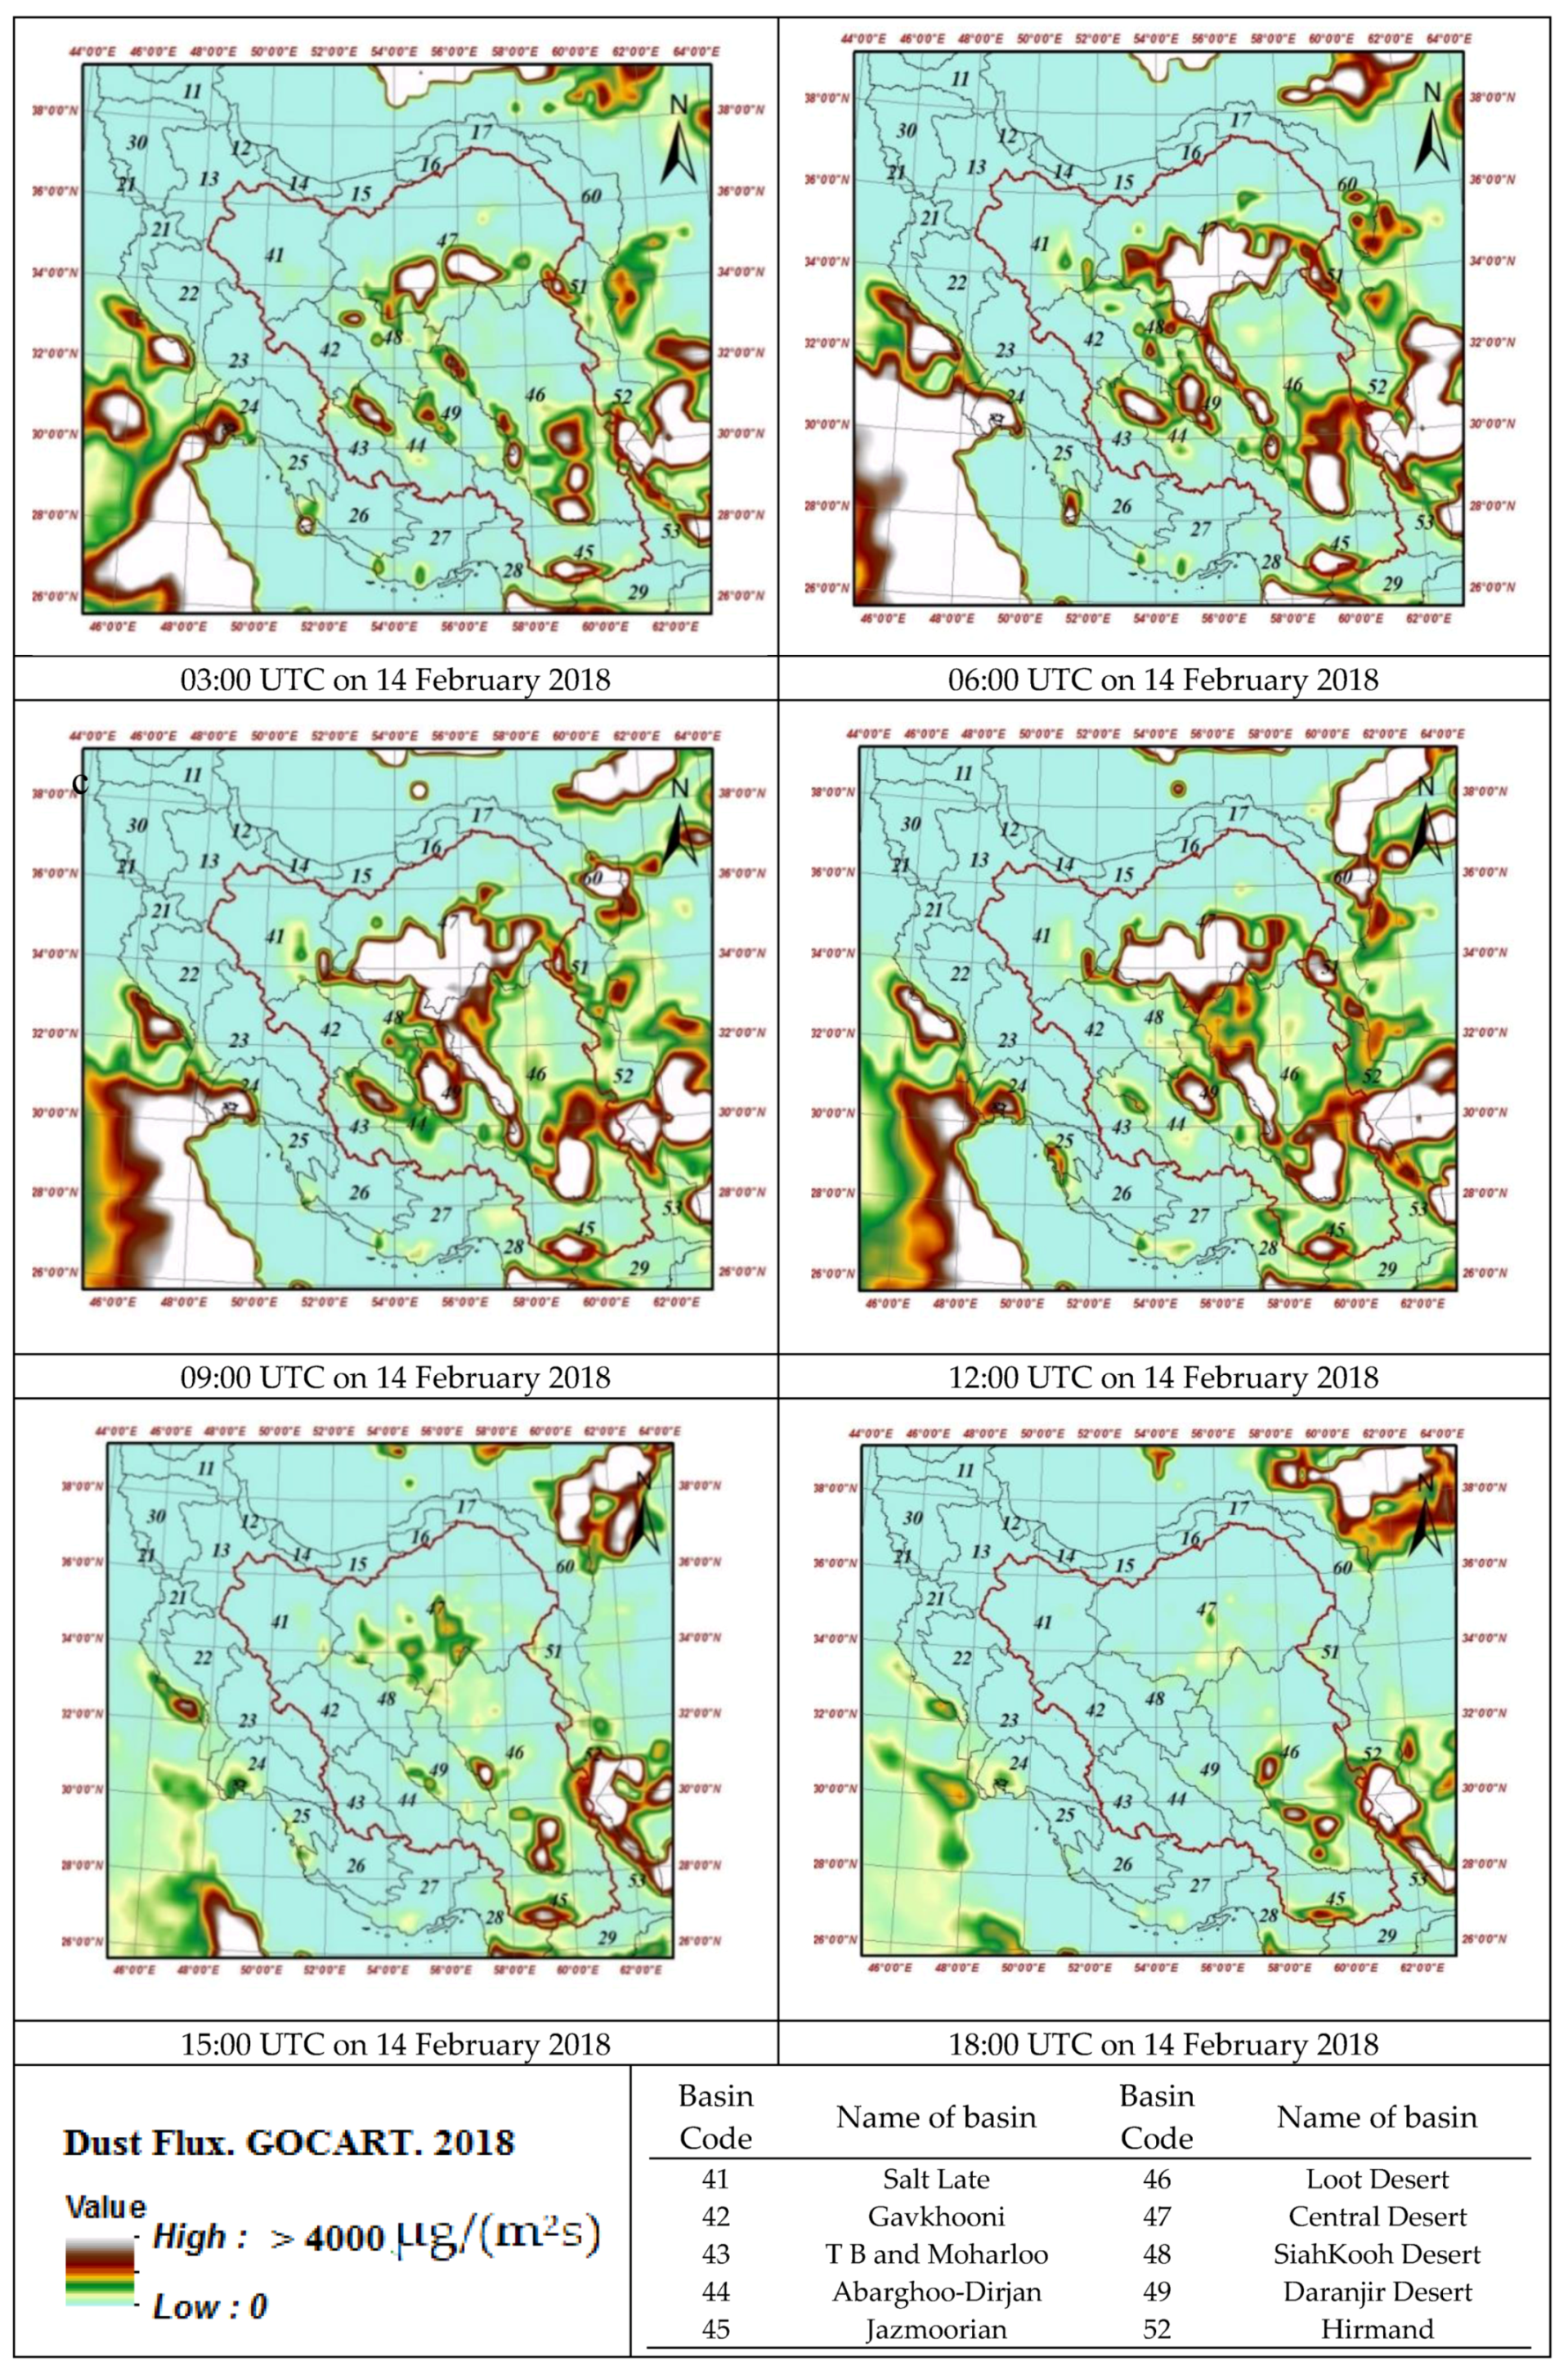
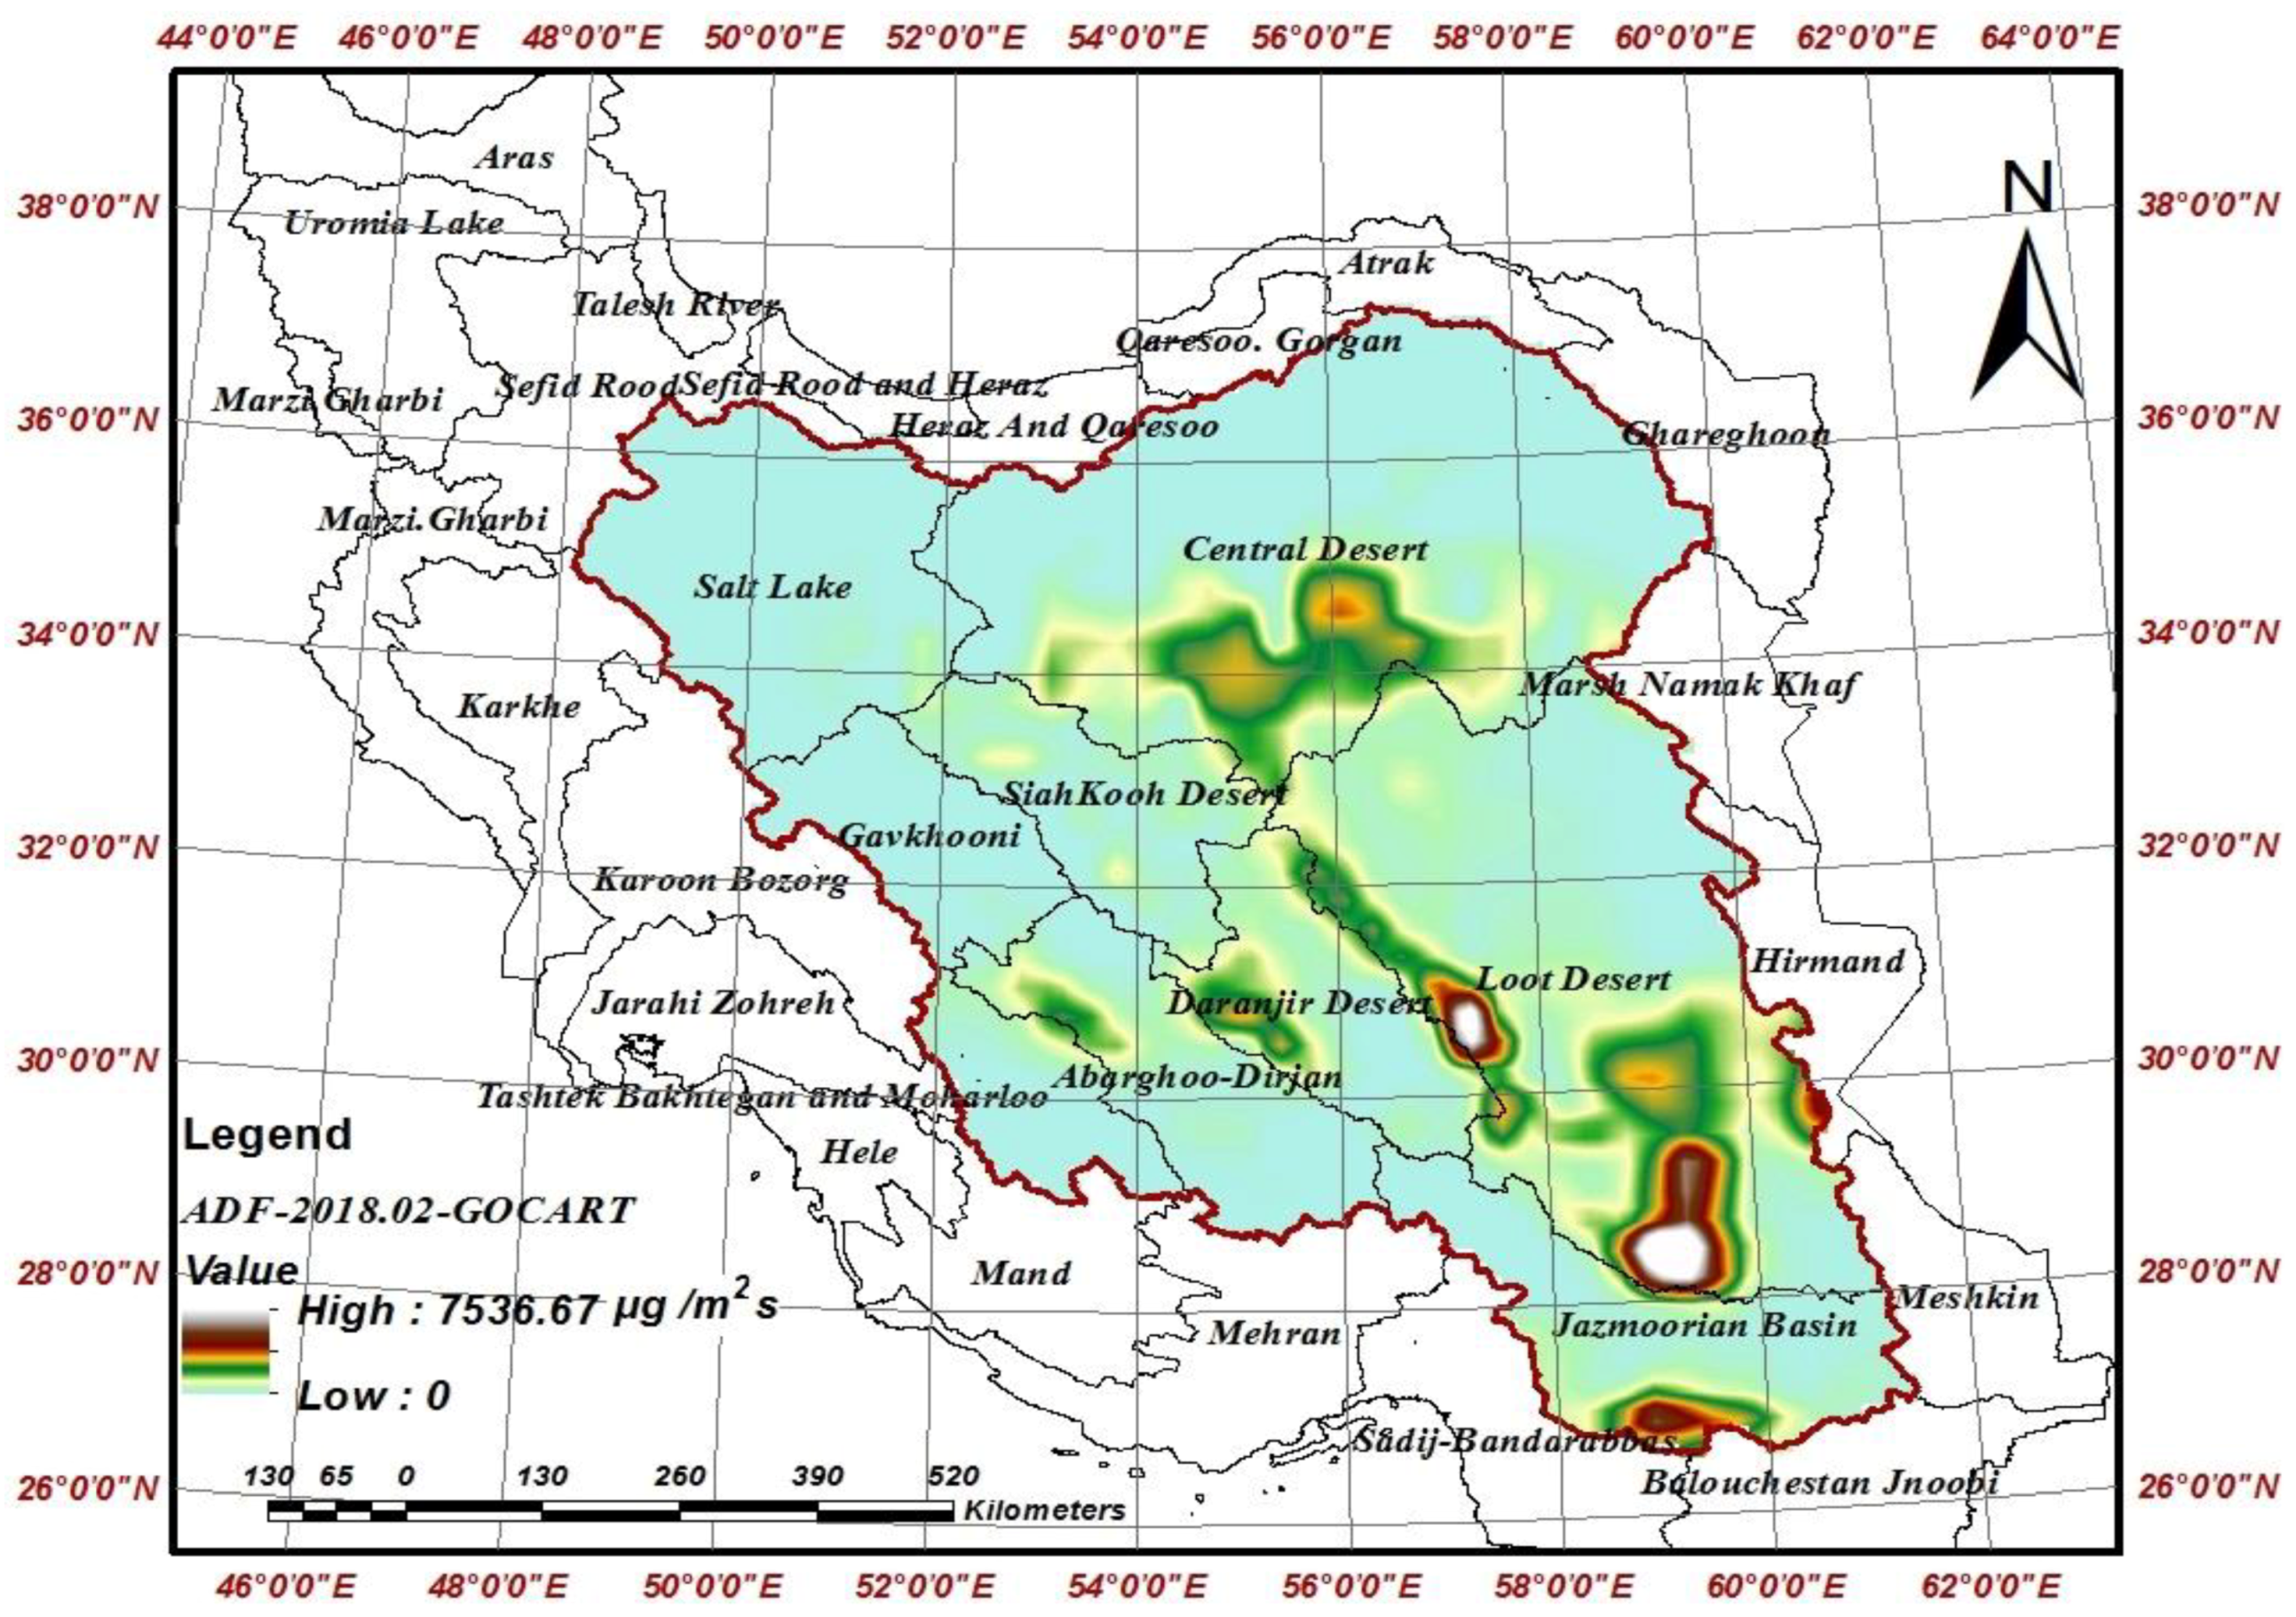
3.3.2. Spatial Pattern of Vertical Dust Flux Using GOCART Wind Erosion Model

The GOCART scheme calculated the spatial pattern of vertical dust flux over a 3-h interval using the GFS analysis/forecast as large scale forcing on 14 February 2018, as shown in Figure 8.
The average spatial pattern of vertical dust flux (VDF) simulated with the GOCART model indicates that the Jazmourian Wetland Basin can be a source of dust in the southeast of Iran (Figure 9). Additionally, it indicates that parts of the Loot Desert in Kerman, Sistan, and Baluchestan provinces can be internal dust sources. In fact, the simulated vertical flux of dust by the GOCART scheme reaches 7536 µg/(m2s) in the area.
Overall, the VDF results using GOCART suggest that central, eastern and south-eastern parts of Iran have the highest potential for dust emission and these areas may be considered as internal Sources.
According to the results of two dust schemes, the vertical flux values simulated by AFWA are lower than those simulated by the GOCART scheme. The number of dust sources shown by the GOCART scheme in the study area is also higher than for the AFWA scheme. Therefore, as a final step, in order to verify and compare the schemes, the correlation between the results of the surface dust concentration simulated by the AFWA and GOCART schemes with the horizontal view of the synoptic stations will be investigated.

3.4. Simulation of Dust Storm on 21 February 2015

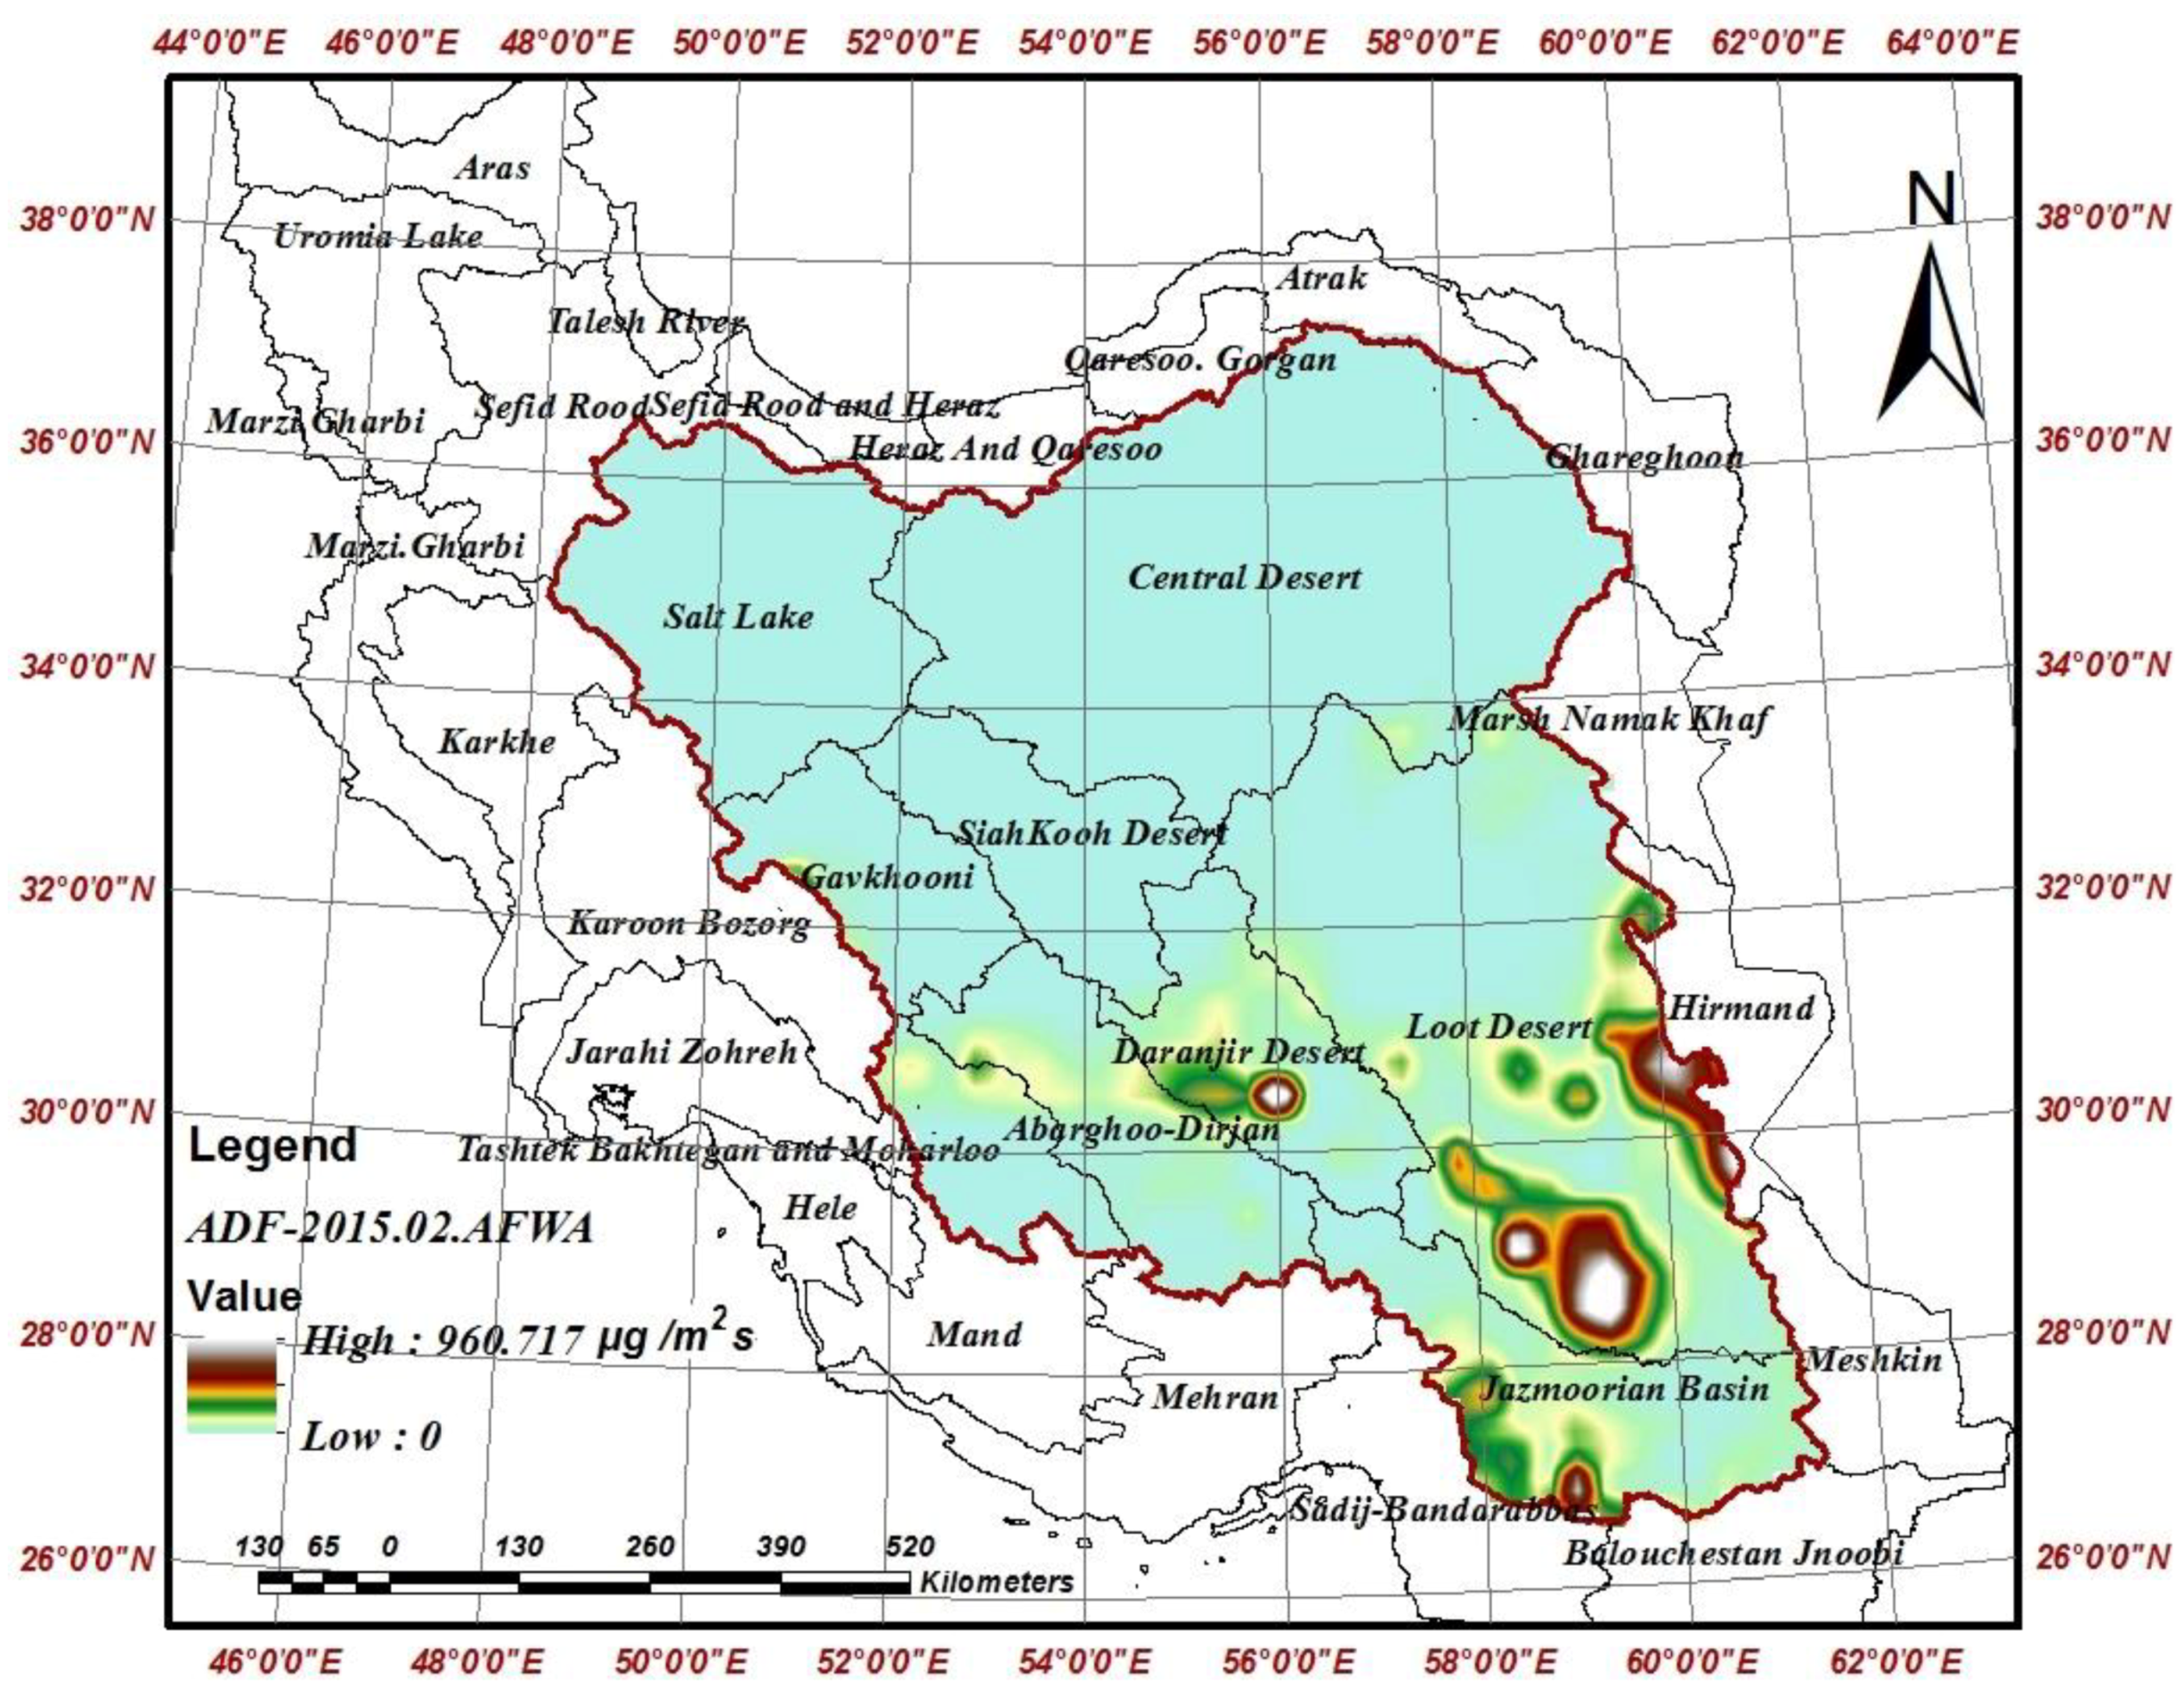
3.4.1. Spatial Pattern of Vertical Dust Flux Using AFWA Wind Erosion Scheme

The results of the simulated vertical dust flux of 21 February 2015 are shown in Figure 10.
Results show that the main dust source of this storm is the Arabian Desert; focusing on the internal sources, it appears that the Loot Desert, Jazmoorian and Daranjir desert have the highest potential to generate dust in the central Iranian plateau (Figure 11).
Hence, the AFWA Scheme identified 4 sources of dust in the Loot Desert, Jazmourian, Hirmand and Daranjir Desert. The VDF simulated by this scheme in the Loot Desert reaches 960 μg/(m2s) (Figure 11).

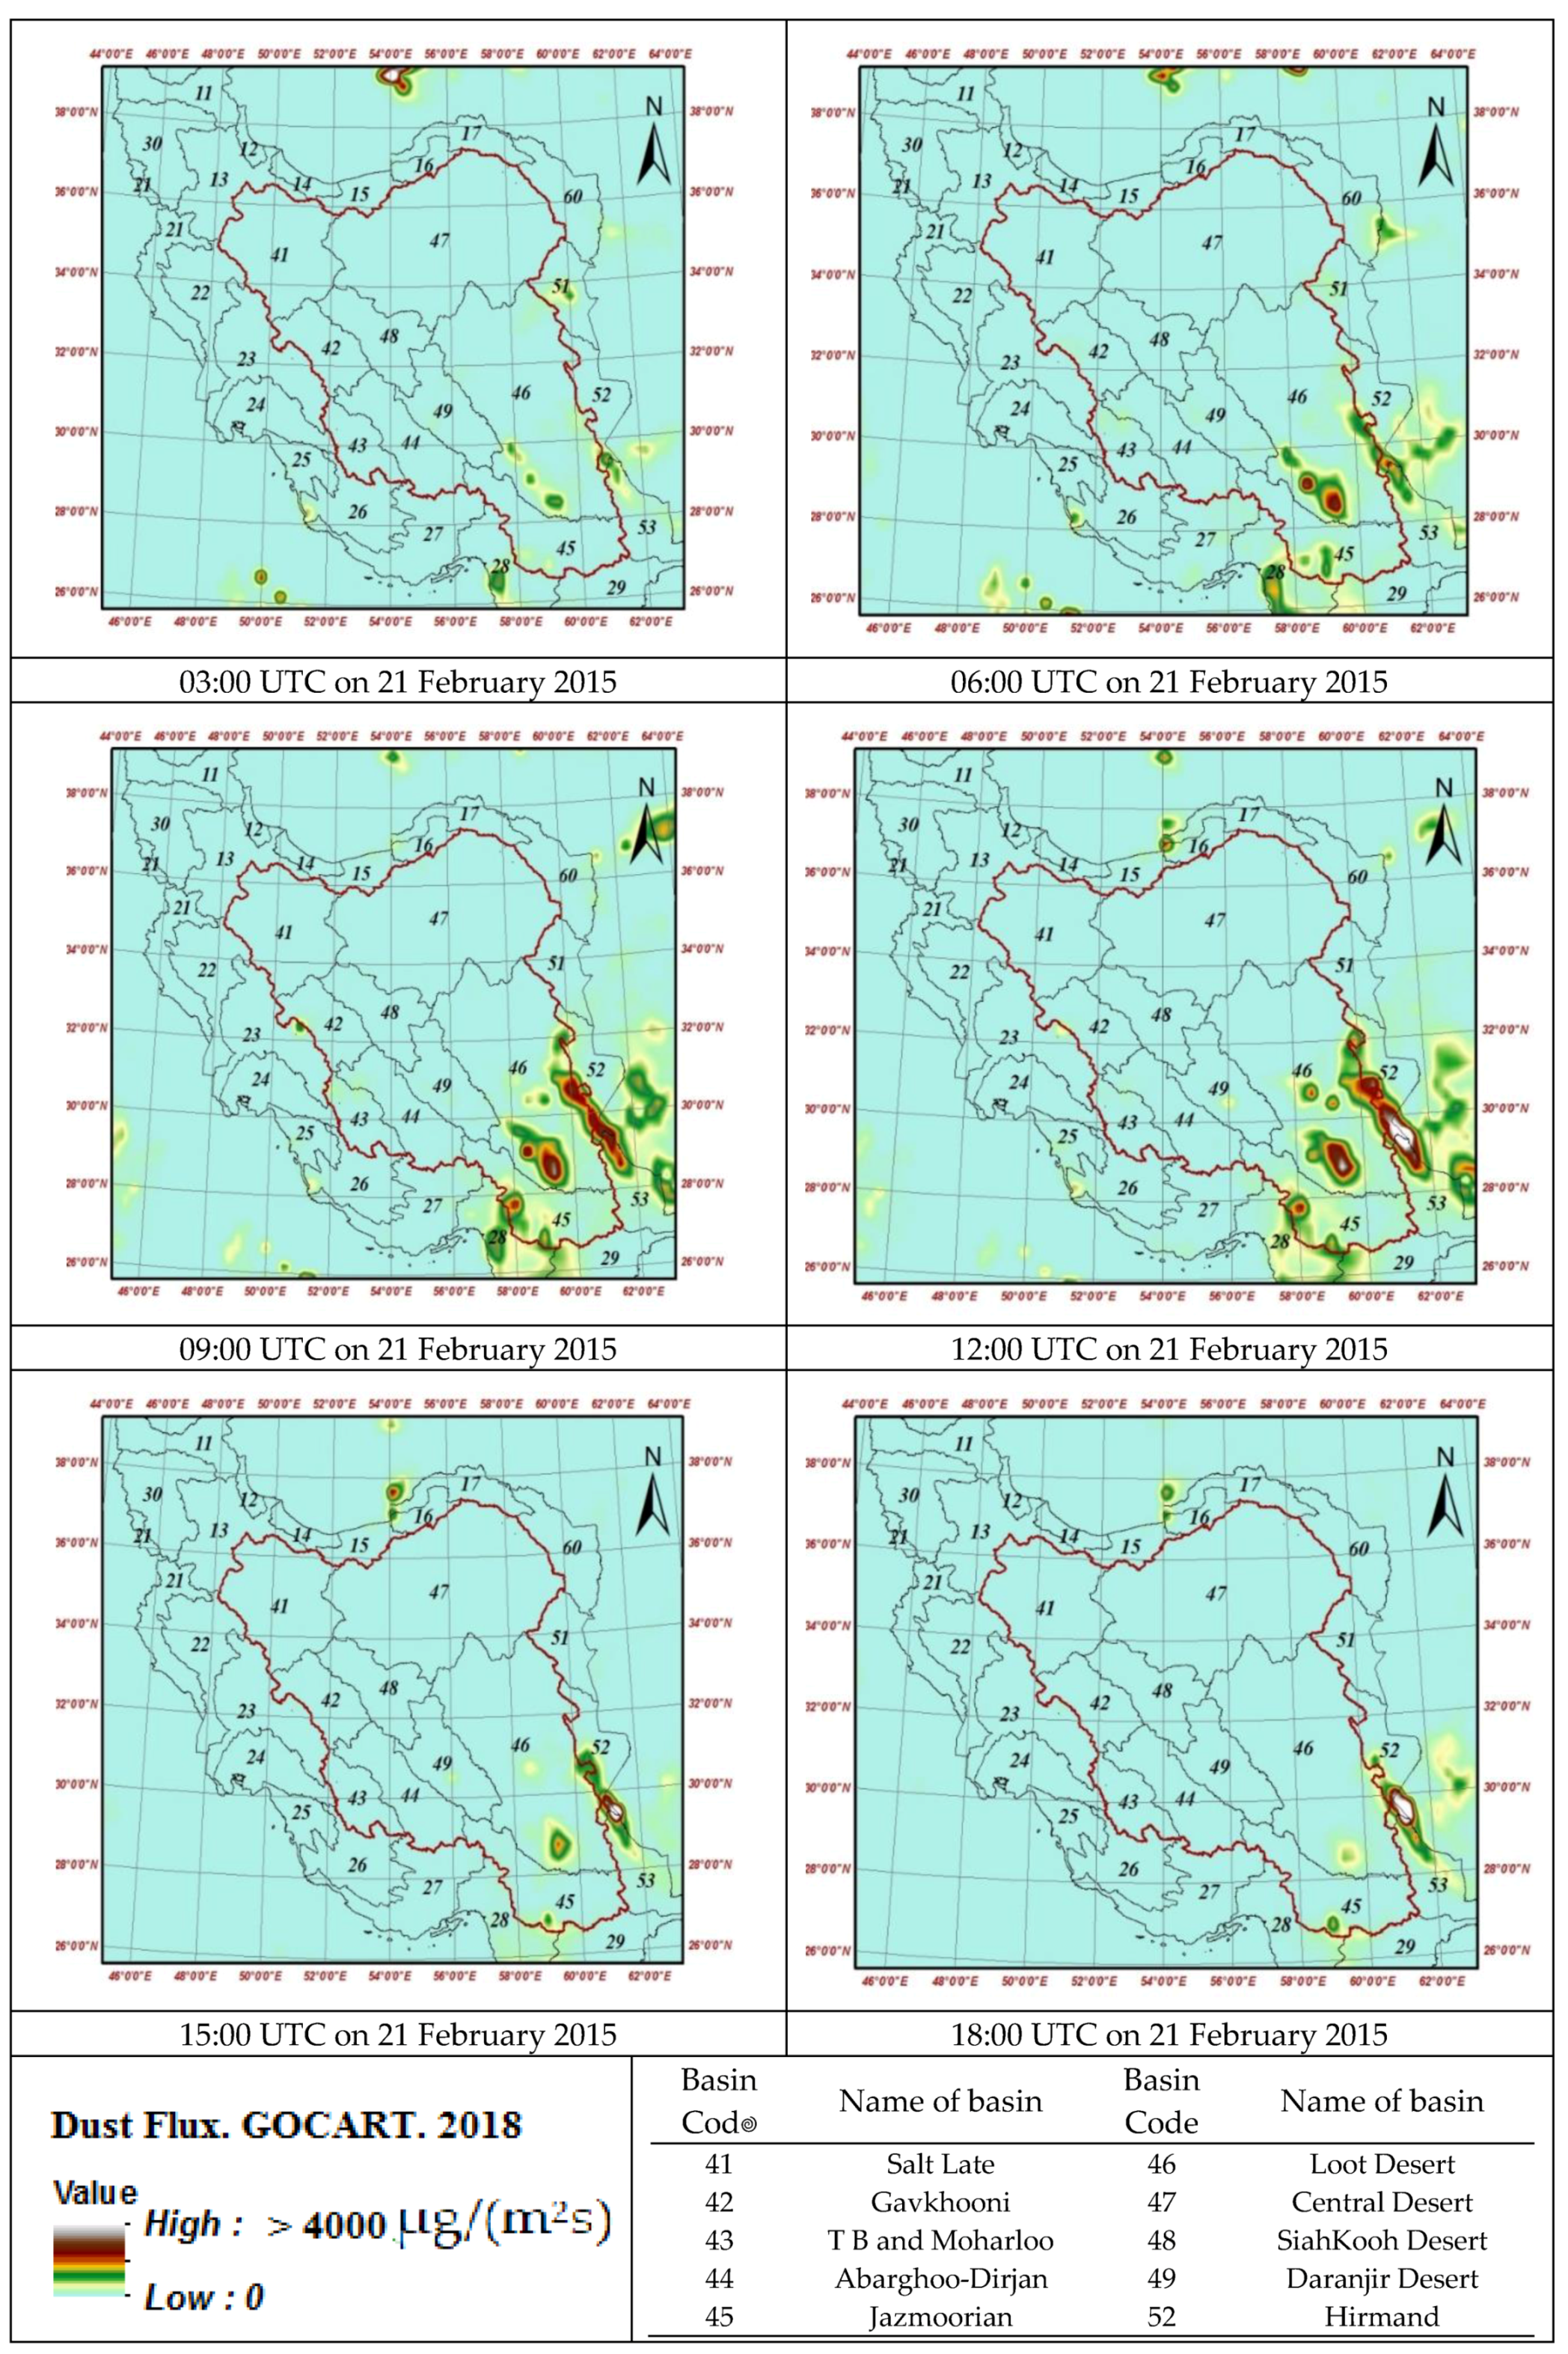
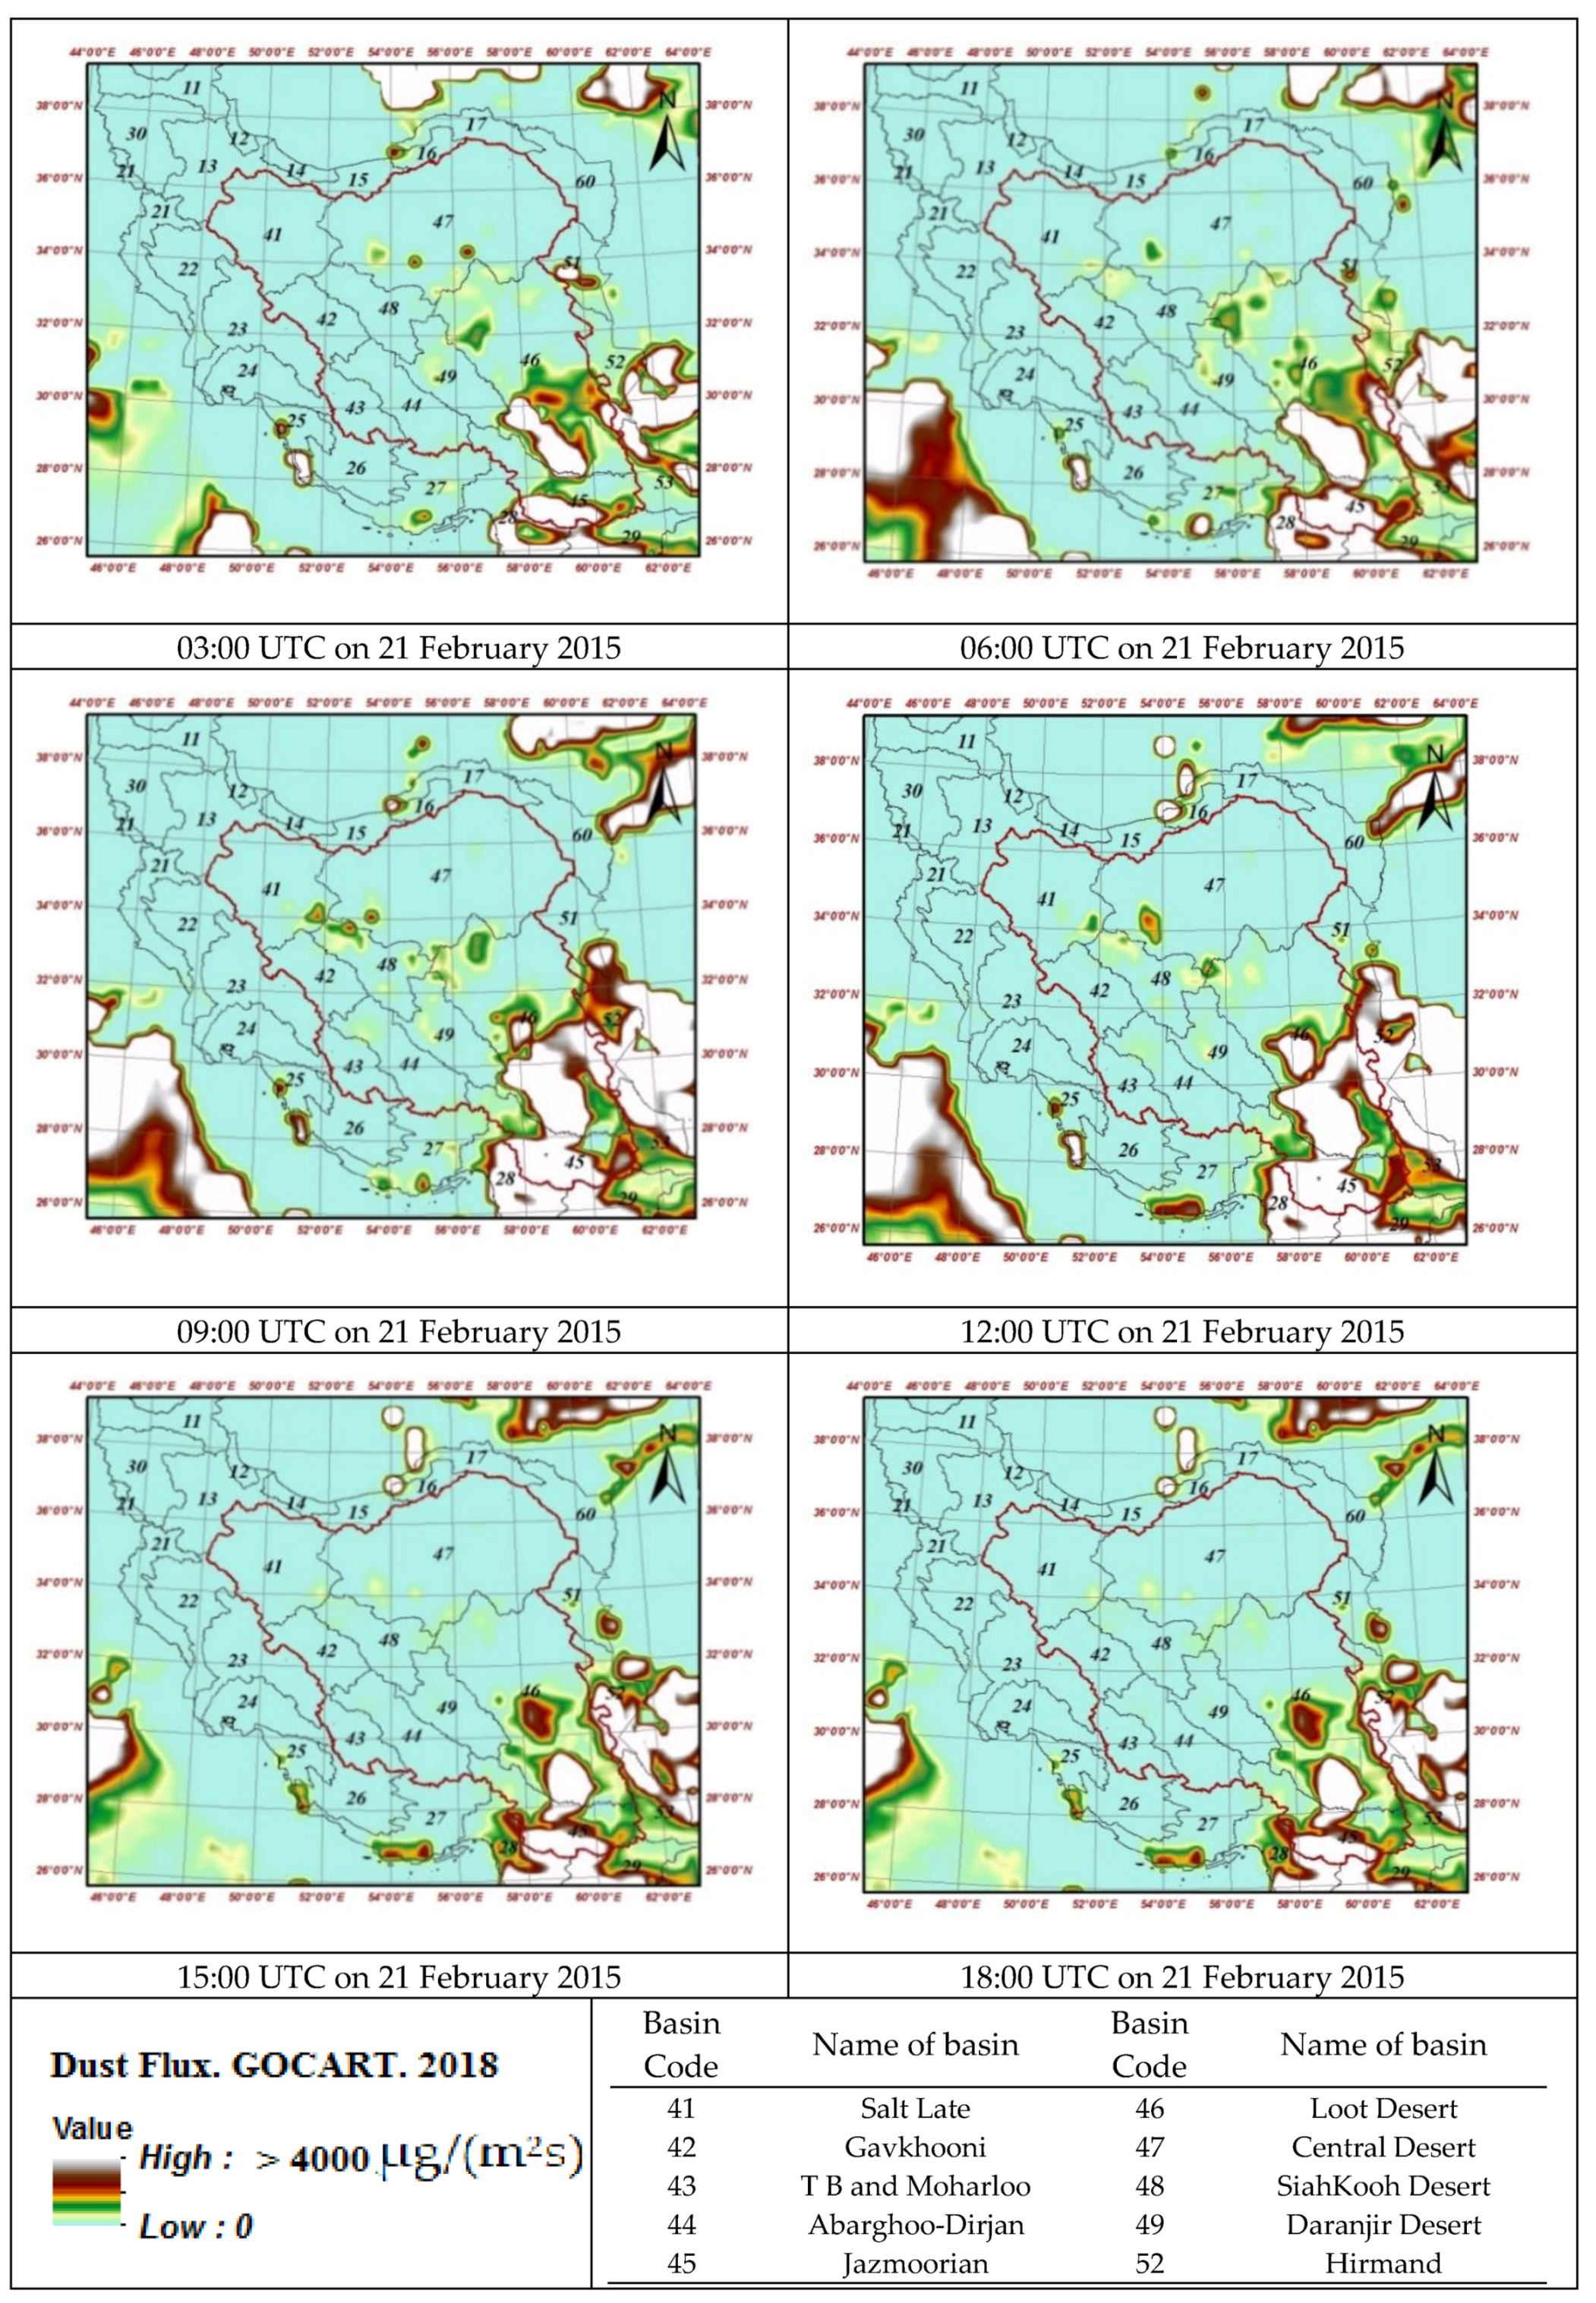
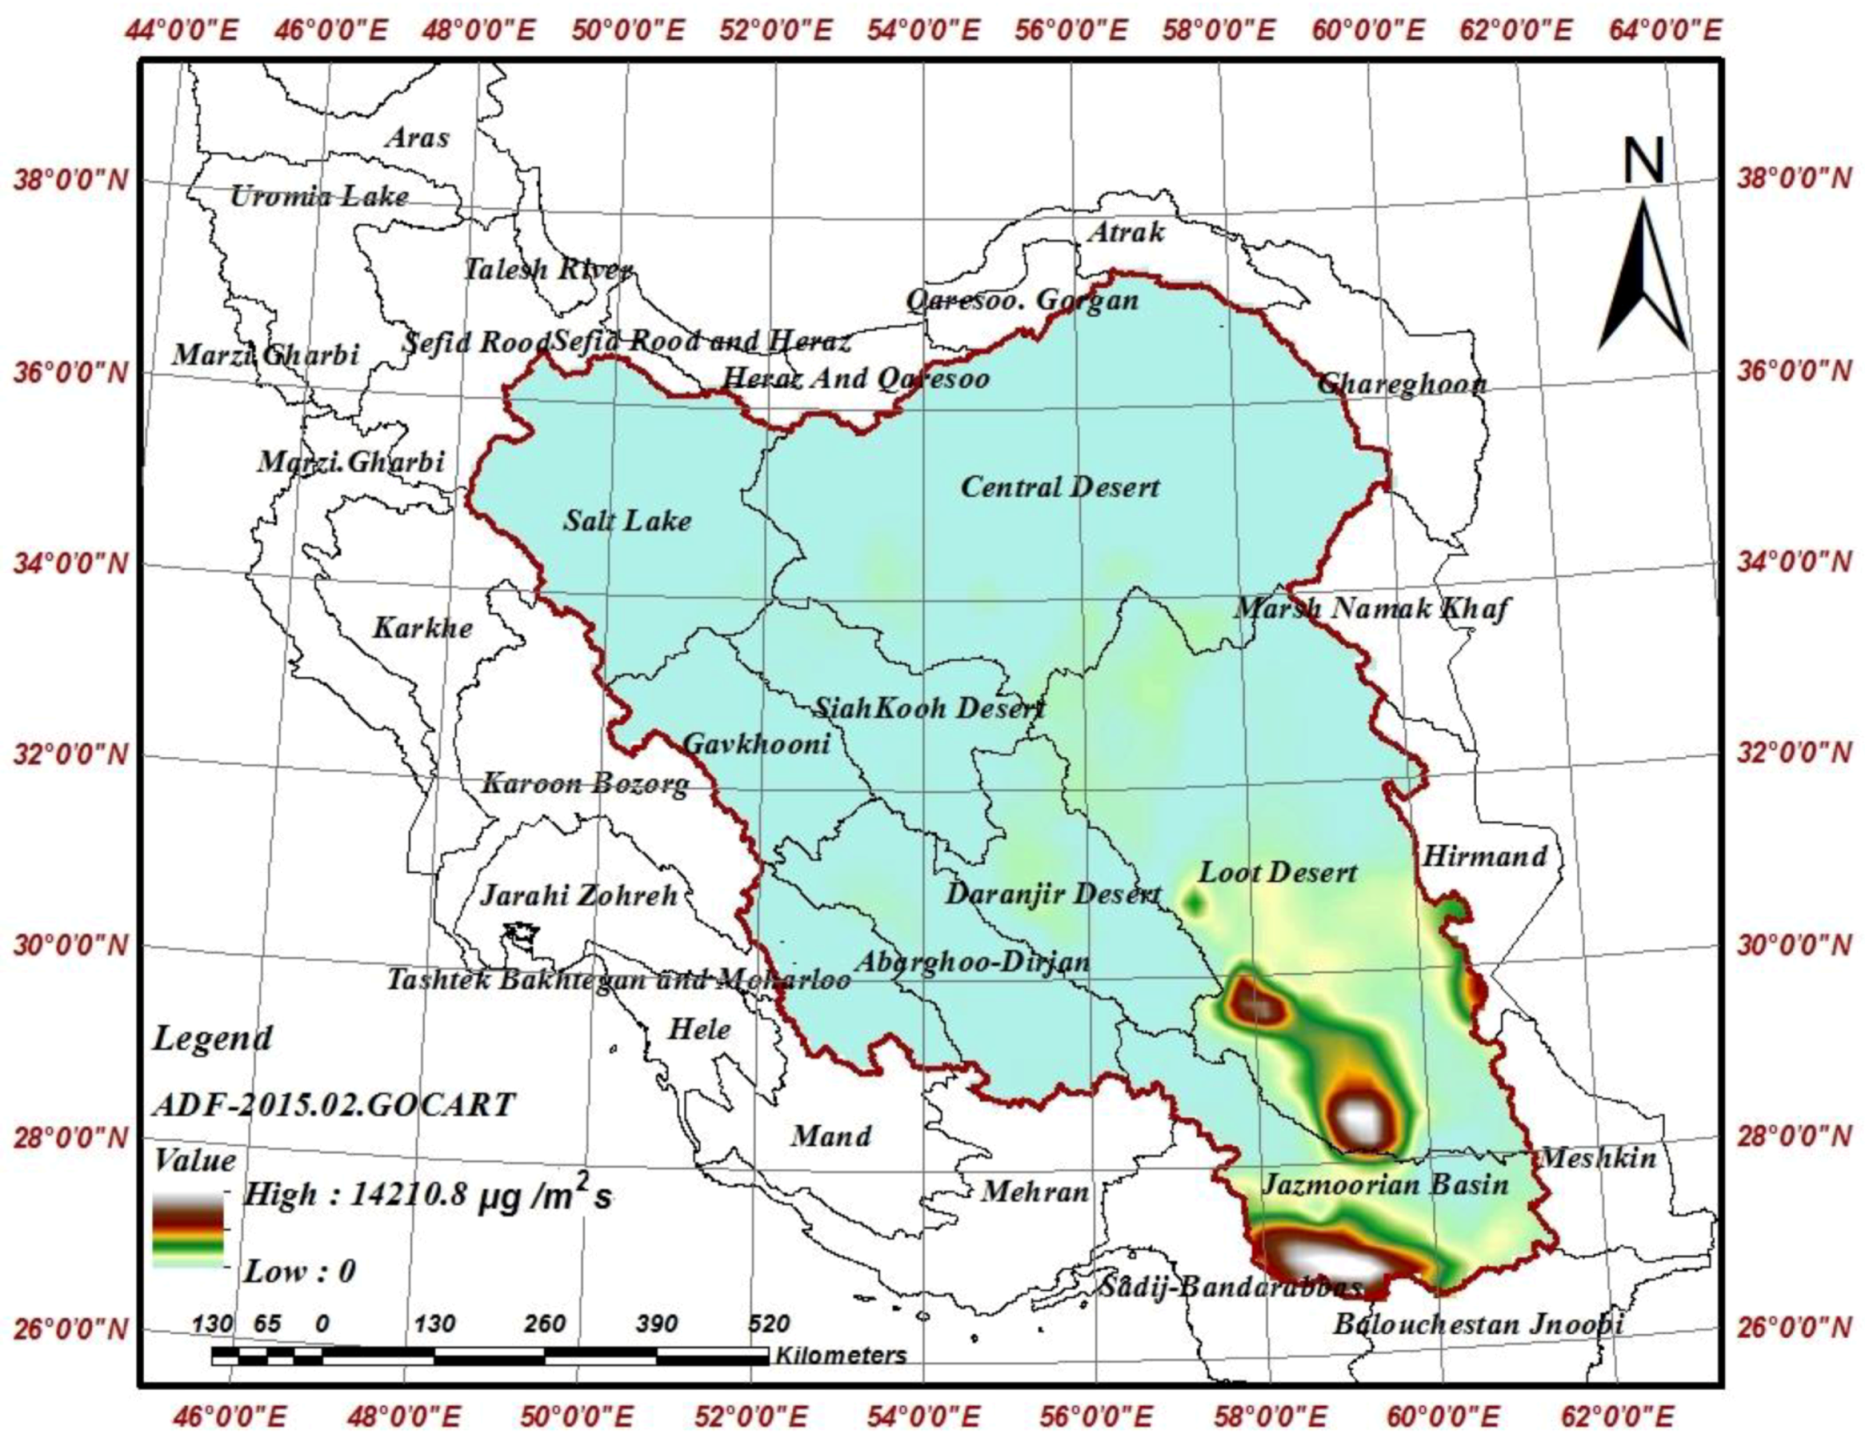
3.4.2. Spatial Pattern of Vertical Dust Flux Using GOCART Wind Erosion Scheme

The GOCART scheme simulated the vertical flux (μg/m2s) of the dust storm on 21 February 2015, with results as shown in Figure 12.
Storm dust emission flux results on 21 February 2015 by GOCART scheme using WRF-Chem model show that Saudi Arabian deserts (to the south-west of the study area), Qareqoom desert (to the north-east) and Hirmand Basin (to the south-east) formed the primary core of the storm; additionally, emission flux simulations showed that the south-eastern regions of Iran as well as northeast Iran have the potential for dust emission. There is high VDF in the Loot Desert and in the Central Plateau; hence, the elevated ground levels in these areas and favorable climatic conditions can cause severe dust emission. The average spatial pattern in Figure 13 also shows that the Jazmourian basin in southeastern Iran may be identified as a critical hotspot. The GOCART scheme illustrates this phenomenon well.
GOCART for 21 February 2015 shows internal dust sources in the Jazmourian and Loot Desert and Hirmand Basin. In the Jazmourian Basin, the VDF simulated by the model is up to 14,000 µg/m2s.

3.5. Validation of WRF-Chem with GOCART and AFWA Wind Erosion Schemes

The results of the simulation of the vertical dust flux by the two schemes are significantly different, so it is necessary to evaluate their results using the surface dust concentration (SDC) simulated by the model compared to the horizontal visibility of the synoptic stations and MERRA2 dataset.

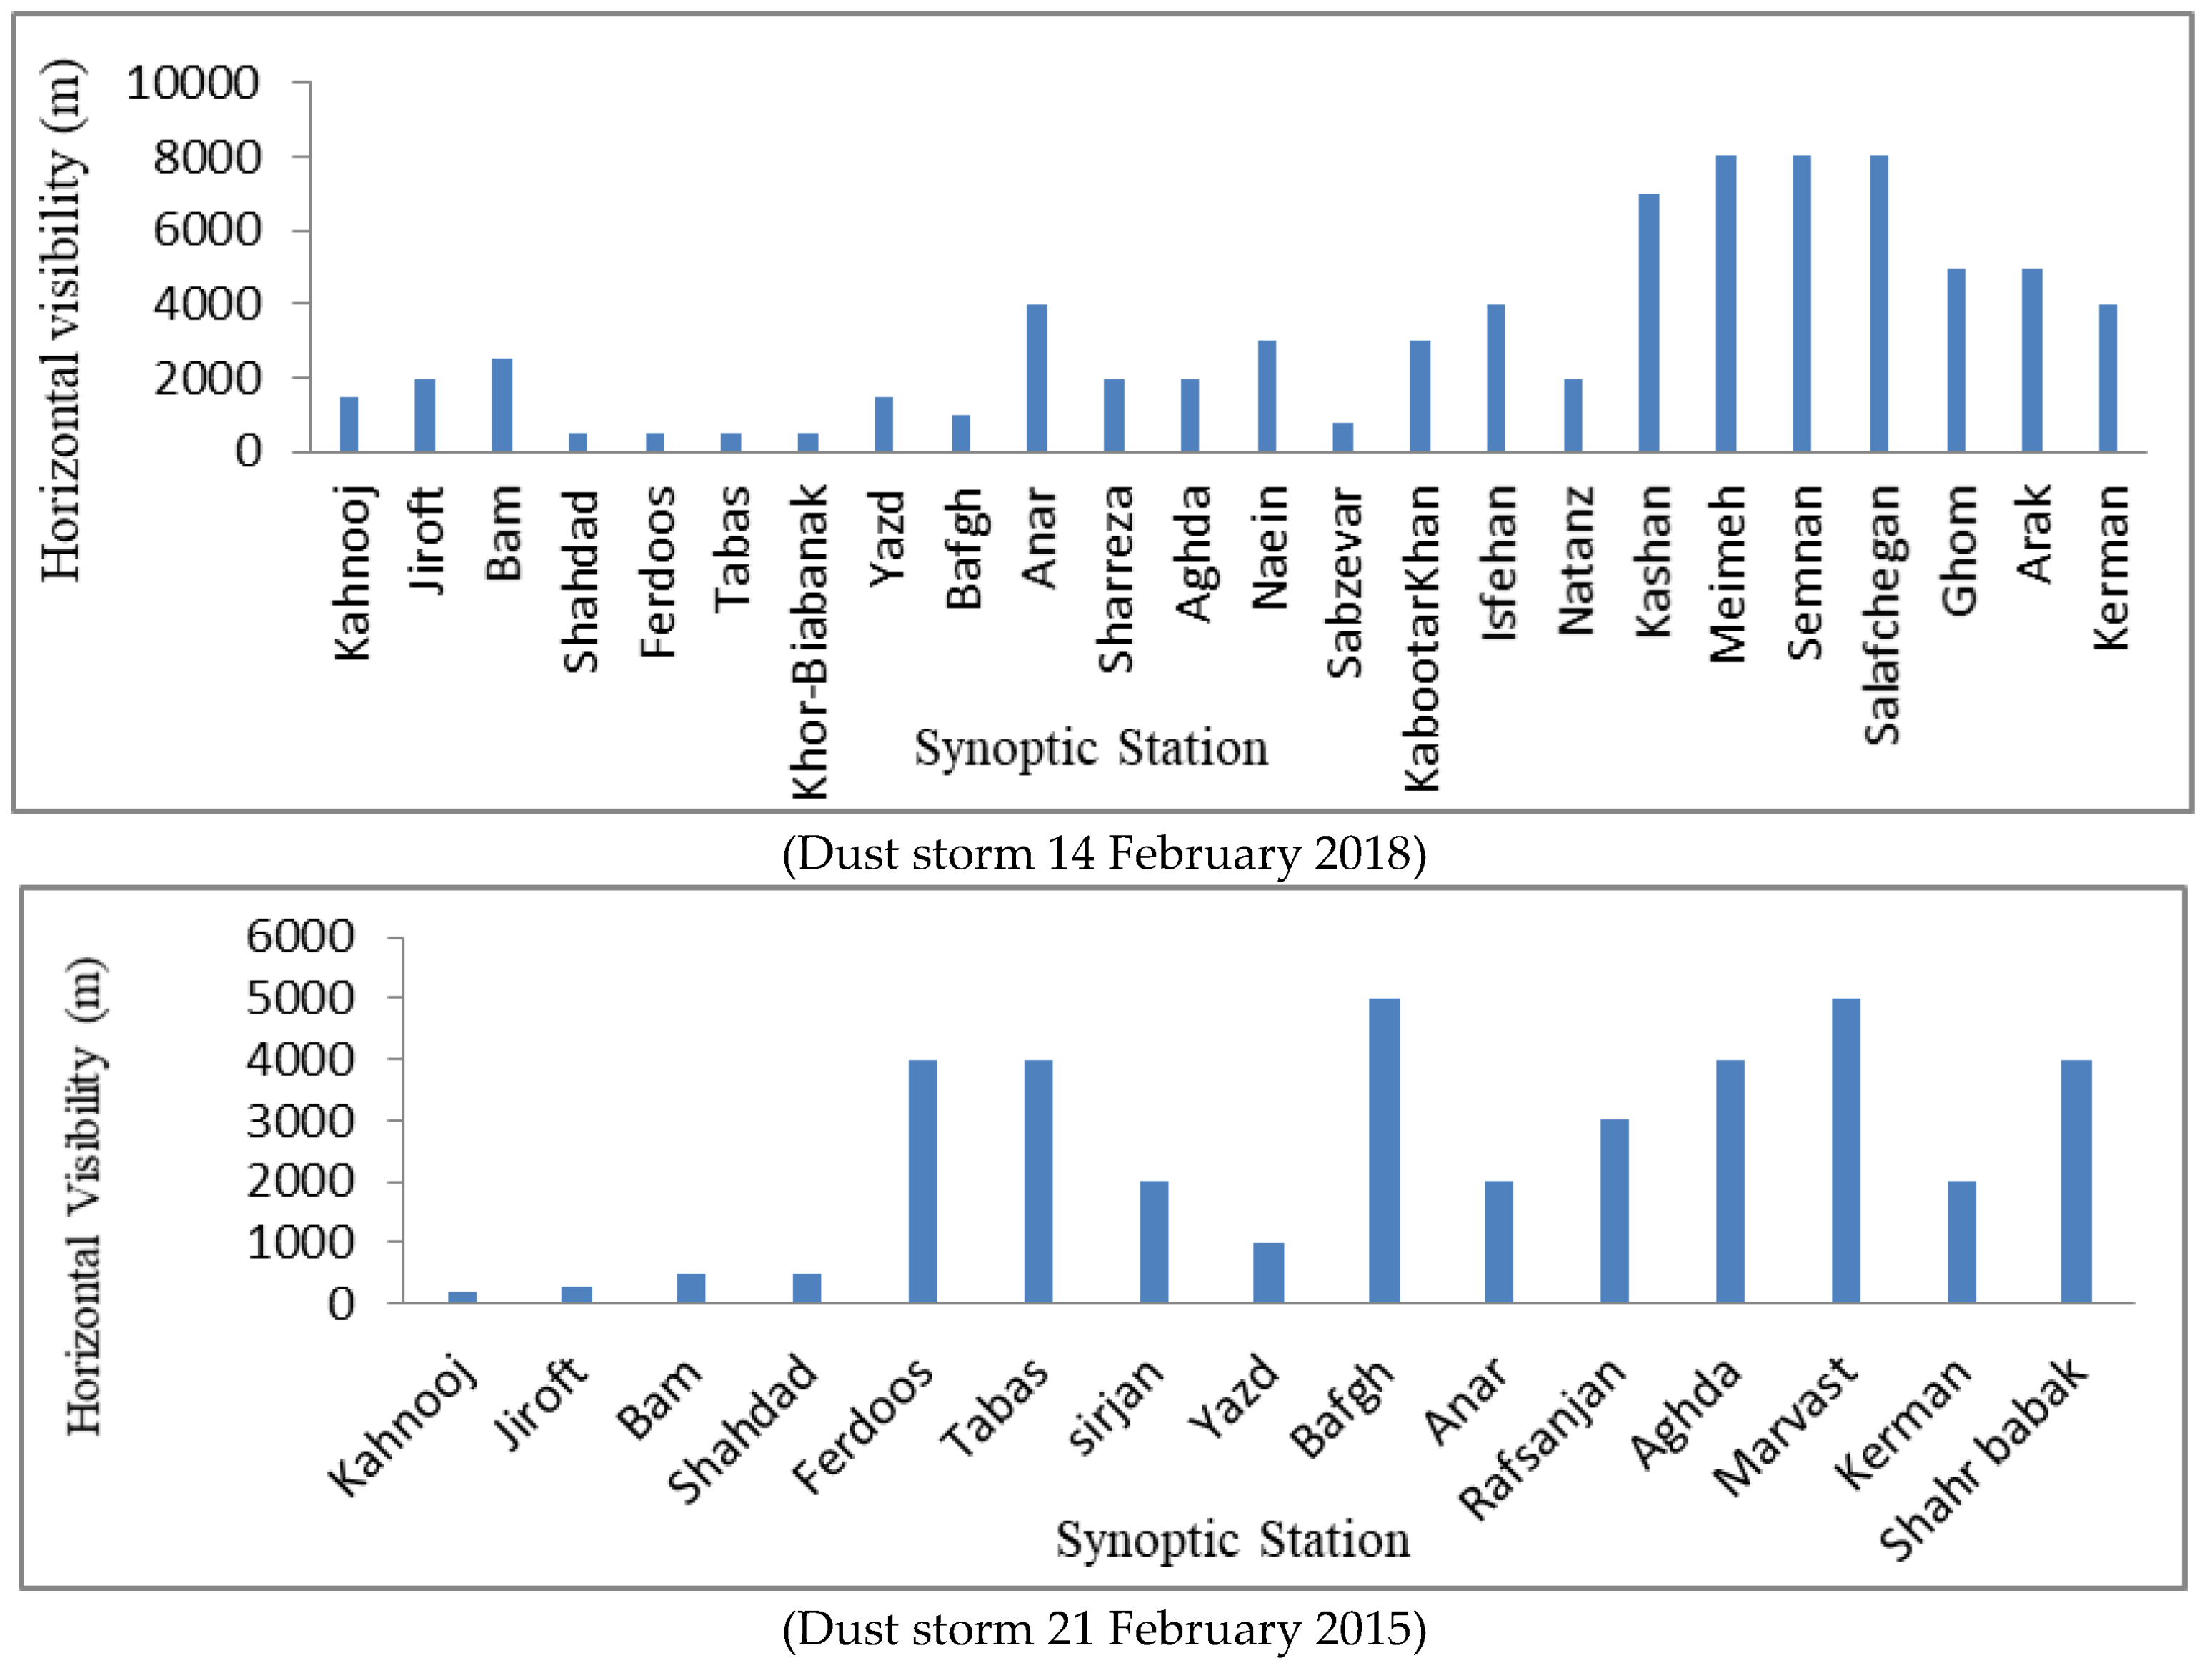
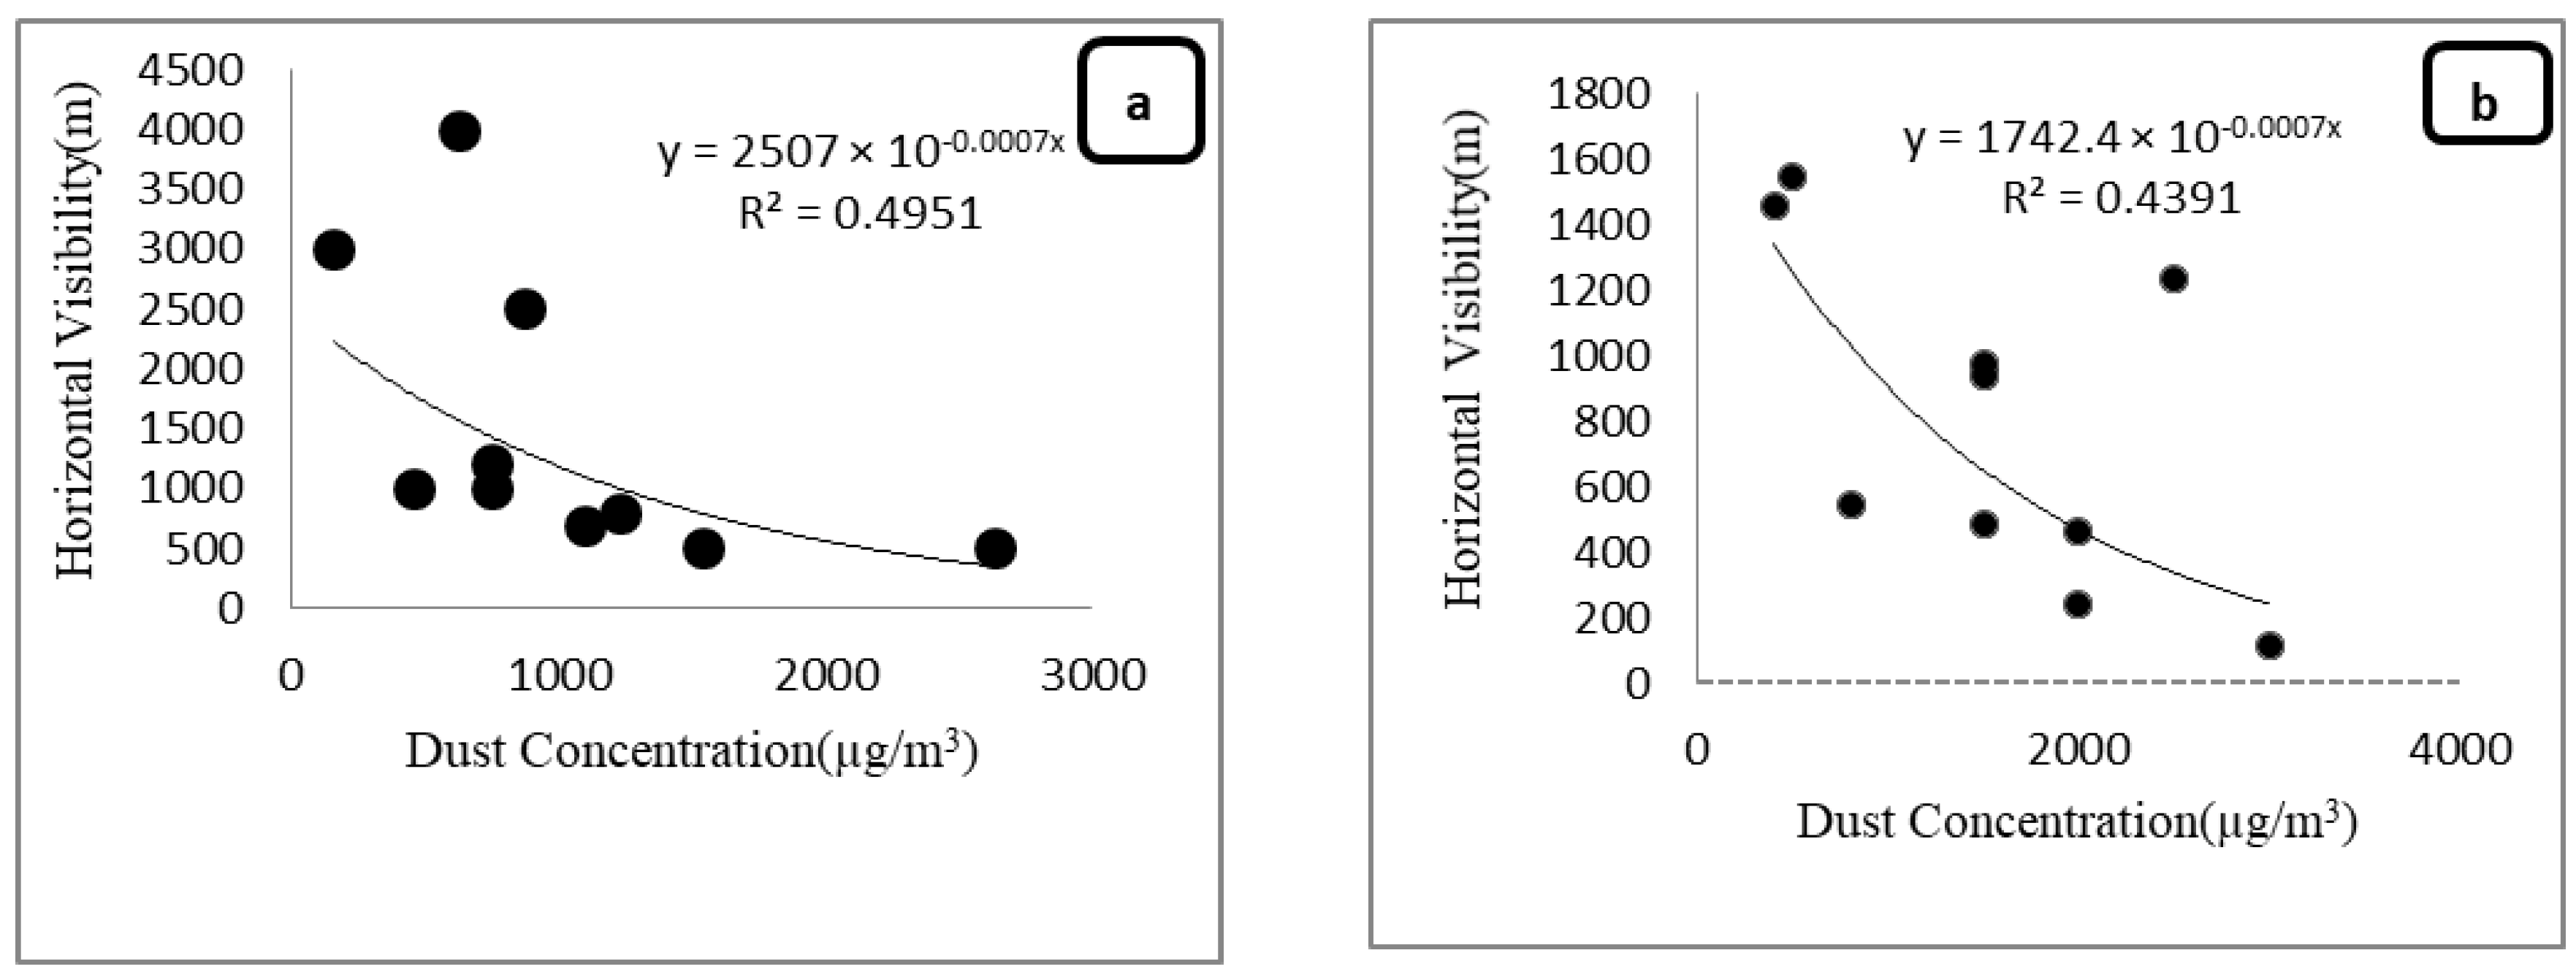
3.5.1. Validation of WRF-Chem by Horizontal Visibility

Surface concentration values simulated by GOCART and AFWA schemes as well as the horizontal visibility of synoptic stations were analyzed using the Pearson’s correlation. The results showed that an exponential decay function fitted to the surface dust concentration simulated by GOCART scheme had a coefficient of determination of 0.73 with horizontal visibility values in storm 14 February 2018 and of 0.77 in storm 21 February 2015, which were significantly different from zero at the 95% level (Figure 14).
However, the surface concentration values simulated by the AFWA scheme were much less well correlated with the horizontal visibility values of the synoptic stations, with a coefficient of determination in the 14 February 2018 storm of about 0.50 and in the 21 February 2015 storm of about 0.44 (Figure 15). These results suggest that the values simulated by the GOCART scheme are better than the AFWA scheme.

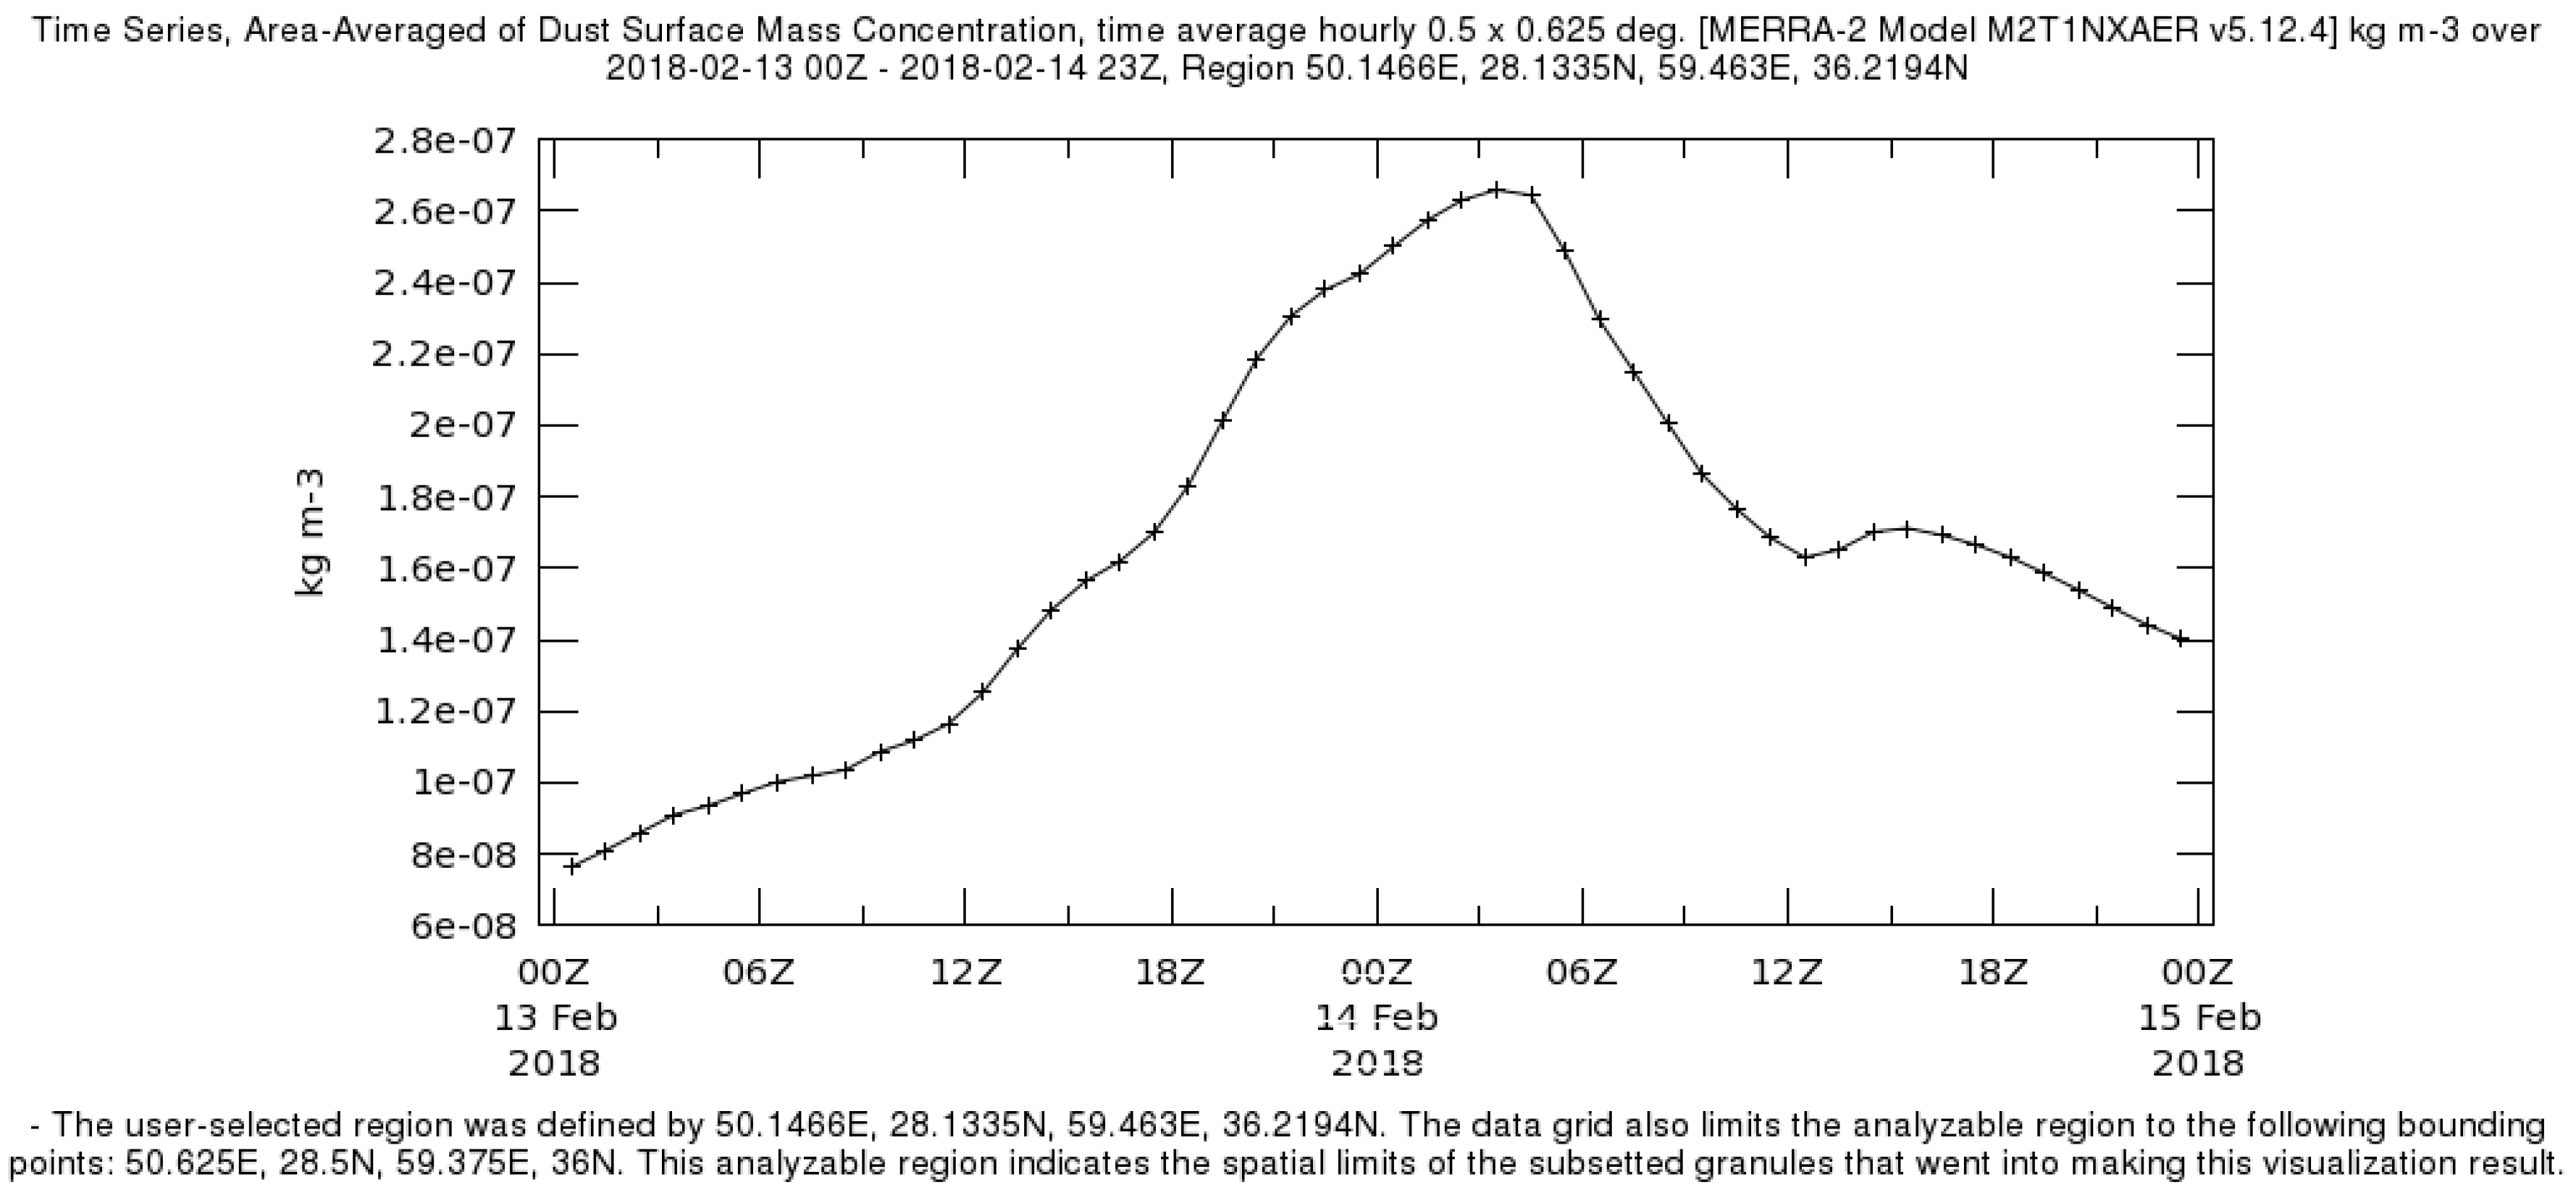
3.5.2. Validation of WRF-Chem by MERRA2 Dataset

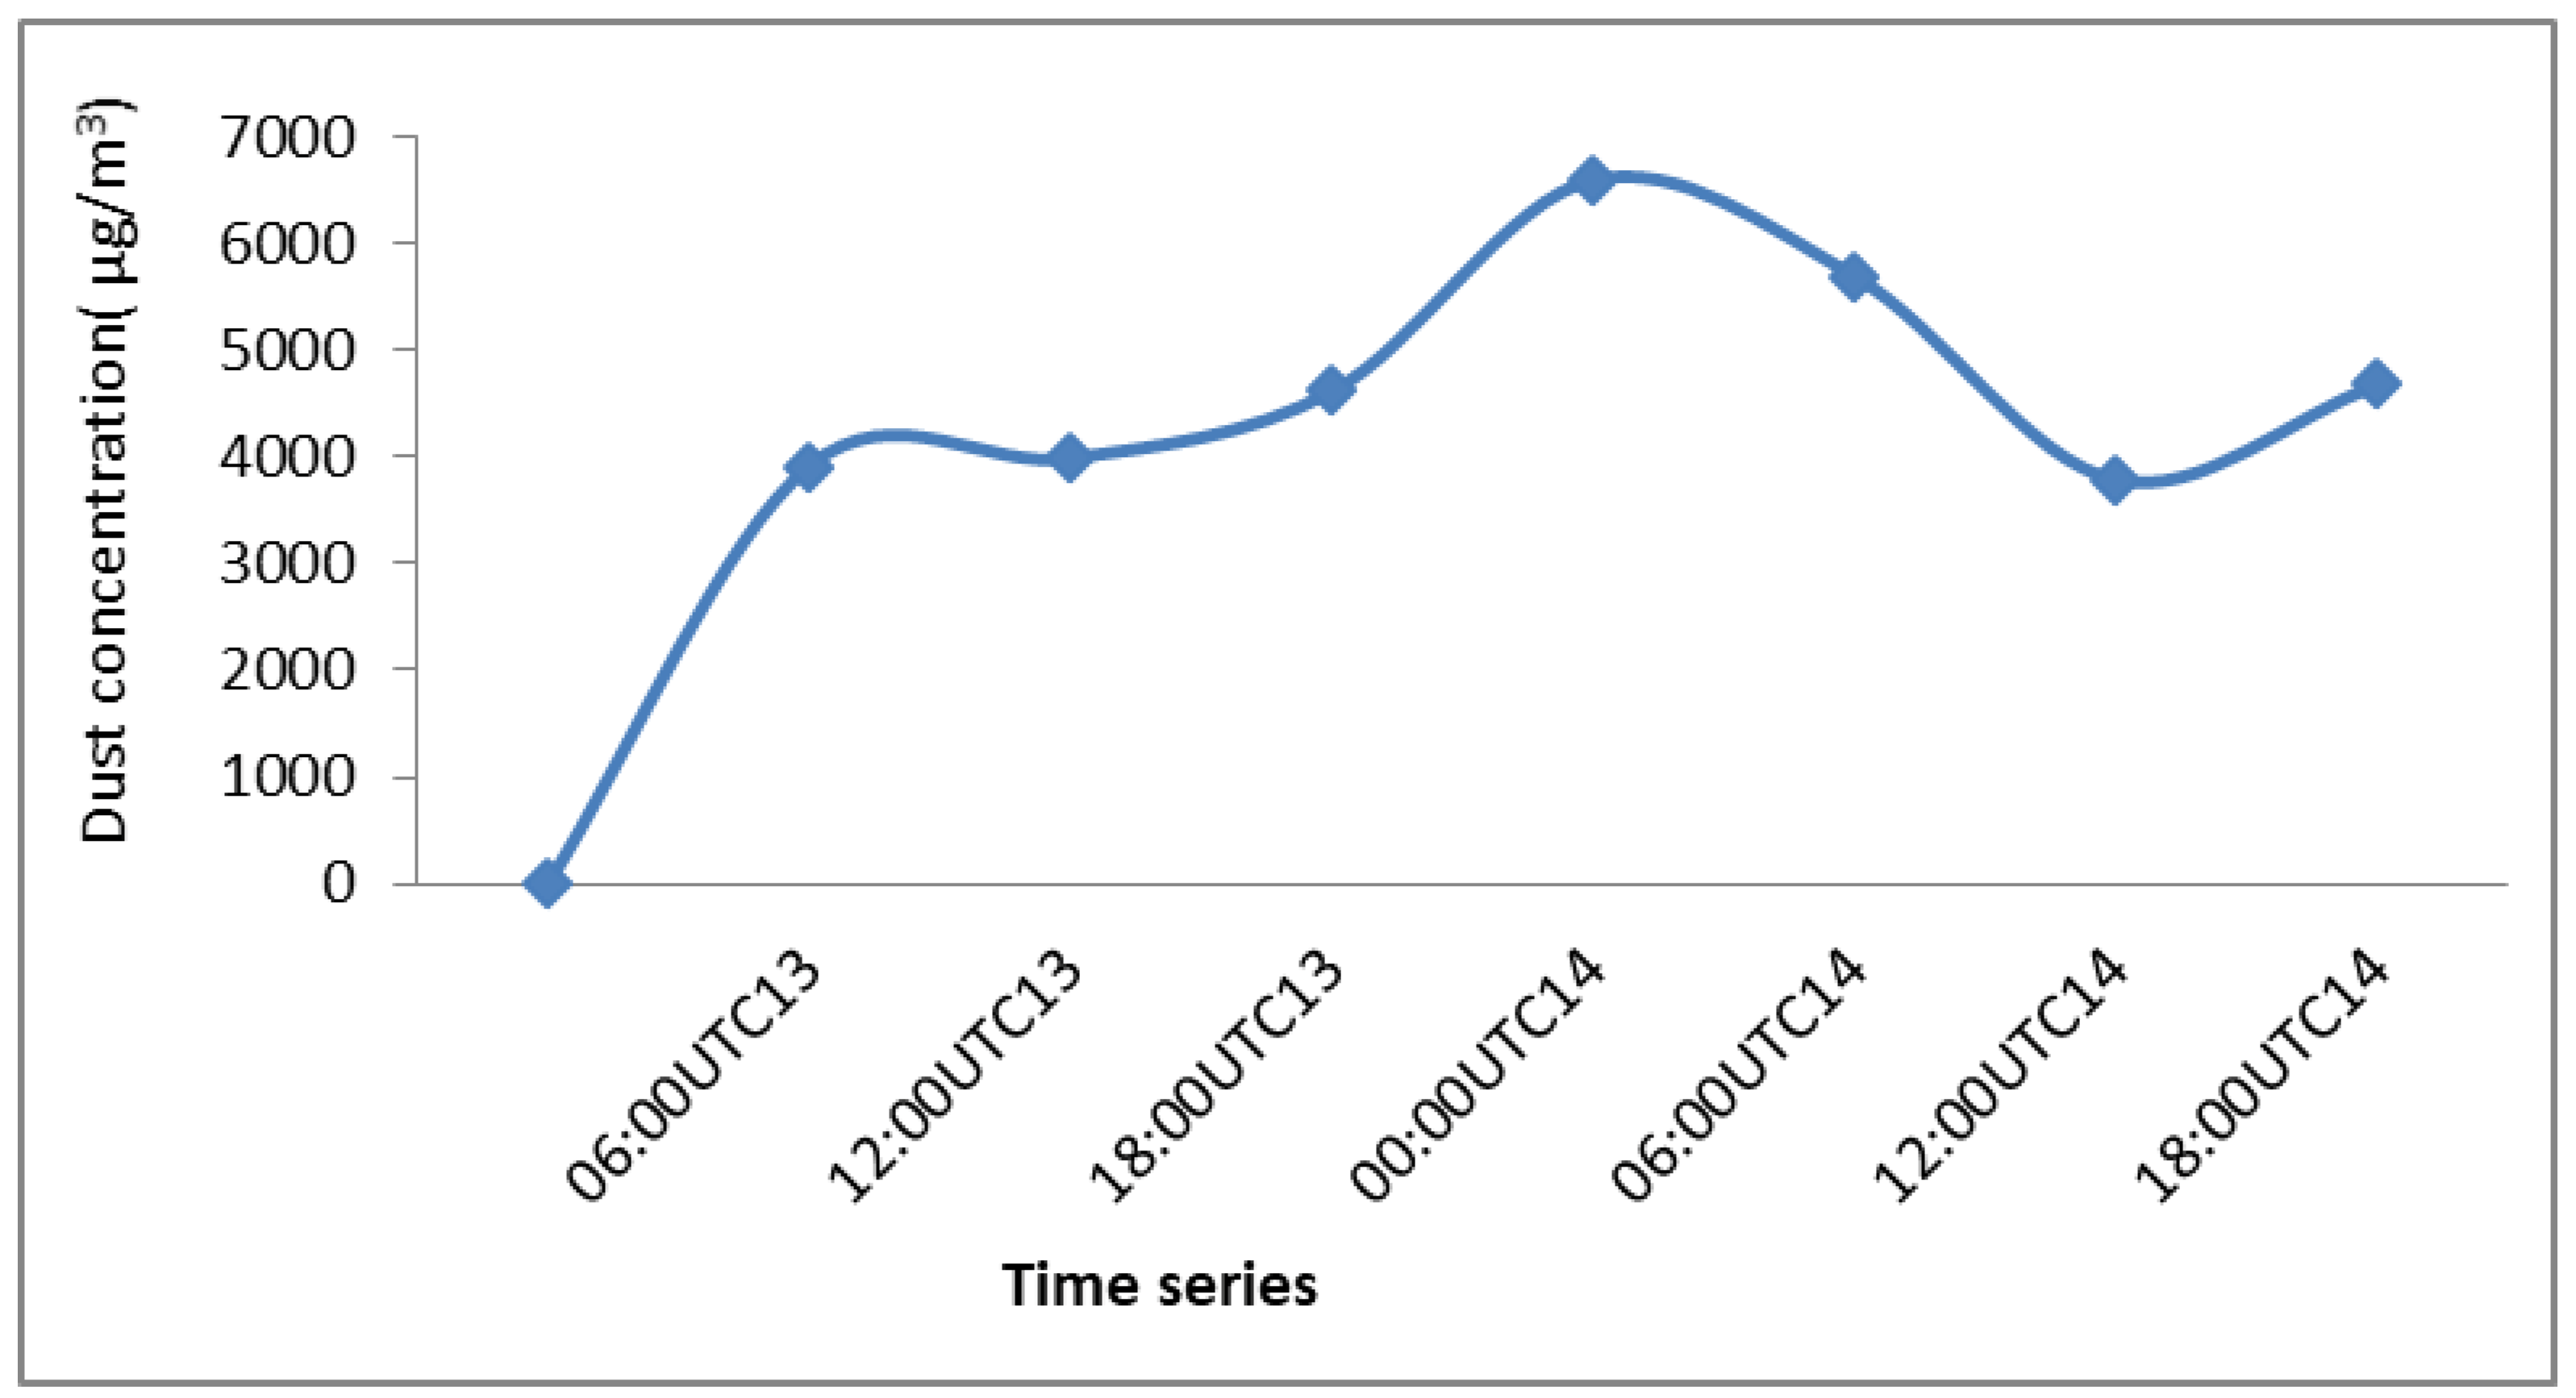
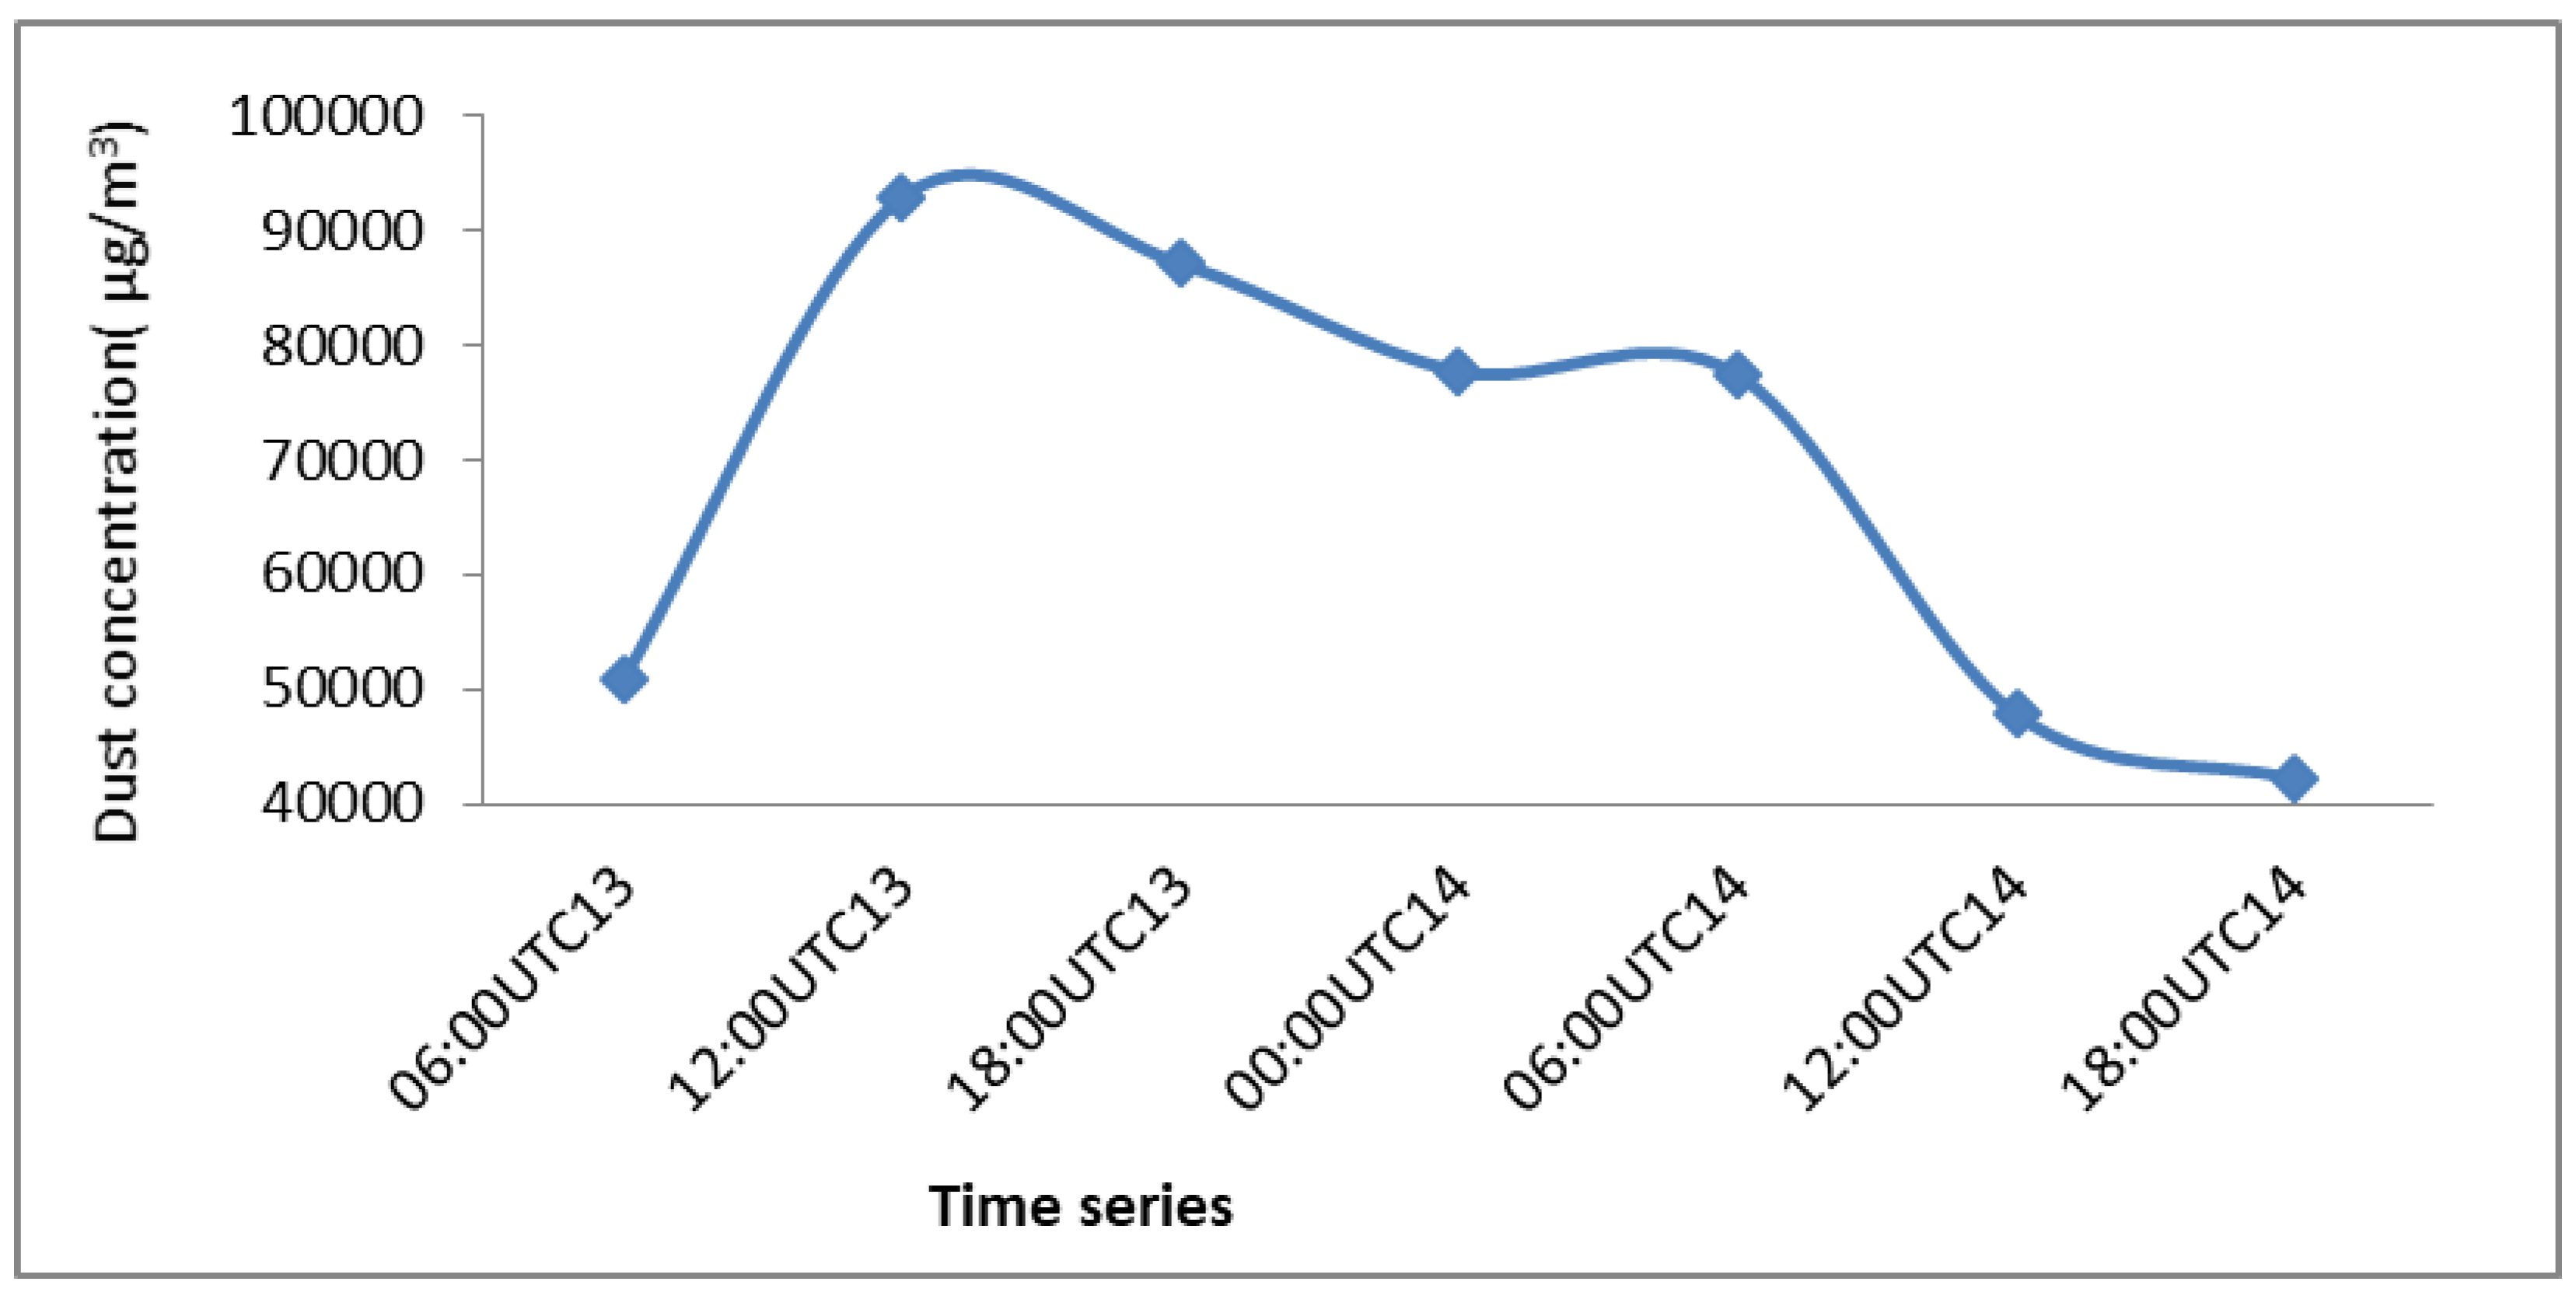
Numerical Simulation of Storm Dust Surface Concentration on 14 February 2018 with AFWA and GOCART Schemes

Results for modeled dust concentration at a height of 1.8 m above the surface and 3-h time intervals are shown in Figure 16.
Similarly, the values of dust surface concentration were also simulated for 14 February 2018 using the GOCART scheme. Results for modeled dust concentration at a height of 1.8 m above the surface and 3-h time intervals are shown in Figure 17.
The time series of the dust surface concentration with the two schemes are shown in Figure 18 and Figure 19. In order to validate the time series of simulated concentrations by the GOCART and AFWA schemes, dust surface concentration from the MERRA-2 reanalysis was used, as shown in Figure 20. The results of comparing the time series diagram of the three-hour time series model simulated by GOCART schema with the time series from MERRA-2 dataset show that the highest amount of dust concentration in MERRA-2 is at 0 and 3 h on February 14, and this concentration is similar to that simulated by the GOCART scheme. However, the time series simulated with the AFWA scheme (Figure 19) does not match well with that obtained from MERRA-2.

4. Discussion and Conclusions

In the present study, the WRF-Chem model simulated the dust emission flux during the storms of 14 February 2018 and 21 February 2015. The selection criterion for the storms was observed horizontal visibility of less than 1000 m, which was determined using the data of synoptic stations. In order to validate the synoptic data as well as to investigate the extent of the storms in the study area, MODIS images were used to show the dust on 14 February 2018 and 21 February 2015 in Central Iran. MODIS images confirmed the horizontal visibility observations at synoptic stations. Additionally, the NOAA HYSPLIT model showed that airmasses originating in external dust source regions affected much of central Iran. The results of back trajectories from the NOAA HYSPLIT model show that dust storms on the February 2018 and 2015 involved flow from the Arabian Desert to the Central Plateau. In this study, two schemes were used for WRF-Chem simulation. Different domains were employed for the two events to capture the dust source suggested by the back trajectory analysis. Vertical dust flux maps were simulated using the AFWA and GOCART schemes, and the output fields analyzed at 3-h intervals. The results showed that the WRF-Chem model can simulate the dust phenomenon well and is able to identify highly erodible surfaces with both schemes. This study showed that the Arabian deserts play a key role in the formation of the core of Iran’s dust storms. Given that Persian Gulf is in between Iran and the Saudi Arabian deserts, one may understand that conditions are also difficult for shipping due to the reduced horizontal visibility when dust storms occur in these areas. The results also show that Loot desert and central desert are two of the main dust sources in Iran.
These severe storms occurred in winter, which is the cool and rainy season of the region. However, due to climate change that is reducing rainfall in the area, wetland areas are becoming drier even during the cool and rainy season and may become a dust hot spot. Due to the significant decrease in precipitation in the study area and the severe dryness of soil surfaces, the VDF from the Loot desert reached over 4000 μg/(m2s). The results of the simulation of the storm of 21 February 2015 in the Central Plateau of Iran by the WRF-Chem model show that the central core of this phenomenon is in the Arabian deserts, along with, in south-eastern Iran, parts of Loot desert and Jazmoorian wetland, which are considered as the internal cores of this storm. Horizontal visibility of synoptic stations and surface concentration simulated by GOCART and AFWA schemes were used to validate and compare the results of the two schemes. The results showed that the values simulated by the GOCART model had a significant correlation with the values of the horizontal visibility at the synoptic stations, but the results of the AFWA model did not show as high a correlation. The number of source regions identified by the GOCART model in the storm 14 February 2018 is eight, including two sources in Loot desert, one source in Jazmourian, one source in Hirmand basin, two sources in Central desert and one source in Dranjir desert. Additionally, the number of sources identified by the GOCART model in the storm of 21 February 2015 is four with two sources in Loot desert, one source in Jazmourian and one source in Hirmand basin.
Several previous studies are consistent with the result of this paper. Cao et al. [67], in a study to determine dust sources in Iran, stated that in south-eastern Iran, Sistan basin can be characterized as an internal dust source. Additionally, Alizadeh-Choobari et al. [34] also pointed to the importance of the Sistan basin in eastern Iran and the 120-day winds in this area, which is one of the most important causes of dust in the eastern and south-eastern regions of Iran. This is consistent with the results of this research (identification of dust centres in Hirmand Basin); Baghbanan et al. [68], studying the spatial pattern of dust storms in Iran, showed that the main source of dust is in southern and south-eastern parts of Iran, while Rezazadeh et al. [69] identified the Arabian deserts and the country of Afghanistan as external dust sources into Iran.
The dust phenomena in Iran, especially in the Central Plateau, is very important for its ecological, economic, and health impacts. The identification of dust sources and planning for their management is of particular importance. Additionally, for the cases analyzed in this study, we identified the Arabian deserts in Saudi Arabia as external dust sources. This illustrates that dust is an international phenomenon and requires international interactions to manage it.

Author Contributions

Conceptualization, T.M. and A.S.; methodology, F.S.S.; software, S.K.; validation, A.R., M.M.M. and formal analysis, F.S.S.; investigation, T.M.; resources, G.Z.; data curation, A.R.; writing—original draft preparation, F.S.S.; writing—review and editing, N.Y.K. and M.M.M.; supervision, T.M. and A.S. All authors have read and agreed to the published version of the manuscript.

Funding

This research received no external funding.

Acknowledgments

We thank the personnel of the University of Tehran and the Iranian Meteorological Organization. The authors gratefully acknowledge the NOAA Air Resources Laboratory (ARL) for the provision of the HYSPLIT transport and dispersion model and READY website (http://www.ready.noaa.gov) used in this publication.

Conflicts of Interest

The authors declare no conflict of interest.

References

  1. Obregón, M.A.; Pereira, S.N.; Salgueiro, V.; Costa, M.J.; Silva, A.M.; Serrano, A.; Bortoli, D. Aerosol radiative effects during two desert dust events in August 2012 over the Southwestern Iberian Peninsula. Atmos. Res. 2015, 153, 404–415. [Google Scholar] [CrossRef] [Green Version]
  2. Chen, Y.S.; Sheen, P.C.; Chen, E.R.; Liu, Y.K.; Wu, T.N.; Yang, C.Y. Effects of Asian dust storm events on daily mortality in Taipei, Taiwan. Environ. Res. 2004, 95, 151–155. [Google Scholar] [CrossRef] [PubMed]
  3. Kim, K.W.; Kim, Y.J.; Oh, S.J. Visibility impairment during Yellow Sand periods in the urban atmosphere of Kwangju, Korea. Atmos. Environ. 2001, 35, 5157–5167. [Google Scholar] [CrossRef]
  4. Middleton, N. Desert dust hazards: A global review. Aeolian Res. 2017, 24, 53–63. [Google Scholar] [CrossRef]
  5. Vaghefi, S.A.; Keykhai, M.; Jahanbakhshi, F.; Sheikholeslami, J.; Ahmadi, A.; Yang, H.; Abbaspour, K.C.; Ahmadi, A. The future of extreme climate in Iran. Sci. Rep. 2019, 9, 1464. [Google Scholar] [CrossRef] [Green Version]
  6. Buschiazzo, D.E.; Zobeck, T.M. Validation of WEQ, RWEQ and WEPS wind erosion for different arable land management systems in the Argentinean Pampas. Earth Surf. Process. Landf. 2008, 33, 1839–1850. [Google Scholar] [CrossRef]
  7. Webb, N.P.; McGowan, H.; Phinn, S.; Leys, J.F.; McTainsh, G.H. A model to predict land susceptibility to wind erosion in western Queensland, Australia. Environ. Model. Softw. 2009, 24, 214–227. [Google Scholar] [CrossRef]
  8. Gregory, J.; Wilson, G.; Singh, U.; Darwish, M. TEAM: Integrated, process-based wind-erosion model. Environ. Model. Softw. 2004, 19, 205–215. [Google Scholar] [CrossRef]
  9. Alfaro, S.C.; Gaudichet, A.; Gomes, L.; Maillé, M. Modeling the size distribution of a soil aerosol produced by sandblasting. J. Geophys. Res. Space Phys. 1997, 102, 11239–11249. [Google Scholar] [CrossRef]
  10. Li, J.; Okin, G.S.; Alvarez, L.; Epstein, H. Quantitative effects of vegetation cover on wind erosion and soil nutrient loss in a desert grassland of southern New Mexico, USA. Biogeochemistry 2007, 85, 317–332. [Google Scholar] [CrossRef]
  11. Hoffmann, C.; Funk, R.; Reiche, M.; Li, Y. Assessment of extreme wind erosion and its impacts in Inner Mongolia, China. Aeolian Res. 2011, 3, 343–351. [Google Scholar] [CrossRef]
  12. Nickovic, S.; Kallos, G.; Papadopoulos, A.; Kakaliagou, O. A model for prediction of desert dust cycle in the atmosphere. J. Geophys. Res. Space Phys. 2001, 106, 18113–18129. [Google Scholar] [CrossRef] [Green Version]
  13. Cope, M.E.; Hess, G.D.; Lee, S.; Tory, K.; Azzi, M.; Carras, J.; Lilley, W.; Manins, P.C.; Nelson, P.F.; Ng, L.; et al. The Australian Air Quality Forecasting System. Part I: Project Description and Early Outcomes. J. Appl. Meteorol. 2004, 43, 649–662. [Google Scholar] [CrossRef]
  14. Shao, Y.; Yang, Y.; Wang, J.; Song, Z.; Leslie, L.M.; Dong, C.; Zhang, Z.; Lin, Z.; Kanai, Y.; Yabuki, S.; et al. Northeast Asian dust storms: Real-time numerical prediction and validation. J. Geophys. Res. Space Phys. 2003, 108, D22. [Google Scholar] [CrossRef] [Green Version]
  15. Park, S.H.; Gong, S.L.; Zhao, T.L.; Vet, R.J.; Bouchet, V.S.; Gong, W.; Makar, P.A.; Moran, M.D.; Stroud, C.; Zhang, J. Simulation of entrainment and transport of dust particles within North America in April 2001 (“Red Dust Episode”). J. Geophys. Res. Space Phys. 2007, 112. [Google Scholar] [CrossRef] [Green Version]
  16. Tanaka, T.; Orito, K.; Sekiyama, T.T.; Shibata, K.; Chiba, M.; Tanaka, H. MASINGAR, a global tropospheric aerosol chemical transport model coupled with MRI/JMA98 GCM: Model description. Pap. Meteorol. Geophys. 2003, 53, 119–138. [Google Scholar] [CrossRef] [Green Version]
  17. Uno, I.; Satake, S.; Carmichael, G.; Tang, Y.; Wang, Z.; Takemura, T.; Sugimoto, N.; Shimizu, A.; Murayama, T.; Cahill, T.A.; et al. Numerical study of Asian dust transport during the springtime of 2001 simulated with the Chemical Weather Forecasting System (CFORS) model. J. Geophys. Res. Space Phys. 2004, 109. [Google Scholar] [CrossRef]
  18. Liu, M.; Westphal, D.L.; Wang, S.; Shimizu, A.; Sugimoto, N.; Zhou, J.; Chen, Y. A high-resolution numerical study of the Asian dust storms of April 2001. J. Geophys. Res. Space Phys. 2003, 108. [Google Scholar] [CrossRef]
  19. Ginoux, P.; Chin, M.; Tegen, I.; Prospero, J.; Holben, B.; Dubovik, O.; Lin, S.-J. Sources and distributions of dust aerosols simulated with the GOCART model. J. Geophys. Res. Space Phys. 2001, 106, 20255–20273. [Google Scholar] [CrossRef]
  20. Goudie, A.S.; Middleton, N.J. Saharan dust storms: Nature and consequences. Earth Sci. Rev. 2001, 56, 179–204. [Google Scholar] [CrossRef]
  21. Zender, C.S.; Bian, H.; Newman, D. Mineral Dust Entrainment and Deposition (DEAD) model: Description and 1990s dust climatology. J. Geophys. Res. Space Phys. 2003, 108, 4416. [Google Scholar] [CrossRef] [Green Version]
  22. Shao, Y. A model for mineral dust emission. J. Geophys. Res. Space Phys. 2001, 106, 20239–20254. [Google Scholar] [CrossRef]
  23. Grell, G.; Peckham, S.E.; Schmitz, R.; McKeen, S.A.; Frost, G.; Skamarock, W.C.; Eder, B. Fully coupled “online” chemistry within the WRF model. Atmos. Environ. 2005, 39, 6957–6975. [Google Scholar] [CrossRef]
  24. Peckham, S.E.; Fast, J.; Schmitz, R.; Grell, G.A.; Gustafson, W.I.; McKeen, S.A.; Ghan, S.J.; Zaveri, R.; Easter, R.C.; Barnard, J.; et al. WRF/Chem Version 3.3 User’s Guide; NOAA Technical Memo; NOAA: Silver Spring, MD, USA, 2011.
  25. Nabavi, S.O.; Haimberger, L.; Samimi, C. Sensitivity of WRF-chem predictions to dust source function specification in West Asia. Aeolian Res. 2017, 24, 115–131. [Google Scholar] [CrossRef]
  26. Su, L.; Fung, J.C.H. Sensitivities of WRF-Chem to dust emission schemes and land surface properties in simulating dust cycles during Sourcetime over East Asia. J. Geophys. Res. Atmos. 2015, 120, 11215–11230. [Google Scholar] [CrossRef] [Green Version]
  27. Xiaolan, L.; Hongsheng, Z. Soil Moisture Effects on Sand Saltation and Dust Emission Observed over the Horqin Sandy Land Area in China. J. Meteorol. Res. 2014, 28, 444–452. [Google Scholar]
  28. Rizza, U.; Miglietta, M.M.; Mangia, C.; Ielpo, P.; Morichetti, M.; Iachini, C.; Virgili, S.; Passerini, G. Sensitivity of WRF-Chem model to land surface schemes: Assessment in a severe dust outbreak episode in the Central Mediterranean (Apulia Region). Atmos. Res. 2018, 201, 168–180. [Google Scholar] [CrossRef]
  29. Song, H.; Wang, K.; Zhang, Y.; Hong, C.; Zhou, S. Simulation and evaluation of dust emissions with WRF-Chem (v3.7.1) and its relationship to the changing climate over East Asia from 1980 to 2015. Atmos. Environ. 2017, 167, 511–522. [Google Scholar] [CrossRef]
  30. Teixeira, J.; Carvalho, A.; Tuccella, P.; Curci, G.; Rocha, A. WRF-chem sensitivity to vertical resolution during a saharan dust event. Phys. Chem. Earth Parts A/B/C 2016, 94, 188–195. [Google Scholar] [CrossRef]
  31. Tang, Y.; Han, Y.; Liu, Z. Temporal and spatial characteristics of dust devils and their contribution to the aerosol budget in East Asia—An analysis using a new parameterization scheme for dust devils. Atmos. Environ. 2018, 182, 225–233. [Google Scholar] [CrossRef]
  32. Chen, S.; Yuan, T.; Zhang, X.; Zhang, G.; Feng, T.; Zhao, D.; Zang, Z.; Liao, S.; Ma, X.; Jiang, N.; et al. Dust modeling over East Asia during the summer of 2010 using the WRF-Chem model. J. Quant. Spectrosc. Radiat. Transf. 2018, 213, 1–12. [Google Scholar] [CrossRef]
  33. Alizadeh-Choobari, O.; Zawar-Reza, P.; Sturman, A. Low level jet intensification by mineral dust aerosols. Ann. Geophys. 2013, 31, 625–632. [Google Scholar] [CrossRef]
  34. Alizadeh-Choobari, O.; Zawar-Reza, P.; Sturman, A. The “wind of 120days” and dust storm activity over the Sistan Basin. Atmos. Res. 2014, 143, 328–341. [Google Scholar] [CrossRef]
  35. Chin, M.; Savoie, D.L.; Huebert, B.J.; Bandy, A.; Thornton, D.C.; Bates, T.S.; Quinn, P.; Saltzman, E.S.; De Bruyn, W.J. Atmospheric sulfur cycle simulated in the global model GOCART: Comparison with field observations and regional budgets. J. Geophys. Res. Space Phys. 2000, 105, 24689–24712. [Google Scholar] [CrossRef] [Green Version]
  36. Flaounas, E.; Kotroni, V.; Lagouvardos, K.; Klose, M.; Flamant, C.; Giannaros, T.M. Assessing atmospheric dust modelling performance of WRF-Chem over the semi-arid and arid regions around the Mediterranean. Atmos. Chem. Phys. Discuss. 2016, 1–28. [Google Scholar] [CrossRef] [Green Version]
  37. Uzan, L.; Egert, S.; Alpert, P. Ceilometer evaluation of the eastern Mediterranean summer boundary layer height—First study of two Israeli sites. Atmos. Meas. Tech. 2016, 9, 4387–4398. [Google Scholar] [CrossRef] [Green Version]
  38. Cremades, P.G.; Fernández, R.P.; Allende, D.G.; Mulena, G.C.; Puliafito, S.E. High resolution satellite derived erodibility factors for WRF/Chem windblown dust simulations in Argentina. Atmósfera 2017, 30, 11–25. [Google Scholar] [CrossRef] [Green Version]
  39. Fast, J.D.; Gustafson, W.I., Jr.; Easter, R.C.; Zaveri, R.A.; Barnard, J.C.; Chapman, E.G.; Grell, G.A.; Peckham, S.E. Evolution of ozone, particulates, and aerosol direct forcing in an urban area using a new fully-coupled meteorology, chemistry, and aerosol model. J. Geophys. Res. 2006, 111, D21305. [Google Scholar] [CrossRef]
  40. Kalenderski, S.; Stenchikov, G.; Zhao, C. Modeling a typical winter-time dust event over the Arabian Peninsula and the Red Sea. Atmos. Chem. Phys. Discuss. 2013, 13, 1999–2014. [Google Scholar] [CrossRef] [Green Version]
  41. Kumar, R.; Barth, M.C.; Pfister, G.G.; Naja, M.; Brasseur, G.P. WRF-Chem simulations of a typical pre-monsoon dust storm in northern India: Influences on aerosol optical properties and radiation budget. Atmos. Chem. Phys. Discuss. 2014, 14, 2431–2446. [Google Scholar] [CrossRef] [Green Version]
  42. Prakash, P.J.; Stenchikov, G.; Kalenderski, S.; Osipov, S.; Bangalath, H.K. The impact of dust storms on the Arabian Peninsula and the Red Sea. Atmos. Chem. Phys. Discuss. 2015, 15, 199–222. [Google Scholar] [CrossRef] [Green Version]
  43. Zhao, C.; Liu, X.; Leung, L.R.; Johnson, B.; McFarlane, S.A.; Gustafson, W.I., Jr.; Fast, J.D.; Easter, R. The spatial distribution of mineral dust and its shortwave radiative forcingover North Africa: Modeling sensitivities to dust emissions and aerosol size treatments. Atmos. Chem. Phys. 2010, 10, 8821–8838. [Google Scholar] [CrossRef] [Green Version]
  44. Zhao, C.; LiuiD, X.; Leung, L.R.; Hagos, S. Radiative impact of mineral dust on monsoon precipitation variability over West Africa. Atmos. Chem. Phys. Discuss. 2011, 11, 1879–1893. [Google Scholar] [CrossRef] [Green Version]
  45. Zhao, C.; Chen, S.; Leung, L.R.; Qian, Y.; Kok, J.F.; Zaveri, R.A.; Huang, J. Uncertainty in modeling dust mass balance and radiative forcing from size parameterization. Atmos. Chem. Phys. 2013, 13, 10733–10753. [Google Scholar] [CrossRef] [Green Version]
  46. Dipu, S.; Prabha, T.V.; Pandithurai, G.; Dudhia, J.; Pfister, G.; Rajesh, K.; Goswami, B. Impact of elevated aerosol layer on the cloud macrophysical properties prior to monsoon onset. Atmos. Environ. 2013, 70, 454–467. [Google Scholar] [CrossRef]
  47. Karegar, E.; Hamzeh, N.H.; Jamali, J.B.; Abadi, A.R.S.; Moeinaddini, M.; Goshtasb, H. Numerical simulation of extreme dust storms in east of Iran by the WRF-Chem model. Nat. Hazards 2019, 99, 769–796. [Google Scholar] [CrossRef]
  48. Farhadipour, S.; Azadi, M.; Bidokhti, A.A.; Sayyari, H.; Choobari, O.A. Study and Simulation of Severe Dust Storms in the West and Southwest of Iran. Russ. Meteorol. Hydrol. 2018, 43, 613–624. [Google Scholar] [CrossRef]
  49. Azadi, S.; Soltani Kopaei, S.; Faramarzi, M.; Soltani Tudeshki, A.; Pornmanafi, S. Evaluation of the Palmer Drought Index in Central Iran. J. Water Soil Sci. 2015, 19, 305–318. [Google Scholar] [CrossRef]
  50. Naderi, M.; Raeisi, E. Climate change in a region with altitude differences and with precipitation from various sources, South-Central Iran. Theor. Appl. Clim. 2015, 124, 529–540. [Google Scholar] [CrossRef]
  51. Jafari, M.; Zehtabian, G.; Mesbahzadeh, T. Statistical analysis of the dust storm phenomenon (case study: Isfahan). Iran. J. Range Desert Res. 2019, 25, 863–876. [Google Scholar]
  52. Azizi, G.; Shamsipour, A.; Miri, M.; Safarrad, T. Synoptic and remote sensing analysis of dust events in southwestern Iran. Nat. Hazards 2012, 64, 1625–1638. [Google Scholar]
  53. Earthdata Search. Available online: https://search.earthdata.nasa.gov/search/granules (accessed on 14 February 2018).
  54. Ackerman, S. Remote sensing aerosols using satellite infrared observations. J. Geophys. Res. Space Phys. 1997, 102, 17069–17079. [Google Scholar] [CrossRef]
  55. Draxler, R.R.; Hess, G.D. Description of the HYSPLIT_4 modeling system. In NOAA Tech. Memo. ERL ARL-224; Air Resources Laboratory: Silver Spring, MD, USA, 1997. [Google Scholar]
  56. Stein, A.; Draxler, R.R.; Rolph, G.D.; Stunder, B.J.B.; Cohen, M.D.; Ngan, F. NOAA’s HYSPLIT Atmospheric Transport and Dispersion Modeling System. Bull. Am. Meteorol. Soc. 2015, 96, 2059–2077. [Google Scholar] [CrossRef]
  57. Rolph, G.; Stein, A.; Stunder, B. Real-time Environmental Applications and Display System: READY. Environ. Model. Softw. 2017, 95, 210–228. [Google Scholar] [CrossRef]
  58. Shao, Y.; Dong, C. A review on East Asian dust storm climate, modelling and monitoring. Glob. Planet. Chang. 2006, 52, 1–22. [Google Scholar] [CrossRef]
  59. Shao, Y.; Wyrwoll, K.-H.; Chappell, A.; Huang, J.; Lin, Z.; McTainsh, G.; Mikami, M.; Tanaka, T.; Wang, X.; Yoon, S. Dust cycle: An emerging core theme in Earth system science. Aeolian Res. 2011, 2, 181–204. [Google Scholar] [CrossRef]
  60. Hamzeh, N.H.; Karami, S.; Ranjbar, A. Simulation of a severe dust storm with different dust emission schemes. E3s Web Conf. 2019, 99, 02013. [Google Scholar] [CrossRef]
  61. Gillette, D.A.; Passi, R. Modeling dust emission caused by wind erosion. J. Geophys. Res. Space Phys. 1988, 93, 14233–14242. [Google Scholar] [CrossRef] [Green Version]
  62. Marticorena, B.; Bergametti, G. Modeling the atmospheric dust cycle: 1. Design of a soil-derived dust emission scheme. J. Geophys. Res. Space Phys. 1995, 100, 16415. [Google Scholar] [CrossRef] [Green Version]
  63. Jones, S.L.; Adams-Selin, R.; Hunt, E.D.; Creighton, G.A.; Cetola, J.D. Update on modifications to WRF-CHEM GOCART for fine-scale dust forecasting at AFWA. In Proceedings of the AGU Fall Meeting, New Orleans, LA, USA, 11–15 December 2012. [Google Scholar]
  64. Kawamura, R. Study on sand movement by wind. Inst. Sci. Technol. Rep. 1951, 5, 95–112. (In Japanese) [Google Scholar]
  65. Holben, B.; Eck, T.; Slutsker, I.; Tanre, D.; Buis, J.; Setzer, A.; Vermote, E.; Reagan, J.; Kaufman, Y.; Nakajima, T.; et al. AERONET—A Federated Instrument Network and Data Archive for Aerosol Characterization. Remote Sens. Environ. 1998, 66, 1–16. [Google Scholar] [CrossRef]
  66. Chen, S.; Zhao, C.; Qian, Y.; Leung, L.R.; Huang, J.; Huang, Z.; Bi, J.; Zhang, W.; Shi, J.; Yang, L.; et al. Regional modeling of dust mass balance and radiative forcing over East Asia using WRF-Chem. Aeolian Res. 2014, 15, 15–30. [Google Scholar] [CrossRef]
  67. Cao, H.; Liu, J.; Wang, G.; Yang, G.; Luo, L. Identification of sand and dust storm source areas in Iran. J. Arid Land 2015, 7, 567–578. [Google Scholar] [CrossRef]
  68. Baghbanan, P.; Ghavidel, Y.; Farajzadeh, M. Spatial analysis of spring dust storms hazard in Iran. Theor. Appl. Clim. 2019, 139, 1447–1457. [Google Scholar] [CrossRef]
  69. Rezazadeh, M.; Irannejad, P.; Shao, Y. Dust emission simulation with the WRF-Chem model using new surface data in the Middle East region. J. Earth Space Phys. 2013, 39, 191–212. [Google Scholar]
Figure 1. Topographical map of the study area (the Central Plateau of Iran), showing the locations of synoptic stations (red squares), and the main basins (black borders).
Applsci 10 04536 g001
Figure 2. Two domains defined for the Weather Research and Forecasting model with chemistry WRF-Chem model.
Applsci 10 04536 g002
Figure 3. Horizontal visibility of some synoptic stations in the study area in the 14 February 2018 and 21 February 2015 storms.
Applsci 10 04536 g003
Figure 4. Ackerman Index of Moderate Resolution Imaging Spectroradiometer (MODIS) images of Dust storm on 09:00 UTC, 21 February 2015 (a) and 09:00 UTC, 14 February 2018 (b) by Ackerman Index.
Applsci 10 04536 g004
Figure 5. Backward trajectories of dust from the National Oceanic and Atmospheric Administration Hybrid Single Particle Lagrangian Integrated Trajectory (NOAA HYSPLIT) Model.
Applsci 10 04536 g005
Figure 6. Spatial pattern of dust flux (µg/m2s) with 3 h interval by Air Force Weather Agency (AFWA).
Applsci 10 04536 g006
Figure 7. Average of Storm Dust Flux (µg/m2s) Pattern 14 February 2018 with AFWA scheme.
Applsci 10 04536 g007
Figure 8. Spatial pattern of dust flux (µg/m2s) with 3 h interval by Global Ozone Chemistry Aerosol Radiation and Transport (GOCART) scheme.
Applsci 10 04536 g008
Figure 9. Average Storm Dust flux (µg/m2s) pattern on 14 February 2018 with GOCART Scheme.
Applsci 10 04536 g009
Figure 10. Spatial pattern of dust flux (µg/m2s) with 3 h interval by AFWA scheme.
Applsci 10 04536 g010
Figure 11. Mean Spatial Pattern of Storm Dust Flux (µg/m2s) on 21 February 2015 with AFWA Scheme.
Applsci 10 04536 g011
Figure 12. Spatial pattern of dust flux (µg/m2s) with 3 h interval by GOCART scheme.
Applsci 10 04536 g012
Figure 13. Average Spatial Pattern of Storm Dust Flux (µg/m2s) on 21 February 2015 with GOCART Scheme.
Applsci 10 04536 g013
Figure 14. Correlation of Simulated Surface Dust Concentration Using GOCART Scheme with Horizontal visibility of Synoptic Stations in Storms 14 February 2018 (a) and 21 February 2015 (b).
Applsci 10 04536 g014
Figure 15. Correlation of Simulated Surface Dust Concentration Using AFWA Scheme with Horizontal visibility of Synoptic Stations in Storms 14 February 2018 (a) and 21 February 2015 (b).
Applsci 10 04536 g015
Figure 16. Spatial pattern of dust surface concentration (µg/m3) with the AFWA scheme in 14 February 2018.
Applsci 10 04536 g016aApplsci 10 04536 g016b
Figure 17. Spatial pattern of dust surface concentration (µg/m3) from WRF-Chem with GOCART scheme in 14 February 2018.
Applsci 10 04536 g017aApplsci 10 04536 g017b
Figure 18. Surface dust concentration series (µg/m3) simulated with GOCART scheme for 14 February 2018.
Applsci 10 04536 g018
Figure 19. Surface dust concentration series (µg/m3) simulated with AFWA scheme for storm 14 February 2018.
Applsci 10 04536 g019
Figure 20. Surface concentration of dust (µg/m3) in the Modern-Era Retrospective analysis for Research and Applications, version 2 (MERRA-2) reanalysis for 14 February 2018.
Applsci 10 04536 g020
Table 1. Dust-related weather codes in synoptic station reports.
DescriptionNameWeather Codes
Suspended dust that has traveled long distances.Suspended dust06
Dust or sand rising from the station to the Atmosphere.Dust07
Evolving Whirlwind at or near the station.Whirlwind08
There is dust when observation in around of the station or already existed at the station.Storm09
The intensity of the storm has declined over the past hour.Dust storm with mild sand30
The intensity of the storm has not changed over the past hour.Dust storm with mild sand31
The intensity of the storm has increased over the past hour.Dust storm with mild sand32
The intensity of the storm has declined over the past hour.Dust storm with severe sand33
The intensity of the storm has not changed over the past hour.Dust storm with severe sand34
The intensity of the storm has increased over the past hour.Dust storm with severe sand35
Table 2. Information on synoptic stations in the study area.
Statistical PeriodLongitude (Degree)Latitude (Degree)Station NameStatistical PeriodLongitude (Degree)Latitude (Degree)Station Name
2006–201853.0832.58Naein2006–201860.4729.47Zahdan
2006–201851.9033.53Natanz2006–201854.2831.90Yazd
2006–201851.8331.98Shahr Reza2006–201854.2530.50Marvast
2006–201855.2530.88Anar2006–201853.6232.43Aqda
2006–201858.3529.10Bam2006–201853.4235.59Semnan
2006–201857.6728.73Jiroft2006–201852.2832.89Birjand
2006–201857.7027.97Kahnooj2006–201856.9033.67Tabas
2006–201856.9730.25Kerman2006–201858.1834.03Ferdous
2006–201857.7030.42Shahdad2006–201850.8534.70Qom
2006–201855.1330.10Shahr Babak2006–201851.1834.78Salafchegan
2006–201855.6829.55Sirjan2006–201849.8334.13Arak
2006–201850.9035.92Karaj2006–201850.4833.88Mahalat
2006–201850.7536.00Hashtgerd2006–201850.3335.05Saveh
2006–201850.0036.25Qazvin2006–201857.6536.18Sabzevar
2006–201849.7036.05Takestan2006–201852.3833.38Ardestan
2006–201851.3235.75Abali2006–201851.7132.52Isfahan
2006–201852.8335.92Firozkoh2006–201851.8532.52Kabootar-khan
2006–2018513235.68Mehrabad2006–201855.0833.78Khoor va bibanak
Table 3. Lists the parameterization schemes used to implement the Weather Research and Forecasting model with chemistry (WRF-Chem) model.
WRF Single-Moment 5-classMicro-scale physics
RRTMLong wave radiation
Goddard shortwaveShortwave radiation
Noah Land Surface ModelSurface Physics
YSUBoundary layer
Grell 3DCumulus Convection
Table 4. Dust particle diameter distribution by category in WRF-Chem model.
Particle Density (g/cm3)Particle Diameter Range (μm)Effective Particle Diameter (μm)Type of Dust Particle (p)
25000–1.00.73bin1
26501.0–1.81.4bin2
26501.8–3.02.4bin3
26503.0–6.04.5bin4
26506.0–10.08bin5

