Featured Application
This study describes an open-data platform named Open Data in Agriculture, which is designed to enhance precision agriculture (PA). The platform consists of several components and tools based on semantic web technologies and the hazelnut ontology, a crop-specific trait ontology. The main focus of this study is to propose a data-integration approach at the semantic and syntactic interoperability levels and to develop a web-based open-data platform based on the proposed approach.
Abstract
In recent years, Internet-of-Things (IoT)-based applications have been used in various domains such as health, industry and agriculture. Considerable amounts of data in diverse formats are collected from wireless sensor networks (WSNs) integrated into IoT devices. Semantic interoperability of data gathered from IoT devices is generally being carried out using existing sensor ontologies. However, crop-specific trait ontologies—which include site-specific parameters concerning hazelnut as a particular agricultural product—can be used to make links between domain-specific variables and sensor measurement values as well. This research seeks to address how to use crop-specific trait ontologies for linking site-specific parameters to sensor measurement values. A data-integration approach for semantic and syntactic interoperability is proposed to achieve this objective. An open-data platform is developed and its usability is evaluated to justify the viability of the proposed approach. Furthermore, this research shows how to use web services and APIs to carry out the syntactic interoperability of sensor data in agriculture domain.
1. Introduction
Precision agriculture (PA) is an agriculture management approach used to observe, measure and respond to intra-field variability in agricultural production [1]. Applying the concepts, methods and tools of information and communication technologies (ICTs) enhances the effectiveness of the PA activities. Implementing PA also provides data regarding meteorological factors, such as weather humidity, temperature, rainfall, wind and sunshine [2]. In addition, gathering and analyzing environmental and site-specific parameters such as topography, slope, soil moisture, soil pH, water availability and soil fertility improve PA. Furthermore, PA facilitates boosting effectiveness and productivity of an agricultural production system, which consists of varied ICTs and organizes the whole production cycle of plants and animals using a scientific approach [3]. Internet-of-Things (IoT) technologies, particularly radio-frequency identification (RFID) and wireless sensor network (WSN), which are widely used in the agriculture domain, help improve efficient and safety agricultural production [4]. Advancement in sensor technologies leads to an increase in the usage of WSN in precision agriculture. WSN-based agricultural systems, which are supported with mobile-based or web-based data management tools can improve the productivity of farmers by providing mixed crop farming and ubiquitous computing [5].
Most meteorological factors, environmental and site-specific data can be obtained by utilizing the sensor technologies. Farmers—who play a key role in agricultural production cycle—can benefit by collecting, processing, providing and using data efficiently [6]. In other words, it is necessary to provide farmers with relevant data related to all agricultural production activities to enable effective decision making. Considering the variability of environmental and site-specific data throughout the agricultural production cycle, processing and managing such data obtained from sensors is crucial for PA.
In the agricultural domain, there can be varied data obtained from farmers, sensors, markets and government stats related to agricultural products [7]. Processing, integrating and exporting data collected from such heterogeneous sources can be provided by using open-data platforms. Considering the lack of research endeavors on the application or platform level for ensuring integrated web-accessible data in a unified way, it is clear that more focus is needed on openly distributed platforms, which facilitate integrating sensor data and understanding the exact meaning of integrated data [8]. Ontologies enable us to share a common understanding of the structure of information and to allow communication among people or heterogeneous and widely spread application systems [9,10]. This research is aimed to develop an ontology-based data management (OBDM) system. OBDM which consists of ontology, mapping and data source layers, makes a link between ontologies and data sources using a formal way [11]. These layers have a vital role while performing the data integration processes for agricultural open-data platforms. Therefore, a data-integration approach is proposed in this study. Data integration components and tools of open-data platform are developed based on the proposed data-integration approach. The proposed approach examines data integration processes between IoT devices and open-data platforms at syntactical and semantic interoperability levels. With this approach, it shall be focused on how to use crop-specific trait ontologies for achieving semantic interoperability. The motivation of proposing this approach is two-fold. First, this approach illustrates how agricultural data are gathered from IoT devices using varied sensors in WSNs; how the gathered data are integrated to the open-data platform; and how to publish these data through web services for consumption by domain stakeholders. Second, this approach depicts how to annotate agricultural data using semantic web technologies. In addition, this approach constructs a framework to create data models for object relational mapping for data storage options.
Domain ontologies can be used to annotate data gathered from devices with the contextual information, thus providing well understood data by the users and allowing data interoperability [12]. In this study, hazelnut trait ontology, which plays the domain ontology role of open-data platform and is introduced in the implementation section, is used to make connections between sensor measurement values and site-specific parameters of agricultural products. Furthermore, it facilitates transforming mapped sensor data to linked-open sensor data as well. Mapping procedures are validated by domain experts using the rule engine of open-data platform. Thus, transformed data becomes exportable and downloadable in open such formats as XML, JSON, RDF/XML, RDF/JSON, Turtle, N-triples, Notation 3, HTML, CSV and Excel.
The platform draws on the strength of semantic web technologies while generating operations of mapping sensor devices’ data with a trait ontology, creating datasets stored in open formats, and performing manipulation on stored data. The objectives of the developed open-data platform are as follows: (i) to collect domain-specific data concerning particular agricultural products through ontology-based data acquisition forms generated by domain stakeholders using crop-specific trait ontologies; (ii) to gather and visualize stream data concerning site-specific parameters of particular agricultural products through WSNs; (iii) to produce domain-specific linked open data using mapping rules constructed by any domain stakeholder using crop-specific trait ontologies; (iv) to store semantically annotated agricultural data within the diverse databases and files such as relational databases, graph databases, XML files, RDF files, etc.; (v) to provide syntactical interoperability using web services and APIs, which allow stakeholders to share data for a particular agricultural product between different kinds of software applications; (vi) to publish well-defined, well-structured and semantically annotated data concerning a particular agricultural product using open standard in appropriate formats such as RDF/XML, RDF/JSON, N-triples, Notation 3, Turtle, XML, JSON, HTML, CSV and Excel. Considering that all the objectives of the developed open-data platform are constructed based on crop-specific trait ontologies, it would be appropriate to describe them as the main pillars of the platform. The domain stakeholders who want to use the capabilities of the open-data platform can use an existing crop-specific trait ontology or upload a new one to the platform using the user interface represented on Figure A1 in order to achieve their goals.
This paper is organized as follows: Section 2 describes the general terms that are focused on within the scope of this paper and addresses some challenges regarding semantic interoperability. The architecture of the proposed approach is detailed in Section 3. Section 4 introduces the implementation of open-data platform which integrates IoT data based on the proposed approach. Section 5 includes the conclusion of the paper and discussion of the future work.
2. Related Works
The term IoT, which is first used in 1999, is characterized in three visions such as Internet-oriented, things-oriented and semantic-oriented [13,14]. It also consists of three components which enable ubiquitous computing such as hardware, middleware and presentation [15]. Due to having such features, IoT-based applications are used in a wide range of sectors such as discrete manufacturing, transportation, logistics, utilities, healthcare, energy and natural resources, retail, insurance and agriculture. This leads to a dramatic rise in the number of connected IoT devices and the amount of data generated [16]. However, there still exist varied issues to handle with respect to IoT, such as standards, scalability, device diversity, constructing generally accepted service language, finding service for a particular domain and providing interoperability [17]. This study mainly focuses on semantic and syntactic interoperability in the context of IoT.
Understanding the true meaning of data by utilizing the semantic web technologies is a key factor, which simplifies providing interoperability among IoT components. Semantic web technologies are also used for creating data models and integrating data gathered from heterogeneous IoT devices. This approach constitutes an enabling-technology in different IoT-related fields, like Industry 4.0 and smart manufacturing [18], smart and IoT-enhanced environments [19] and healthcare [20]. Annotating IoT data using the strength of semantic web technologies ensures the interoperability between IoT applications [21]. Utilizing IoT data, which are obtained from heterogeneous data sources, requires more complex operations and technical skills due to interoperability issues. Considering the heterogeneity of IoT data, semantic web technologies can be used for sharing data gathered from heterogeneous IoT devices by generating “common models” [22] of domains of knowledge—i.e., an ontology, shared and explicit conceptualization of the knowledge and of the relationships of the concepts composing a domain [23,24]. The diversity of IoT devices from several vendors can uncover semantic and syntactic errors [20]. However, IoT data are generally bound up with heterogeneous data models; and to overcome this heterogeneity, it is necessary to make data available homogeneously to allow integration from a wide variety of sources [8]. Due to the aforementioned reasons, one needs to take a closer look at interoperability in IoT.
One can examine various interoperability levels [25,26,27,28,29], but since syntactic and semantic levels are particularly essential for data integration, we focus on these two levels. Syntactic interoperability is concerned with software infrastructure needed, whereas semantic level addresses the meaning of data while sharing or exchanging data between systems [30].
It is worth bearing in mind that implementing semantic interoperability requires more effort such as developing an ontology and utilizing it to meet the interoperability requirements [31]. Table 1 summarizes representative studies on ontologies in the context of IoT and sensors. These ontologies generally aim to model resources, services and location information; however, new ontologies are developed to meet interoperability requirements as well [32]. The overall purpose of these ontologies is to provide robust solutions to heterogeneity issues regarding hardware, software and the data management for IoT devices [33].

Table 1.
Existing Ontologies in the context of IoT and Sensors.
Each one of the ontologies represented in Table 1 provides significant and valuable contribution to solve the interoperability issues in IoT applications. However, they are not aimed to links between the mapping domain-specific variables that needed crop-specific trait ontologies and sensor measurements. Furthermore, crop-specific trait ontologies can be used to create, publish and share linked open data concerning a particular agricultural product on the web-based platforms as well.
The next part of this study introduces the proposed data-integration approach for agricultural data platforms.
3. The Proposed Data Integration Approach for Agricultural Open Data Platforms
The proposed approach representing on Figure 1 consists of four layers, which provide acceptable solutions to deal with data integration issues in terms of publishing data in appropriate formats from agricultural open-data platforms to domain stakeholders. These interconnected layers are (1) physical layer, (2) processing and storage layer, (3) semantic interoperability layer and (4) web services and exportation layer, respectively.
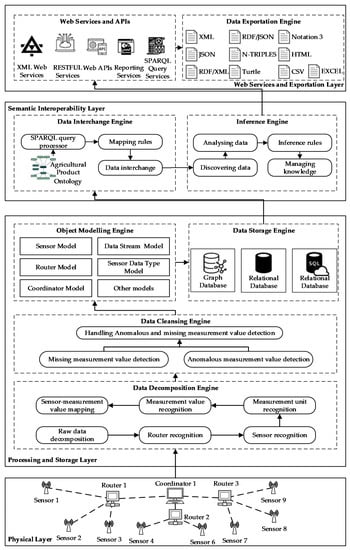
Figure 1.
Proposed data integration approach.
3.1. Physical Layer (PL)
In the agriculture domain, IoT devices have been frequently used for gathering environmental and site-specific data such as soil moisture, soil salinity, soil pH and climate of the site (temperature, rainfall, wind, light, relative humidity). PL, which is the primary level of the proposed approach, comprises IoT devices formed as wireless sensor networks (WSN), which are structured as several routers controlled by one coordinator. Two variants of WSNs are generally used in agricultural applications: terrestrial WSNs and underground WSNs [45]. These agricultural WSNs applications can use different WSN standardizations such as ZigBee, WirelessHART and 6LoWPAN. There is no restriction in terms of choosing WSN types and standards according to the proposed approach. Thus, any options can be used while establishing IoT devices on any agriculture field.
3.2. Processing and Storage Layer (PSL)
This layer corresponds to decomposing raw sensor data streams, cleaning raw sensor data, modeling objects and storing data. PSL enables transforming raw sensor data into an appropriate format mapped to object models and storing these data in varied database options. PSL is composed of four sublayers: data decomposition engine (DDE), data cleansing engine (DCE), Object Modeling Engine (OME) and data storage engine (DSE). Next, these four sublayers are described in detail.
3.3. Data Decomposition Engine (DDE)
DDE handles decomposing the raw sensor data that are generally in varied forms. Sensors are low-cost sensing solutions for measuring environmental and site-specific data in agricultural applications. As sensors measure at least one value, they can measure more as well. Considering there are varied sensors plugged on router devices, the proposed approach recommends using key value pairs to define sensors on WSNs. Suppose that one router (id = 1) has a sensor (id = 1) that measures weather humidity (key = WH), weather temperature (key = WT) and barometric pressure (key = PR) at the same time. There can be different ways for composing such a data stream. However, the proposed approach solves this issue using the following pattern.
[Router Identifier]:[Value];[Sensor Identifier]:[Value];[Sensor Measurement Identifier]:[Measurement Value];
According to this pattern, sensor measurement value can be formulated as RID:1; SID:1; WH:45. This means that the value 45% of weather humidity is measured by the sensor numbered 1, which is plugged to router 1. Figure 2 illustrates how to decompose sensor raw data stream. DDE decomposes the raw sensor data and extracts router definitions, sensor definitions and sensors’ measurement values from this data.
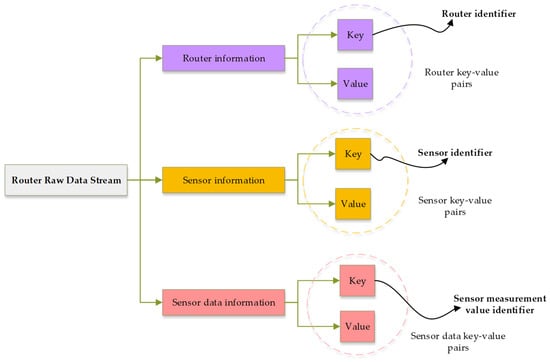
Figure 2.
Decomposition raw sensor data stream.
DDE is also responsible for matching the sensor measurement value to its unit using sensor information stored in the databases or any files and mapping sensors to their measurement value for creating appropriate object models of routers and sensors to utilize by visualization application tools. To meet mapping requirements, key value pairs of routers and their sensors can be passed as parameters through the queries. When sensor raw data stream is received by WSN coordinators, recognized router and sensor id are retrieved from databases or files. Then, mapping procedures are accomplished by data decomposition engine.
3.4. Data Cleansing Engine (DCE)
Missing value problems frequently occur within the sensors and it is accepted quite widely in WSNs. There exist several problems which cause missing value in WSNs, such as synchronization issues, sensor errors or transmission issues [46]. DCE is in charge of handling missing sensor measurements and anomalous values. It can be very crucial to estimate missing sensor measurement values and detect anomalies in terms of critical systems. In case of anomaly detection in WSNs, statistical, support vector machine (SVM) and cluster analysis techniques play a significant role [47]. These techniques can be applied to the sensor data stream to provide solutions for estimating missing values and detecting anomaly.
3.5. Object Modeling Engine (OME)
OME, which is a sublayer of PSL, enables creating coordinator object model, router object model, sensor object model, data stream object model and sensor data type object model. In other words, it provides mapping database objects to high-level abstract models created within any programming language using object-oriented programming techniques.
3.6. Data Storage Engine (DSE)
DSE is responsible for storing data obtained from sensors in three different storage options such as graph database, relational database and cloud database.
3.7. Semantic Interoperability Layer (SIL)
SIL plays an important role in the data integration process of the proposed approach. All considerable procedures for data integration such as executing SPARQL queries, applying mapping rules, making data interchange and storing mapped data within varied file formats are carried out within this layer. Crop-specific trait ontologies have also a very critical role in the subcomponent named data interchange engine of SIL. It uses crop-specific trait ontologies to map sensor measurement values to relevant traits of agricultural products for publishing more annotated data through open-data platforms for usage of any domain stakeholders. Domain experts may create these mapping rules by selecting relevant ontology classes and mapping them to corresponding sensor measurement values. Mapping rules are also used to link data obtained from IoT devices with agricultural ontology classes. They can be stored in RDF format and implemented by retrieving and manipulating with SPARQL to perform interchange operations when needed. Semantic web technologies are an important way of revealing the common knowledge of a particular domain by performing reasoning procedures [48]. Discovering information in RDF datasets is performed using simple protocol and RDF query language (SPARQL); and the result of the relevant SPARQL query is formed as RDF triples [49]. The inference rules can be defined by domain stakeholders via the relevant module of the platform, which is represented on Figure A3 to help managing knowledge in the context of agriculture. These rules assist with domain stakeholders’ understanding of the true meaning of sensor measurement values to perform more precise agricultural activities.
3.8. Web Services and Exportation (WSE)
The open-data platforms can publish data in different formats. The proposed approach allows users to choose directly downloadable and web service options considering the heterogeneity of applications, which use the published data. The platform users can export linked open data, which are created by mapping agricultural ontology classes with data gathered from IoT devices in varied file formats such as XML, JSON, HTML, CSV, Excel spreadsheets, RDF/XML, RDF/JSON, N-triples, Turtle and Notation 3. Table 2 gives a brief overview with respect to these data formats.
Table 2.
Data formats used for the proposed approach.
On the other hand, data can also be published through web services in XML and JSON formats. Consuming web services to process data requires relatively less effort than semantic web technologies. However, in the open-data world, it is indispensable to publish data in open-data formats. Software applications, which are designed and developed for stakeholders in agriculture domain, can use published data through open-data platforms. Software applications handling published data may be a desktop application, web application or mobile application. A major problem with this software applications’ heterogeneity in terms of utilizing published data are that there needs to be a mechanism which provides suitable data formats for each type of software applications.
The proposed approach seeks to come up with developing XML web services, REST web services and Web APIs which help to address and provide robust and effective solutions for data type compatibility issues among software applications. In addition, web services, particularly RESTful web services, can help solve interoperability problems by allowing software applications running on different platforms to request, access and manipulate data, which can be easily processed. Interoperability between software applications is not only a problem for applications that run on different platforms, but also on the same platform as well. Therefore, the proposed approach strongly recommends developing REST web services, Web APIs or both. Another service of the proposed approach is Reporting Service, which enables us to create and manage well-designed data reports. The last service is SPARQL Query Service, which is developed for executing the SPARQL query statements to retrieve data from RDF datasets.
4. Implementation of an Open Data Platform in Accordance with the Proposed Approach
Below we describe our open-data platform (see in Supplementary Materials) developed by following the layers of the proposed approach. The platform has several modules, such as an ontology visualization tool and data acquisition form generation tool; however, the main focuses of this section are how to integrate sensor data using crop-specific trait ontologies with the open-data platform and how to make use of integrated data for domain stakeholders in open-data file formats.
4.1. Introducing Hazelnut Trait Ontology
The main purpose of developing hazelnut trait ontology is to develop a shared a common vocabulary and to provide an international format to standardize a general understanding with respect to hazelnuts. hazelnut trait ontology was developed using Web Ontology Language (OWL) considering the top–down approach in consultation with the hazelnut specialists. According to the top–down approach, the initial work for building an ontology is to begin the process by modeling top-level concepts [58]. hazelnut trait ontology consists of five top-level concepts named descriptors such as passport, management, environment and site, characterization and evaluation descriptors [59]. These descriptors are the top-level classes of the ontology and also, they designate the class hierarchy with the sub descriptors. The definitions and number of sub descriptors of each main descriptor are demonstrated on Table 3.
Table 3.
Definitions, Number of Sub Descriptors and Use of the Descriptors.
The descriptors demonstrated on Table 3 are in a hierarchical structure that means subclass-superclass relationships within the ontology, so while creating hazelnut trait ontology, this hierarchy should be considered. Table 3 presents an overview of the major descriptors of hazelnut. The hazelnut trait ontology is a hierarchical classification based on a “is_a” hierarchy. The detailed information concerning hazelnut trait ontology was provided at the link below: https://github.com/hazelnut-trait-ontology/hto.
4.2. Materials and Tools Used for the Development and Implementation of WSN and Open Data Platform Based on Proposed Approach
The initial component of the open-data platform is the establishment of a typical wireless sensor network to meet the requirements of gathering environmental data using sensors. Hence, a WSN, which consists of one coordinator and seven sensors plugged on three routers was built. The first sensor plugged on router 1 is BME280. It can measure relative humidity from 0 to 100% with ±3% accuracy, barometric pressure from 300 Pa to 1100 hPa with ± 1 hPa absolute accuracy and temperature from −40 °C to 85 °C with ±1.0 °C accuracy. The second sensor plugged on router 1 is GUVA-S12SD UV. It detects the UV wavelength from 240 nm to 370 nm in sunlight. The third and the last one plugged on router 1 is MICS-4514. It can detect the following gases: carbon monoxide from 1 ppm to 1000 ppm, nitrogen dioxide from 0.05 ppm to 10 ppm, ethanol from 10 ppm to 500 ppm, hydrogen from 1 ppm to 1000 ppm, ammonia from 1 ppm to 500 ppm and methane greater than 1000 ppm. Router 2 has three sensors such as soil moisture, rain and BH-1750 light level. The soil moisture sensor categorizes its measurements as dry soil, humid soil and in water. The rain sensor, actually a raindrop sensor, does not measure rainfall. It categorizes its measurements as raining, rain warning and not raining. BH-1750 sensor can measure light intensity from 1lx to 65535lx. Router 3 has only one sensor named MPU6050, which is 6 axis acceleration and gyro sensor. These sensors were defined for representation using abbreviations by a set of named constants which are illustrated on Table 4.
Table 4.
Enumerating measurements types of sensors.
Coordinators and their routers are illustrated on maps on open-data platforms according to their latitude and longitude information. Platform users can access the detailed information of WSNs by following the link on coordinator tooltips. Each one of the sensors, routers and coordinators can be visualized as hierarchical nodes on the platform; and platform users can access sensors’ data, which are measured in the last five minutes and visualized in appropriate graphs by using clickable features of the routers’ icons. Figure 3 shows how each component of WSN is viewed on the open-data platform.
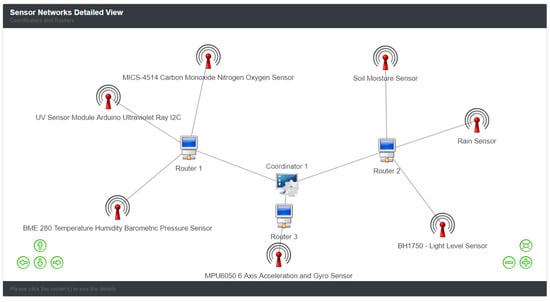
Figure 3.
Detailed view of wireless sensor networks.
It is a well-known fact that reading sensor inputs and transforming them into a meaningful format requires using microcontrollers. Therefore, Arduino, which is an open-source member of family of electronic microprocessor boards, based on easy-to-use hardware and software, was used as router and coordinator devices within the WSN. Other reasons to use Arduino as router and coordinator devices are as follows: it is inexpensive; its IDE runs on cross-platforms and easy-to-use; and its hardware and software are open source [60]. Furthermore, it ensures key features to collect both economic and practical benefits for researchers [61].
Raspberry PI, which is a low-cost and single-board computer, is used for interfacing the coordinator device through serial ports to receive data assembled from routers. Raspbian which is a kind of operating system based on Debian developed for Raspberry Pi can be freely accessed and is downloadable by any users. In addition, Raspbian is a commonly preferred operating system option for Raspberry Pi computers and freely available community project under active development. Therefore, it was considered the suitable operating system option that will run on the Raspberry Pi computer, which plays the manager role of established WSN. Furthermore, a Python program was developed to read raw sensor data gathered from a coordinator device through a serial port. This program is also responsible to store raw data in a relational database using RESTful web service operations.
XBee module, which supports multiple protocols, is highly configurable and consists of small radio frequency (RF) devices that transmit and receive data over air using radio signals [62]. It was used to transmit data wirelessly between routers and the coordinator. Each XBee device is configured as Application Programming Interface (API) mode within the built WSN. There exist several reasons behind preferring API mode. API operating mode eases managing transmission of data towards multiple destinations. Each received data contains the address of the sender device. This mode provides advanced Zigbee addressing, advanced networking diagnostics and remote configuration [63]. XBee devices, which are configured as API operating mode, uses API frame illustrated in Figure 4 to transmit data from routers towards the coordinator. After router devices measured environmental data through their sensors, they transform the sensor measurement values to API data frame using relevant Arduino libraries.
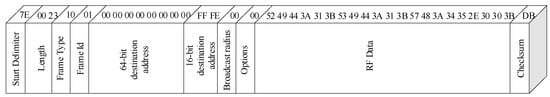
Figure 4.
API data frame.
The received data through the coordinator are decomposed into several pieces to distinguish the router, sensor and sensor measurement value. In other words, the purpose of this operation is to access RF data, which are part of API frame to extract key value pairs. After key value pairs are extracted from RF data, it is necessary to match the sensor to its measurement unit using sensor information stored in the database. This matching process is performed by retrieving relevant data from database using REST web services. The reason for applying this method is to keep the total number of bytes included in the API frame’s data file small. Considering the sensors of WSN, the following measurement units are matched to relevant sensor measurement data types: lux for light intensity, °C for temperature, % for humidity, Pa for pressure, m for altitude, °/s for slope, nm for ultraviolet, ppm for carbon monoxide concentration and ppb for nitrogen dioxide concentration.
The model creation needs to be undertaken for decomposed and cleaned data using a programming language according to the proposed approach. C# programming language is used to create objects, which are represented in Figure 5. It is also a major programming language which is used to develop web services and open-data platform.
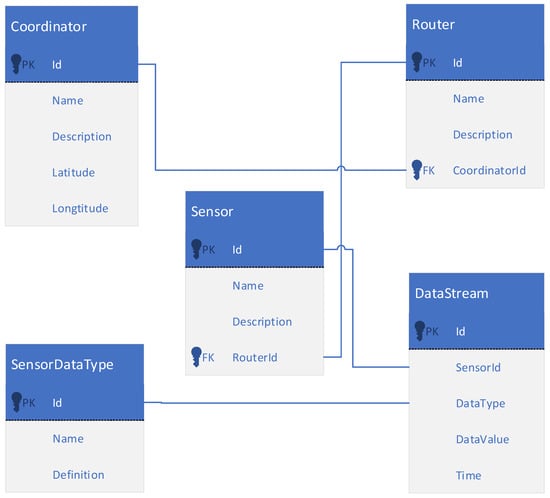
Figure 5.
Data models created by object modeling engine (OME).
There exist three different storage options recommended by DSE. MS SQL Server 2016, which was a relational database management system, is used to store data.
The Windows communication foundation (WCF), which is a framework for building service-oriented applications, was used to develop XML and RESTful web services. dotNetRDF, which is a common. NET API for working with RDF triple stores, was used to parse, manage, query and write RDF datasets [64]. ASP.NET Web API framework, which provides an easy and secure way for building HTTP based services, consumed by a wide range of software applications, was used to develop the Web APIs.
4.3. Providing Semantic Interoperability between IoT Devices and Open Data Platforms Using Agricultural Trait Ontologies
This section of the study examines how to integrate sensor data using a crop-specific trait ontology. This section also shows how to create mapping rules for linking sensor data types with relevant ontology classes by storing in RDF file.
The classes which can be mapped into the relevant sensor measurement data types are sub-classes of: EnvironmentAndSite class. This describes the environmental and site-specific parameters with respect to hazelnut within the hazelnut trait ontology. After sensor data streams are decomposed as key value pairs and stored in the database in compliance with the object models created by OME, there is a need to create mapping rules using the relevant UI through open-data platform. The open-data platform uses these rules to map the sensor measurement data types with the relevant ontology classes to integrate and annotate data semantically. Varied data files mentioned in the previous section of the study are generated by linking the stored datasets to relevant classes of agricultural ontology. Through using these mapping rules, domain-specific datasets are built. Considering the presence of irrelevant sensor measurement data types within any WSN, it is reasonable to use these mapping rules for combining data from different sources in a single and unified view. The established WSN, which was introduced within the previous section of this study, uses seven sensor measurement data types corresponding to the relevant hazelnut trait ontology classes. Table 5 presents sensor measurement data types, abbreviations, data units and class axioms, which are used while creating mapping rules.
Table 5.
Mapping ontology classes to relevant sensors’ measurement types.
Measurement values of mapped data types can be viewed using open-data platform and they will be integrated with hazelnut datasets. As shown in Figure 6, decomposed sensor data streams are mapped with the relevant hazelnut trait ontology classes by rule engine using mapping rules. One of the rule examples, which represents mapping the temperature measurement data type with: Temperature class of hazelnut trait ontology, is illustrated in Table 6.
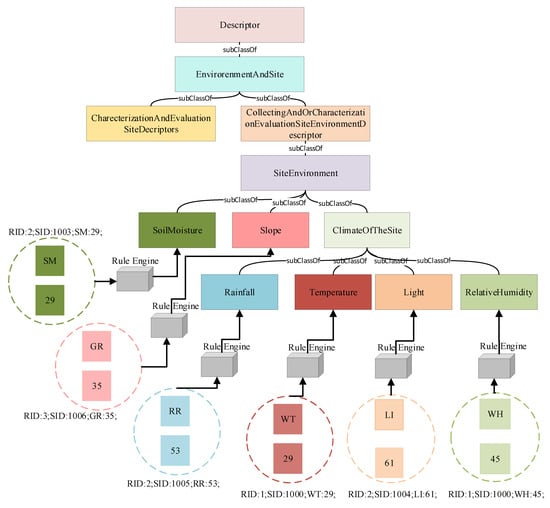
Figure 6.
Mapping sensor measurement data type to ontology classes.
Table 6.
Mapping rule example.
It is apparent from this example that rules use URI reference to identify resources in datasets stored in RDF files. The base URI of hazelnut trait ontology is http://www.opendatainagriculture.com/ontologies/hazelnutontology. The URI reference should be the same with the URI reference of the relevant ontology classes to make a link between the sensor information and class definition within the mapping rule file. While linking sensor measurement data types with hazelnut trait ontology classes, SPARQL query statements are used to retrieve each attribute of sensor data from mapping rule file. The SPARQL query statement represented in Table 7 retrieves base ontology URI with: Temperature class, sensor data type URI and the value of Id attribute of the sensor data type from mapping rule RDF file. This query statement is executed by rule engine of open-data platform and viewed as RDF triple, which contains three components named subject, predicate and object, respectively. In the example, subject, predicate and object are: Temperature class, sensor data type and the value of Id attribute of the sensor data type, respectively.
Table 7.
SPARQL statement to retrieve sensor measurement data type from mapping rule file according to its “TypeId” attribute.
When the mapping procedure is completed using the data interchange engine of proposed approach, any stakeholder could create, export and publish datasets with respect to agricultural product, which is hazelnut in this case, in varied formats such as XML, JSON, RDF/XML, RDF/JSON, N-triples, Turtle, Notation 3, HTML, Excel spreadsheet and CSV. Figure A7 illustrates how to export these datasets from the platform. They can fulfil the procedures for discovering and analyzing using datasets stored in these files.
The open-data platform improves the quality of data integration by applying inference rules on the traits which are mapped with the relevant sensor measurements. Furthermore, the inferred knowledge of a trait helps make better decisions concerning agricultural production for stakeholders who lack much information concerning how to perform PA activities. For instance, the “topography” class of hazelnut trait ontology can have the rules which are generated by a domain expert, using semantic web rule language (SWRL), represented in Table 8. According to the inferences provided by these rules, any stakeholder can easily identify whether the topography of an agricultural land surface is flat, hilly or mountainous.
Table 8.
Rules for topography Trait.
5. Evaluation of the Tools of Open Data Platform Used for Implementing the Proposed Approach
The quality of the tools of open-data platform used for implementing the proposed data-integration approach were evaluated in terms of efficiency, affect, helpfulness, control, learnability and usability by twenty-seven respondents—15 males and 12 females—with different levels of software skills and technical knowledge. The respondents are representative of the software developers who are experienced with developing web-based software platform and non-technical users who can use any web-based software platforms easily. They are also representative of the IT specialists and researchers from agricultural domain, with a high-level education. Respondents average age is 29.44. Table 9 provides an overview of the respondents’ profile.
Table 9.
Respondent profiles.
In this evaluation process, the following modules were evaluated: (i) “Ontology viewing and loading” represented on Figure A1; (ii) “Selecting individuals of traits for inference rules creation” represented on Figure A2; (iii) “Creating rules definitions for individuals” represented on Figure A3; (iv) “Creating mapping rules” represented on Figure A4; (v) “Wireless sensor networks management” represented on Figure A5; (vi) “Charting and managing mapped sensor measurements” represented on Figure A6. The following tasks were assigned to each respondent to complete: register to the platform; login to the platform; access the UI of ontology viewing; access the UI of creation of mapping rules; select the individuals of traits for creating inference rules; access the UI of creating rules definitions for selected individuals; save defined rules for each selected individual; access the UI of WSN lists, select the relevant WSN and access the list of its routers and coordinators; select any sensor of router and access the UI of visualizing collected data on the charts; access the UI of listing mapped sensor data. Each respondent completed all assigned tasks to him/her successfully. While each respondent was performing the tasks, he/she recorded the elapsed time. Figure 7 shows the time spent by each respondent in completing her/his tasks. From Figure 7 one concludes that the average elapsed time is about 10.44 min. Considering the results, the most spent time for completing entire tasks is 21.05 min and the least spent time is 5.19 min.
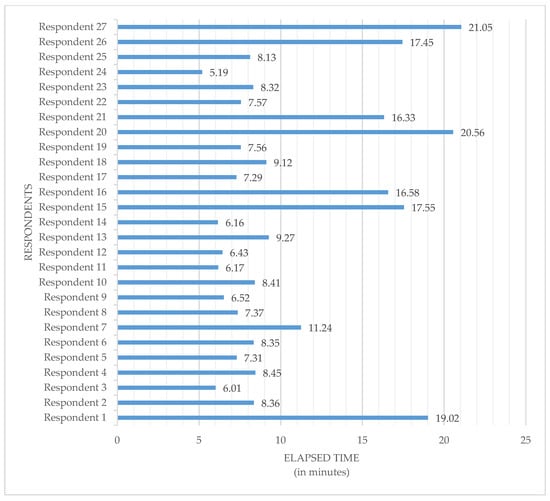
Figure 7.
Elapsed time of each respondent for completing the tasks.
The software usability measurement inventory (SUMI), which is a rigorously tested and proven method of measuring software quality from the end user’s point of view [65], was used to measure the usability of the open-data platform. Figure 8 reveals that there were satisfactory results of the entire scales. It also shows the range of the 95% confidence interval of the means of the scales.
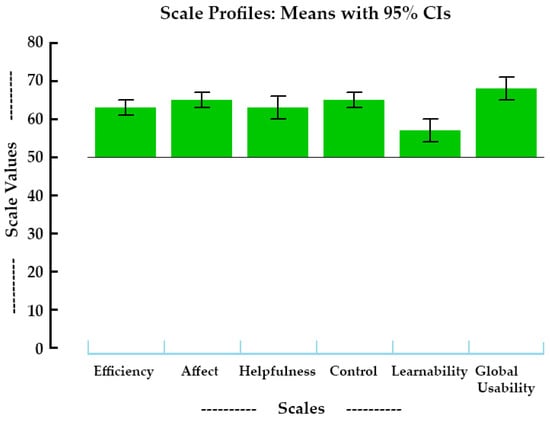
Figure 8.
Graphical summary of software usability measurement inventory (SUMI) scales.
The SUMI scales are statistically adjusted so that the population mean in its database is 50 and the standard deviation is 10, what is known as a 50/10 distribution. The range of SUMI scores goes from 73 to 10. SUMI scores exhibit a slight positive skew. Each scale is computed by a process of weighting and averaging of SUMI items. The mean, standard deviation, median, interquartile range (IQR), minimum and maximum calculations results of each SUMI scale are presented in Table 10. As can be very clearly illustrated in Table 10, the developed open-data platform has satisfactory result for each SUMI scale.
Table 10.
Technical information about SUMI scales.
Figure 9 shows the means and standard deviations for each of the SUMI scales and for the global usability scale of the sample being analyzed. The cross in the center of the ring shows the location of the mean, the bars are extended by one standard deviation on each side of the mean.
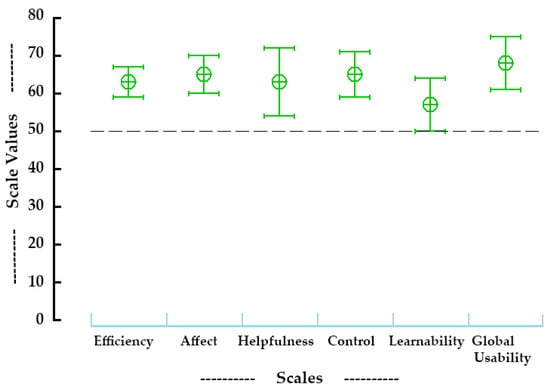
Figure 9.
SUMI scales profiles: means with standard deviations.
Global usability of the open-data platform, which means a general feeling of satisfaction concerning the experiences of the users with the software platform, was calculated as 67.67. This result is quite reasonable in terms of usability score. The calculation results of efficiency, affect, helpfulness, controllability and learnability are 63.33, 64.52, 63.07, 64.81, 56.78, respectively. Considering the scores of the SUMI scales are calculated in the range between 10 and 73; the calculated scores for open-data platform are seen as acceptable.
There are four different respondent profiles recommended by SUMI in terms of software skills and technical knowledge. Table 11 shows the profiles of respondents who were asked to evaluate the open-data platform. Furthermore, it presents evaluation results of each scale obtained from respondents with different profiles.
Table 11.
Respondents’ profiles in terms of software skills and technical knowledge.
The respondents were asked to determine the importance of the evaluated open-data platform with the following question: “How important for you is the kind of software you have just been rating?” Six respondents have noted that the open-data platform is “important”. On the other hand, the open-data platform was perceived as extremely important by twenty-one respondents. Table 12 represents the calculated scores for each scale that belonged to the two groups of respondents who described the open-data platform as important and extremely important.
Table 12.
Importance of the platform for respondents.
As mentioned above, the results of entire scales, which were used to measure the quality of the open-data platform, are quite reasonable. On the other hand, some enhancements should be carried out to increase the capabilities of the open-data platform. For instance, some respondents have noted that the class selection screen should be more flexible. Furthermore, the design of some user interfaces should be edited with the aim of enabling non-technical users to do their tasks in a quick and effective manner.
6. Conclusions
This study sets out to propose an approach to integrating data collected from IoT devices to agricultural open-data platforms from the perspective of semantic and syntactic interoperability. The proposed data-integration approach has enhanced an understanding of data integration lifecycle for agricultural IoT applications in the context of open-data platforms. The general tendency to provide data integration for data gathered from IoT devices is to use existing geospatial ontologies. However, this study has demonstrated, for the first time that a crop-specific trait ontology by constructing mapping rules was used to annotate the environmental data for a particular agricultural product with the aim of achieving semantic interoperability. The most obvious finding to emerge from this study is that semantic interoperability for data collected from IoT devices can be carried out using a crop-specific trait ontology by constructing mapping rules. Another important finding is to demonstrate how to use web services and APIs to provide syntactical interoperability for data gathered from IoT devices using crop-specific trait ontologies.
This research demonstrates the value of the proposed approach along with its implementation of software applications. First, the open-data platform which is developed based on the proposed approach enables agricultural domain stakeholders export linked open data in varied open formats or standards. It provides a visualization infrastructure for IoT devices and their data. Thus, stakeholders could access and export data gathered from IoT devices belonging to a particular wireless sensor network established for the relevant agricultural product. Second, web services and APIs allow stakeholders to share data about a particular agricultural product between different kinds of software applications. By this means, syntactical interoperability was carried out through these services and APIs.
The open-data platform was evaluated in terms of usability considering five different scales such as efficiency, affect, helpfulness, control and learnability by using SUMI questionnaire [65]. According to the usability results, the developed platform has satisfactory scores for each one of them. Furthermore, the score of global usability scale is quite reasonable for the open-data platform.
The implementation part of this study focused on hazelnut agricultural product. However, the proposed approach is appropriate for different types of crop-specific trait ontologies, which are created using OWL and includes site-specific variables. The present study has only examined semantic and syntactic interoperability. However, further research may investigate other interoperability layers for open-data platforms. One may be interested in making use of web services and APIs from mobile-based software applications to provide meaningful information for the relevant agricultural product and its production lifecycle.
Supplementary Materials
The “Open Data in Agriculture Platform” is available online at www.opendatainagriculture.com.
Author Contributions
Conceptualization, S.A.; investigation, S.A.; methodology, S.A.; project administration, S.A. and M.N.A.; Software, S.A.; supervision, M.N.A.; validation, S.A.; visualization, S.A.; writing—Original draft, S.A.; writing—Review & editing, M.N.A. All authors have read and agreed to the published version of the manuscript.
Funding
This research was funded by Kadir Has University, Grant Number 2018-BAP-14.
Acknowledgments
We thank Jurek Kirakowski for allowing us to use SUMI Questionnaire for academic purposes.
Conflicts of Interest
The authors declare no conflicts of interest. The funders had no role in the design of the study; in the collection, analyses or interpretation of data; in the writing of the manuscript or in the decision to publish the results.
Appendix A. Screenshots of the Open Data Platform for Semantic and Syntactic Interoperability

Figure A1.
Screenshot of ontology viewing and loading.

Figure A2.
Screenshot of selecting individuals of traits for inference rules creation.

Figure A3.
Screenshot of creating rules definitions for individuals.

Figure A4.
Screenshot of creating mapping rules.

Figure A5.
Screenshot of wireless sensor networks management.

Figure A6.
Screenshot of charting and managing mapped sensor measurements.

Figure A7.
Screenshot of exporting linked sensor measurement value.
References
- Lindblom, J.; Lundström, C.; Ljung, M.; Jonsson, A. Promoting sustainable intensification in precision agriculture: Review of decision support systems development and strategies. Precision Agric. 2017, 18, 309–331. [Google Scholar] [CrossRef]
- Karim, F.; Karim, F. Monitoring system using web of things in precision agriculture. Procedia Comput. Sci. 2017, 110, 402–409. [Google Scholar] [CrossRef]
- Mazon-Olivo, B.; Hernández-Rojas, D.; Maza-Salinas, J.; Pan, A. Rules engine and complex event processor in the context of internet of things for precision agriculture. Comput. Electron. Agric. 2018, 154, 347–360. [Google Scholar] [CrossRef]
- Minbo, L.; Zhu, Z.; Guangyu, C. Information Service System of Agriculture IoT. Automatika 2013, 54, 415–426. [Google Scholar] [CrossRef]
- Muangprathub, J.; Boonnam, N.; Kajornkasirat, S.; Lekbangpong, N.; Wanichsombat, A.; Nillaor, P. IoT and agriculture data analysis for smart farm. Comput. Electron. Agric. 2019, 156, 467–474. [Google Scholar] [CrossRef]
- Paraforos, D.S.; Vassiliadis, V.; Kortenbruck, D.; Stamkopoulos, K.; Ziogas, V.; Sapounas, A.A.; Griepentrog, H.W. Multi-level automation of farm management information systems. Comput. Electron. Agric. 2017, 142 Pt B, 504–514. [Google Scholar] [CrossRef]
- Aydin, Ş.; Aydin, M.N. A Sustainable Multi-layered Open Data Processing Model for Agriculture: IoT Based Case Study Using Semantic Web for Hazelnut Fields. Adv. Sci. Technol. Eng. Syst. J. 2020, 5, 309–319. [Google Scholar] [CrossRef]
- Nagib, A.M.; Hamza, H.S. SIGHTED: A Framework for Semantic Integration of Heterogeneous Sensor Data on the Internet of Things. Procedia Comput. Sci. 2016, 83, 529–536. [Google Scholar] [CrossRef]
- Noy, N.F.; McGuinness, D. Ontology Development 101: A Guide to creating your first Ontology, Stanford Knowledge Systems Laboratory Technical Report KSL-01-05 and Stanford Medical Informatics Technical Report SMI-2001-0880, March 2001. Available online: http://www.ksl.stanford.edu/people/dlm/papers/ontology-tutorial-noy-mcguinness-abstract.html (accessed on 20 March 2020).
- Cristani, M.; Cuel, R. A Survey on Ontology Creation Methodologies. J. Semant. Web Inform. Syst. 2005, 1, 48–68. [Google Scholar] [CrossRef]
- Daraio, C.; Lenzerini, M.; Leporelli, C.; Naggar, P.; Bonaccorsi, A.; Bartolucci, A. The advantages of an Ontology-Based Data Management approach: Openness, interoperability and data quality. Scientometrics 2016, 108, 441–455. [Google Scholar] [CrossRef]
- El Kaed, C.; Khan, I.; Van Den Berg, A.; Hossayni, H.; Saint-Marcel, C. SRE: Semantic Rules Engine for the Industrial Internet-Of-Things Gateways. IEEE Trans. Ind. Inform. 2018, 14, 715–724. [Google Scholar] [CrossRef]
- Atziori, L.; Iera, A.; Morabito, G. The Internet of Things: A survey. Comput. Netw. 2010, 54, 2787–2805. [Google Scholar] [CrossRef]
- RFID Journal Webpage. Available online: https://www.rfidjournal.com/articles/view?4986 (accessed on 18 March 2020).
- Gubbi, J.; Buyya, R.; Marusic, S.; Palaniswami, M. Internet of Things (IoT): A vision, architectural elements, and future directions. Fut. Gener. Comput. Syst. 2013, 29, 1645–1660. [Google Scholar] [CrossRef]
- Michael Shirer and Carrie MacGillivray. The Growth in Connected IoT Devices is Expected to Generate 79.4ZB of Data in 2025, According to a New IDC Forecast. Available online: https://www.idc.com/getdoc.jsp?containerId=prUS45213219 (accessed on 18 March 2020).
- Jabbar, S.; Ullah, F.; Khalid, S.; Khan, M.; Han, K. Semantic Interoperability in Heterogeneous IoT Infrastructure for Healthcare. Wirel. Commun. Mob. Comput. 2017, 2017, 9731806. [Google Scholar] [CrossRef]
- Shariat Zadeh, N.; Lundholm, T.; Lindberg, L.; Franzén Sivard, G. Integration of Digital Factory with Smart Factory Based on Internet of Things. Procedia CIRP 2016, 50, 512–517. [Google Scholar] [CrossRef]
- Spoladore, D.; Mahroo, A.; Trombetta, A.; Sacco, M. ComfOnt: A Semantic Framework for Indoor Comfort and Energy Saving in Smart Homes. Electronics 2019, 8, 1449. [Google Scholar] [CrossRef]
- Ullah, F.; Habib, M.A.; Farhan, M.; Khalid, S.; Durrani, M.Y.; Jabbar, S. Semantic interoperability for big-data in heterogeneous IoT infrastructure for healthcare. Sustain. Cities Soc. 2017, 34, 90–96. [Google Scholar] [CrossRef]
- Al-Osta, M.; Ahmed, B.; Abdelouahed, G. A Lightweight Semantic Web-based Approach for Data Annotation on IoT Gateways. Procedia Comput. Sci. 2017, 113, 186–193. [Google Scholar] [CrossRef]
- Elsaleh, T.; Bermudez-Edo, M.; Enshaeifar, S.; Acton, S.T.; Rezvani, R.; Barnaghi, P. IoT-Stream: A Lightweight Ontology for Internet of Things Data Streams. In Proceedings of the 2019 Global IoT Summit (GIoTS), Aarhus, Denmark, 17–21 June 2019; pp. 1–6. [Google Scholar] [CrossRef]
- Gruber, T.R. Toward principles for the design of ontologies used for knowledge sharing? Int. J. Human-Comput. Stud. 1995, 43, 907–928. [Google Scholar] [CrossRef]
- Noy, N.F.; Hafner, C.D. The State of the Art in Ontology Design a Survey and Comparative Review. AI Mag. 1997, 18, 53. [Google Scholar]
- Wang, W.; Tolk, A.; Wang, W. The Levels of Conceptual Interoperability Model: Applying Systems Engineering Principles to M&S. arXiv preprint 2019, arXiv:0908.0191. [Google Scholar] [CrossRef]
- Dobrev, P.; Kalaydjiev, O.; Angelova, G. From Conceptual Structures to Semantic Interoperability of Content. In Conceptual Structures: Knowledge Architectures for Smart Applications; ICCS 2007. Lecture Notes in Computer Science; Priss, U., Polovina, S., Hill, R., Eds.; Springer: Berlin, Heidelberg, 2007; Volume 4604. [Google Scholar]
- Susanna, P.-S.; Anu, P.; Eila, O.; Jarkko, K.; Antti, E. Situation-based and self-adaptive applications for the smart environment. J. Ambient Intell. Smart Environ. 2012, 4, 491–516. [Google Scholar]
- Noura, M.; Atiquzzaman, M.; Gaedke, M. Interoperability in Internet of Things: Taxonomies and Open Challenges. Mob. Netw. Appl. 2019, 24, 796–809. [Google Scholar] [CrossRef]
- Noura, M.; Atiquzzaman, M.; Gaedke, M. Interoperability in Internet of Things Infrastructure: Classification, Challenges, and Future Work. In IoT as a Service. IoTaaS 2017. Lecture Notes of the Institute for Computer Sciences, Social Informatics and Telecommunications Engineering; Lin, Y.B., Deng, D.J., You, I., Lin, C.C., Eds.; Springer: Cham, Switzerland, 2018; Volume 246. [Google Scholar]
- Jayaraman, P.P.; Palmer, D.; Zaslavsky, A.; Georgakopoulos, D. Do-it-Yourself Digital Agriculture applications with semantically enhanced IoT platform. In Proceedings of the 2015 IEEE Tenth International Conference on Intelligent Sensors, Sensor Networks and Information Processing (ISSNIP), Singapore, 7–9 April 2015; pp. 1–6. [Google Scholar]
- Ganzha, M.; Paprzycki, M.; Pawłowski, W.; Szmeja, P.; Wasielewska, K. Semantic interoperability in the Internet of Things: An overview from the INTER-IoT perspective. J. Netw. Comput. Appl. 2017, 81, 111–124. [Google Scholar] [CrossRef]
- Tayur, V.M.; Suchithra, R. A Comprehensive Ontology for Internet of Things (COIoT). In Proceedings of the 2019 Second International Conference on Advanced Computational and Communication Paradigms (ICACCP), Gangtok, India, 25 February 2019; pp. 1–6. [Google Scholar] [CrossRef]
- Bajaj, G.; Agarwal, R.; Singh, P.; Georgantas, N.; Issarny, V. A study of existing Ontologies in the IoT-domain. arXiv 2017, arXiv:1707.00112. [Google Scholar]
- Avancha, S.; Patel, C.; Joshi, A. Ontology-driven adaptive sensor networks. In Proceedings of the First Annual International Conference on Mobile and Ubiquitous Systems: Networking and Services MOBIQUITOUS, Boston, MA, USA, 22 August 2004; pp. 194–202. [Google Scholar]
- Matheus, C.J.; Tribble, D.; Kokar, M.M.; Ceruti, M.G.; McGirr, S.C. Towards a formal pedigree ontology for level-one sensor fusion. In Proceedings of the 10th International Command & Control Research and Technology Symposium, McLean, VA, USA, 13–16 June 2005. [Google Scholar]
- Russomanno, D.; Kothari, C.; Thomas, O. Building a Sensor Ontology: A Practical Approach Leveraging ISO and OGC Models. In Proceedings of The 2005 International Conference on Artificial Intelligence (IC-AI 2005), Las Vegas, NV, USA, June 2005; CSREA Press: Las Vegas, NV, USA, 2005; pp. 637–643. [Google Scholar]
- Eid, M.; Liscano, R.; El Saddik, A. A Novel Ontology for Sensor Networks Data. In Proceedings of the 2006 IEEE International Conference on Computational Intelligence for Measurement Systems and Applications, La Coruna, Spain, 12–14 July 2006; pp. 75–79. [Google Scholar] [CrossRef]
- Neuhaus, H.; Compton, M. The Semantic Sensor Network Ontology: A Generic Language to Describe Sensor Assets. In Proceedings of the Pre-Conference Workshop on Challenges in Geospatial Data Harmonisation (AGILE 2009), Hannover, Germany, 2 June 2009. [Google Scholar]
- Robin, A. OGC SWE Common Data Model Encoding Standard. Available online: http://portal.opengeospatial.org/files/?artifact_id=41157 (accessed on 22 March 2020).
- Sensor Model Language (SensorML). Available online: https://www.ogc.org/standards/sensorml (accessed on 22 March 2020).
- Compton, M.; Barnaghi, P.; Bermudez, L.; GarcíA-Castro, R.; Corcho, O.; Cox, S.; Graybeal, J.; Hauswirth, M.; Henson, C.; Herzog, A.; et al. The SSN ontology of the W3C semantic sensor network incubator group. J. Web Semant. 2012, 17, 25–32. [Google Scholar] [CrossRef]
- Haller, A.; Janowicz, K.; Cox, S.J.; Lefrançois, M.; Taylor, K.; Le Phuoc, D.; Lieberman, J.; García-Castro, R.; Atkinson, R.; Stadler, C. The Modular SSN Ontology: A Joint W3C and OGC Standard Specifying the Semantics of Sensors, Observations, Sampling, and Actuation. Semantic Web. 2018, 10, 9–32. [Google Scholar] [CrossRef]
- Rueda, C.; Galbraith, N.; Morris, R.A.; Bermudez, L.E.; Graybeal, J.; Arko, R.A.; Mmi Device Ontology Working Group. The MMI Device Ontology: Enabling Sensor Integration. Available online: https://ui.adsabs.harvard.edu/abs/2010AGUFMIN44B.08R/abstract (accessed on 22 March 2020).
- Schildhauer, M.; Matthew, B.; Shawn Bowers, J.; Madin, J.; Krivov, S.; Pennington, D.; Villa, F.; Leinfelder, B.; Jones, C.; O’Brien, M. The Extensible Observation Ontology. Available online: http://agroportal.lirmm.fr/ontologies/OBOE (accessed on 22 March 2020).
- Ojha, T.; Misra, S.; Raghuwanshi, N.S. Wireless sensor networks for agriculture: The state-of-the-art in practice and future challenges. Comput. Electron. Agric. 2015, 118, 66–84. [Google Scholar] [CrossRef]
- Li, Y.; Parker, L.E. A spatial-temporal imputation technique for classification with missing data in a wireless sensor network. In Proceedings of the 2008 IEEE/RSJ International Conference on Intelligent Robots and Systems, Nice, France, 22–26 September 2008; pp. 3272–3279. [Google Scholar] [CrossRef]
- Xie, M.; Hu, J.; Guo, S. Segment-Based Anomaly Detection with Approximated Sample Covariance Matrix in Wireless Sensor Networks. IEEE Trans. Parallel Distrib. Syst. 2015, 26, 574–583. [Google Scholar] [CrossRef]
- Rhayem, A.; Mhiri, M.B.A.; Salah, M.B.; Gargouri, F. Ontology-based system for patient monitoring with connected objects. Procedia Comput. Sci. 2017, 112, 683–692. [Google Scholar] [CrossRef]
- Charalampidis, C.C.; Keramopoulos, E.A. Semantic Web user interfaces—A model and a review. Data Knowl. Eng. 2018, 115, 214–227. [Google Scholar] [CrossRef]
- Introduction to XML. Available online: https://www.w3schools.com/xml/xml_whatis.asp (accessed on 22 March 2020).
- What is JSON? Available online: https://www.w3schools.com/whatis/whatis_json.asp (accessed on 22 March 2020).
- What is HTML? Available online: https://www.w3schools.com/whatis/whatis_html.asp (accessed on 22 March 2020).
- Resource Description Framework (RDF). Available online: https://www.w3.org/RDF/ (accessed on 22 March 2020).
- Davis, I.; Thomas Steiner, T.; Arnaud, J.L.H. RDF 1.1 JSON Alternate Serialization (RDF/JSON). Available online: https://www.w3.org/TR/rdf-json/ (accessed on 22 March 2020).
- David, B. RDF 1.1 N-Triples. Available online: https://www.w3.org/TR/n-triples/ (accessed on 22 March 2020).
- Tim, B.-L.; Dan, C. Notation3 (N3): A Readable RDF Syntax. Available online: https://www.w3.org/TeamSubmission/n3/ (accessed on 22 March 2020).
- David, B.; Tim, B.-L.; Eric, P.; Gavin, C. RDF 1.1 Turtle. Available online: https://www.w3.org/TR/turtle/ (accessed on 22 March 2020).
- Francesconi, E.; Montemagni, S.; Peters, W.; Tiscornia, D. Integrating a Bottom–Up and Top–Down Methodology for Building Semantic Resources for the Multilingual Legal Domain. In Semantic Processing of Legal Texts; Lecture Notes in Computer Science; Francesconi, E., Montemagni, S., Peters, W., Tiscornia, D., Eds.; Springer: Berlin/Heidelberg, Germany, 2010; Volume 6036. [Google Scholar]
- Koksal, I.; Gunes, N.T. Descriptors for Hazelnut; Bioversity International: Maccarese, Italy; FAO: Rome, Italy, 2008. [Google Scholar]
- What is Arduino? Available online: https://www.arduino.cc/en/guide/introduction (accessed on 22 March 2020).
- González-Buesa, J.; Salvador, M.L. An Arduino-based low cost device for the measurement of the respiration rates of fruits and vegetables. Comput. Electron. Agric. 2019, 162, 14–20. [Google Scholar] [CrossRef]
- XBee Zigbee Mesh Kit. Available online: https://www.digi.com/resources/documentation/digidocs/pdfs/90001942-13.pdf (accessed on 24 March 2020).
- XBee/XBee-PRO S2C Zigbee. Available online: https://www.digi.com/resources/documentation/digidocs/pdfs/90002002.pdf (accessed on 24 March 2020).
- dotNetRDF: An Open Source. NET Library for RDF. Available online: https://www.dotnetrdf.org/ (accessed on 26 March 2020).
- What is SUMI? Available online: http://sumi.uxp.ie/about/whatis.html (accessed on 19 April 2020).
© 2020 by the authors. Licensee MDPI, Basel, Switzerland. This article is an open access article distributed under the terms and conditions of the Creative Commons Attribution (CC BY) license (http://creativecommons.org/licenses/by/4.0/).