Abstract
The aim of the study was to develop a semi-automated, computer-aided imaging technique to quantify the amount and distribution of perivascular fat at the level of the iliac arteries (periiliac adipose tissue—PIAT), and to investigate the association of this new computer-aided imaging biomarker with other biomedical imaging biomarkers, which characterize the pelvic adipose tissue (SAT—subcutaneous adipose tissue; VAT—visceral adipose tissue). We included 34 patients with peripheral arterial disease, in whom the volumes of PIAT, SAT and VAT were quantified using a dedicated software, at the level of right and left iliac arteries. Median value of PIAT was five milliliters. Patients with PIAT > five milliliters were in more advanced Fontaine classes, with more complex arterial lesions, compared to those with low PIAT (<5 mL) (p < 0.0001). PIAT volumes presented a gradual increase with the Trans-Atlantic Inter-Society Consensus (TASC) class (2.57 +/− 1.98 in TASC A, 4.65 +/− 1.63 in TASC B, 8.79 +/− 1.99 in TASC C and 13.77 +/− 2.74 in TASC D). The distribution of PIAT between the left and right iliac axis was quasi-uniform (correlation between right and left PIAT: r = 0.46, p = 0.005). Linear regression analysis showed that the mean PIAT volume was correlated with VAT (r = 0.38, p = 0.02), but not with the SAT at the level of iliac artery origin (r = 0.16, p = 0.34). PIAT may represent a novel biomedical imaging derived biomarker, which characterizes the distribution of adipose tissue in the pelvic area and may serve as an indicator of the severity and complexity of lower limb ischemia.
1. Introduction
Peripheral artery disease (PAD) represents a particular manifestation of systemic atherosclerosis, in which atheromatous plaques are located at the level of the peripheral arteries. In most cases, the peripheral location of atherosclerosis is associated with concomitant involvement of the coronary or carotid arteries or with multiple co-morbidities, such as hypertension, diabetes mellitus, dyslipidemia or obesity. The prevalence of peripheral artery disease is increasing with age, with an incidence of around 20% of patients after the age of 80; it is estimated that it affects more than 200 million people worldwide [1].
It has been recently suggested that the adipose tissue may play a significant role in the complex process of atheromatous plaque progression and destabilization [2]. Adipose tissue is a tissue present throughout the body and has multiple roles in the complex thermoregulation process. The main depots of adipose tissue are located subcutaneously. However, several particular distributions of the adipose tissue, such as epicardial, visceral or perivascular can have important consequences on the complex cardiometabolic balance. The role of white adipose tissue in the regulation of vascular health and in the local production of inflammatory cytokines has been recently described. Several authors have demonstrated the potential involvement of this tissue in the etiology of endothelial dysfunction [3,4,5]. Adipose tissue has been associated with insulin resistance and cardiovascular events, this interrelation being mediated by an exacerbated inflammatory response triggered by local or systemic mediators released by adipokines [6]. The white adipose tissue contains adipocytes, macrophages, T cells and collagen fibers, at the same time secreting chemokines, leptin, adiponectin, resistin, vasoactive substances and free fatty acids. It is well-known that one of the most important adipokines released by the adipose tissue, tumor necrosis factor α, stimulates production of proinflammatory mediators such as interleukin 6 or monocyte chemotactic protein 1 [7,8]. In the presence of glucocorticoids, tumor necrosis factor α also increases leptin expression in the adipose tissue [8]. An increased leptin level is strongly associated with inflammation. Nevertheless, increased leptin levels are not only present in acute infections, inflammation and sepsis, but it is also involved in the pathophysiology of several chronic inflammatory or autoimmune diseases [9].
Multiple studies have investigated the association between perivascular adipose tissue and major vascular diseases. To date, most of these studies focused on the relationship between the epicardial adipose tissue and the presence of coronary artery disease. Epicardial adipose tissue, which is the fat surrounding the coronary arteries, has been demonstrated to represent a powerful marker of atherosclerosis. An increased epicardial fat volume has been associated with a higher vulnerability of the atheromatous coronary plaque and has been recorded in larger amounts in patients with acute myocardial infarction [10].
However, there is no study so far that has investigated the potential role of the perivascular adipose tissue, located at the level of iliac arteries, in the complex pathophysiology of peripheral arterial diseases. This is probably due to the difficulty to quantify the periiliac adipose tissue using standard imaging techniques, such as vascular ultrasound.
The aim of our study was to develop a semi-automated, computer-aided imaging technique to quantify the amount and assess the distribution of perivascular fat at the level of the iliac arteries, and to demonstrate the reliability of this technique in assessing the complexity of vascular disease in patients with atherosclerotic lesions at this level as expressed by presence of lower limb ischemia. At the same time, we investigated the association of this new computer-aided imaging biomarker of adipose tissue with other biomedical imaging derived biomarkers which characterize the distribution of adipose tissue in the pelvic area, such as the amount of subcutaneous fat or the volume of visceral fat at this level.
2. Materials and Methods
The study population consisted in 34 patients with peripheral arterial disease who presented for investigations to Cardio Med Medical Center in Târgu Mureș, Romania, between January 2018 and February 2019.
All patients gave informed consent to participate in the study and all the study procedures were performed in accordance with the ethics principles stipulated in the Declaration of Helsinki. The protocol of this study was approved by the ethics committee of the Cardio Med Medical Center and of the University of Medicine and Pharmacy Târgu Mureș, Romania.
Patients were included in the study only if they presented symptomatic peripheral arterial disease, in at least Fontaine 2B stage of evolution (which is represented by claudication pain in the limb, occurring after less than 200 m of regular walk). The mean age of the patient population was 67.29 ± 10.26 years (33–85 years) and 73.52% (n = 25) of them were males.
In all patients, all relevant clinical data were recorded, demographics and laboratory tests and advanced imaging tests (angiographic computed tomography) were performed in order to confirm the presence of peripheral arterial disease. Patients were also screened for the presence of cardiovascular risk including hypertension, dyslipidemia, obesity, ischemic coronary disease, myocardial infarction, the presence of known carotid artery disease, smoking, type II diabetes mellitus, heart failure, anemia and renal disease.
All imaging tests were performed in the Center of Advanced Research in Multimodality Cardiovascular Imaging of Cardio Med Medical Center, which were focused on measuring 3 types of adipose tissue volume: periiliac adipose tissue (PIAT), subcutaneous adipose tissue (SAT) and visceral adipose tissue (VAT).
2.1. CT Acquisition
Image acquisition was performed with a 128-slice computed tomography equipment (Somatom Definition AS, Siemens Healthcare GmbH, Erlangen, Germany).
The scanning protocol used 100 kVp for minimizing radiation dose, with the tube current modulation set at a reference dose of 160 mAs, a tube collimation of 0.6 × 128 mm, a slice thickness of 3 mm and increments of 3 mm. Image acquisition was performed with the patient in a supine position, in a craniocaudal direction, from 2 cm above the branching of the renal arteries to the pedal arteries. Contrast media was administered via an intravenous antecubital cannula, of 20–22 gauge, by injecting 120 mL of nonionic iodine-based contrast medium (Ultravist, Bayer, Leverkusen, Germany) and a 30 mL saline flush, at a flow rate of 4 mL/s, with a monophasic injection rate. The attenuation threshold for automatically triggering the optimal image acquisition was set at 160/180 Hounsfield units above the baseline value within the vascular bed. For optimization of the time delay for image acquisition, the region of interest was placed at the level of the abdominal aorta, above the iliac bifurcation. Breathing instructions were given to the patient for approximately 4 s, for proper imaging of the abdominal aorta. A typical scan duration was approximately 40 s, which ensured an adequate opacification of the distal arteries.
All images were analyzed by an experienced radiologist in cardiovascular CT imaging. The final image data set processed included: (1) thin slice maximum-intensity projections (MIPs) through the abdominal aorta, renal arteries, iliofemoral artery axes and crural vessels, (2) whole volume MIPs after bone removal, (3) curved planar reformations (CPRs) and (4) volume rendered images.
2.2. Computer-Aided CT Image Postprocessing
Computational processing of the obtained biomedical imaging data were performed using the syngo.via Frontier CT postprocessing software (Siemens Healthcare GmbH, Erlangen, Germany, 2017). The dedicated software for postprocessing the acquired images was used to determine the volume of the subcutaneous and periiliac adipose tissue, by using a semiautomated technique that required manual tracing and separation of the two types of adipose tissue. For the subcutaneous adipose tissue, the separation level was traced at the line of the anterior and posterior abdominal muscles, while for the periiliac adipose tissue the manual tracing of the perivascular tissues was performed at the level of the common iliac artery.
The axial sequences of the CT angiography images were examined slice-by-slice, from the level of abdominal aorta to the bifurcation of the common iliac arteries, in order to establish the aortic bifurcation and to define the optimal attenuation of the common iliac arteries. Both common iliac arteries were analyzed slice-by-slice from the aortic bifurcation until the iliac bifurcation into the external and internal iliac arteries.
An attenuation interval between −150 to −50 Hounsfield units was set as a threshold to define the presence of adipose tissue and calculate its volume, which characterized the specific CT density of fat [11]. Figure 1 represents a flowchart with the phases of the computer-aided image postprocessing technique.
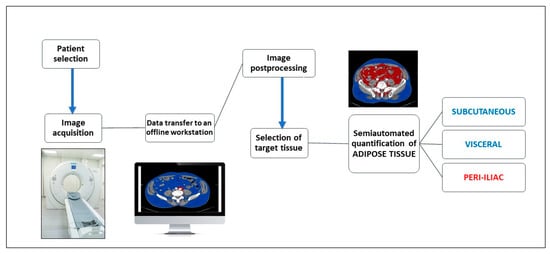
Figure 1.
Flowchart of the computer aided image postprocessing steps.
2.3. Assessment of the Periiliac Adipose Tissue
The volume of the PIAT was measured for both the right and left common iliac arteries, along the whole vessel and on each slice. The border of the PIAT was manually traced around the vessel, throughout the whole length of the iliac arteries, at a limit of 2 cm from the vessel border. After opening the imaging acquisition with the dedicate postprocessing software, a circle was manually traced around the target common iliac artery. The traced circle was manually adjusted in order to mark the tissues correctly around the vessel, at 2 cm outwards from the vascular wall. The following step included manual delineation of the circular border of the vessel at the bifurcation of the common iliac artery. The postprocessing software allowed automatic interpolation of the contours in a longitudinal direction on the examined segments and measurement of the perivascular adipose tissue using a color-coded system for a superior representation (Figure 2a,b). The software automatically detects the volume of the periiliac adipose tissue (with a CT attenuation ranging between −150 to −50 HU) after interpolation of contours, with a color-coded display. The volume of the perivascular adipose tissue was automatically calculated and displayed expressed in milliliters and with red color. The subcutaneous and visceral adipose tissue are represented with blue color.
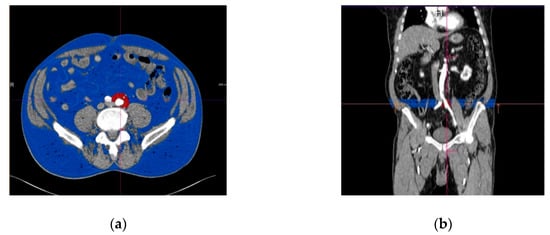
Figure 2.
Perivascular adipose tissue surrounding left common iliac artery (marked in red color). (a) Transverse section; (b) longitudinal section, with the region of interest immediately after the origin of the iliac arteries from the aorta. The subcutaneous adipose tissue is represented in blue.
2.4. Assessment of The Subcutaneous and Visceral Adipose Tissue
The volume of the SAT and VAT was determined for each patient. The process used in the measurements is described below. The scanned angio-CT images were visualized in the Angio Run Off 5.0 application of the syngo.via Frontier and viewed as read only. For adipose tissue measurements we used the MM Research Platform, the Cardiovascular Risk Assessment and the Abdominal Fat Segmentation applications of the cited image postprocessing software. This program opens the scanned angio CT images of the lower limbs in multiple ways at the same time: transversal, lateral and vertical views. In this application, we especially used the transversal view, because it allowed better identification of the origin of the common iliac arteries, which is the level we selected for all adipose tissue measurements. After finding the origin of the common iliac arteries in vertical, lateral and transversal incidences, we focused on the origin of the common iliac artery. Selection of the left or right iliac artery was done in accordance with the target level selected for measuring the subcutaneous and visceral adipose tissue. At this level manual separation of the visceral and subcutaneous adipose tissues was performed by drawing a line on the muscles of the anterior and posterior abdominal wall. The predetermined attenuation threshold of −150 and −50 HU of the adipose tissue, was than recognized by the software, as this is the established range for the CT density of the adipose tissue. The manually traced line that separates the adipose tissue located exteriorly and interiorly from the abdominal muscles, respectively, separated the two types of fatty tissue: the subcutaneous from the visceral.
The second measurement was performed at the distal part of the chosen common iliac artery, before its bifurcation into the external and internal iliac arteries. The distal part of the common iliac artery was analyzed in every incidence, using the transversal, vertical and lateral views, focusing on the immediate level of the bifurcation of the common iliac artery. In this transversal view, we again traced a line at the level of the anterior and posterior abdominal muscles, separating the subcutaneous adipose tissue from the visceral one. Whenever the traced line did not follow the contour of the abdominal muscles with precision, we manually edited the line to adjust the contour and obtain a perfect alignment with the contour of the fat.
To determine the volume of the subcutaneous and visceral adipose tissue at the whole length of the chosen common iliac artery, we used the function of automated interpolation of contours to create the separation line on the anterior and posterior abdominal muscles at the whole length of the vessel, as presented in Figure 3. The volume of the subcutaneous and visceral adipose tissue was then determined automatically and displayed together with the ratio between them. Figure 4 illustrates a diagram of the image postprocessing steps.
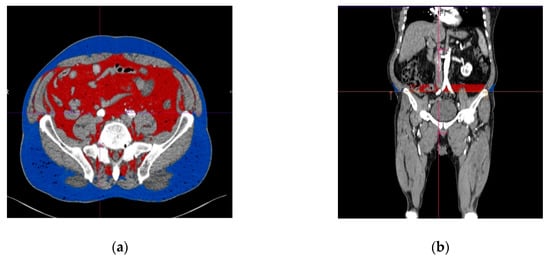
Figure 3.
Subcutaneous and visceral adipose tissue determined with angio CT (computed tomography angiography), measured at the level of the origin of the right common iliac artery. (a) Transverse view, (b) longitudinal view. The visceral adipose tissue is represented in red, while the subcutaneous adipose tissue is represented in blue.
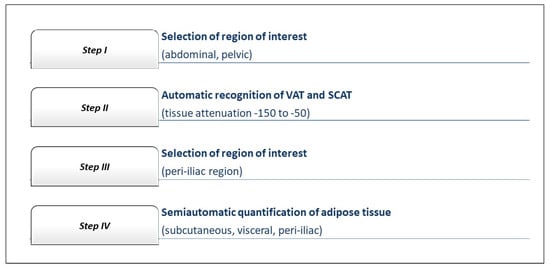
Figure 4.
Flow chart of the steps for the image data postprocessing on the offline workstation.
For the purpose of this study, we investigated the association between the amount of PIAT and:
- -
- complexity of the peripheral artery disease, expressed by TASC (Trans-Atlantic Inter-Society Consensus) class, in which TASC A represents the less complex and TASC D the most complex disease, according to the CT angiographic aspect of the iliac atherosclerotic lesions [12];
- -
- traditional cardiovascular risk factors and co-morbidities;
- -
- the amount of other computer-aided imaging biomarkers characterizing adipose tissue distribution, including the visceral and subcutaneous fat measured at the level of the common iliac arteries.
2.5. Patient Groups
Using the calculated median PIAT volume of 5 mL as a cutoff level, the study lot was divided into 2 groups: the low-PIAT group included 17 subjects with the mean PIAT volume lower than 5 mL, while the high ICS group included 17 subjects with the mean PIAT volume higher than 5 mL.
Statistical analysis: All study related data were analyzed using Graph Pad Prism 8.3.0 software (GraphPad Software, Inc., San Diego, CA, USA). Continuous variables are presented as mean ± SD and were analyzed using Mann–Whitney and unpaired t-test. Categorical variables were expressed as numbers and percentages and compared using Fischer’s exact test. Univariable relationships between variables were assessed with the Pearson correlation coefficient (r). In parameters with strong correlations, simple linear regression analysis was also performed. Threshold for statistical significance was set at p ≤ 0.05 and all statistical tests were 2-sided.
3. Results
3.1. Baseline Characteristics of the Study Population
The baseline characteristics, comorbidities and risk factors of the study population and the differences between the low-PIAT volume group and high-PIAT volume group, are presented in Table 1. There were no significant differences between low versus high PIAT volume patients in respect to age (p = 0.33), creatinine (p = 0.25), triglyceride levels (p = 0.8) and blood count (0.06). However, patients with high PIAT volume were more frequently males (88.2% vs. 58.8%, p = 0.05) and had higher cholesterol values (221.1 +/− 76.1 vs. 149.8 +/− 52.7, p = 0.007). There were no significant differences between the groups regarding history of coronary artery disease (CAD) or stroke (p = 0.5 for CAD and 0.5 for stroke), presence of diabetes (p = 0.9), hypertension (p = 0.3) or previous acute myocardial infarction (p = 0.6) (Table 1). The amount of PIAT in the low-volume group was 2.98 +/− 1.53, 95% CI 2.1 to 3.68, while in the high volume group was 8.92 +/−2.66, 95% CI 7.55 to 10.3.

Table 1.
Baseline characteristics, comorbidities and cardiovascular risk factors of the study population.
3.2. PIAT Volume and Severity of Peripheral Arterial Disease
Data related to the clinical severity (expressed by Fontaine class and Rutherford stage) and disease complexity (as revealed by TASC classification), are presented in Table 2. In group 1, only 29.4% of the patients were in Fontaine class II, while 41.1% were in Fontaine class III and 29.4% in Fontaine class IV, while in group 2, 47.05% of patients were in Fontaine class II, 5.88% in Fontaine class III and 47.05% in Fontaine class IV. However, the difference between the groups was not statistically significant in terms of disease severity expressed by the Fontaine class. Similarly, there were no significant differences between the groups in relation to the Rutherford classification (p-value for difference between the groups 0.37) (Table 2).
Table 2.
Severity and complexity of peripheral artery disease in the study groups. Severity of peripheral arterial disease is expressed by Fontaine class and Rutherford stage, while complexity is reflected by the Trans-Atlantic Inter-Society Consensus (TASC) class.
The CT complexity of the vascular lesions was assessed on the basis of TASC classification, which assigned 8 patients to TASC A, 13 patients to class B, 11 patients to class C and 2 patients to TASC D. PIAT volumes presented a gradual increase with the TASC class (2.57 +/− 1.98, 95% CI 0.90 to 4.23 for TASC A, 4.65 +/− 1.63, 95% CI 3.61 to 5.69 for TASC B, 8.79 +/− 1.99, 95% CI 7.45 to 10.14 for TASC C, 13.77 +/− 2.74, 95% CI −10.88 to 38.42 for TASC D) (Figure 5a). In general, patients with high PIAT volume presented more severe peripheral arterial disease, expressed by higher TASC class at CT angiography (Figure 5b).
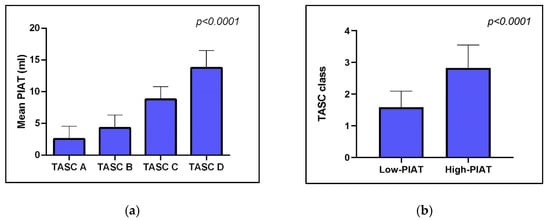
Figure 5.
Association between mean PIAT volume and complexity of vascular lesions, as expressed by TASC classification. (a) shows that patients with increased volume of PIAT have more complex arterial lesions; (b) indicates that average TASC class is significantly higher in patients with higher volumes of PIAT.
3.3. Computer-Aided Imaging Biomarkers Characterizing Adipose Tissue Distribution
The values obtained for all volumes of subcutaneous, visceral and periiliac fat at different levels in each case are presented in Table 3. Usually patients with high value of SCAT and VAT present higher values of PIAT. At the same time, the vast majority of patients with an increased PIAT volume measured at the left iliac artery had also high values of PIAT volumes at the right iliac artery.
Table 3.
Subcutaneous, visceral and periiliac fat measured at different levels of the iliac arteries, at the RCIA and LCIA.
Linear regression analysis of the fat distribution between left and right iliac axis revealed a quasi-uniform distribution of perivascular adipose tissue, as indicated by a correlation coefficient between right and left PIAT volume of 0.46 (p = 0.005) (Figure 6).
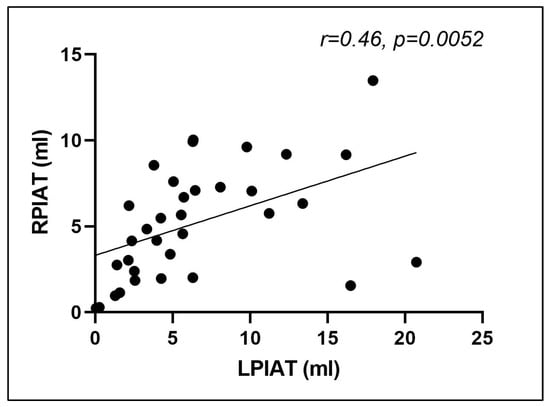
Figure 6.
Correlation between right and left periiliac adipose tissue volumes (r = 0.46, p = 0.0052). RPIAT = right periiliac adipose tissue, LPIAT = left periiliac adipose tissue.
Linear regression analysis of the association between cholesterol levels and median PIAT indicated a good correlation between the increase of serum cholesterol and the amount of adipose tissue at the level of iliac arteries (r = 0.39, p = 0.02), indicating a significant association between perivascular fat and cardiovascular risk.
Interestingly, linear regression analysis showed that the mean PIAT volume was significantly associated with the amount of visceral fat at this level, as calculated by the described computed postprocessing technique (r = 0.38, p = 0.02), but not with the subcutaneous fat at the level of iliac origin calculated with the same computational technology (r = 0.16, p = 0.34) (Figure 7a,b). This interesting finding was observed also in the separate sub-analysis for each side (left and right).
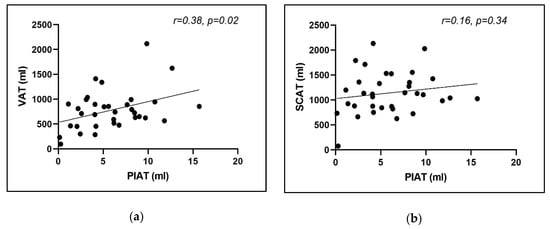
Figure 7.
Correlation between mean PIAT volume and (a) mean visceral adipose tissue; (b) mean subcutaneous adipose tissue.
4. Discussion
Published data showed that adipose tissue surrounding coronary arteries is present in a larger amount in patients with coronary artery disease than in healthy people [13]. At the same time, several biomarkers associated with inflammation, such as hsCRP, present higher values in patients who exhibit a larger amount of epicardial adipose tissue [14,15]. This indicates that the interrelation between epicardial adipose tissue and cardiovascular risk is more complex and not strictly limited to the atherosclerotic process. For instance, the amount of epicardial fat has been demonstrated to be associated with the risk of atrial fibrillation and development of ventricular remodeling after myocardial infarction, via a mechanism linked with inflammation [16]. It seems that inflammation plays a crucial role in the process of endothelial dysfunction, altering vascular health on all levels of systemic circulation.
It has been demonstrated that in obese patients, perivascular adipose tissue alters the vascular status by producing proinflammatory adipokines, which decrease endothelial function, increase vascular stiffness and oxidative stress and decrease the production of nitric oxide, all these favoring atherosclerosis progression [17].
Several studies have demonstrated a good correlation between obesity, fat distribution and the presence of aortoiliac peripheral artery disease [18,19]. The amount of body fat tissue and visceral distribution, the percentage of body fat and the waist–hip ratio are nowadays considered to represent reliable predictors of aortoiliac peripheral artery disease in middle-aged men. A body-mass index higher than 30 kg/m2, a waist–hip ratio over 1.02, and a quantity of fat tissue higher than 26.5% are strong predictors of aortoiliac disease in middle-aged men [19].
In patients with aortoiliac disease, all these parameters presented a significant correlation with angiographic scores for severity, and with the ankle–brachial index, a routinely used measure of disease severity. At the same time, several authors studied the effect of intrathoracic fat on the cardiovascular risk. They have demonstrated that the amount of periaortic fat tissue surrounding the thoracic aorta presents a significant association with the presence of peripheral artery disease, as detected by a low ankle–brachial index in the presence of intermittent claudication [20,21]. However, the relationship between perivascular adipose tissue at the level of the peripheral arteries, and the severity of peripheral artery disease, has not been studied yet. According to the authors’ knowledge, this is the first study to demonstrate that the amount of perivascular fat at the level of iliac arteries is directly linked with both severity and complexity of peripheral atherosclerosis. The present study describes an easy and user-friendly technique to quantify this periiliac fat via multi-slice computed tomography, a largely used imaging technique.
A recent report by Takaoka et al. demonstrated that endovascular injury indices phenotypic changes in the perivascular adipose tissue, thus indicating that the link between periiliac fat and atherosclerosis may be bidirectional, in the sense that perivascular fat may stimulate atherosclerosis progression, but in turn, atherosclerotic lesions may also induce perivascular fat accumulation or changes in the activity of perivascular adipocytes [22]. This could also represent a possible explanation for the good correlation between the complexity of arterial disease and the volume of perivascular fat, recorded in our study.
Interestingly, in our study, even if the atherosclerotic lesions were not similar in severity between the two sides of the peripheral circulation, the amount of PIAT was not significantly different between right and left iliac arteries, and the correlation between the left and right PIAT was very good. This indicates that the inflammatory effect mediated by the perivascular adipose tissue is regional or even systemic, rather than local.
Another interesting finding of this study is that PIAT volume was significantly associated with the amount of visceral fat (r = 0.38, p = 0.02), but not with the subcutaneous fat (r = 0.16, p = 0.34). Importantly, quantification of both types of fat was performed with the same computational technology, applied at the same level at the iliac origin. This suggests that in patients with lower limb ischemia, visceral fat may play a more important role in atherosclerosis progression than the subcutaneous fat. This observation may also open new hypotheses related to the role of different types of fat as reservoirs of proinflammatory mediators with particular affinity for peripheral circulation.
4.1. Study Limitations
Our study has several limitations. First, the research sample was quite small, which can be explained by the fact that this is just a pilot study. We tested the hypothesis that CT-based quantification of periiliac fat is a reliable method to evaluate a new imaging-based biomarker associated with the severity of peripheral arterial disease. Once this method has been described, we will test the validity of this biomarker in different clinical settings in further studies, on larger number of patients. Second, there was no interoperator variability assessment performed, since there was only operator available for the measurements. However, the method is quite simple and easy-to-use and relies mostly on the use of a dedicated software available on the CT machine platform, which has already been validated prior to the implementation of the platform.
4.2. Future Developments
This proposed novel imaging biomarker—PIAT, is associated with more extensive atherosclerotic lesions and also with an enhanced clinical expression of the peripheral artery disease. Inflammation has been involved in all stages of development and progression of atherosclerosis [23]. The perivascular adipose tissue has been linked to an increased inflammatory status, which in turn is associated with the severity of the atherosclerotic lesions, throughout different locations within the arterial system [24,25]. Inclusion of a serum panel for inflammatory biomarkers could enhance the use of PIAT as a novel imaging risk factor. One of the future directions of the present study is to evaluate the association of several inflammatory biomarkers (C-reactive protein, pentraxin 3, interleukins), with the volume of periiliac adipose tissue, in correlation with the clinical and imaging severity of lower limb artery disease [26,27]. Another future development of the present study would be to create an automated method for quantification of the periiliac adipose tissue based on radiomics. Studies have shown that evaluating the attenuation of adipose tissue surrounding the coronary arteries, by using the radiomic signature of the pericoronary fat, in a novel concept entitled “fat attenuation index” (FAI) is a feasible method for predicting the severity of the coronary atherosclerotic lesions and also for predicting patient outcomes [28,29]. Based on this concept, the FAI of the perivascular adipose tissue located around the iliac arteries could become a new imaging biomarker for prediction of vascular inflammation and severity of peripheral artery disease.
5. Conclusions
PIAT may represent a novel biomedical imaging derived biomarker which characterizes the distribution of adipose tissue in the pelvic area and may serve as an indicator of the severity and complexity of lower limb ischemia.
Author Contributions
Conceptualization, E.R., I.B. and T.B; methodology, E.R., I.B. and T.B; software, E.R., I.K. and M.R; validation, T.B. and I.B.; formal analysis, E.R., N.R., I.K. and D.O.; investigation, E.R., M.R. and T.B.; resources, E.R., D.O. and N.R.; data curation, E.R., N.R., M.R: and D.O.; writing—original draft preparation, E.R., D.O. and T.B; writing—review and editing, T.B. and D.O; visualization, E.R., I.K.; supervision, T.B. and I.B.; project administration, T.B.; funding acquisition, I.B., E.R. and T.B. All authors have read and agreed to the published version of the manuscript.
Funding
This research was funded by PlaqueImage research grant (Increasing the research capacity in the field of vulnerable plaque imaging, based on advanced nanoparticles, fusion imaging and computational simulation), financed by the National Authority of Scientific Research and Innovation and the Romanian Ministry of European Funding, through the Competitivity Operational Program (contract number 26/01.09.2016, SMIS code: 103544).
Conflicts of Interest
The authors declare no conflicts of interest.
References
- Hicks, C.W.; Yang, C.; Ndumele, E.C.; Folsom, R.A.; Heiss, G.; Black, H.J.; Selvin, E.; Matsushita, K. Associations of Obesity With Incident Hospitalization Related to Peripheral Artery Disease and Critical Limb Ischemia in the ARIC Study. J. Am. Heart Assoc. 2018, 7, e008644. [Google Scholar] [CrossRef]
- Ratiu, M.; Rat, N.; Nyulas, T.; Moldovan, G.; Rus, V.; Benedek, T.; Benedek, I. Coronary Plaque Geometry and Thoracic Fat Distribution in Patients with Acute Chest Pain—A CT Angiography Study. J. Cardiovasc. Emergencies 2019, 5, 18–24. [Google Scholar] [CrossRef]
- Britton, K.A.; Fox, C.S. Perivascular Adipose Tissue and Vascular Disease. Clin. Lipidol. 2011, 6, 79–91. [Google Scholar] [CrossRef] [PubMed]
- Yucel, N.; Arany, Z. Fat, Obesity, and the Endothelium. Curr. Opin. Physiol. 2019, 12, 44–50. [Google Scholar] [CrossRef] [PubMed]
- Schäfer, K.; Drosos, I.; Konstantinides, S. Perivascular Adipose Tissue: Epiphenomenon or Local Risk Factor? Int. J. Obes. (Lond) 2017, 41, 1311–1323. [Google Scholar] [CrossRef] [PubMed]
- Brown, N.K.; Zhou, Z.; Zhang, J. Perivascular Adipose Tissue in Vascular Function and Disease: A Review of Current Research and Animal Models. Arter. Thromb. Vasc. Biol. 2014, 34, 1621–1630. [Google Scholar] [CrossRef]
- Karastergioua, K.; Mohamed-Ali, V. The Autocrine and Paracrine Roles of Adipokines. Mol. Cell Endocrinol. 2010, 318, 69–78. [Google Scholar] [CrossRef]
- Trujillo, E.M.; Lee, M.J.; Sullivan, S.; Feng, J.; Schneider, H.S.; Greenberg, S.A.; Fried, K.S. Tumor Necrosis Factor and Glucocorticoid Synergistically Increase Leptin Production in Human Adipose Tissue: Role for p38 Mitogen-Activated Protein Kinase. J. Clin. Endocrinol. Metab. 2006, 91, 1484–1490. [Google Scholar] [CrossRef] [PubMed]
- Iikuni, N.; Lam, Q.L.; Lu, L.; Matarese, G.; La Cava, A. Leptin and Inflammation. Curr. Immunol. Rev. 2008, 4, 70–79. [Google Scholar] [CrossRef]
- Nyulas, T.; Morariu, M.; Rat, N.; Marton, E.; Rus, V.A.; Ratiu, M.; Benedek, T.; Benedek, I. Epicardial Adipose Tissue Role as a Marker of Higher Vulnerability in Patients with Coronary Artery Disease. J. Interdiscip. Med. 2018, 3, 77–83. [Google Scholar] [CrossRef]
- Kim, W.H.; Kim, C.G.; Kim, D.W. Optimal CT Number Range for Adipose Tissue When Determining Lean Body Mass in Whole-Body F-18 FDG PET/CT Studies. Nucl. Med. Mol. Imaging. 2012, 46, 294–299. [Google Scholar] [CrossRef] [PubMed]
- Norgren, L.; Hiatt, W.R.; Dormandy, J.A.; Nehler, M.R.; Harris, K.A.; Fowkes, F.R.G. Inter-Society Consensus for the Management of Peripheral Arterial Disease (TASC II). J. Vasc. Surg. 2007, 45, S5–S67. [Google Scholar] [CrossRef]
- Iozzo, P. Myocardial, Perivascular, and Epicardial Fat. Diabetes Care 2011, 34 (Suppl. 2), S371–S379. [Google Scholar] [CrossRef]
- Demir, E.; Harmankaya, N.Ö.; Utku, K.I. The Relationship between Epicardial Adipose Tissue Thickness and Serum Interleukin-17a Level in Patients with Isolated Metabolic Syndrome. Biomolecules 2019, 9, 97. [Google Scholar] [CrossRef] [PubMed]
- Talman, A.H.; Psaltis, P.J.; Cameron, J.D.; Meredith, I.T.; Seneviratne, S.K.; Wong, D.T. Epicardial Adipose Tissue: Far More than a Fat Depot. Cardiovasc. Diagn. 2014, 4, 416–429. [Google Scholar] [CrossRef]
- Opincariu, D.; Chitu, M. Atrial Fibrillation and Acute Myocardial Infarction—An Inflammation-mediated Association. J. Cardiovasc. Emergencies 2018, 4, 123–132. [Google Scholar] [CrossRef]
- Cinteza, M.; Benedek, I. Epicardial Adipose Tissue—A New Biomarker of Cardiovascular Risk. J. Cardiovasc. Emergencies 2016, 2, 4–6. [Google Scholar] [CrossRef]
- Hung, P.H.; Tsai, H.B.; Lin, C.H.; Hung, K.Y. Abdominal Obesity is Associated with Peripheral Artery Disease in Hemodialysis Patients. PLoS ONE 2013, 8, e67555. [Google Scholar] [CrossRef]
- Jakovljević, B.; Stojanov, V.; Lović, D.; Paunović, K.; Radosavljević, V.; Tutić, I. Obesity and Fat Distribution as Predictors of Aortoiliac Peripheral Arterial Disease in Middle-aged Men. Eur. J. Intern. Med. 2011, 22, 84–88. [Google Scholar] [CrossRef]
- Lee, J.J.; Pedley, A.; Weinberg, I. Relation of Iliac Artery Calcium With Adiposity Measures and Peripheral Artery Disease. Am. J. Cardiol. 2017, 119, 1217–1223. [Google Scholar] [CrossRef][Green Version]
- Fox, C.S.; Massaro, J.M.; Schlett, C.L. Periaortic Fat Deposition is Associated with Peripheral Arterial Disease: The Framingham Heart Study. Circ. Cardiovasc. Imaging 2010, 3, 515–519. [Google Scholar] [CrossRef] [PubMed]
- Takaoka, M.; Suzuki, H.; Shioda, S. Endovascular Injury Induces Rapid Phenotypic Changes in Perivascular Adipose Tissue. Arter. Thromb. Vasc. Biol. 2010, 30, 1576–1582. [Google Scholar] [CrossRef] [PubMed]
- Libby, P.; Loscalzo, J.; Ridker, P.M.; Farkouh, M.E.; Hsue, P.Y.; Fuster, V.; Hasan, A.A.; Amar, S. Inflammation, Immunity, and Infection in Atherothrombosis: JACC Review Topic of the Week. J. Am. Coll. Cardiol. 2018, 72, 2071–2081. [Google Scholar] [CrossRef]
- Antoniades, C.; Kotanidis, C.P.; Berman, D.S. State-of-the-art review article. Atherosclerosis affecting fat: What can we learn by imaging perivascular adipose tissue? J. Cardiovasc. Comput. Tomogr. 2019, 13, 288–296. [Google Scholar] [CrossRef] [PubMed]
- Tanaka, K.; Masataka, S. Roles of Perivascular Adipose Tissue in the Pathogenesis of Atherosclerosis. Front. Physiol. 2018, 9, 3. [Google Scholar] [CrossRef]
- Stone, P.A.; Yacoub, M. Inflammatory biomarkers in peripheral arterial disease. Semin. Vasc. Surg. 2014, 27, 148–151. [Google Scholar] [CrossRef]
- Ozaki, Y.; Imanishi, T.; Akasaka, T. Inflammatory Biomarkers in Peripheral Artery Disease: Diagnosis, Prognosis, and Therapeutic Challenges. Curr. Med. Chem. 2015, 22, 2744–2753. [Google Scholar] [CrossRef]
- Antonopoulos, A.S.; Sanna, F.; Sabharwal, N.; Thomas, S.; Oikonomou, E.K.; Herdman, L.; Margaritis, M.; Shirodaria, C.; Kampoli, A.M.; Akoumianakis, I.; et al. Detecting human coronary inflammation by imaging perivascular fat. Sci. Transl. Med. 2017, 9, eaal2658. [Google Scholar] [CrossRef]
- Oikonomou, E.K.; Marwan, M.; Desai, M.Y.; Mancio, J.; Alashi, A.; Hutt Centeno, E.; Thomas, S.; Herdman, L.; Kotanidis, C.P.; Thomas, K.E.; et al. Non-invasive detection of coronary inflammation using computed tomography and prediction of residual cardiovascular risk (the CRISP CT study): A post-hoc analysis of prospective outcome data. Lancet 2018, 392, 929–939. [Google Scholar] [CrossRef]
© 2020 by the authors. Licensee MDPI, Basel, Switzerland. This article is an open access article distributed under the terms and conditions of the Creative Commons Attribution (CC BY) license (http://creativecommons.org/licenses/by/4.0/).