Abstract
Traffic noise is a major pollution problem in Hong Kong and many large cities throughout the world. Indeed, traffic noise and traffic flow patterns interact, however, there is a very little research effort studying it. To the best knowledge of the authors, the present research is the first on-site measurement study about the effect of a traffic signal on the noise level of moving vehicles. Various cases of “stop and go” and “non-stop” were considered in the traffic noise measurements, where the terms “stop and go” and “non-stop” represent a traffic road with and without traffic signals, respectively. The L10 and Leq noise levels were recorded and compared in the present study. From the results, it was found that the stop time and traffic flow are factors that also affect the sound level properties.
1. Introduction
In recent decades, many researchers have investigated various environmental noise research topics such as railway noise [1,2], aircraft noise [3,4], wind turbine noise [5,6], marine/port noise [7,8,9], noise and health [10,11], and, noise measurement method [12,13]. Hong Kong is an economic city with probably the highest traffic intensity and density on roads in the world. Thus, traffic noise is also one of the important research topics (e.g., [14,15,16,17,18,19,20]). At the end of 2015, there were more than 720,000 licensed vehicles [21] running on the road network where the total road length was around 2100 km [22]. Because of the spatial constraints, traffic noise is a critical problem in Hong Kong.
The current study is a combination of the two research topics (i.e., road traffic noise and traffic signal system). There are very few studies about that. De Coensel et al. [23] and Stoilova et al. [24] conducted simulations to study the effects of traffic signal coordination/traffic light control on noise. In their studies, there were no on-site measurement results. Most research works about road traffic noise only focused on mathematical modelling, evaluation method, road gradient and vehicle type effects amongst others. For example, Maruyama et al. [25] developed a new mathematical model which was used for estimating the road traffic noise levels at sites along a freeway where the traffic volume fluctuated from a maximum of 900 vehicles per hour in the daytime to a minimum of 300 vehicles per hour at night. Ikuta et al. [26] proposed a statistical evaluation method for traffic noise under the existence of background noise. The effectiveness of the proposed method was experimentally confirmed by applying it to the traffic noise data measured in a complex sound environment. Gille et al. [27] studied the influence of different acoustical characteristics of urban road traffic including powered-two-wheelers on noise annoyance. Tang and Tong [28] carried a set of site measurements on the kerbs of 19 inclined roads and studied the effect of road gradients on the traffic noise. Cho and Mun [29] proposed a highway traffic noise prediction model to account for the interaction of car vehicles on asphalt and concrete road surfaces. Lam and Ma [30] determined the exposure of the urban population to road traffic noise living in residential complexes built at different time periods between 1950 and 2000 in Hong Kong.
Moreover, most research works about a signal-controlled system only focused on intersection modelling, signal optimization, and travel time minimization etc. There were no considerations about noise level. For example, Han and Gavah [31] developed the continuum signalized intersection model to accurately account for three realistic complications, namely signal offsets, queue spillbacks, and complex signal phasing schemes. Li et al. [32] addressed the problem of simultaneous route guidance and traffic signal optimization problem, where each vehicle in a traffic network was guided on a path and the traffic signals serving these vehicles were set to minimize their travel times.
The aforementioned studies mainly focused on either traffic noise or traffic signals. The present study mainly focused on the effect of a traffic signal on the roadside sound levels emitted by controlled vehicles. To the best knowledge of the authors, the present research is the first one which contains a set of on-site measurements. Several sets of roadside sound levels were measured for different scenarios, such as “stop and go” (i.e., showing red and green signals) and “non-stop” (i.e., showing full green signals). The terms “stop and go” and “non-stop” can be regarded as a traffic road with and without traffic signals, respectively. A measurement site with minimum influence due to other vehicles and noisy construction works was selected. A set of microphones were used on each side of the road in each sound measurement. From the measurements, the effect of stop duration, number of vehicles passing measurement point, type of vehicles, and traffic flow etc. were studied.
2. Site Measurement and Data Collection
Measurements were conducted to determine the noise emission of moving vehicles on a road under various traffic conditions and scenarios. The measurement site was located at Yau King Lane in Tai Po in the New Territories where there is a carriageway with two road lanes serving two-way traffic. As the selected measurement site was situated at an open rural area with extremely low traffic flow, noise emission of the studied vehicles was solely recorded and irrelevant sound and noise were reduced to a minimum level. Influence due to other vehicles, reflections from road surfaces, human activities or noisy construction works on sound measurements and measurement results can be greatly avoided. In this research, a van and a coach were studied respectively as shown in Figure 1. Instruments used for data collection were six sound level meters. For the precision of measurements, all sound level meters were calibrated on the basis of the manufacturer’s guidelines. The instruments were set at either the measurement points A and B or C and D in Figure 2 at three different heights, in accordance with the tested traffic scenarios and vehicle movements. In each measurement, three microphones were set at a check point on each side of the road, respectively at a height of 1.2 m, 4.0 m and 6.5 m for the simulation of ground, first and second floor levels (see Figure 3). The sound pressure levels were recorded in terms of LAeq(1s). At the beginning, all instruments were started up 30 s to evaluate the background noise level. A total of two traffic scenarios were run for measurements, namely the “non-stop” and “stop and go” situations. In the former, the studied vehicles passed the check points at constant designated vehicular speeds at 30, 50 or 70 km/h. Table 1 shows the summary of the measurement information. For the latter, the studied vehicles decelerated from 50 km/h, stopped at the check points and then subsequently accelerated again. Figure 4 shows an example of sound level time history for a “stop and go” vehicle. In this scenario, there are three time sessions, namely deceleration , stop and acceleration . The total measurement time is . The measurement heights are shown in Figure 3. In each scenario, the sound levels produced by the right-turning, left-turning or straight-going movements of the studied vehicles were recorded respectively.
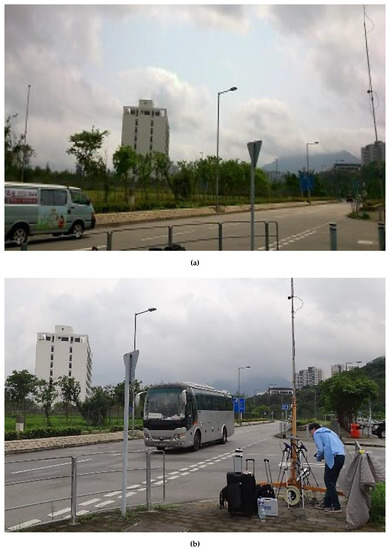
Figure 1.
Sound measurements of a motor vehicle on road. (a) A van; (b) a coach.
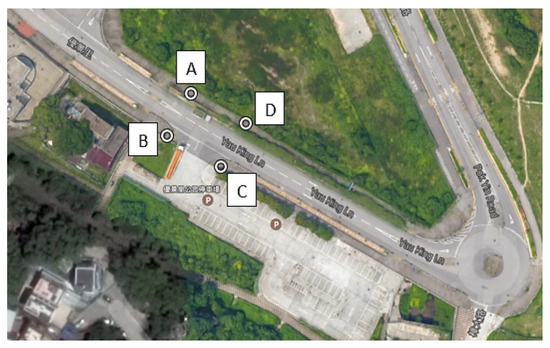
Figure 2.
Measurement points A, B, C and D at Yau King Lane in Tai Po, Hong Kong.
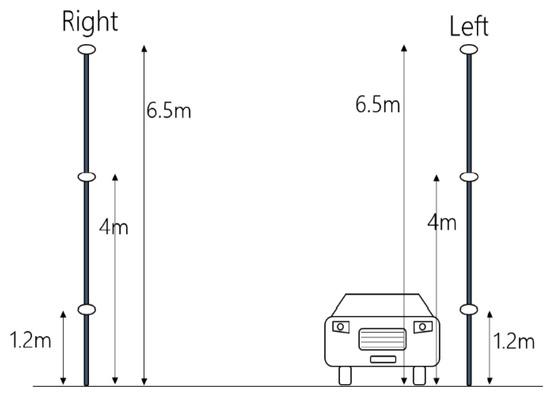
Figure 3.
Measurement points in Figure 2 at three different heights.

Table 1.
Summary of the measurement information.
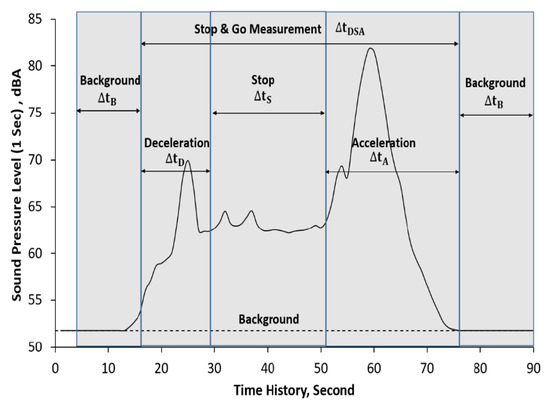
Figure 4.
Noise level variation of “stop and go” situation of a single vehicle.
3. Results and Discussion
A comparison of the average sound pressure levels is presented in Figure 6a–c. These figures show the average sound pressure levels LAeq plotted against the measurement time for various van speeds and coach speeds in two non-stop cases (i.e., non-stop with turning movement and non-stop with straight going movement). The average sound pressure levels LAeq are calculated from the following equation:
where n is the number of trials in the corresponding scenarios, and LAeq,j is the measured LAeq value in the ith trial. Note that in each measurement case, there were at least three trials. In addition, the overall sound pressure levels LAeq(1s) from six individual microphones at the measurement points (see Figure 3) are obtained as follows:
where LAeq,j is the LAeq value recorded by each microphone at a particular time. is the equivalent sound level within 1 s.
The average background sound levels in both van and coach cases were 55.2 dB(A) and 51.8 dB(A), respectively. The total durations of the controlled van and coach across the measurement points ranged from about 20 to 45 s. In these cases, the peak sound pressure levels of the vehicle speed at 50 km/h are 68.5 dB(A) (i.e., the non-stop and turning movement case in Figure 5a), 66.4 dB(A) (i.e., the non-stop and straight movement case in Figure 5b), and 74.6 dB(A) (i.e., the non-stop and straight movement case in Figure 5c), respectively. The controlled van took a longer time to make a turning movement to pass through the measurement points and induced a higher peak sound level at the same speed. The comparison between the van and coach cases shows that the peak sound levels of the coach at the speed of 50 km/h and 70 km/h are about 6 to 7 dB higher than those in the van cases. The coach and its engine are bigger, and thus the measurement point would be exposed to a higher sound level. Generally, it is found that the higher the van/coach speed is, the higher the peak sound level is measured.
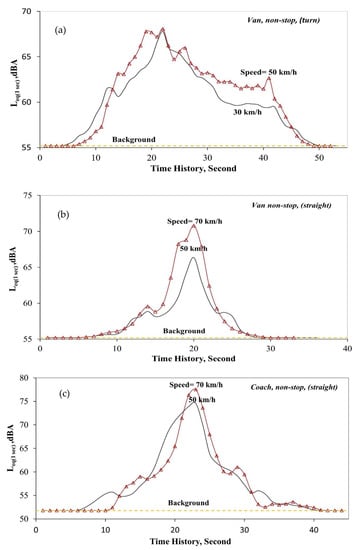
Figure 5.
A comparison of average sound pressure levels under “non-stop” traffic scenarios. (a) Van, turn; (b) Van, straight; (c) Coach, straight.
Figure 6a–c show the average sound pressure levels (LAeq) plotted against the measurement time in the “stop and go” cases. The yellow dash line in each figure represents the background noise. There is no difference between the deceleration and stop durations in Figure 6a,b. In the acceleration durations, the peak on the sound level curve in the “straight” case is wider and jumps down sharply after about 10 s. Relatively, the peak on the sound level curve in the “turn” case is small. The sound level drops mildly after about 15 s. In the “turn” case, the controlled van took a longer time to make a turning movement and thus, the sound level in the acceleration duration in Figure 6a takes longer to decay sharply. In Figure 6c, the sound levels of the coach in the deceleration, stop and acceleration durations are significantly higher than those in Figure 6a,b. In the deceleration portion, there is a peak on the sound level curve (no peaks are found in the van cases). When the controlled coach was about to stop, an abrupt sound was induced due to the brake mechanism and engine system in the deceleration mode. In the acceleration duration, the peak sound level is the highest and the curve sharp is similar to the one in Figure 6b. Figure 7a,b show the average sound pressure levels L10 of a single controlled van plotted against the stop durations, where the L10 value is the level just exceeded for 10% of the time. The average sound pressure levels of the non-stop van speeds at 50 km/h are also shown on these figures (i.e., the straight lines on the figures). In general, when the stop duration goes to infinity, the average sound pressure levels converge to the corresponding sound level within the stop duration. It is because the contribution of the deceleration and acceleration to the overall sound level tends to be insignificant. For calculating the sound levels in these figures, which are functions of the durations of the deceleration, stop, and acceleration, the following formula is used.
where , and are the time durations of the deceleration, stop, and acceleration, respectively. , , and are the L10 sound levels in the durations of the deceleration, stop, and acceleration, respectively.
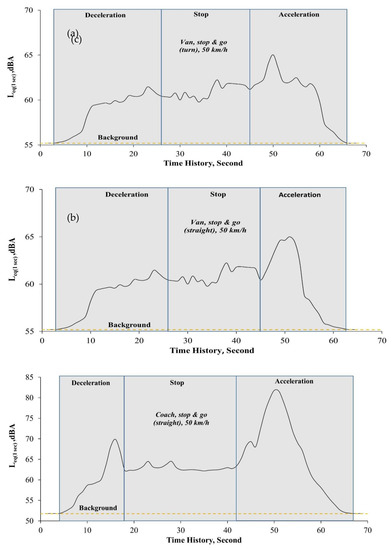
Figure 6.
A comparison of average sound pressure levels under “stop and go” traffic scenarios. (a) Van, turn; (b) Van, straight; (c) Coach, straight.
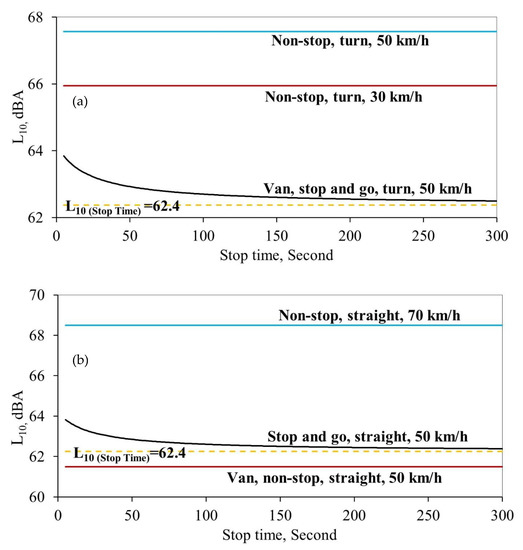
Figure 7.
A comparison of average sound pressure levels (L10) against the stop durations. (a) Stop and go, turn; (b) Stop and go, straight.
Figure 8a–f show the average sound pressure levels L10 plotted against the number of controlled vans/coaches passing through the measurement points for various speeds and stop durations. Figure 8a–c and Figure 8d–f are the “stop and go” results and “non-stop” results, respectively. The traffic flow is 120 vans per hour. The dashed curves in Figure 8a–c denote the sound levels within the stop durations (i.e., the summation of the sound levels from those vans/coaches in the stop duration). The physical meaning of the dotted curves can be considered as “traffic congestion”. For the jth time step, the sound levels of N vehicles in the “stop”, “stop and go”, and “non-stop” scenarios can be obtained from Equations (4)–(6), respectively.
where N is the number of vehicles, is the sound level of the hth vehicle at the jth time step for the stop scenario, is the sound level of the hth vehicle at the jth time step for the deceleration, stop, and acceleration scenario (i.e., “stop and go“ case), and is the sound level of the hth vehicle at the jth time step for the non-stop scenario. In the above calculations, distance correction must be considered in the cases of “stop” and “stop and go”. For an example, when there are ten vehicles, the distances of the 3rd to 10th vehicles from the measurement location are longer than that of the 1st and 2nd vehicles. It is because Yau King Lane is a two-lane road. The distance correction is given by , where r1 and rh are the distances of the 1st and hth vehicles from the measurement location, respectively.
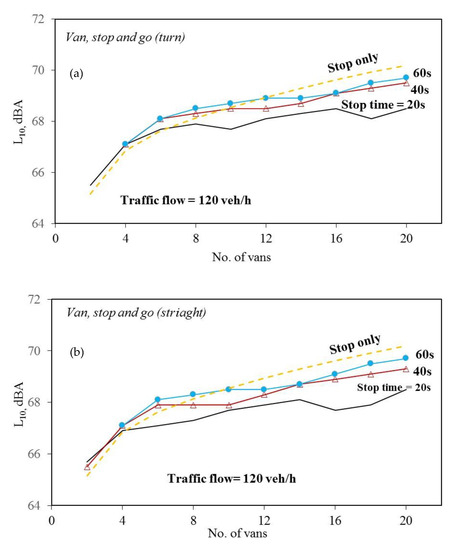

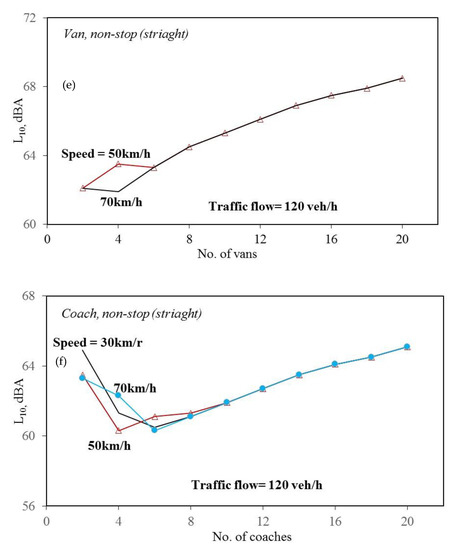

Figure 8.
A comparison of average sound pressure levels (L10) against the number of vans/coaches in “stop and go” and “non-stop” cases. (a) Van, stop and go, turn; (b) Van, stop and go, straight; (c) Coach, stop and go, straight; (d) Van, non-stop, turn; (e) Van, non-stop, straight; (f) Coach, non-stop, straight; (g) Cumulative frequency, van, stop and go, turn; (h) Cumulative frequency, van, non-stop, turn.
When there is no vehicle, the measured sound level is considered as the background sound level (i.e., where is the kth time step for no vehicle scenario). Hence, the L10 sound level of N vehicles for a scenario (e.g., no vehicle, deceleration, stop and acceleration case) is the noise level that is exceeded for 10% of the total time duration of the background, deceleration, stop, and acceleration scenario (i.e., ).
The curve shapes of Figure 8a,b in the “stop and go, turn” cases and “stop and go, straight” cases are similar. Generally, the sound levels are monotonically increasing with the number of vans. When the number of vans is small, the curve slopes are deeper; and the maximum differences between the curves are also smaller. It is noted that when the number of vans is large, the dashed curve in these figures, which represents the sound levels within the stop durations, are higher than the other curves. In Figure 8c, the curves are quite different from those in Figure 8a,b. The maximum sound level of the controlled coach is about 16 dB higher than that of the controlled van. The sound level of stop time = 60 s is quite constant for the entire range. The sound levels of stop times = 40 s and 60 s are very close for the number of coaches less than 14. Besides, the sound levels of stop times =20 s and 40 s start to decrease at the numbers of coaches = 8 and 16, respectively. The sound level of stop time = 20 s is minimum at the number of coaches = 14 and starts to increase. From the results in the coach cases, it is seen that the stop time plays an important role to affect the sound level.
Figure 8d,e shows the sound levels in the nonstop cases of the controlled van “going straight” and “turning”. The main difference is that when the number of vans is small the curves in Figure 8d are largely different from each other, while the two curves in Figure 8e are also identical (except a detectable difference at the number of vans = 4). In Figure 8f, the three curves are quite similar. They are decreasing when the number of coaches is small and start to increase at the number of coaches = 8. It is noted that a L10 value is the sound level just exceeded for 10% of the time. Hence, in many cases of Figure 8d–f, the L10 values are identical because the sound levels exceeded for 10% of the time are also identical (even though the LAeq values are different). Figure 8g,h show the cumulative percentages plotted against the sound levels for the “stop & go’ case and “non-stop” case. In each of these two figures, the x coordinate of the intercept pointed between the dashed line and any of other three curves represent the L10 of the case. In Figure 8g, each of the curves contains three portions. The slopes of the 1st and 3rd portions are more shallow than that of the 2nd portion. It is implied that the sound level data can be divided into three groups. This is because the sound level variation properties in the durations of “deceleration”, “stop”, and “acceleration” are different. It is seen that when the number of vans is large, there is an abrupt jump down, and the curve looks like a “step function”. In Figure 8h, each of the curve also contains an abruption down. After the abruption down, the cumulative percentage gradually decreases.
Figure 9a–f show the average sound pressure levels (L10) plotted against the numbers of controlled vans/coaches passing through the measurement points for various traffic flows. Note that in Figure 9c, the curve of 120 vans per hour starts at the number of vans = 4, instead of 2. It is because the duration of each stop and go cycle is about 100 s. If the number of vans passing the measurement points is 2, there are 60 “stop and go” cycles in one hour. The total duration of these 60 cycles would be longer than one hour. The same reason is also applied to the curves in Figure 9e,f which do not start at the number of vans = 2. A comparison between Figure 9a–c shows that if the traffic flow is higher, the corresponding curve is higher than the others; if the traffic flow is high (i.e., 120 vans/h), the sound pressure is monotonically increasing; if the traffic flow is low (i.e., 30 vans/h), there is a trough (or minimum point) on the corresponding curve within the number of vans = 4 to 8; and if the number of vans is higher than 10, the three curves in each of the figures are monotonically increasing and converging. Unlike those in Figure 9a–c, there is no case in Figure 9d–f, in which the sound pressure is monotonically increasing. Except the one case in Figure 9f, there is a trough (or minimum point) in all other cases. If the stop time is shorter, the value of the minimum point is lower. Similar to those in Figure 9a–c, if the number of vans is higher than 8, the three curves in each of the figures are monotonically increasing and converging. In Figure 9a–f, it is found that when the number of vehicles passing the measurement location is small (i.e., 2 to 4) and the traffic flow is high (120 vehicles/h), the sound level of the traffic congestion case may be slightly lower than that of no congestion case. Again, in many cases of Figure 9a–f, the L10 values are identical because the sound levels exceeded for 10% of the time are also identical. From these results, it is seen that if the sound level of a vehicle is higher, the effects of stop time and traffic flow play more important roles.
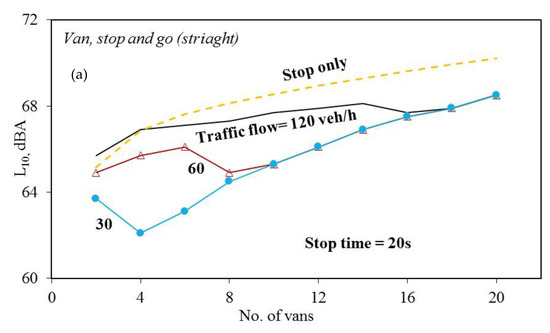

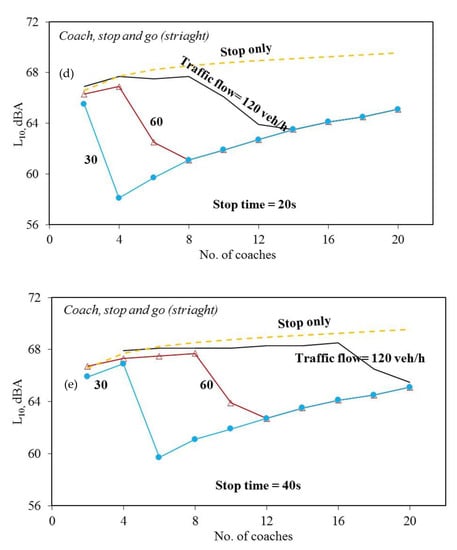
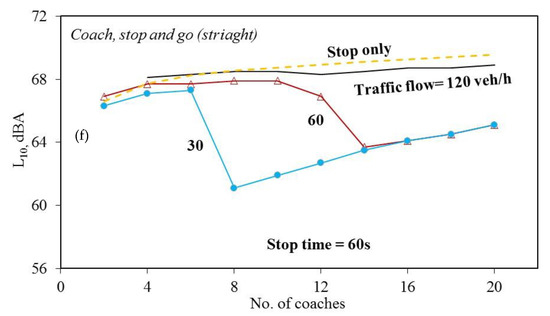
Figure 9.
A comparison of average sound pressure levels (L10) passing through the measurement points for various traffic flows. (a) Van, stop time = 20s; (b) Van, stop time = 40s; (c) Van, stop time = 60s; (d) Coach, stop time = 20s; (e) Coach, stop time = 40s; (f) Coach, stop time = 60s.
4. Conclusions
The present work investigates the impact of traffic signal settings on the noise level of moving vehicles. The raw research data was obtained from the site measurements. Two types of vehicles (van and coach) were selected to study the noise levels produced from various traffic flow conditions and scenarios (“stop and go” and “non-stop”). Generally, the measurements of road traffic noise adopt the L10 noise level as an indicator, which is the level exceeded for 10% of the total time measurement. In the present study, it is found that if the sound level of a controlled vehicle is higher and the traffic flow is lower, the influence of the stop time of the signal system on the sound level is higher; and when the number of vehicles passing the measurement location is small and the traffic flow is high, the sound level of the traffic congestion case may be slightly lower than that of no congestion case.
The most important finding is that the sound level LAeq from a single vehicle at the “stop” mode is lower than those at the “deceleration” and “acceleration” modes, but increasing the “stop” duration would lead to a higher sound level L10. In the extreme case, the “stop” duration = infinity (i.e., traffic congestion). The sound level L10 would be the highest because all vehicles accumulate on road. On contrary, shortening the “stop” time would be a useful mean to alleviate the traffic noise pollution
Author Contributions
data curation, C.k.-W. and Y.y.-L.; formal analysis, C.W. and Y.y.-L.; investigation and supervision, C.W. and Y.y.-L.; methodology, C.W. and Y.y.-L.; writing and editing, C.W. and Y.y.-L. All authors have read and agreed to the published version of the manuscript.
Funding
This research received no external funding.
Conflicts of Interest
The authors declare no conflict of interest.
References
- Licitra, G.; Fredianelli, L.; Petri, D.; Vigotti, M.A. Annoyance evaluation due to overall railway noise and vibration in Pisa urban areas. Sci. Total. Env. 2016, 568, 1315–1325. [Google Scholar] [CrossRef] [PubMed]
- Bunn, F.; Zannin, P.H.T. Assessment of railway noise in an urban setting. Appl. Acoust. 2016, 104, 16–23. [Google Scholar] [CrossRef]
- Gagliardi, P.; Teti, L.; Licitra, G. A statistical evaluation on flight operational characteristics affecting aircraft noise during take-off. Appl. Acoust. 2018, 134, 8–15. [Google Scholar] [CrossRef]
- Iglesias-Merchan, C.; Balteiro, L.D.; Soliño, M. Transportation planning and quiet natural areas preservation: Aircraft overflights noise assessment in a National Park. Transp. Res. Part D Transp. Env. 2015, 41, 1–12. [Google Scholar] [CrossRef]
- Fredianelli, L.; Gallo, P.; Licitra, G.; Carpita, S. Analytical assessment of wind turbine noise impact at receiver by means of residual noise determination without the wind farm shutdown. Noise Control. Eng. J. 2017, 65, 417–433. [Google Scholar] [CrossRef]
- Michaud, D.; Feder, K.; Keith, S.; Voicescu, S.A.; Marro, L.; Than, J.; Guay, M.; Denning, A.; McGuire, D.; Bower, T.; et al. Exposure to wind turbine noise: Perceptual responses and reported health effects. J. Acoust. Soc. Am. 2016, 139, 1443–1454. [Google Scholar] [CrossRef]
- Bernardini, M.; Fredianelli, L.; Fidecaro, F.; Gagliardi, P.; Nastasi, M.; Licitra, G. Noise Assessment of Small Vessels for Action Planning in Canal Cities. Environments 2019, 6, 31. [Google Scholar] [CrossRef]
- Bolognese, M.; Fidecaro, F.; Palazzuoli, D.; Licitra, G. Port Noise and Complaints in the North Tyrrhenian Sea and Framework for Remediation. Environments 2020, 7, 17. [Google Scholar] [CrossRef]
- Fredianelli, L.; Nastasi, M.; Bernardini, M.; Fidecaro, F.; Licitra, G. Pass-by Characterization of Noise Emitted by Different Categories of Seagoing Ships in Ports. Sustainability 2020, 12, 1740. [Google Scholar] [CrossRef]
- Muzet, A. Environmental noise, sleep and health. Sleep Med. Rev. 2007, 11, 135–142. [Google Scholar] [CrossRef]
- Zacarías, F.F.; Hernández-Molina, R.; Ancela, J.L.C.; Lubián-López, P.; Alonso-Ojembarrena, A. Noise Exposure in Preterm Infants Treated with Respiratory Support Using Neonatal Helmets. Acta Acust. United Acust. 2013, 99, 590–597. [Google Scholar] [CrossRef]
- Licitra, G.; Gallo, P.; Rossi, E.; Brambilla, G. A novel method to determine multi-exposure priority indices tested for Pisa action plan. Appl. Acoust. 2011, 72, 505–510. [Google Scholar] [CrossRef]
- Bianco, F.; Fredianelli, L.; Castro, F.L.; Gagliardi, P.; Fidecaro, F.; Licitra, G. Stabilization of a p-u Sensor Mounted on a Vehicle for Measuring the Acoustic Impedance of Road Surfaces. Sensors 2020, 20, 1239. [Google Scholar] [CrossRef] [PubMed]
- Licitra, G.; Cerchiai, M.; Teti, L.; Ascari, E.; Bianco, F.; Chetoni, M. Performance Assessment of Low-Noise Road Surfaces in the Leopoldo Project: Comparison and Validation of Different Measurement Methods. Coatings 2015, 5, 3–25. [Google Scholar] [CrossRef]
- Morley, D.; De Hoogh, K.; Fecht, D.; Fabbri, F.; Bell, M.; Goodman, P.; Elliott, P.; Hodgson, S.; Hansell, A.L.; Gulliver, J. International scale implementation of the CNOSSOS-EU road traffic noise prediction model for epidemiological studies. Env. Pollut. 2015, 206, 332–341. [Google Scholar] [CrossRef]
- Alejandro, R.P.; Diego, P.R.; Antonio, J.T.; Ángel, R.R. Selection of suitable alternatives to reduce the environmental impact of road traffic noise using a fuzzy multi-criteria decision model. Environ. Impact Assess. Rev. 2016, 8–18. [Google Scholar]
- Miedema, H.M.E.; Oudshoorn, C.G.M. Annoyance from transportation noise: Relationships with exposure metrics DNL and DENL and their confidence intervals. Env. Health Perspect. 2001, 109, 409–416. [Google Scholar] [CrossRef]
- Cueto, J.L.; Petrovici, A.M.; Hernández, R.; Fernández, F. Analysis of the Impact of Bus Signal Priority on Urban Noise. Acta Acust. United Acust. 2017, 103, 561–573. [Google Scholar] [CrossRef]
- Dratva, J.; Phuleria, H.C.; Foraster, M.; Gaspoz, J.-M.; Keidel, D.; Künzli, N.; Liu, L.-J.S.; Pons, M.; Zemp, E.; Gerbase, M.W.; et al. Transportation Noise and Blood Pressure in a Population-Based Sample of Adults. Env. Heal. Perspect. 2011, 120, 50–55. [Google Scholar] [CrossRef]
- Babisch, W.; Beule, B.; Schust, M.; Kersten, N.; Ising, H. Traffic Noise and Risk of Myocardial Infarction. Epidemiology 2005, 16, 33–40. [Google Scholar] [CrossRef]
- The Annual Traffic Census; Transport Department of the HKSAR Government: Hong Kong, China, 2015.
- Hong Kong: The Facts-Highways; Highway Department of the HKSAR Government: Hong Kong, China, 2016.
- De Coensel, B.; Can, A.; Degraeuwe, B.; De Vlieger, I.; Botteldooren, D. Effects of traffic signal coordination on noise and air pollutant emissions. Env. Model. Softw. 2012, 35, 74–83. [Google Scholar] [CrossRef]
- Stoilova, K.; Stoilov, T. Traffic noise and traffic light control. Transp. Res. Part D: Transp. Env. 1998, 3, 399–417. [Google Scholar] [CrossRef]
- Maruyama, M.; Kuno, K.; Sone, T. New Mathematical Model to Estimate Road Traffic Noise in View of the Appearance Rate of Heavy Vehicles. Int. J. Acoust. Vib. 2011, 16. [Google Scholar] [CrossRef]
- Ikuta, A.; Orimoto, H.; Siddique, N.H.; Maguire, L.P. Statistical Evaluation of Complex Sound Environment with Background Noise. Int. J. Acoust. Vib. 2015, 20. [Google Scholar] [CrossRef]
- Gille, L.-A.; Marquis-Favre, C.; Klein, A.; Laure-Anne, G.; Catherine, M.-F.; Achim, K. Noise Annoyance Due To Urban Road Traffic with Powered-Two-Wheelers: Quiet Periods, Order and Number of Vehicles. Acta Acust. United Acust. 2016, 102, 474–487. [Google Scholar] [CrossRef]
- Tang, S.; Tong, K. Estimating traffic noise for inclined roads with freely flowing traffic. Appl. Acoust. 2004, 65, 171–181. [Google Scholar] [CrossRef]
- Cho, D.S.; Mun, S. Development of a highway traffic noise prediction model that considers various road surface types. Appl. Acoust. 2008, 69, 1120–1128. [Google Scholar] [CrossRef]
- Lam, K.-C.; Ma, W.-C. Road traffic noise exposure in residential complexes built at different times between 1950 and 2000 in Hong Kong. Appl. Acoust. 2012, 73, 1112–1120. [Google Scholar] [CrossRef]
- Han, K.; Gayah, V.V. Continuum signalized junction model for dynamic traffic networks: Offset, spillback, and multiple signal phases. Transp. Res. Part B Methodol. 2015, 77, 213–239. [Google Scholar] [CrossRef]
- Li, P.; Mirchandani, P.B.; Zhou, X. Solving simultaneous route guidance and traffic signal optimization problem using space-phase-time hypernetwork. Transp. Res. Part B Methodol. 2015, 81, 103–130. [Google Scholar] [CrossRef]
© 2020 by the authors. Licensee MDPI, Basel, Switzerland. This article is an open access article distributed under the terms and conditions of the Creative Commons Attribution (CC BY) license (http://creativecommons.org/licenses/by/4.0/).