Article

A Room Monitoring System Using Deep Learning and Perspective Correction Techniques

1
Department of Information Engineering and Computer Science, Feng Chia University, Taichung 40724, Taiwan
2
Department of Architecture, National Cheng Kung University, Tainan 701, Taiwan
3
Department of Transportation Science, National Taiwan Ocean University, Keelung 20224, Taiwan
*
Author to whom correspondence should be addressed.
Appl. Sci. 2020, 10(13), 4423; https://doi.org/10.3390/app10134423
Submission received: 20 May 2020 / Revised: 22 June 2020 / Accepted: 23 June 2020 / Published: 27 June 2020
(This article belongs to the Special Issue Artificial Intelligence in Smart Buildings)

Abstract

:
Studies on room monitoring have only focused on objects in a singular and uniform posture or low-density groups. Considering the wide use of convolutional neural networks for object detection, especially person detection, we use deep learning and perspective correction techniques to propose a room monitoring system that can detect persons with different motion states, high-density groups, and small-sized persons owing to the distance from the camera. This system uses consecutive frames from the monitoring camera as input images. Two approaches are used: perspective correction and person detection. First, perspective correction is used to transform an input image into a 2D top-view image. This allows users to observe the system more easily with different views (2D and 3D views). Second, the proposed person detection scheme combines the Mask region-based convolutional neural network (R-CNN) scheme and the tile technique for person detection, especially for detecting small-sized persons. All results are stored in a cloud database. Moreover, new person coordinates in 2D images are generated from the final bounding boxes and heat maps are created according to the 2D images; these enable users to examine the system quickly in different views. Additionally, a system prototype is developed to demonstrate the feasibility of the proposed system. Experimental results prove that our proposed system outperforms existing schemes in terms of accuracy, mean absolute error (MAE), and root mean squared error (RMSE).

1. Introduction

Smart sustainable cities use multiple technologies to increase people’s comfort levels. Therefore, this concept has attracted many governments’ interest, and many studies have explored the methods of improving the performance of Internet of Things (IoT) applications. Our proposed system aims to realize next-level IoT applications to help society achieve enhanced health care, energy systems, education systems, and transportation and water services. For instance, room monitoring systems can reduce energy consumption by controlling the ambient temperature, lighting, and water consumption [1]. Monitoring systems can also be used to detect unauthorized intrusions and signs of attempted burglaries. The study of user behavior analysis has attracted considerable attention. For example, users’ flow can be analyzed to determine hot areas in a room to more efficiently control and manage the system performance.
Over the years, many indoor monitoring systems have been proposed for people counting [2,3,4]. However, these systems work with entrances/exits through a door without completely addressing situations such as crowds of people, small-sized people, or whole-room monitoring. Nogueira et al. [5] presented an approach to people counting in retail stores. They detected hot spots through foreground/background detection. However, they did not display people’s positions.
Traditional target detection methods are mainly based on manual feature extraction. Recently, deep learning has been introduced for end-to-end learning (feature learning and classifier) to perform this process through an iterative architecture. Deep learning techniques are based on convolutional neural networks (CNNs); these are trained and not programmed, and therefore, they require less formal statistical training. Deep learning has enabled higher accuracy in computer vision tasks such as semantic segmentation and object detection. Deep learning has broad applications in many research fields, and it has demonstrated high accuracy in many tasks, such as object detection [6]. In addition, with advances in CNN architectures, new object detection methods with higher accuracy have been proposed. However, although most studies have focused on various approaches using CNN models, the applications of these approaches to specific problems have not attracted much interest [5].
Therefore, this study proposes a room monitoring system using deep learning and perspective correction techniques. The input images used in this system are captured in successive frames. Then, two approaches are used: perspective correction and person detection. First, we transform an input image into a 2D top-view image by using perspective correction; this enables users to explore the system in two different views. Second, we perform person detection using a scheme that includes a Mask region-based convolutional neural network (R-CNN) scheme and a tile technique. Third, we store all results in a cloud database. Ultimately, we use the final bounding boxes to create new person coordinates in 2D images and construct heat maps based on the 2D images for greater efficiency. The system we have implemented is already available online. It is a small cloud-based proof of concept (POC) and has not yet to be implemented at a medium or large-scale. However, through continuous improvement, two video cameras have been able to connect to the back-end platform for processing. The two image sources are explained as follows: The first image source is from the camera manufacturer that provides an ftp client environment. It can automatically return one image every second to the ftp server we set up, which can be easily integrated in the system; the second image source is to use the browser to view the image. It can only be used as a general image monitor and does not provide an interface that allows us to set up and return the image data. We write a python automation program for the traditional web monitoring system. Under the environment of Windows 7 (virtual machine), it automatically captures the full screen every 10 s and returns the images to the back end.
The main contributions of this paper are as follows.
  • We proposed a room monitoring system using deep learning and perspective correction techniques.
  • We proposed a new person detection scheme that combines the Mask R-CNN scheme and tile technique.
  • We compared and evaluated the proposed scheme and system to verify their feasibility and efficiency.
The remainder of this paper is organized as follows. Section 2 reviews related works. Section 3 describes the design and architecture of the proposed system. Section 4 explains the implementation of a prototype. Section 5 presents the experimental results. Finally, Section 6 presents the conclusions and discusses future research directions.

2. Related Work

2.1. Perspective Correction

Perspective distortion is caused by the perspective projection of a 3D scene onto a 2D surface image. Correction of image distortion is an important research topic in computer vision. A primary method for image perspective correction is based on the homography transformation. This method aims to determine a transformation matrix (size 3 × 3 ) that is calculated based on four points of correspondences between two images [7,8]. Then, this transformation matrix is used to perform perspective correction. The advantages of this method are its simple and easy implementation. Suran et al. [9] presented a perspective correction method for distorted quick response (QR) code images. They combined Harris corner detection and a convex hull algorithm to obtain a bounding box for a distorted QR code image and its four vertex coordinates and then used perspective collineation to correct the skewness of the QR code image. Li et al. [10] proposed another correction algorithm for QR codes on a cylindrical surface. First, they used a morphological algorithm and geometry calculations to extract the boundary of the QR code on the cylinder. Then, they determined the features and standard size of the QR code. Finally, they corrected the image using perspective projection. Santana-Cedrés et al. [11] introduced a new method that addresses perspective and optical distortions. They extracted the distorted lines in the image to estimate a lens distortion model and then used these distorted lines, which were later corrected using a lens distortion model, to estimate the vanishing points. Finally, they corrected the perspective distortion using these vanishing points.
Neural-network-based methods have also been widely applied in computer vision. For example, Yang et al. [12] proposed a neural-network-based method for fisheye distortion correction. Their network used bidirectional loss with a geometric prior. Unlike other methods that exploit the entire image without any attention mechanism, their method can correct the fisheye image more accurately and produce high-quality corrected images. Rong et al. [13] presented a new approach of radial distortion correction by using CNNs. First, they estimated distortion parameters on the images, and then they corrected the distorted images. Furthermore, two score functions were introduced for evaluating the effect of correction. Yin et al. [14] proposed a CNN-based method for removing distortions from single fisheye images. This method estimated the distortion parameters by learning high-level semantics and low-level appearance features simultaneously. In the proposed network architecture, they designed a distortion rectification layer to perform correction on both the input fisheye image and corresponding scene parsing results. Lőrincz et al. [15] presented a single view distortion correction method by using semantic guidance. This method corrected images containing arbitrarily complex distortions. The proposed model contains three main compositions: the core network, the semantic segmentation network, and the spatial transformer module. Semantic information is used to augment various tasks, such as rectification and segmentation. Liao et al. [16] described a distortion rectification generative adversarial network (DR-GAN). This method automatically implemented radial distortion rectification without any handcrafted features detection. They demonstrated the proposed method was extremely fast by using one-stage rectification.

2.2. Object Detection

Object detection is an essential and challenging task in computer vision, and it has been extensively explored for various applications including monitoring and security systems, video surveillance, self-driving cars, and human–computer interaction. Owing to recent advances in deep learning and CNN architectures, CNNs are being widely used in object detection, especially person detection. This has led to the development of many new and high-accuracy object detection methods, such as Faster R-CNN [17], SSD [18], YOLO v3 [19], RetinaNet [20], and Mask R-CNN [21].
R-CNN based object detection is one of the primary object detectors. Girshick et al. [22] proposed the original R-CNN method. They used a selective search algorithm to extract around 2000 region proposals from each input image. Then, these region proposals were utilized to compute features by using a large CNN. Finally, the class-specific linear support vector machines (SVMs) were applied to classify each region. This method that allowed high-capacity CNNs was applied to localize and segment objects. However, it could not be performed in real-time. To solve the drawbacks of the R-CNN method, Girshick [23] proposed a Fast R-CNN method to build a faster object detection algorithm. This method improved training and testing speed and increased detection accuracy. Ren et al. [17] presented a Faster R-CNN method for real-time object detection. They introduced Region Proposal Networks (RPNs) to generate efficiently and accurately region proposal. Furthermore, the learned RPN improved region proposal quality and overall object detection accuracy. He et al. [21] proposed a Mask R-CNN method for object detection and object instance segmentation in the image. This method extended Faster R-CNN by adding a branch for predicting an object mask in parallel with the existing branch for bounding box recognition. Moreover, Mask R-CNN is easy to implement and can be trained with a broad range of flexible architecture designs.
Recently, small object detection has attracted considerable attention. Plastiras et al. [24] proposed a small object detection method using selective tile processing. Here, tiles refer to small patches extracted from the input image. They also introduced attention and memory mechanisms for using tiles efficiently. Růžička and Franchetti [25] presented an attention pipeline method to detect small objects in high-resolution 4K and 8K videos. This method includes a two-stage evaluation of each image or video frame under rough and refined resolution. The YOLO v2 model was used to detect objects. Unel et al. [26] proposed an efficient solution for small object detection in high-resolution images. They detected pedestrians and vehicles using a camera onboard a micro aerial vehicle. Additionally, they introduced a tiling-based approach to limit detail loss in object detection. They also showed that their method increases the small object detection accuracy significantly. Wang et al. [27] demonstrated scale-aware rotated object detection in aerial imagery. They proposed a novel feature fusion module and a new weighted loss to detect small objects in remote sensing images.

2.3. Room Monitoring System

Smart sustainable cities are becoming popular worldwide, and therefore, their realization has attracted considerable research interest. Some studies have focused on monitoring the environment of a room, including the indoor temperature, relative humidity, and indoor air quality [28,29,30]. Studies have also investigated monitoring people in a room. For example, Tariq et al. [1] introduced an indoor human localization system based on a capacitive sensor. They set up this system in a 3 m × 3 m room and then compared the localization performance of most machine learning classification algorithms in the Weka collection. Setiawan et al. [2] proposed a room monitoring system that uses a webcam to detect people’s movements. This system has additional features such as alarms, alerts, message warnings, and email reports. Mahamad et al. [3] introduced a cloud-based people counter using an embedded system based on Raspberry Pi that delivered the obtained data to ThingSpeak and an IoT platform. They used a Pi camera to monitor people’s movement and then processed the video footage to count people. Basalamah et al. [31] proposed a scale-driven CNN model for people counting and localization in crowd scenes. They created scale-aware head region proposals by using perspective information to address scale variations.
In schools, computer vision techniques have been widely used for classroom monitoring systems. For example, Anh et al. [32] presented a system based on computer vision to monitor student behavior in the classroom. First, the system recorded entire students’ behavior. Then, data processing was implemented by using several computer vision techniques, such as face detection, facial landmark detection, face embedding, face classification, and gaze estimation. Finally, the results were stored in the database. Furthermore, they built a web application for assisting the teachers with monitoring student behavior. Jiang et al. [33] proposed a classroom concentration model to support teachers and experts in teaching analysis. They built the CNN models for head detection and head pose estimation. Then a concentration model was implemented to analyze the concentration situation of students. Matilda and Shahin [34] presented a monitoring system for checking student attendance. The system captured the images from the surveillance cameras of the classrooms. Next, the face recognition method was used to detect student attendance. These results would be sent to the teachers.

3. The Model of Room Monitoring System

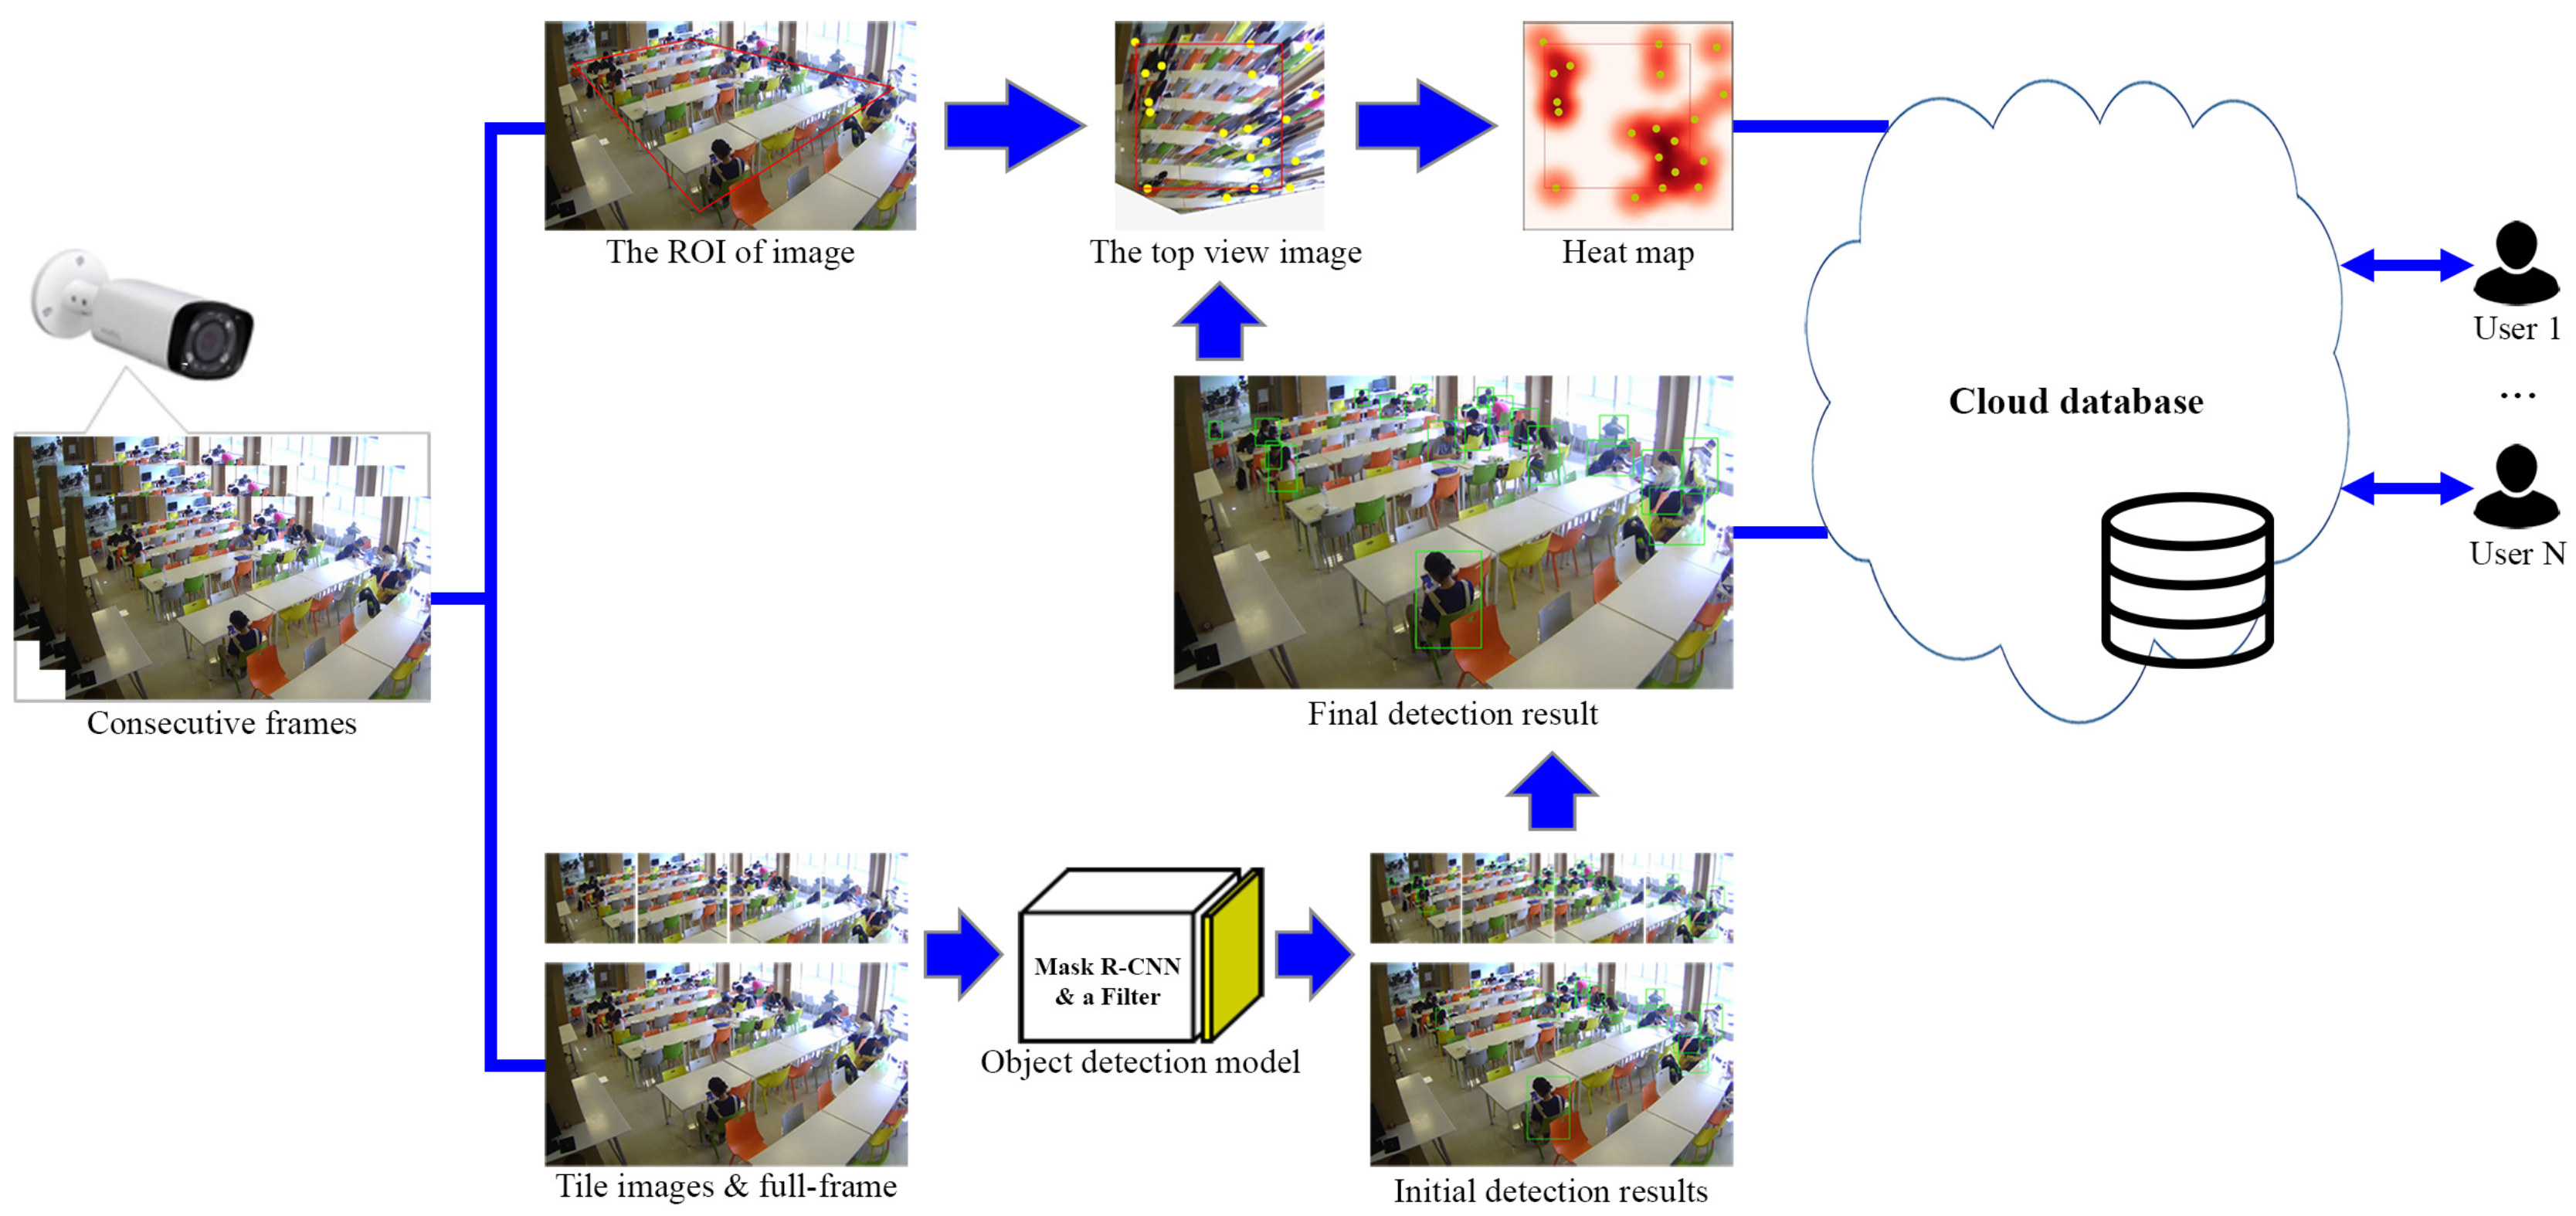
3.1. System Architecture

Figure 1 presents an overview of the proposed system. This Figure 1 presents an overview of the proposed system. This system uses consecutive video frames captured using a monitoring camera as the input images. This system involves two main processes: perspective correction and person detection.
In the first process, perspective correction is used to transform an input image into a 2D top-view image to produce a perspective transform matrix. This approach enables users to use the system more efficiently. The second process is person detection. We propose a new person detection scheme that combines the Mask R-CNN scheme and tile technique. Our scheme achieves excellent performance, especially for small-sized people who are far from the camera. A copy of the input image is generated to implement person detection. The objects in the upper part of the image look small owing to their distance from the camera. Therefore, only that part of the image is extracted to create tile images of identical size. Next, the Mask R-CNN is used to detect objects on each tile image and the full-frame image. We also add a filter that helps obtain objects from the person class in the output layer. After initial detection using the Mask R-CNN, the bounding boxes for each tile image and the full-size images are collected as the initial results. Finally, the initial results are merged using our proposed scheme to generate a final detection result, which is stored in a cloud database. Moreover, we use the bounding boxes in the final result to calculate the coordinates of persons; these are then transformed into new person coordinates in 2D images by using the perspective transform matrix. Therefore, the system can be observed quickly in different views.

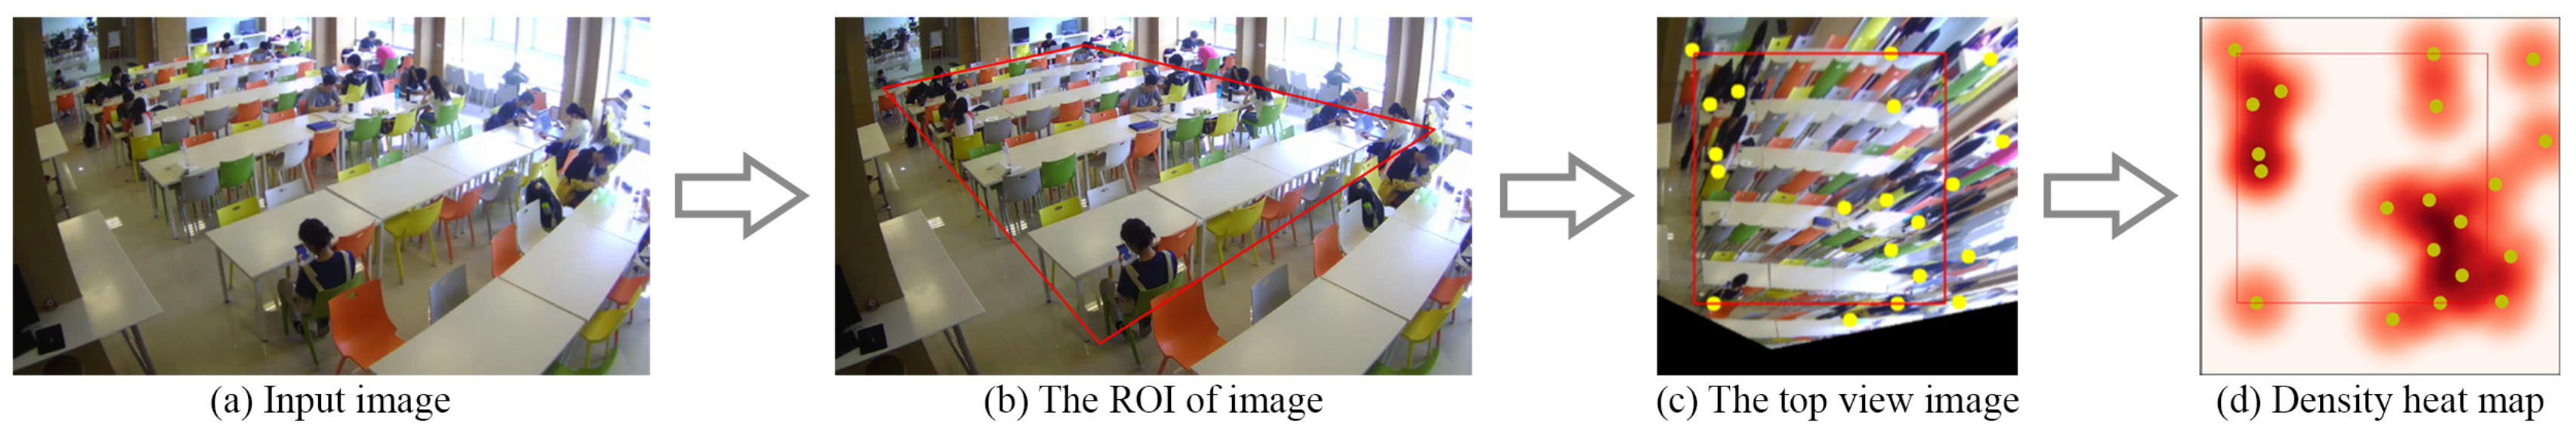
3.2. Perspective Correction Technique

Owing to the camera angle, some difficulties may occur in counting the number of people in the image, especially small-sized ones or a crowd. To solve this issue, we use a perspective correction technique to transform the input image into a 2D top-view image. Furthermore, many studies applied the perspective correction technique [35,36,37,38] owing to its advantage of easy implementation. Figure 2 shows the process of this technique.
The input images are consecutive frames of a video captured by the monitoring camera. To obtain a perspective transform, four pairs of corresponding points in the source and destination images must be determined. In this situation, the source image is the input image, and the destination image is the top-view image. These four points form a quadrangular area called the region of interest (ROI) of the input image, as shown in Figure 2b. The function calculates the 3 × 3 matrix of a perspective transform [39], as described in Equation (1). Here, ( x i , y i ) are coordinates of the quadrangle vertices in the input image, and ( x i , y i ) are coordinates of the corresponding quadrangle vertices in the top-view image. i ranges from 0 to 3. After we obtain the perspective transform matrix, we can quickly transform the input image to the top-view image, which is shown in Figure 2c. The transformation function is described in Equation (2). Next, we calculate the density of people and create a density heat map using a kernel density estimation (KDE) algorithm [40]. KDE is one of the most popular approaches to estimate the underlying probability density function of a dataset. To estimate a density at a location, we construct a probability density function. In this function, KDE shape is an essential factor. This study uses a quartic kernel shape and the heat map result is shown in Figure 2d. The yellow point denotes a person in this figure. Therefore, users can easily observe and analyze hot areas in the room.
t i x i t i y i t i = M 11 M 12 M 13 M 21 M 22 M 23 M 31 M 32 M 33 × x i y i 1
x y = M 11 x + M 12 y + M 13 M 31 x + M 32 y + M 33 , M 21 x + M 22 y + M 23 M 31 x + M 32 y + M 33

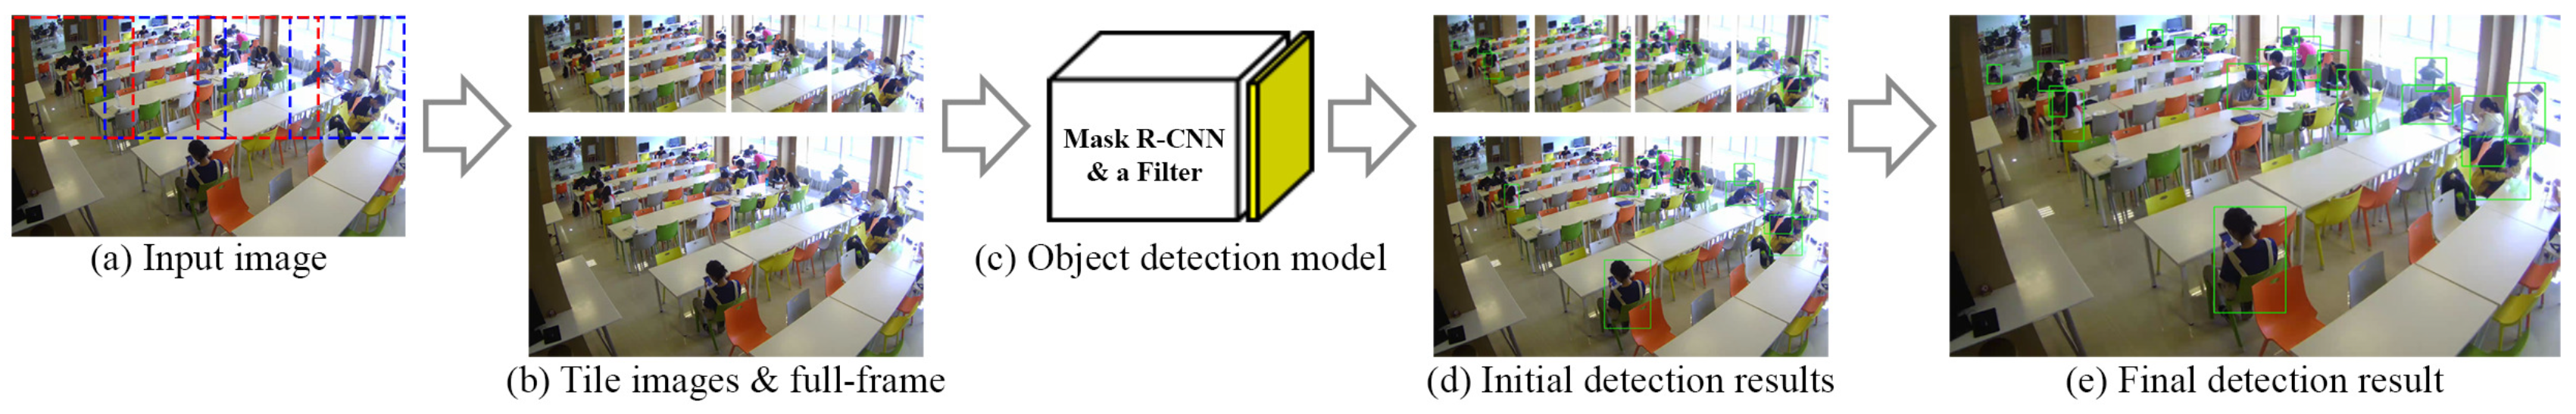
3.3. Proposed Person Detection Scheme

This section presents the proposed person detection scheme that combines the Mask R-CNN scheme and tile technique. This scheme includes three main steps. First, the tile images of identical size are generated from the upper part of the input image. Second, the object detection and filtration are implemented on each tile image and the full-frame image. The resulting bounding boxes are collected as the initial results. Finally, the initial results are merged according to the intersection of bounding boxes to get the final results. Algorithms 1 and 2 are proposed for merging bounding boxes. Furthermore, we also introduce a new concept in the merging process. Figure 3 details the process of this scheme.

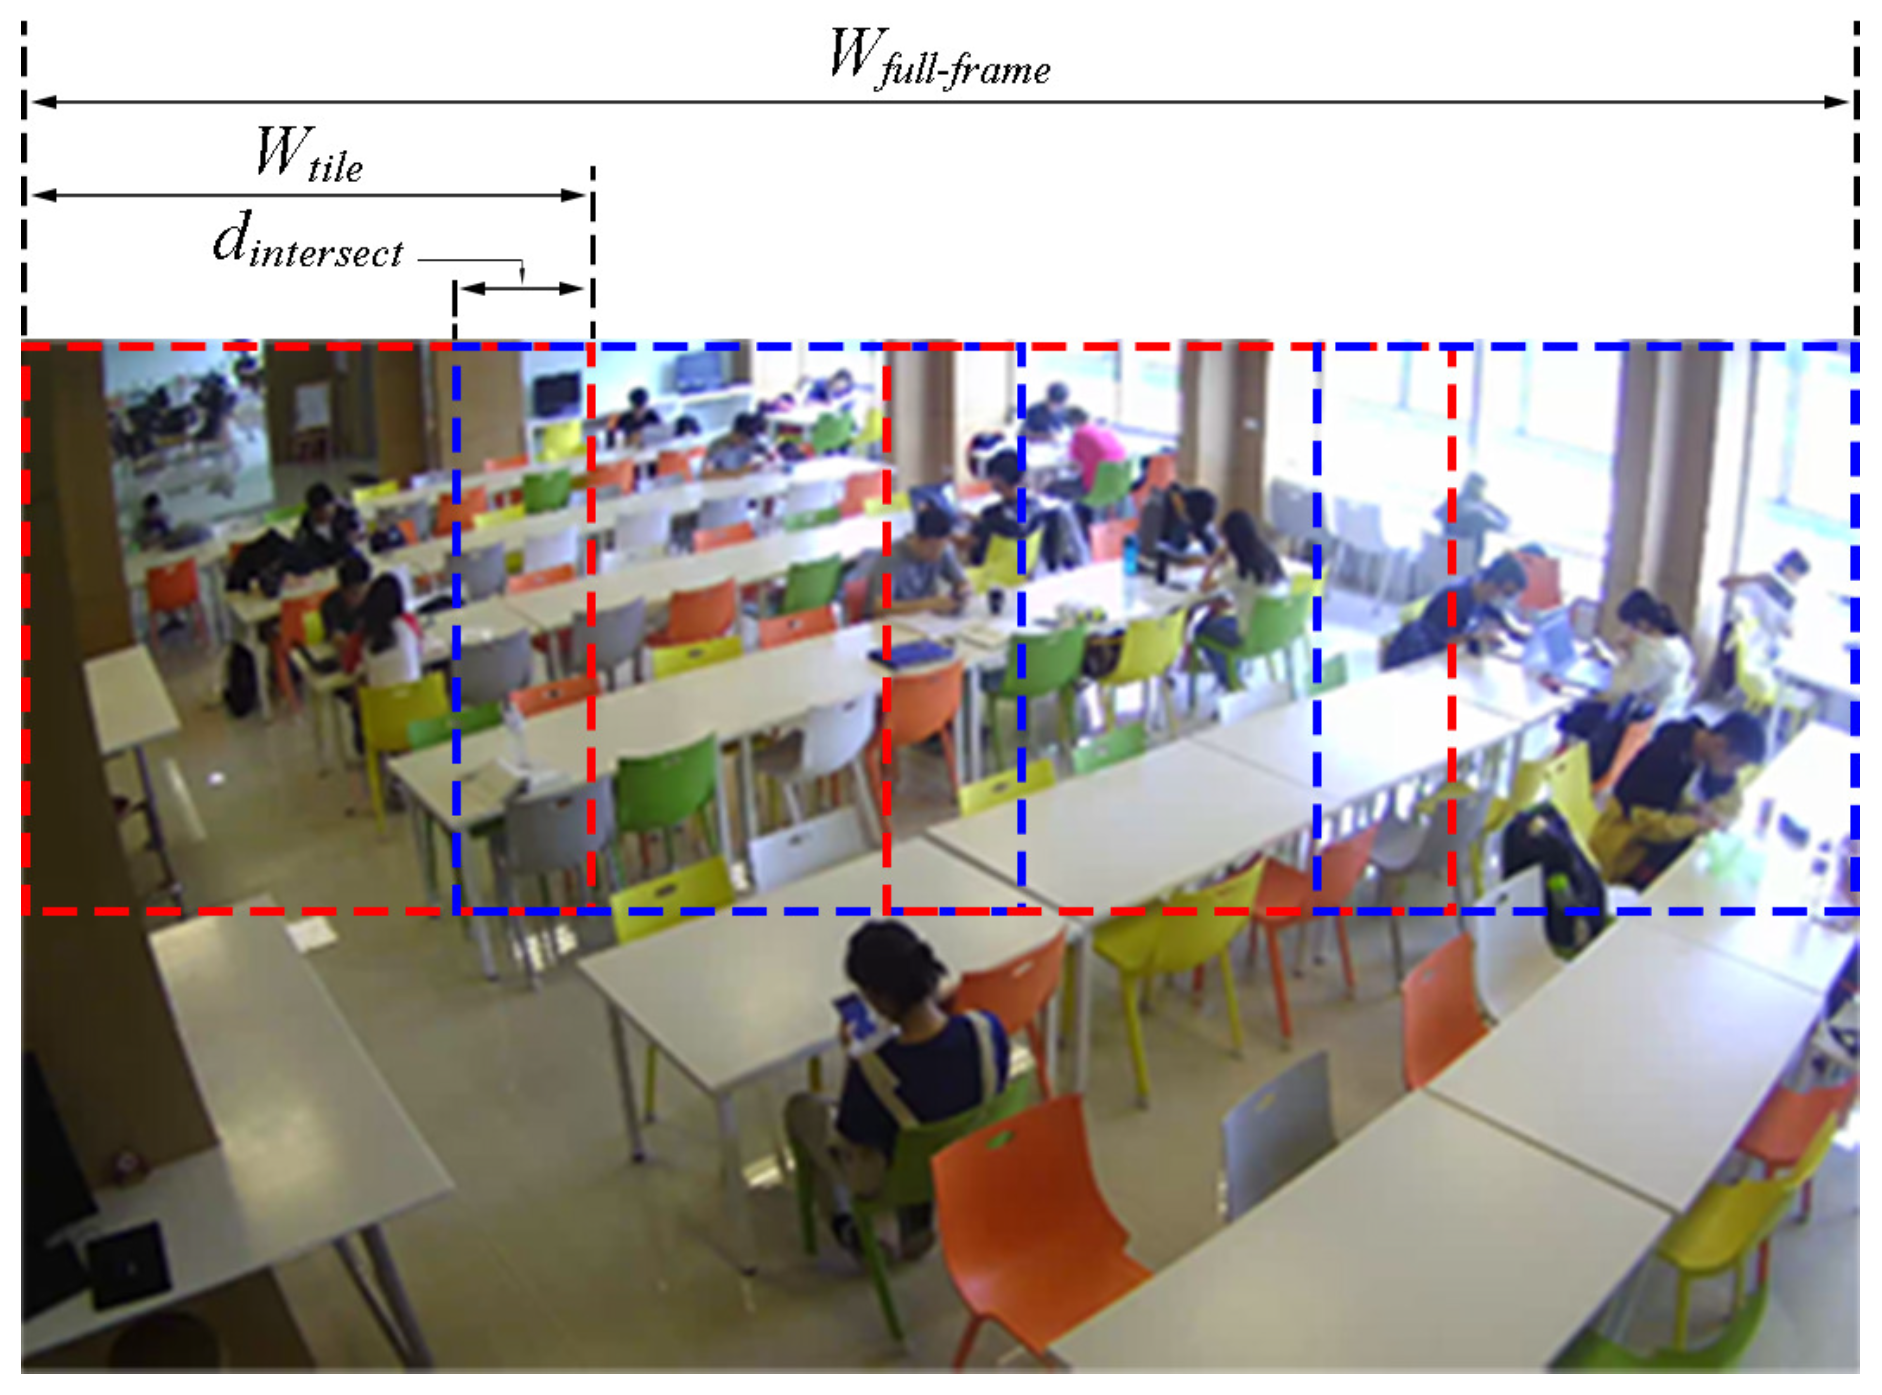
3.3.1. Tile Division

First, we discuss the approach to calculating and generating tile images. A copy of a full-frame image is generated to create tile images; only the upper part of the copied image is used owing to the higher frequency of small-sized persons appearing in this area. We divide the used image into several equal-sized subimages with a fixed portion of overlapping area on either side or both sides, as shown in Figure 3a. The number of tiles is calculated as in Equation (3). Here, n is the number of tile images; W f u l l f r a m e , the width of the full-frame image; W t i l e , the width of the tile image; and d i n t e r s e c t , the width of the overlapping areas of neighboring tile images, as shown in Figure 4. The resulting tile images are shown in Figure 3b.
n = m i f l × m + d i n t e r s e c t W f u l l f r a m e m + 1 i f l × m + d i n t e r s e c t > W f u l l f r a m e w h e r e :   m = W f u l l f r a m e l ;   l = W t i l e d i n t e r s e c t

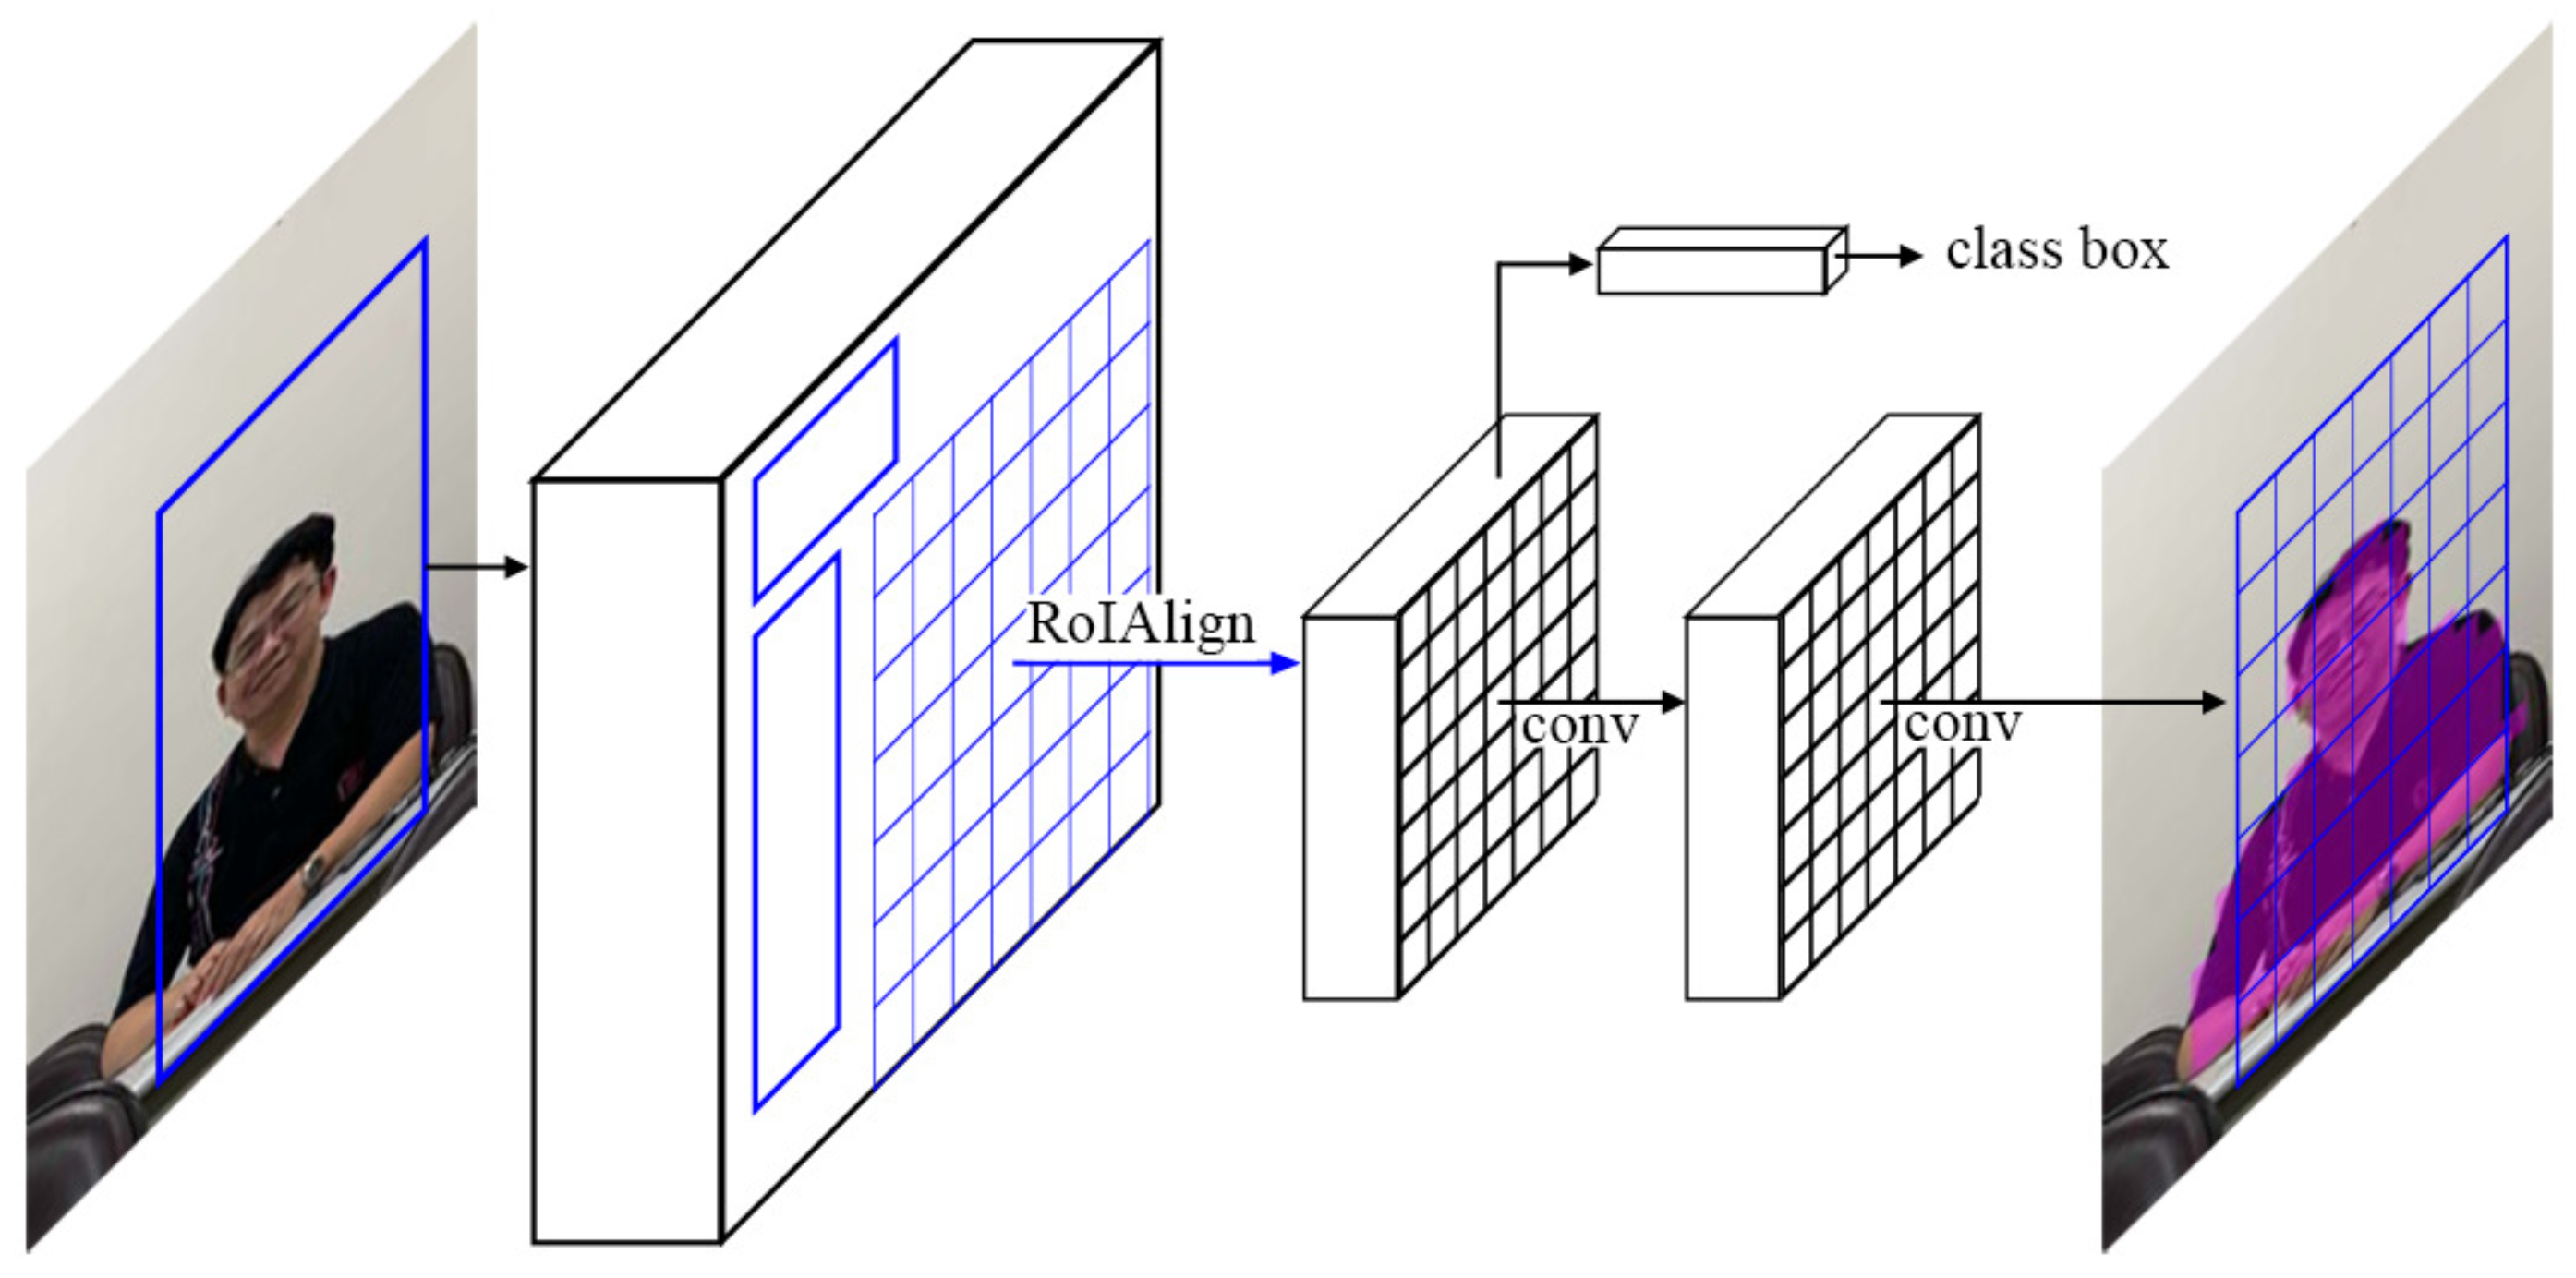
3.3.2. Object Detection and a Person Class Filter

This section presents the object detection and the person class filter on each tile image and the full-frame one. We apply the Mask R-CNN scheme to detect objects on each tile image as well as the full-frame one. Additionally, a filter that aims to obtain objects from the person class is used in the output layer. After initial detection in the tile images and full-frame image, the bounding boxes in all images are merged to output a final detection image, as described in the next section.
The Mask R-CNN scheme proposed by He et al. [21] aims to generate bounding boxes and object instance segmentation in the image. Figure 5 shows a Mask R-CNN framework for instance segmentation. Basically, the Mask R-CNN scheme can be implemented with different. Therefore, this study uses a Mask R-CNN scheme based on ResNet-101-FPN [41], including a feature pyramid network (FPN) [42] and a ResNet-101 [43] backbone.
The Mask R-CNN model trained on the COCO dataset [44] has the capacity to detect 80 object classes, including a boat, cat, stop sign, person, and truck. Only persons are considered in this study; therefore, we use a filter in the output layer to obtain objects belonging to the person class [6], as shown in Figure 3c.

3.3.3. Merging of the Bounding Boxes

We merge the bounding boxes in the initial results to obtain the final result, which is implemented in two phases. In the first phase, we merge each tile image in the initial results to obtain so-called intermediate results and focus on the bounding boxes in the overlapping areas of neighboring tile images. In the second phase, we merge the intermediate results with the bounding boxes of the full-frame image to generate the final results. Two important concepts are used in the merging process: intersection over union (IoU) and the proposed belong to areas (BTA). IoU is a widely used metric that indicates the similarity of two arbitrary shapes, and it also represents the accuracy an object detector can achieve based on a certain dataset [45,46]. We propose a new BTA that also aims to evaluate the similarity of two random shapes. The specific formulas of IoU and BTA for comparing the similarity of two arbitrary shapes, a and B, are given by Equations (4) and (5), respectively.
I o U = A B A B
B T A = m a x A B A , A B B
Figure 6 shows an instance of an object residing on the border. The IoU and BTA values must be considered to merge the neighboring bounding boxes. In Figure 6a, IoU and BTA have average and acceptable values of 0.407 and 0.647, respectively. Therefore, these neighboring bounding boxes are considered to merge. In Figure 6b, IoU has a low value of 0.161; however, we still consider merging the neighboring bounding boxes in our proposed algorithm owing to the high BTA value of 0.934.
As mentioned above, in phase 1, the bounding boxes of each tile image must be merged to obtain a new set of bounding boxes, called intermediate results. For this purpose, we propose the new algorithm described in Algorithm 1.
Algorithm 1 Merging the bounding boxes of each tile image in the initial results
    1.   Input:    l i s t _ o v e r l a p = { b o x i j ( y 1 , x 1 , y 2 , x 2 ) , i = [ 0 , n 1 ] , j = [ 0 , m 1 ] }
                         l i s t _ b o x = { b o x i ( y 1 , x 1 , y 2 , x 2 ) , i = [ 0 , k 1 ] }
                         l i s t _ o v e r l a p l i s t _ b o x
                         n: number of tiles
                         m: number of boxes in overlapping areas of tile[i]
                         k: number of boxes of all tiles
    2.   Output: l i s t _ n e w _ b o x = { b o x i ( y 1 , x 1 , y 2 , x 2 ) , i = [ 0 , t 1 ] }
                         t: number of new boxes of all tiles
    3.   set t h r e s h o l d _ i o u
    4.    l i s t _ n e w _ b o x = l i s t _ b o x
    5.   for i in range(0, n-1):
    6.              n e w B o x =[]
    7.             for b o x in l i s t _ o v e r l a p [ i ] :
    8.                         i o u =0
    9.                        for n e x t B o x in l i s t _ o v e r l a p [ i + 1 ] :
    10.                                if i o u < c a l c u l a t e _ i o u ( b o x , n e x t B o x ) :
    11.                                            i o u = c a l c u l a t e _ i o u ( b o x , n e x t B o x )
    12.                                            m a x B o x = n e x t B o x
    13.                      if i o u > = t h r e s h o l d _ i o u :
    14.                                 n e w B o x = u n i o n ( b o x , m a x B o x )
    15.                                 l i s t _ n e w _ b o x . a p p e n d ( n e w B o x )
    16.                                 l i s t _ n e w _ b o x . r e m o v e ( b o x )
    17.                                 l i s t _ n e w _ b o x . r e m o v e ( m a x B o x )
    18.                      elif b o x [ 1 ] > = ( i + 1 ) × ( W t i l e d i n t e r s e c t ) :           # b o x [ 1 ] = x 1
    19.                                 l i s t _ n e w _ b o x . r e m o v e ( b o x )
    20.   return l i s t _ n e w _ b o x
  • Lines (1, 2) contain the input and output information of the algorithm. The input includes l i s t _ b o x and l i s t _ o v e r l a p . l i s t _ b o x contains the bounding boxes of all tile images, and l i s t _ o v e r l a p contains the bounding boxes in the overlap areas of all tile images. l i s t _ n e w _ b o x is the result returned by the algorithm. It includes the new bounding boxes, called intermediate results.
  • The parameters are set using Lines (3, 4). t h r e s h o l d _ i o u is a predefined threshold of IoU that is used to consider whether two neighboring bounding boxes are merged.
  • Lines (5–9) consider the neighboring bounding boxes in overlapping area of each tile image.
  • Lines (10–12) determine the coupled neighboring bounding boxes with the highest IoU value in overlapping areas. The function c a l c u l a t e _ i o u ( ) is used to calculate the IoU of two boxes, as shown in Equation (4).
  • Lines (13–17) show that if IoU value of the coupled neighboring bounding boxes is greater than the IoU threshold, these two coupled neighboring bounding boxes can be merged to create a new bounding box. l i s t _ n e w _ b o x adds the new bounding box and removes the coupled neighboring bounding boxes.
  • Lines (18–20) determine that the complete bounding boxes in the overlapping areas and their IoU values are less than the IoU threshold. l i s t _ n e w _ b o x removes these bounding boxes. This approach reduces false-positive detection. Finally, the program returns a list of new bounding boxes of tile images.
After collection of the intermediate results, the bounding boxes of intermediate results and the full-frame must be merged to obtain the final results. The steps are detailed in Algorithm 2.
Algorithm 2 Merging the bounding boxes of intermediate results and full-frame
    1.   Input:    l i s t _ t i l e _ b o x = { b o x i ( y 1 , x 1 , y 2 , x 2 ) , i = [ 0 , m 1 ] }
                         l i s t _ f u l l _ f r a m e = { b o x i ( y 1 , x 1 , y 2 , x 2 ) , i = [ 0 , k 1 ] }
                         m: number of boxes of tiles in intermediate results
                         k: number of boxes of full-frame
    2.   Output: l i s t _ f i n a l _ b o x = { b o x i ( y 1 , x 1 , y 2 , x 2 ) , i = [ 0 , t 1 ] }
                         t: number of final boxes
    3.   set t h r e s h o l d _ i o u
    4.   set t h r e s h o l d _ b t a
    5.    s t a t u s _ t i l e _ b o x =[]
    6.    s t a t u s _ f u l l _ f r a m e =[]
    7.    l i s t _ f i n a l _ b o x =[]
    8.   for ( i , b o x ) in enumerate( l i s t _ t i l e _ b o x ):
    9.              s t a t u s _ t i l e _ b o x [ i ] =True
    10. for ( i , b o x ) in enumerate( l i s t _ f u l l _ f r a m e ):
    11.            s t a t u s _ f u l l _ f r a m e [ i ] =True
    12.  n e w B o x =[]
    13. while t h r e s h o l d _ b t a > 0 :
    14.           for ( i , t i l e B o x ) in enumerate( l i s t _ t i l e _ b o x ):
    15.                      if s t a t u s _ t i l e _ b o x [ i ] ==False: continue
    16.                       i o u = 0
    17.                       b t a = 0
    18.                       m a x B o x = [ ]
    19.                      for ( j , f u l l B o x ) in enumerate( l i s t _ f u l l _ f r a m e ):
    20.                                  if s t a t u s _ f u l l _ f r a m e [ j ] ==False: continue
    21.                                  if i o u < c a l c u l a t e _ i o u ( t i l e B o x , f u l l B o x ) :
    22.                                              i o u = c a l c u l a t e _ i o u ( t i l e B o x , f u l l B o x )
    23.                                              m a x B o x _ I o U = f u l l B o x
    24.                                              i n d e x B o x _ I o U = j
    25.                                  if b t a < c a l c u l a t e _ b t a ( t i l e B o x , f u l l B o x ) :
    26.                                              b t a = c a l c u l a t e _ b t a ( t i l e B o x , f u l l B o x )
    27.                                              m a x B o x _ B T A = f u l l B o x
    28.                                              i n d e x B o x _ B T A = j
    29.                      if ( i o u > = t h r e s h o l d _ i o u ) :
    30.                                   n e w B o x = u n i o n ( t i l e B o x , m a x B o x _ I o U )
    31.                                   l i s t _ f i n a l _ b o x . a p p e n d ( n e w B o x )
    32.                                   s t a t u s _ t i l e _ b o x [ i ] =False
    33.                                   s t a t u s _ f u l l _ f r a m e [ i n d e x B o x _ I o U ] = False
    34.                      elif ( b t a > = t h r e s h o l d _ b t a ) :
    35.                                   n e w B o x = u n i o n ( t i l e B o x , m a x B o x _ B T A )
    36.                                   l i s t _ f i n a l _ b o x . a p p e n d ( n e w B o x )
    37.                                   s t a t u s _ t i l e _ b o x [ i ] =False
    38.                                   s t a t u s _ f u l l _ f r a m e [ i n d e x B o x _ B T A ] = False
    39.           for ( i , t i l e B o x ) in enumerate( l i s t _ t i l e _ b o x ):
    40.                      if s t a t u s _ t i l e _ b o x [ i ] ==False: continue
    41.                       i o u = 0
    42.                      for ( j , f u l l B o x ) in enumerate( l i s t _ f u l l _ f r a m e ):
    43.                                  if s t a t u s _ f u l l _ f r a m e [ j ] ==False: continue
    44.                                   i o u = c a l c u l a t e _ i o u ( t i l e B o x , f u l l B o x )
    45.                                  if i o u != 0: break
    46.                      if i o u == 0:
    47.                                   l i s t _ f i n a l _ b o x . a p p e n d ( t i l e B o x )
    48.                                   s t a t u s _ t i l e _ b o x [ i ] =False
    49.           for ( i , f u l l B o x ) in enumerate( l i s t _ f u l l _ f r a m e ):
    50.                      if s t a t u s _ f u l l _ f r a m e [ i ] ==False: continue
    51.                       i o u = 0
    52.                      for ( j , t i l e B o x ) in enumerate( l i s t _ t i l e _ b o x ):
    53.                                  if s t a t u s _ t i l e _ b o x [ j ] ==False: continue
    54.                                   i o u = c a l c u l a t e _ i o u ( t i l e B o x , f u l l B o x )
    55.                                  if i o u != 0: break
    56.                      if i o u == 0:
    57.                                   l i s t _ f i n a l _ b o x . a p p e n d ( f u l l B o x )
    58.                                   s t a t u s _ f u l l _ f r a m e [ i ] =False
    59.          t h r e s h o l d _ b t a = t h r e s h o l d _ b t a α
    60. return l i s t _ f i n a l _ b o x
  • Lines (1, 2) contain the input and output information of the algorithm. The input includes l i s t _ t i l e _ b o x and l i s t _ f u l l _ f r a m e . l i s t _ t i l e _ b o x contains the bounding boxes of intermediate results, and l i s t _ f u l l _ f r a m e contains the bounding boxes of the full-frame. l i s t _ f i n a l _ b o x is the result returned by the algorithm. It includes the final bounding boxes.
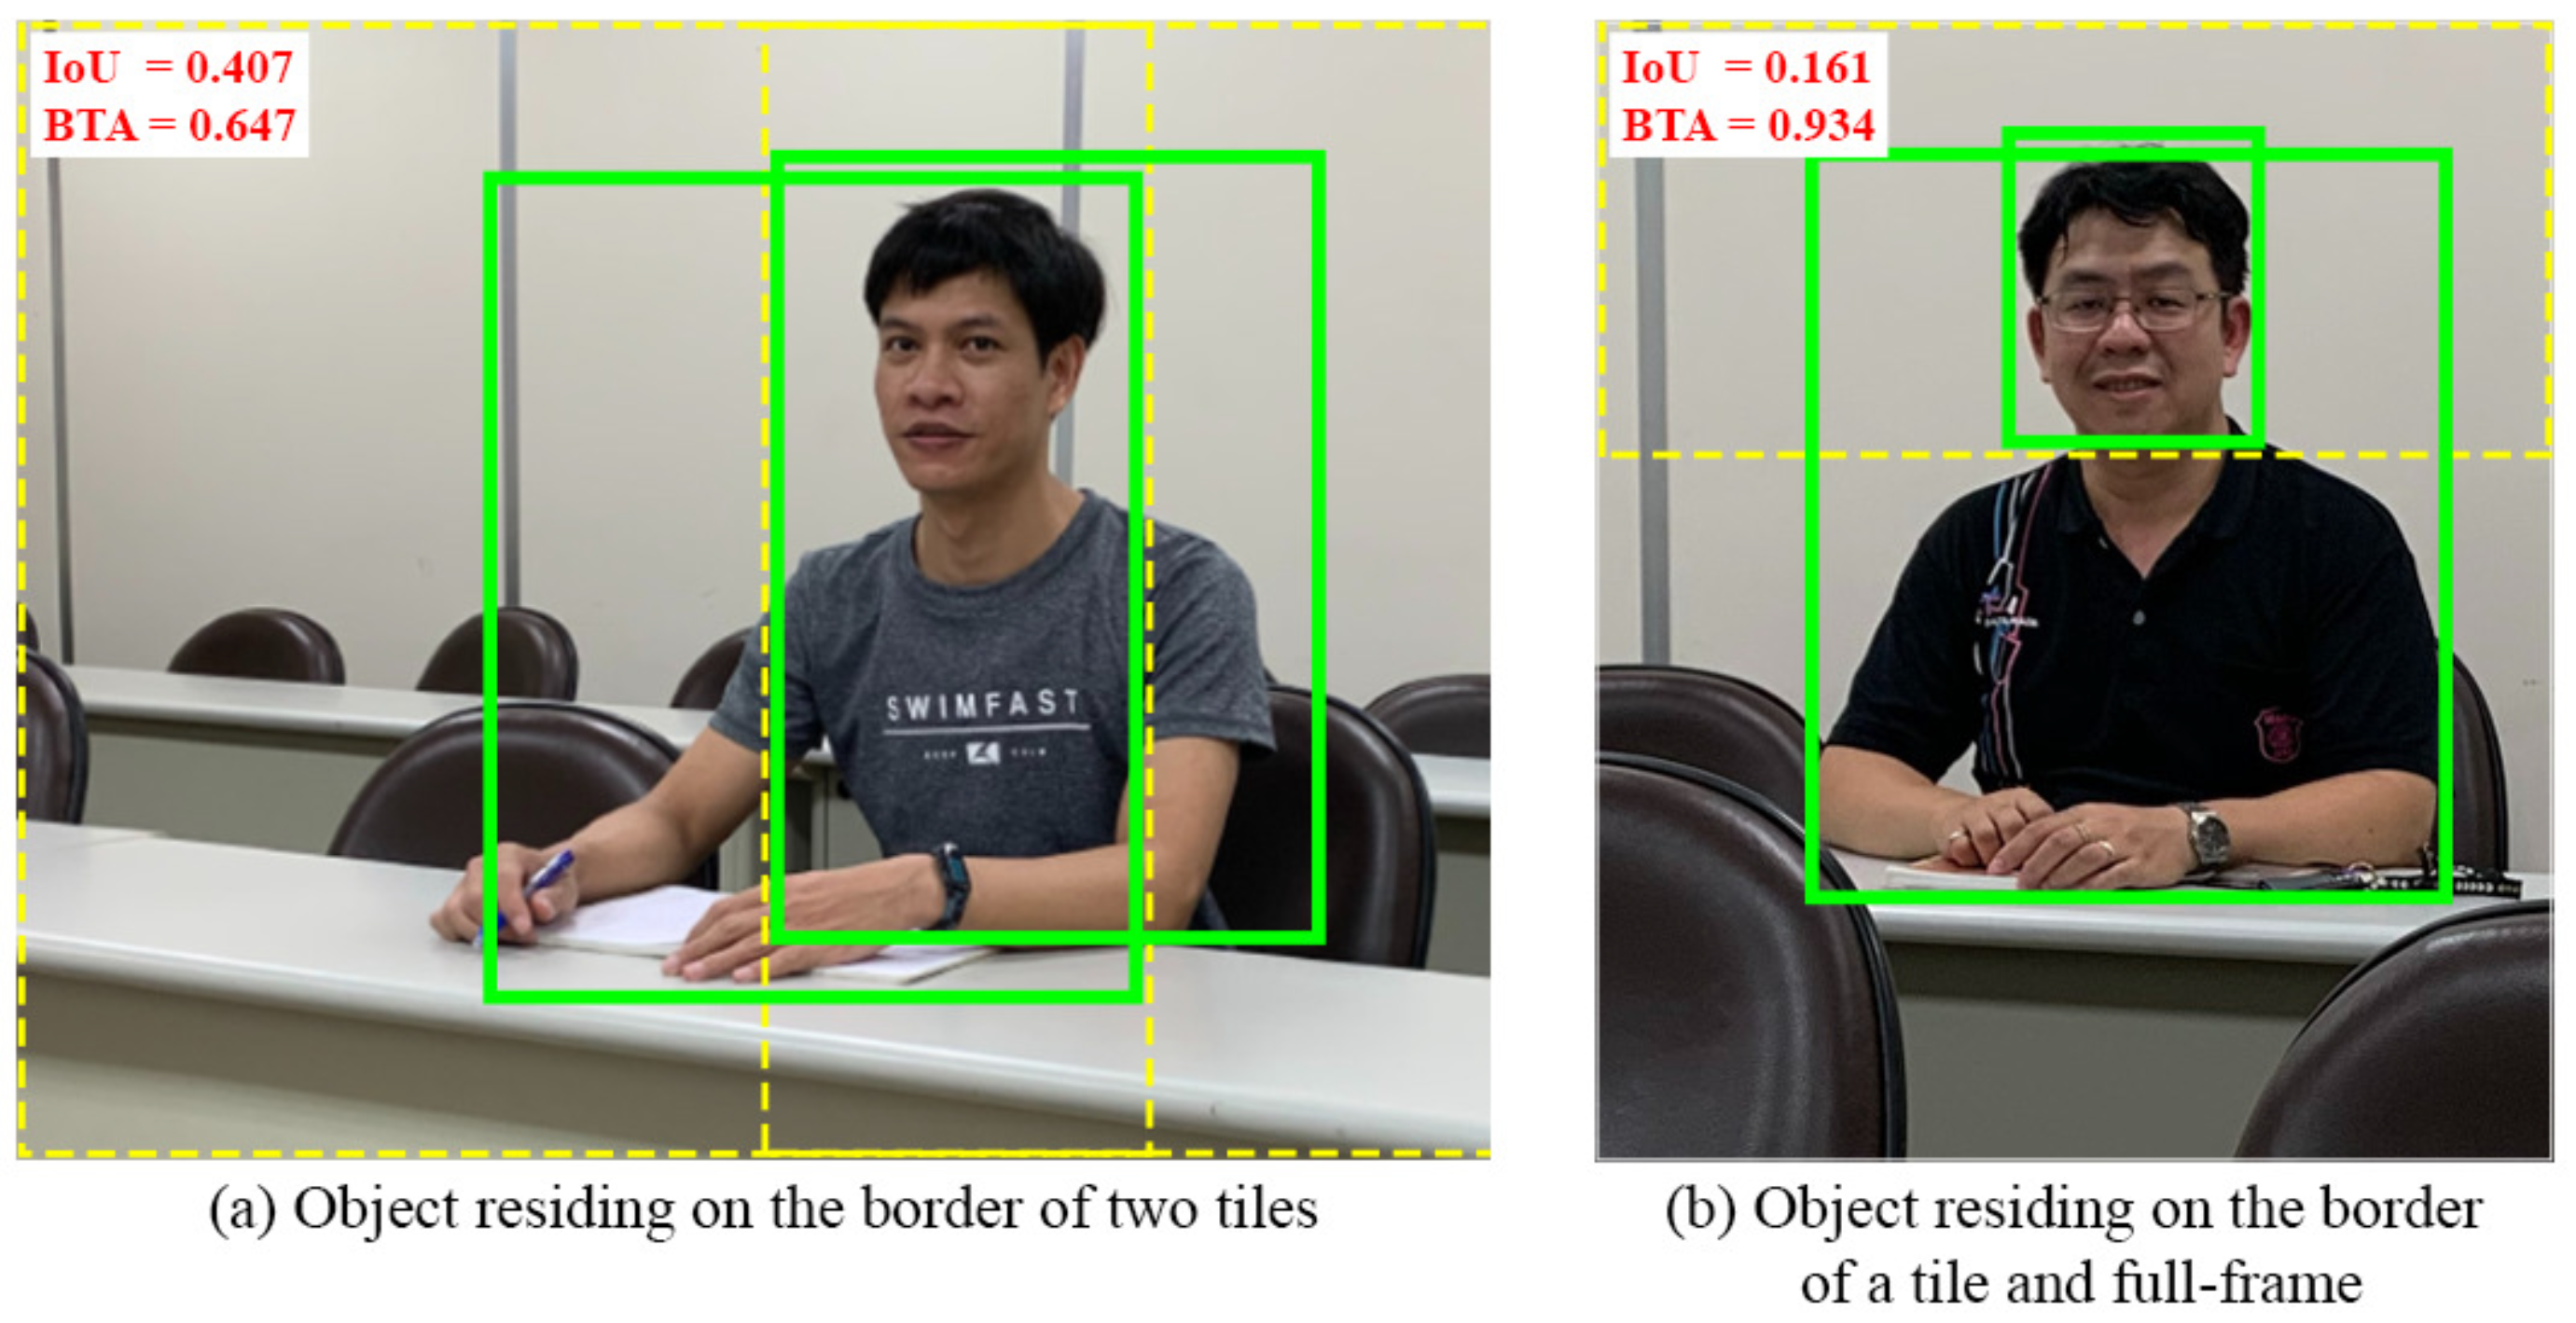
  • The parameters are set using Lines (3–7). t h r e s h o l d _ i o u and t h r e s h o l d _ b t a are the predefined thresholds of IoU and BTA, respectively, that are used to consider whether two neighboring bounding boxes are merged.
  • Lines (8–11) set the initial status of all boxes. s t a t u s _ t i l e _ b o x and s t a t u s _ f u l l _ f r a m e are the status of the bounding boxes in l i s t _ t i l e _ b o x and l i s t _ f u l l _ f r a m e , respectively.
  • Lines (12–20) measure the similarity between bounding boxes in l i s t _ t i l e _ b o x and l i s t _ f u l l _ f r a m e .
  • Lines (21–28) determine the coupled bounding boxes whose IoU and BTA values are the highest. The functions c a l c u l a t e _ i o u ( ) and c a l c u l a t e _ b t a ( ) are used to calculate the IoU and BTA of the coupled bounding boxes, as shown in Equations (4) and (5), respectively.
  • Lines (29–38) show that if the coupled bounding boxes have a higher IoU or BTA value than the respective thresholds, they can be merged to create a new bounding box. l i s t _ f i n a l _ b o x adds the new bounding box, and the status of these coupled bounding boxes is set to false.
  • Lines (39–48) determine the bounding boxes that belong to l i s t _ t i l e _ b o x but not to l i s t _ f u l l _ f r a m e . In other words, their IoU values equal zero and these bounding are added to l i s t _ f i n a l _ b o x .
  • Similarly, lines (49–58) determine the bounding boxes that belong to l i s t _ f u l l _ f r a m e but not l i s t _ t i l e _ b o x . These bounding boxes are added to l i s t _ f i n a l _ b o x .
  • Lines (59–60) reduce the BTA threshold by a fixed α each time the algorithm is repeated. Finally, the program returns a list of final bounding boxes.

4. System Implementation and Prototype

A prototype is designed to test the efficiency of the proposed system, as described below. The system is implemented on a computer with an Intel Core i7 CPU 3.70 GHz, 64-bit Windows operating system, 32 GB RAM, and NVIDIA TITAN V GPU. The program is developed using Anaconda3 v5.2.0 as the integrated development environment and Python v3.6.5 as the programming language.
Figure 7 shows the designed user interface. Therefore, users can see the whole room quickly in different views. Users can also easily observe and analyze hot areas in the room. As also shown in Figure 7, a real-time reporting system was designed for people counting. The orange lines in Figure 7a,b reflect the number of people detected every 10 s; moreover, the historical data can be viewed using the scroll bar on the side of the window.
This study implemented and compared four schemes: MobileNet-SSD, YOLO v3, Mask R-CNN, and our proposed Mask R-CNN + Tiles scheme. The parameters and conditions for each of the three compared methods (MobileNet-SSD, YOLO v3, and Mask R-CNN) were set according to the original articles. The SSD framework was originally proposed by Liu et al. [18] and later combined with the MobileNet architecture to produce MobileNet-SSD [47], a faster and more efficient deep-learning-based object detection method. YOLO v3 [19] was selected in this study because it delivers the optimal detection performance among different YOLO versions. This YOLO v3 model was trained using the COCO dataset [44]. As mentioned above, the Mask R-CNN scheme was proposed by He et al. [21]. In this study, the Mask R-CNN scheme, trained on the COCO dataset, was applied based on ResNet-101-FPN [41], including an FPN and a ResNet-101 backbone.

5. Experimental Results

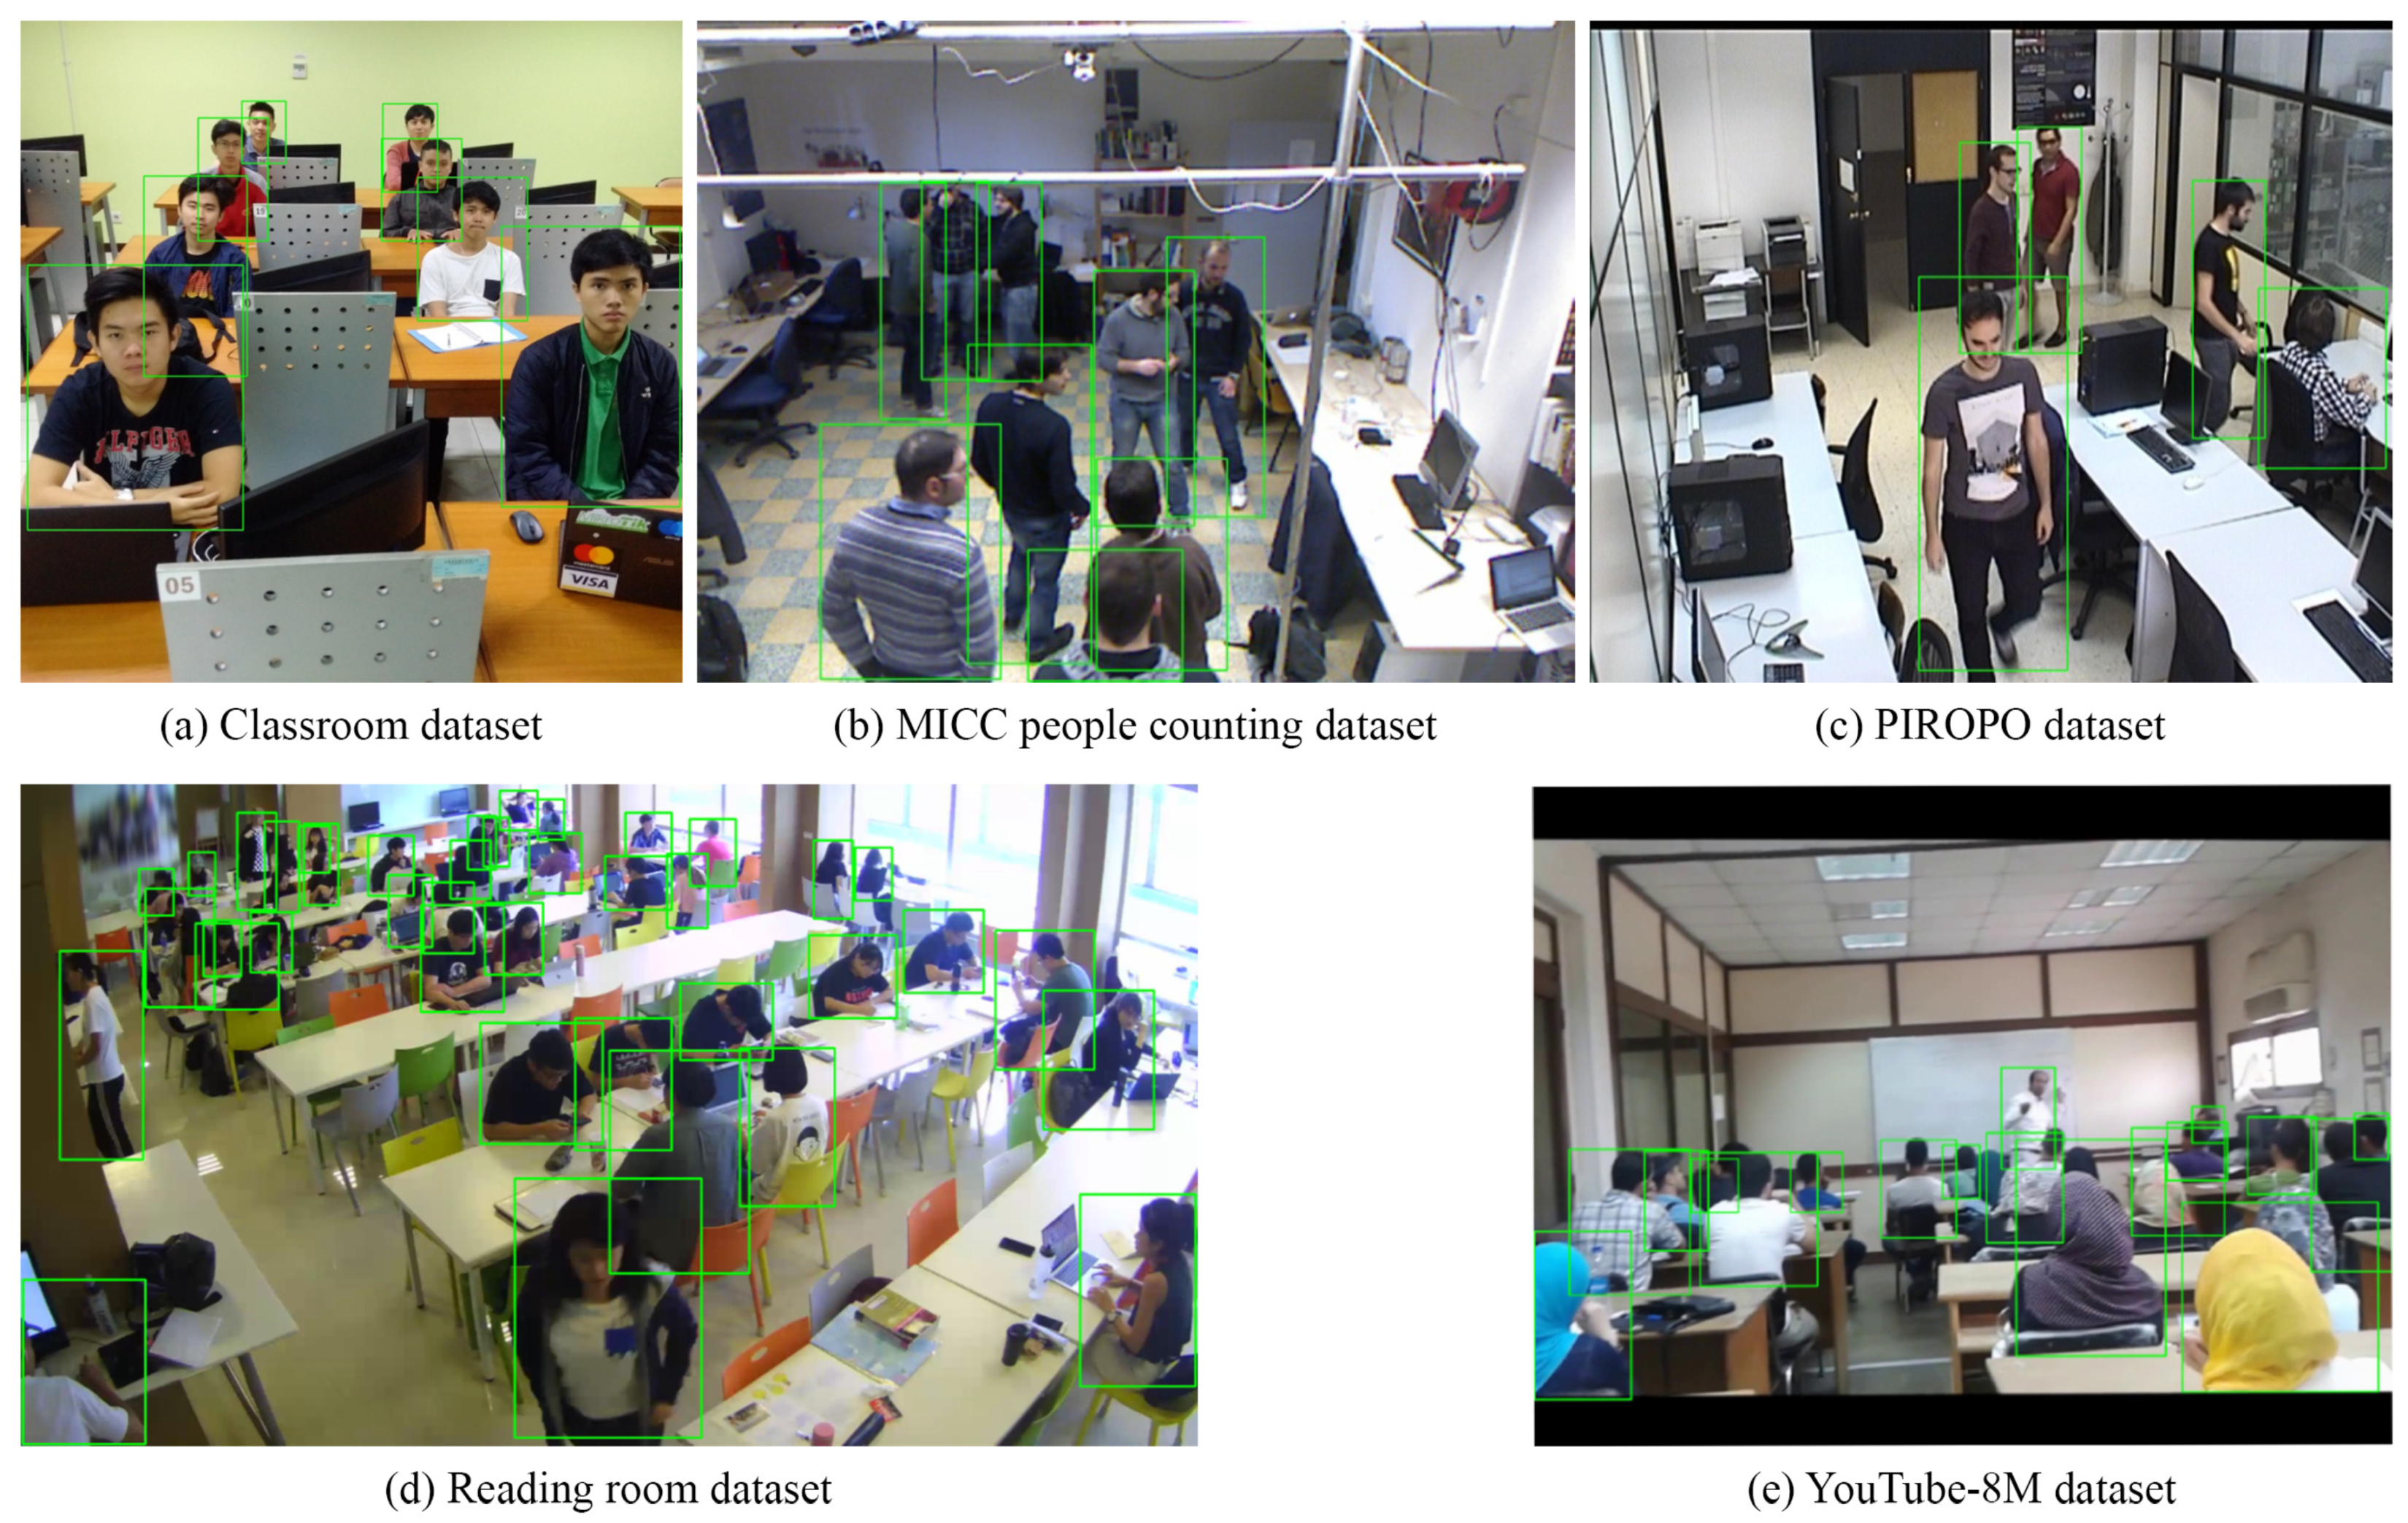
5.1. Testing Datasets

The classroom dataset [48] includes images of students sitting in classrooms taken weekly from five classrooms over 11 consecutive weeks.
The MICC people counting dataset [49] includes RGB-D images that present groups of people acting under three common motion scenarios: flow sequence, in which people are asked to move straight from one point to another; queue sequence, in which people are required to line up in the queue and move ahead slowly as people in front are served; and group sequence, in which people are divided into groups and talk to each other in the controlled area.
The PIROPO dataset [50] contains sequences recorded in two indoor rooms by using omnidirectional and perspective cameras to capture people’s daily activities, such as walking, sitting, and standing.
The YouTube-8M dataset [51] provides ample capacity for video understanding, including the availability of 4800 Knowledge Graph entities, over 8 million videos, and more than 500,000 h of video. In this study, we selected a video [52] from the classroom entity of the YouTube-8M dataset. Then, this video was split into frames for testing.
The images in our dataset (reading room) contain people performing various activities, such as walking, standing, and sitting. Even the same image contains different-sized people owing to their different distances from the camera. Table 1 lists the details of the images used in this study.

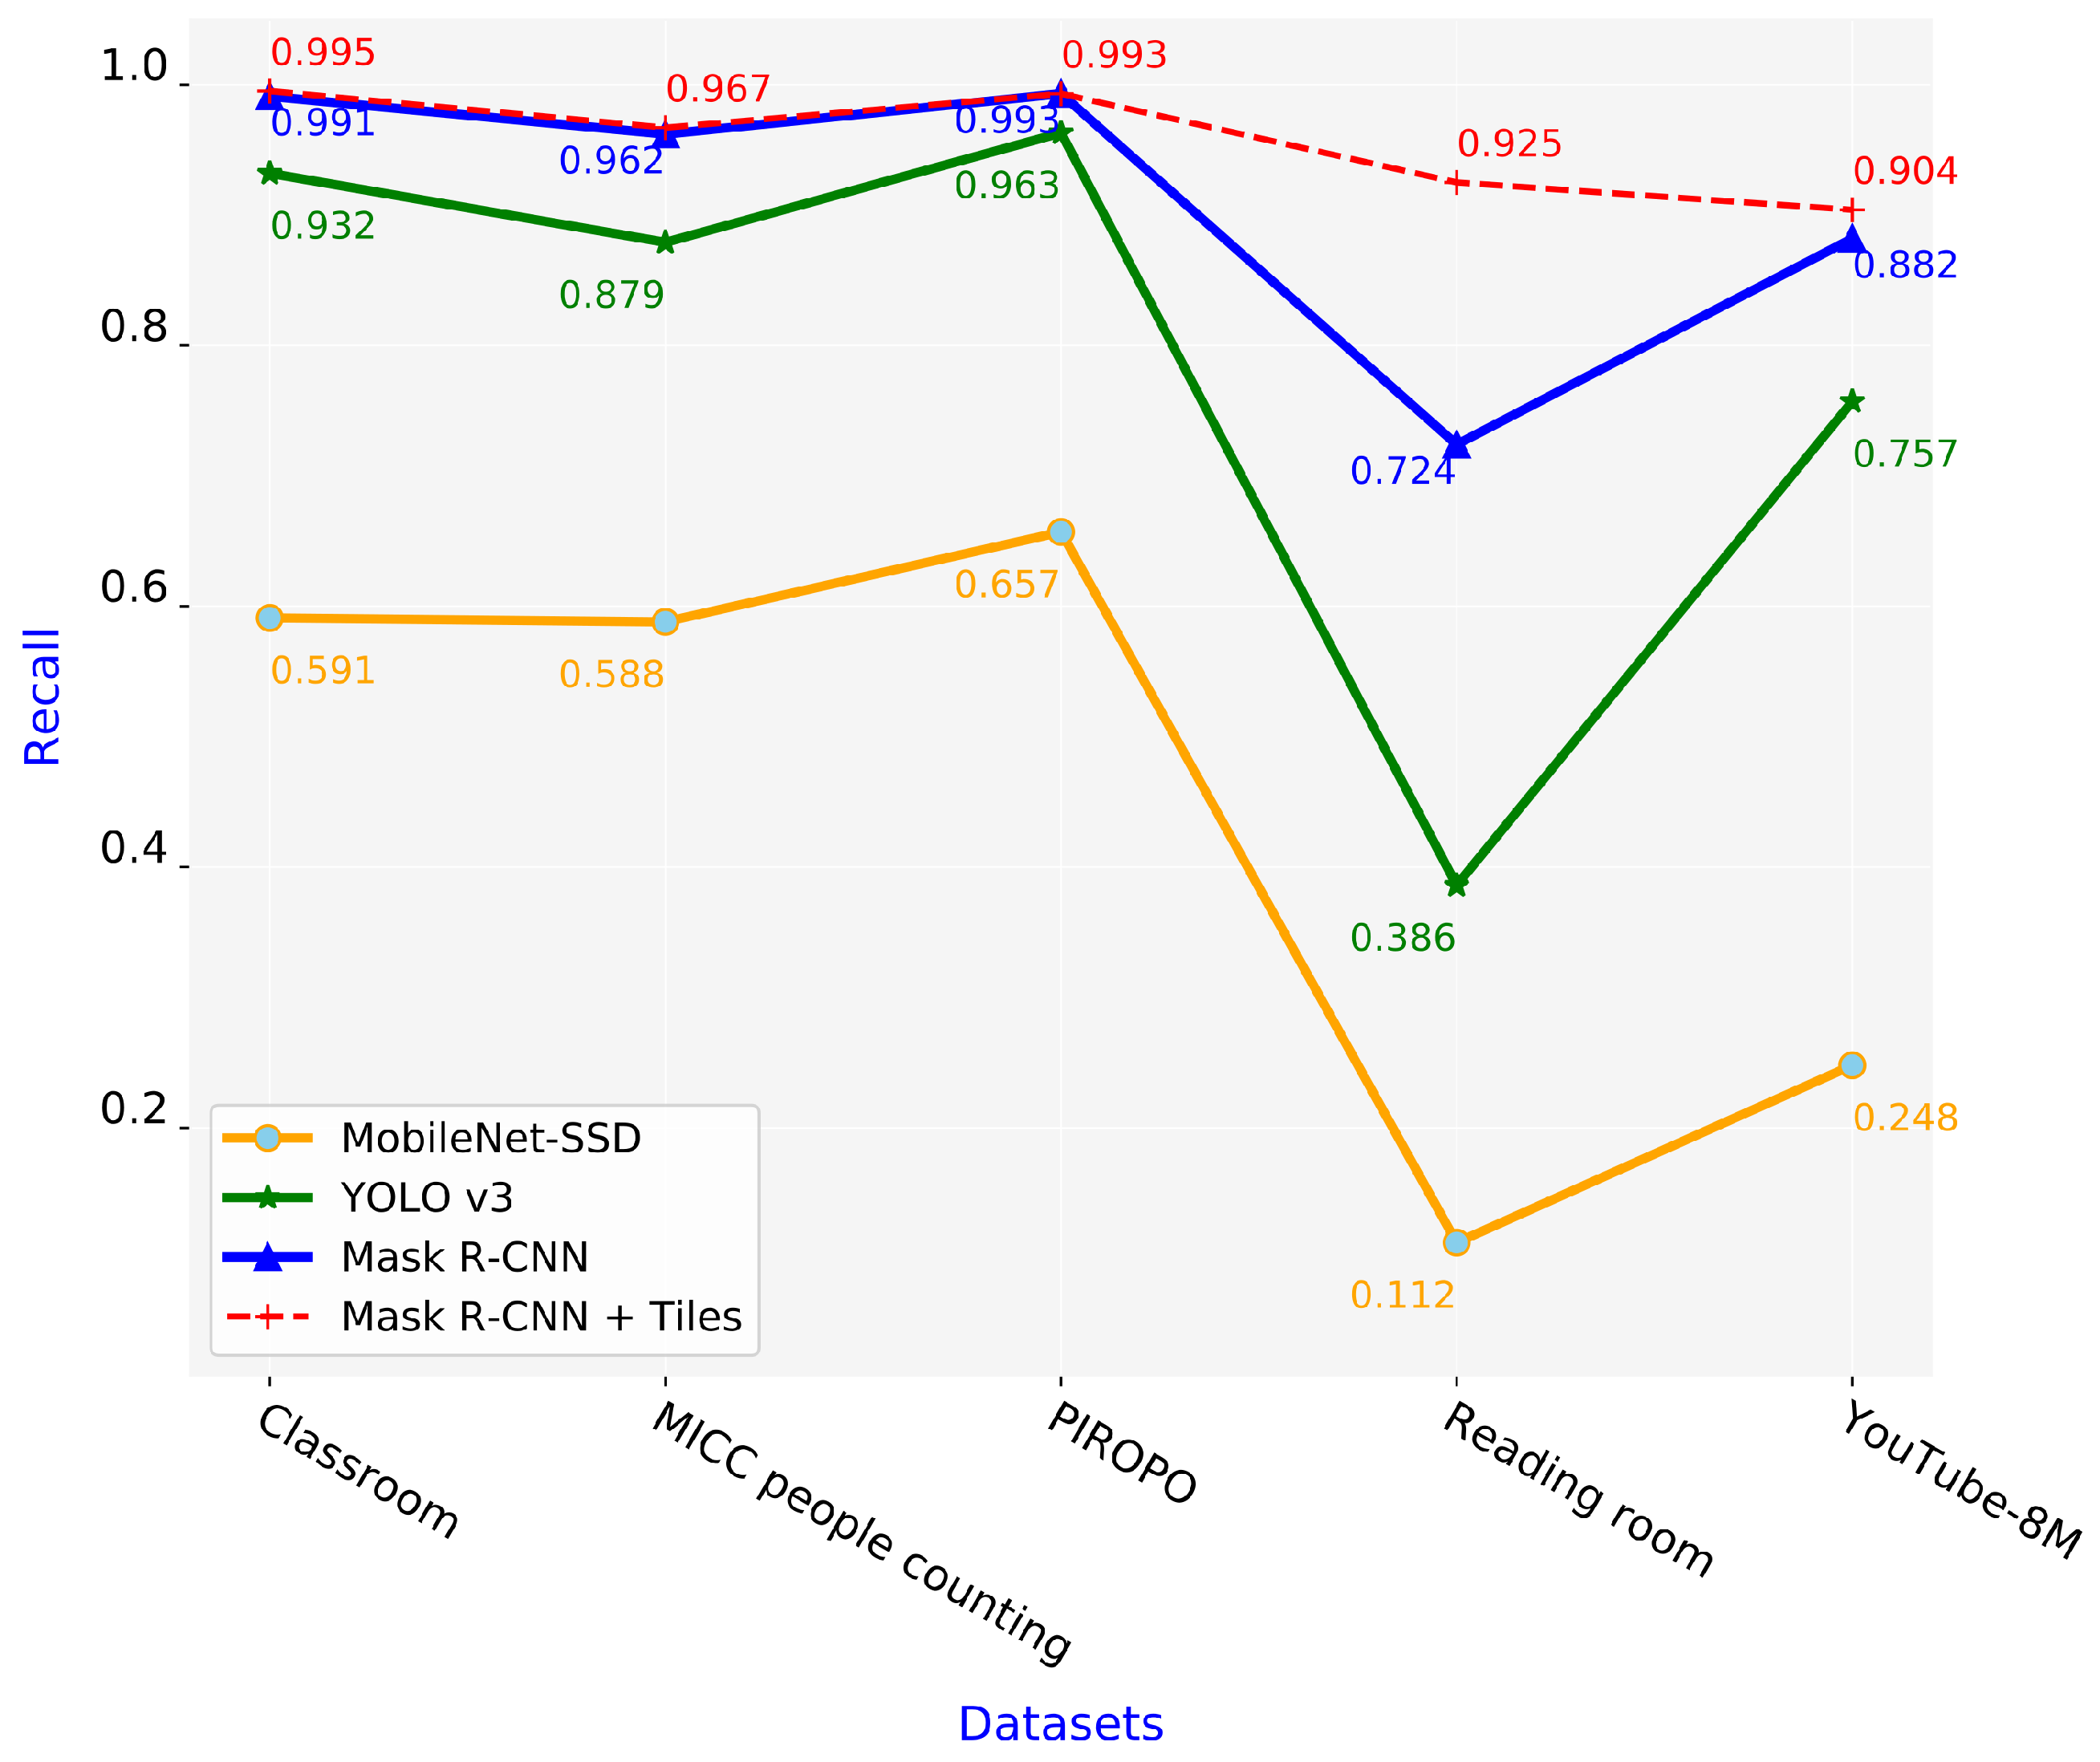
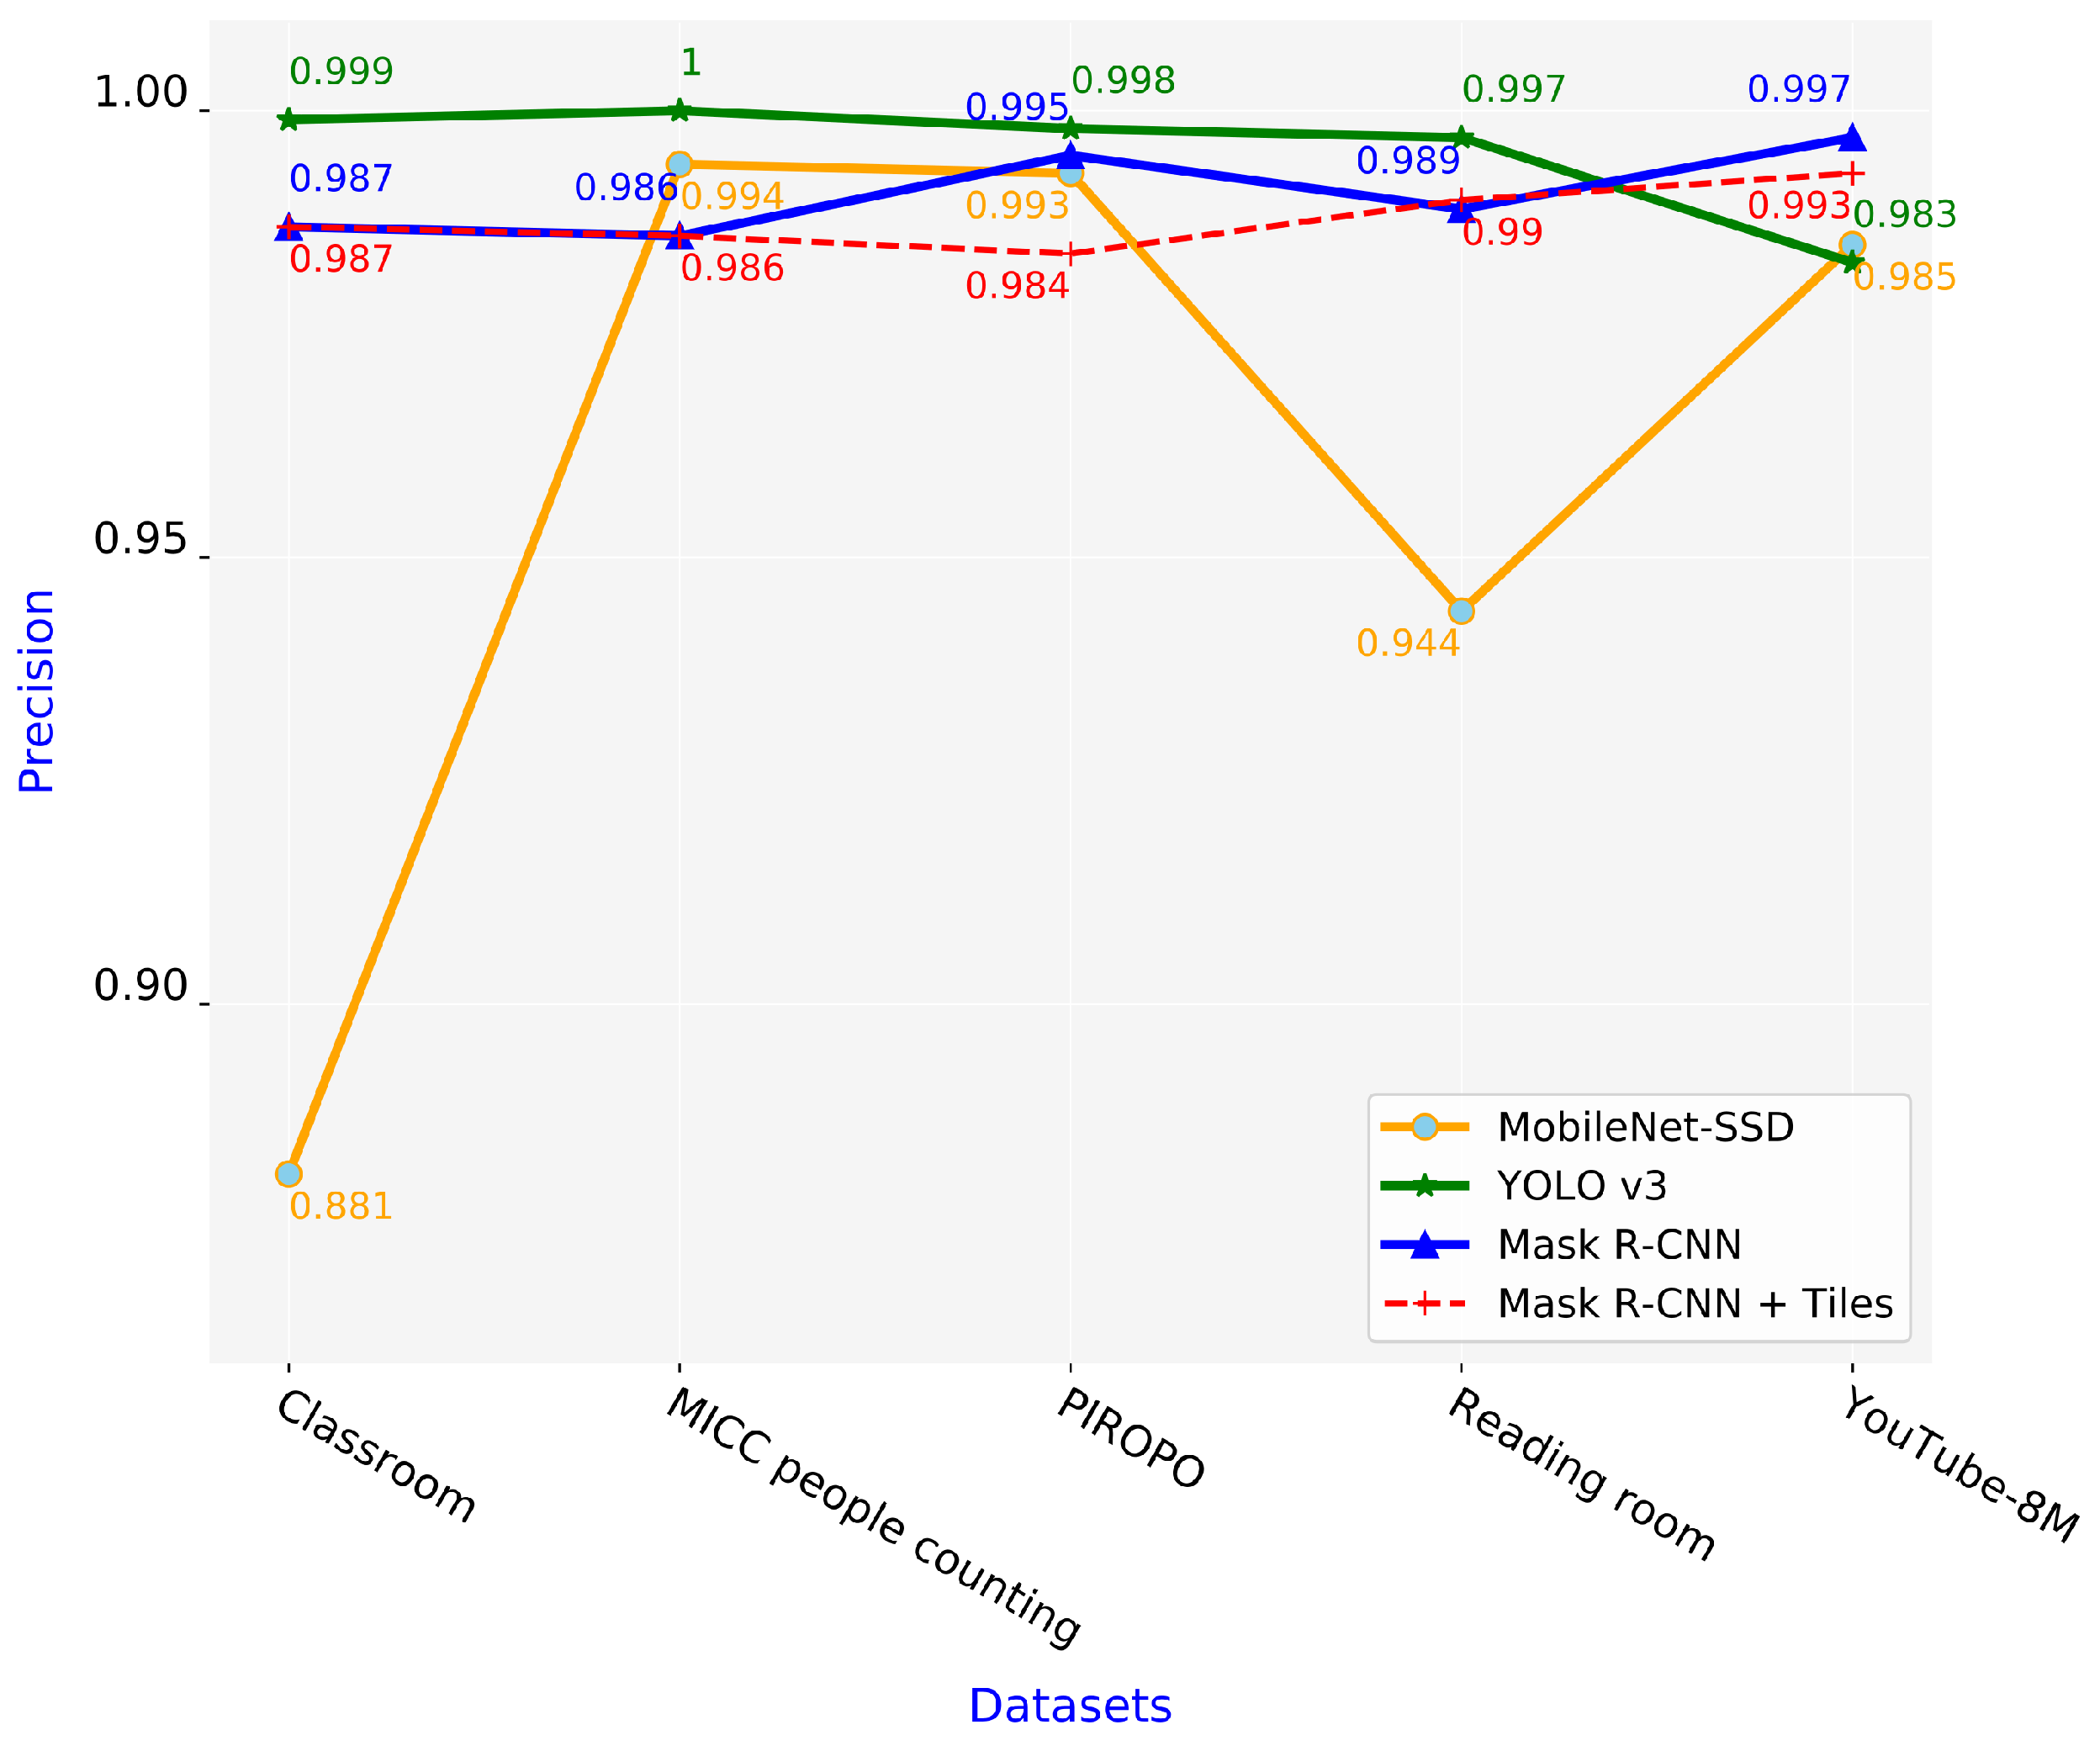
5.2. Comparison of Schemes in Terms of Precision and Recall

The performance of the schemes can be evaluated using different metrics such as recall and precision, defined by Equations (6) and (7), respectively.
R e c a l l = T r u e   P o s i t i v e T r u e   P o s i t i v e + F a l s e   N e g a t i v e
P r e c i s i o n = T r u e   P o s i t i v e T r u e   P o s i t i v e + F a l s e   P o s i t i v e
The recall is the true positive rate or sensitivity; it measures the probability of ground truth objects being detected correctly. Figure 8 shows the recall of the four schemes. We observe that our proposed Mask R-CNN + Tiles scheme exhibited better performance than the other schemes, especially for the reading room and YouTube-8M datasets. Its recall and true positive rate are always high, indicating that it can detect objects much more accurately than the remaining schemes. By contrast, the MobileNet-SSD scheme has the lowest recall value; even in the reading room dataset, it achieved a recall value of only 0.112.
Figure 9 shows the precision of the four schemes. The precision values of three schemes (YOLO v3, Mask R-CNN, and proposed Mask R-CNN + Tiles schemes) remained consistently high. For the MobileNet-SSD scheme, the five testing datasets had significantly different precision values.
A sample frame illustrates the different detection results of the four schemes, as shown in Figure 10. The MobileNet-SSD and YOLO v3 schemes had 38 and 30 false-negative detections, respectively. The Mask R-CNN scheme significantly improved the false-negative detection to 17. Our proposed Mask R-CNN + Tiles scheme had only two false-negative detections, demonstrating its excellent performance.

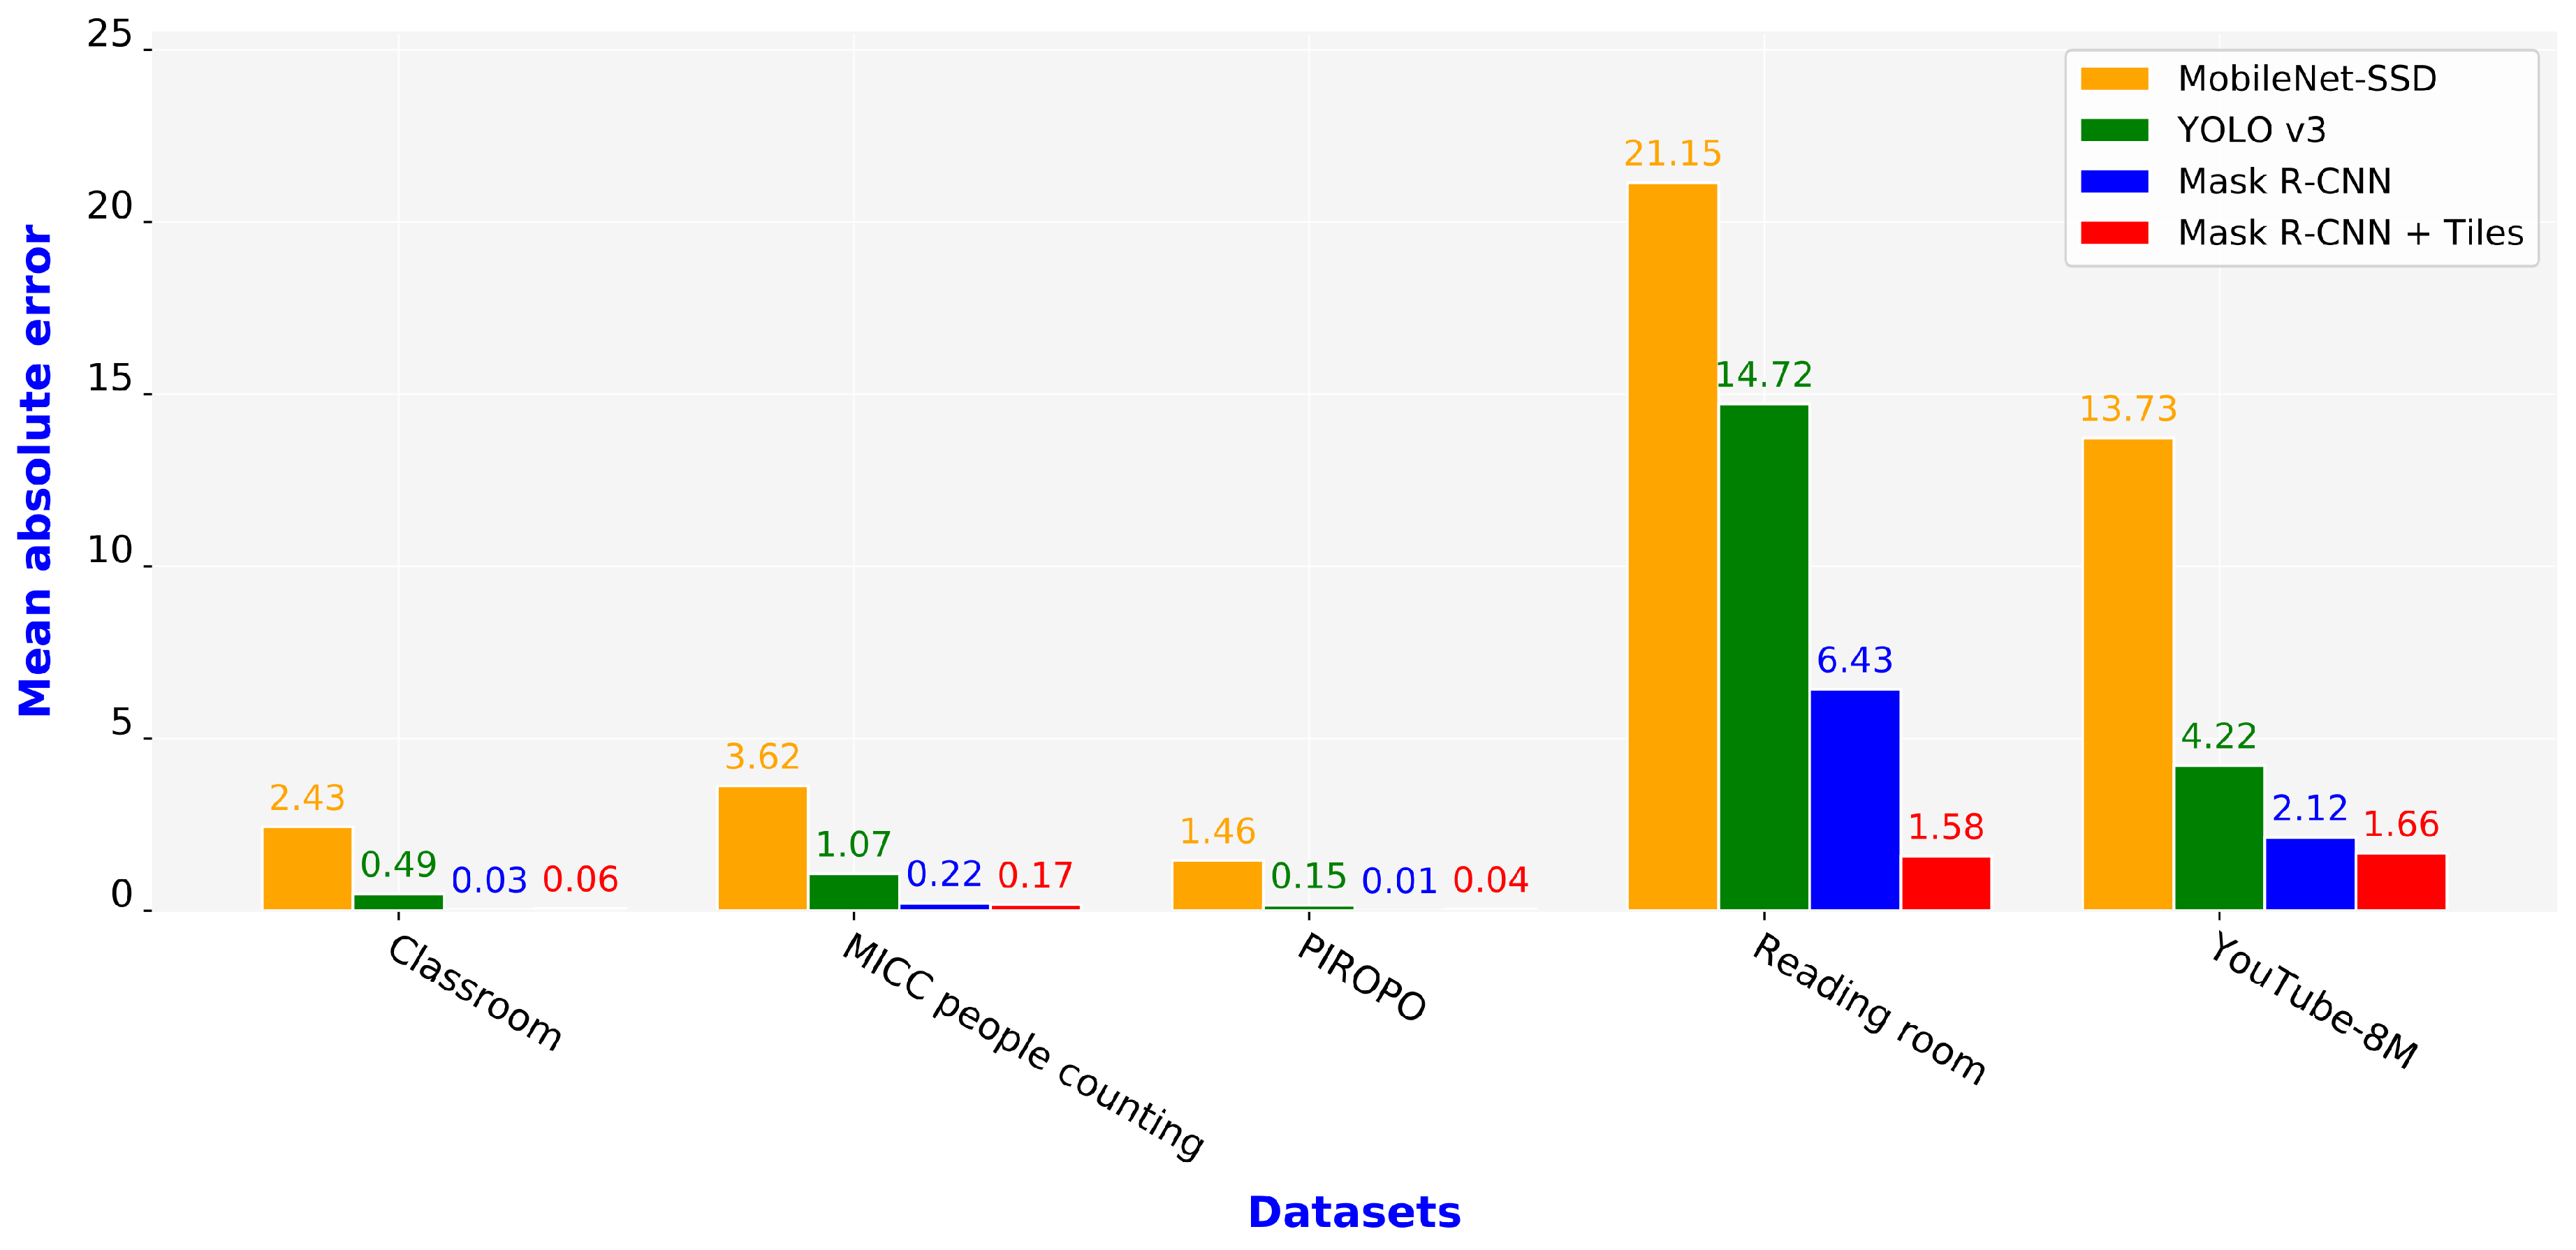
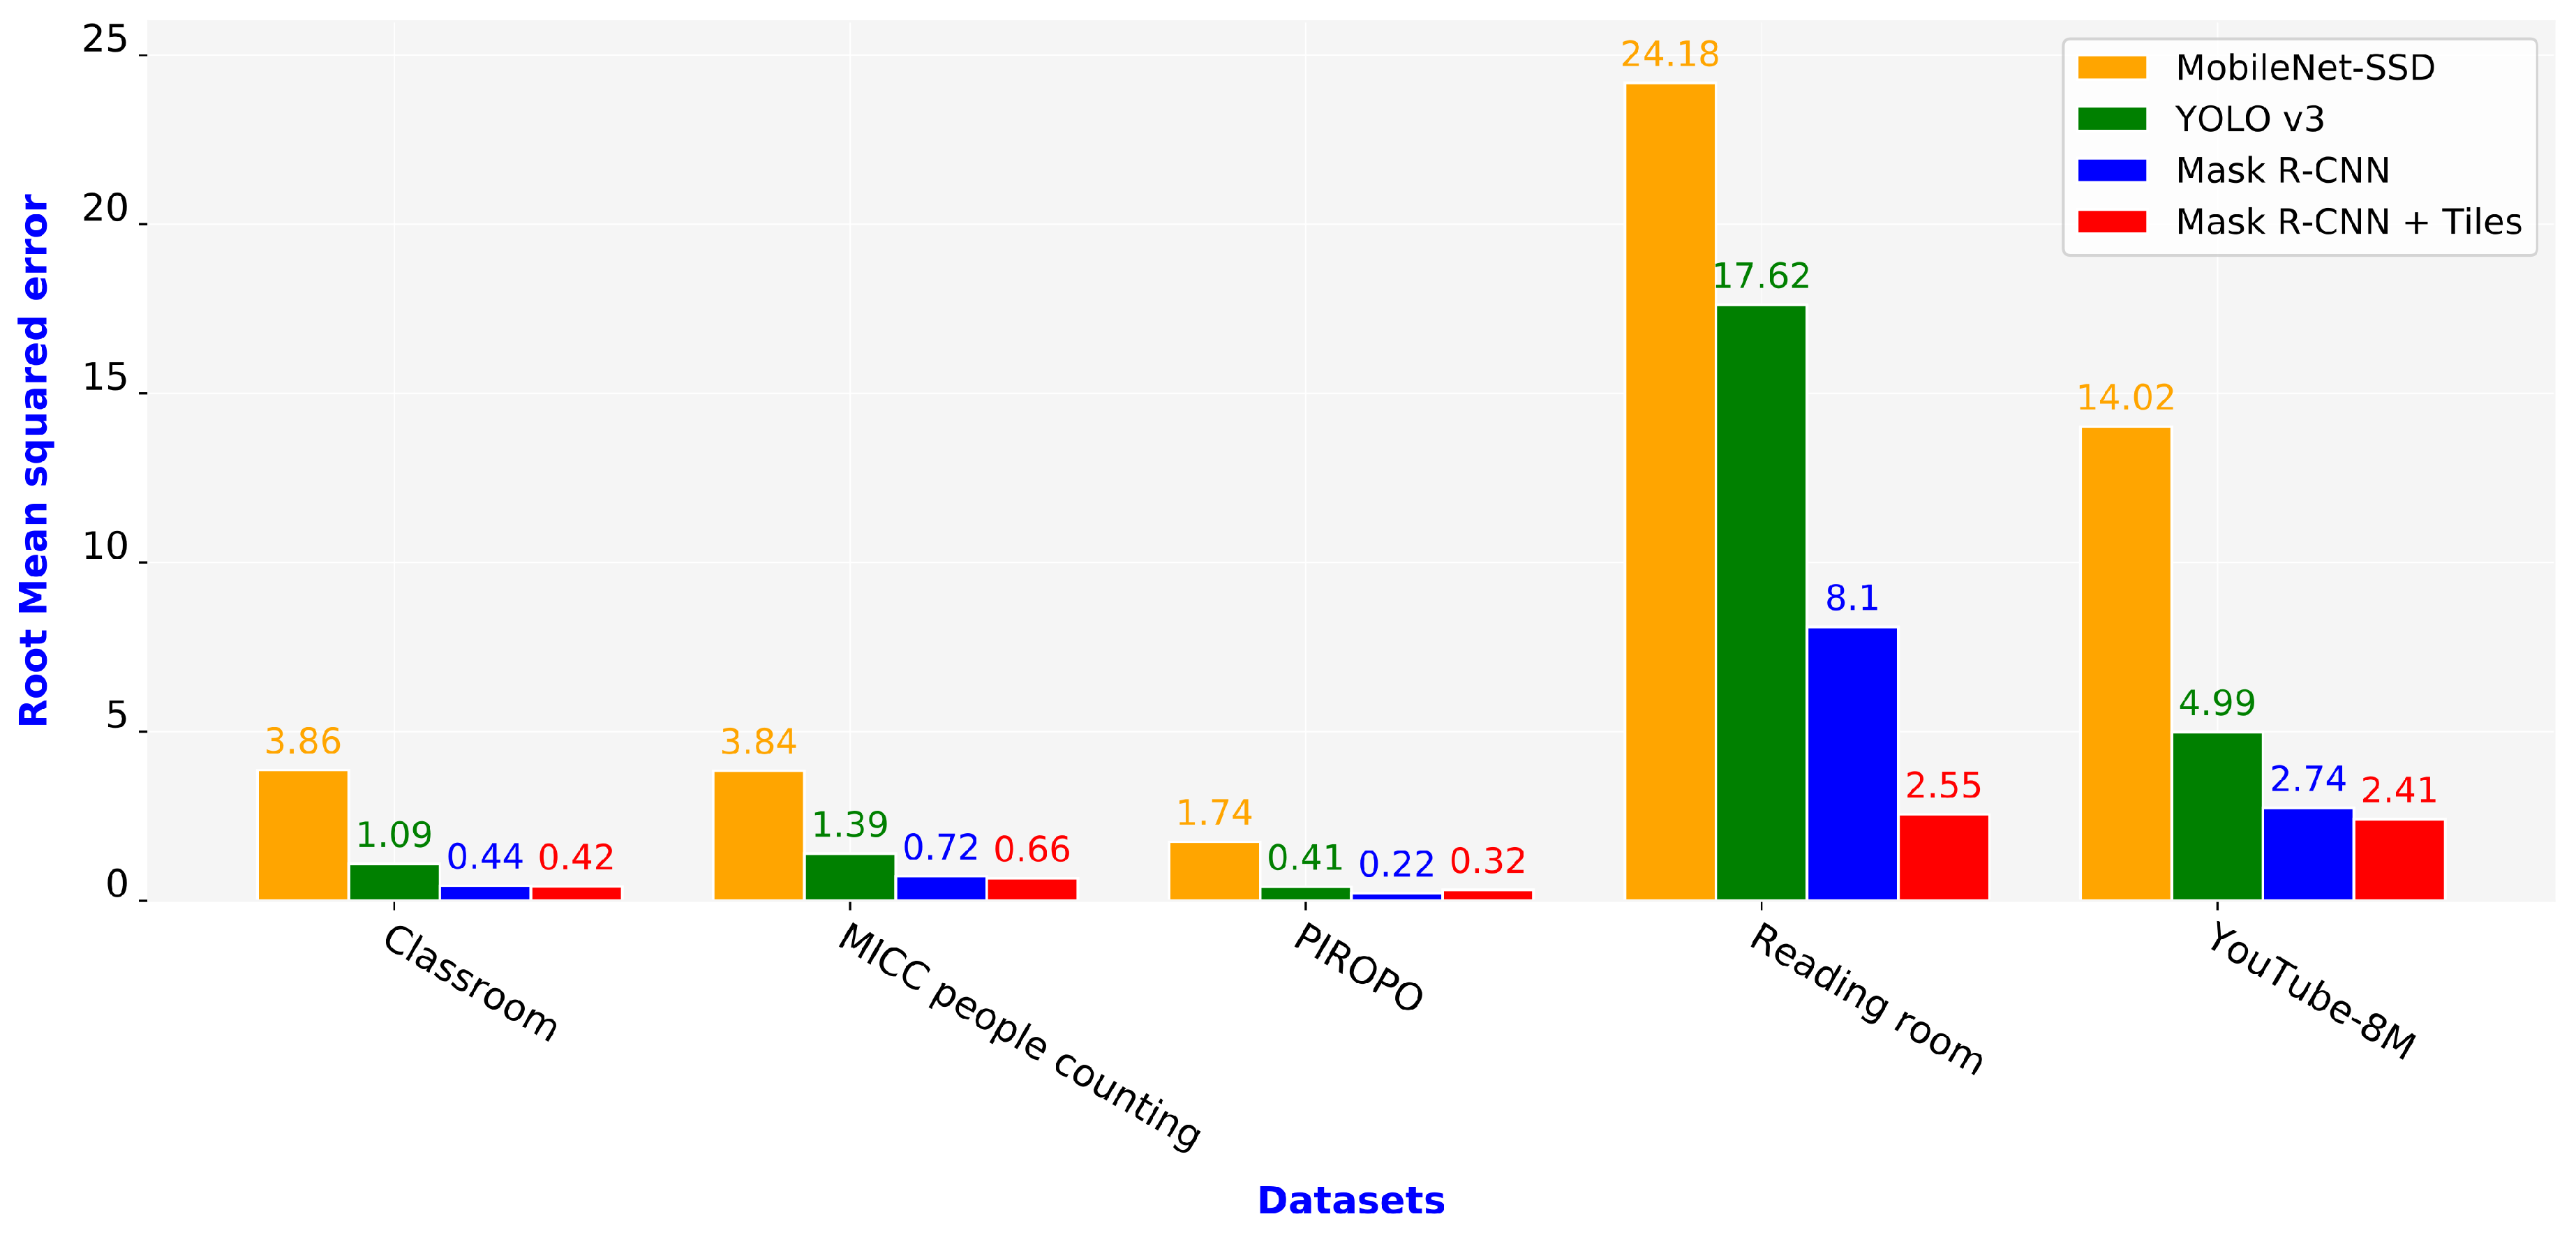
5.3. Evaluation of Schemes Using MAE and RMSE

We evaluated and compared the four schemes using other metrics including mean absolute error (MAE) and root mean squared error (RMSE), defined by Equations (8) and (9), respectively. Here, N is the total number of testing images, and y i and y i are the number of ground-truth and predicted people, respectively, in the ith image.
M A E = 1 N i = 1 N y i y i
R M S E = 1 N i = 1 N y i y i 2
The MAE shows the average of the absolute differences between the actual and predicted values. This metric only indicates the magnitude of the error; however, it does not consider false positives or negatives. The higher the MAE value, the worse is the scheme. Figure 11 shows the MAE of the four schemes. Our proposed Mask R-CNN + Tiles scheme had a relatively low MAE and it outperformed the MobileNet-SSD and YOLO v3 schemes for all five datasets. Further, it significantly outperformed the Mask R-CNN scheme for the reading room and YouTube-8M datasets.
RMSE is a quadratic scoring rule that measures the error of a model in predicting quantitative data. Similar to the MAE metric, the higher the RMSE value, the worse is the scheme. Figure 12 shows the RMSE of the four schemes. Our proposed Mask R-CNN + Tiles scheme achieved the lowest RMSE value for all datasets except the PIROPO dataset, where the Mask R-CNN scheme had the lowest RMSE value and the Mask R-CNN + Tiles scheme had the second-lowest one. Further, the Mask R-CNN + Tiles scheme exhibited considerably lower RMSE values than the other schemes for the reading room and YouTube-8M datasets owing to the variety of activities, such as walking, standing, and sitting, presented in these two datasets. The variation in the object sizes and densities also contributed to this remarkable result; the higher the number of people, the better is the image resolution, which is the highlight of our proposed scheme.
Figure 13 illustrates the detection results of the proposed Mask R-CNN + Tiles scheme on five datasets. We observe that our proposed scheme achieved good detection results for all five datasets. The classroom, MICC people counting, and PIROPO datasets contain images with uniform or simple activities, therefore, the MAE and RMSE values are low in these datasets. While in the reading room and YouTube-8M datasets, the MAE and RMSE values are higher owing to the multiple activities presented in the images.

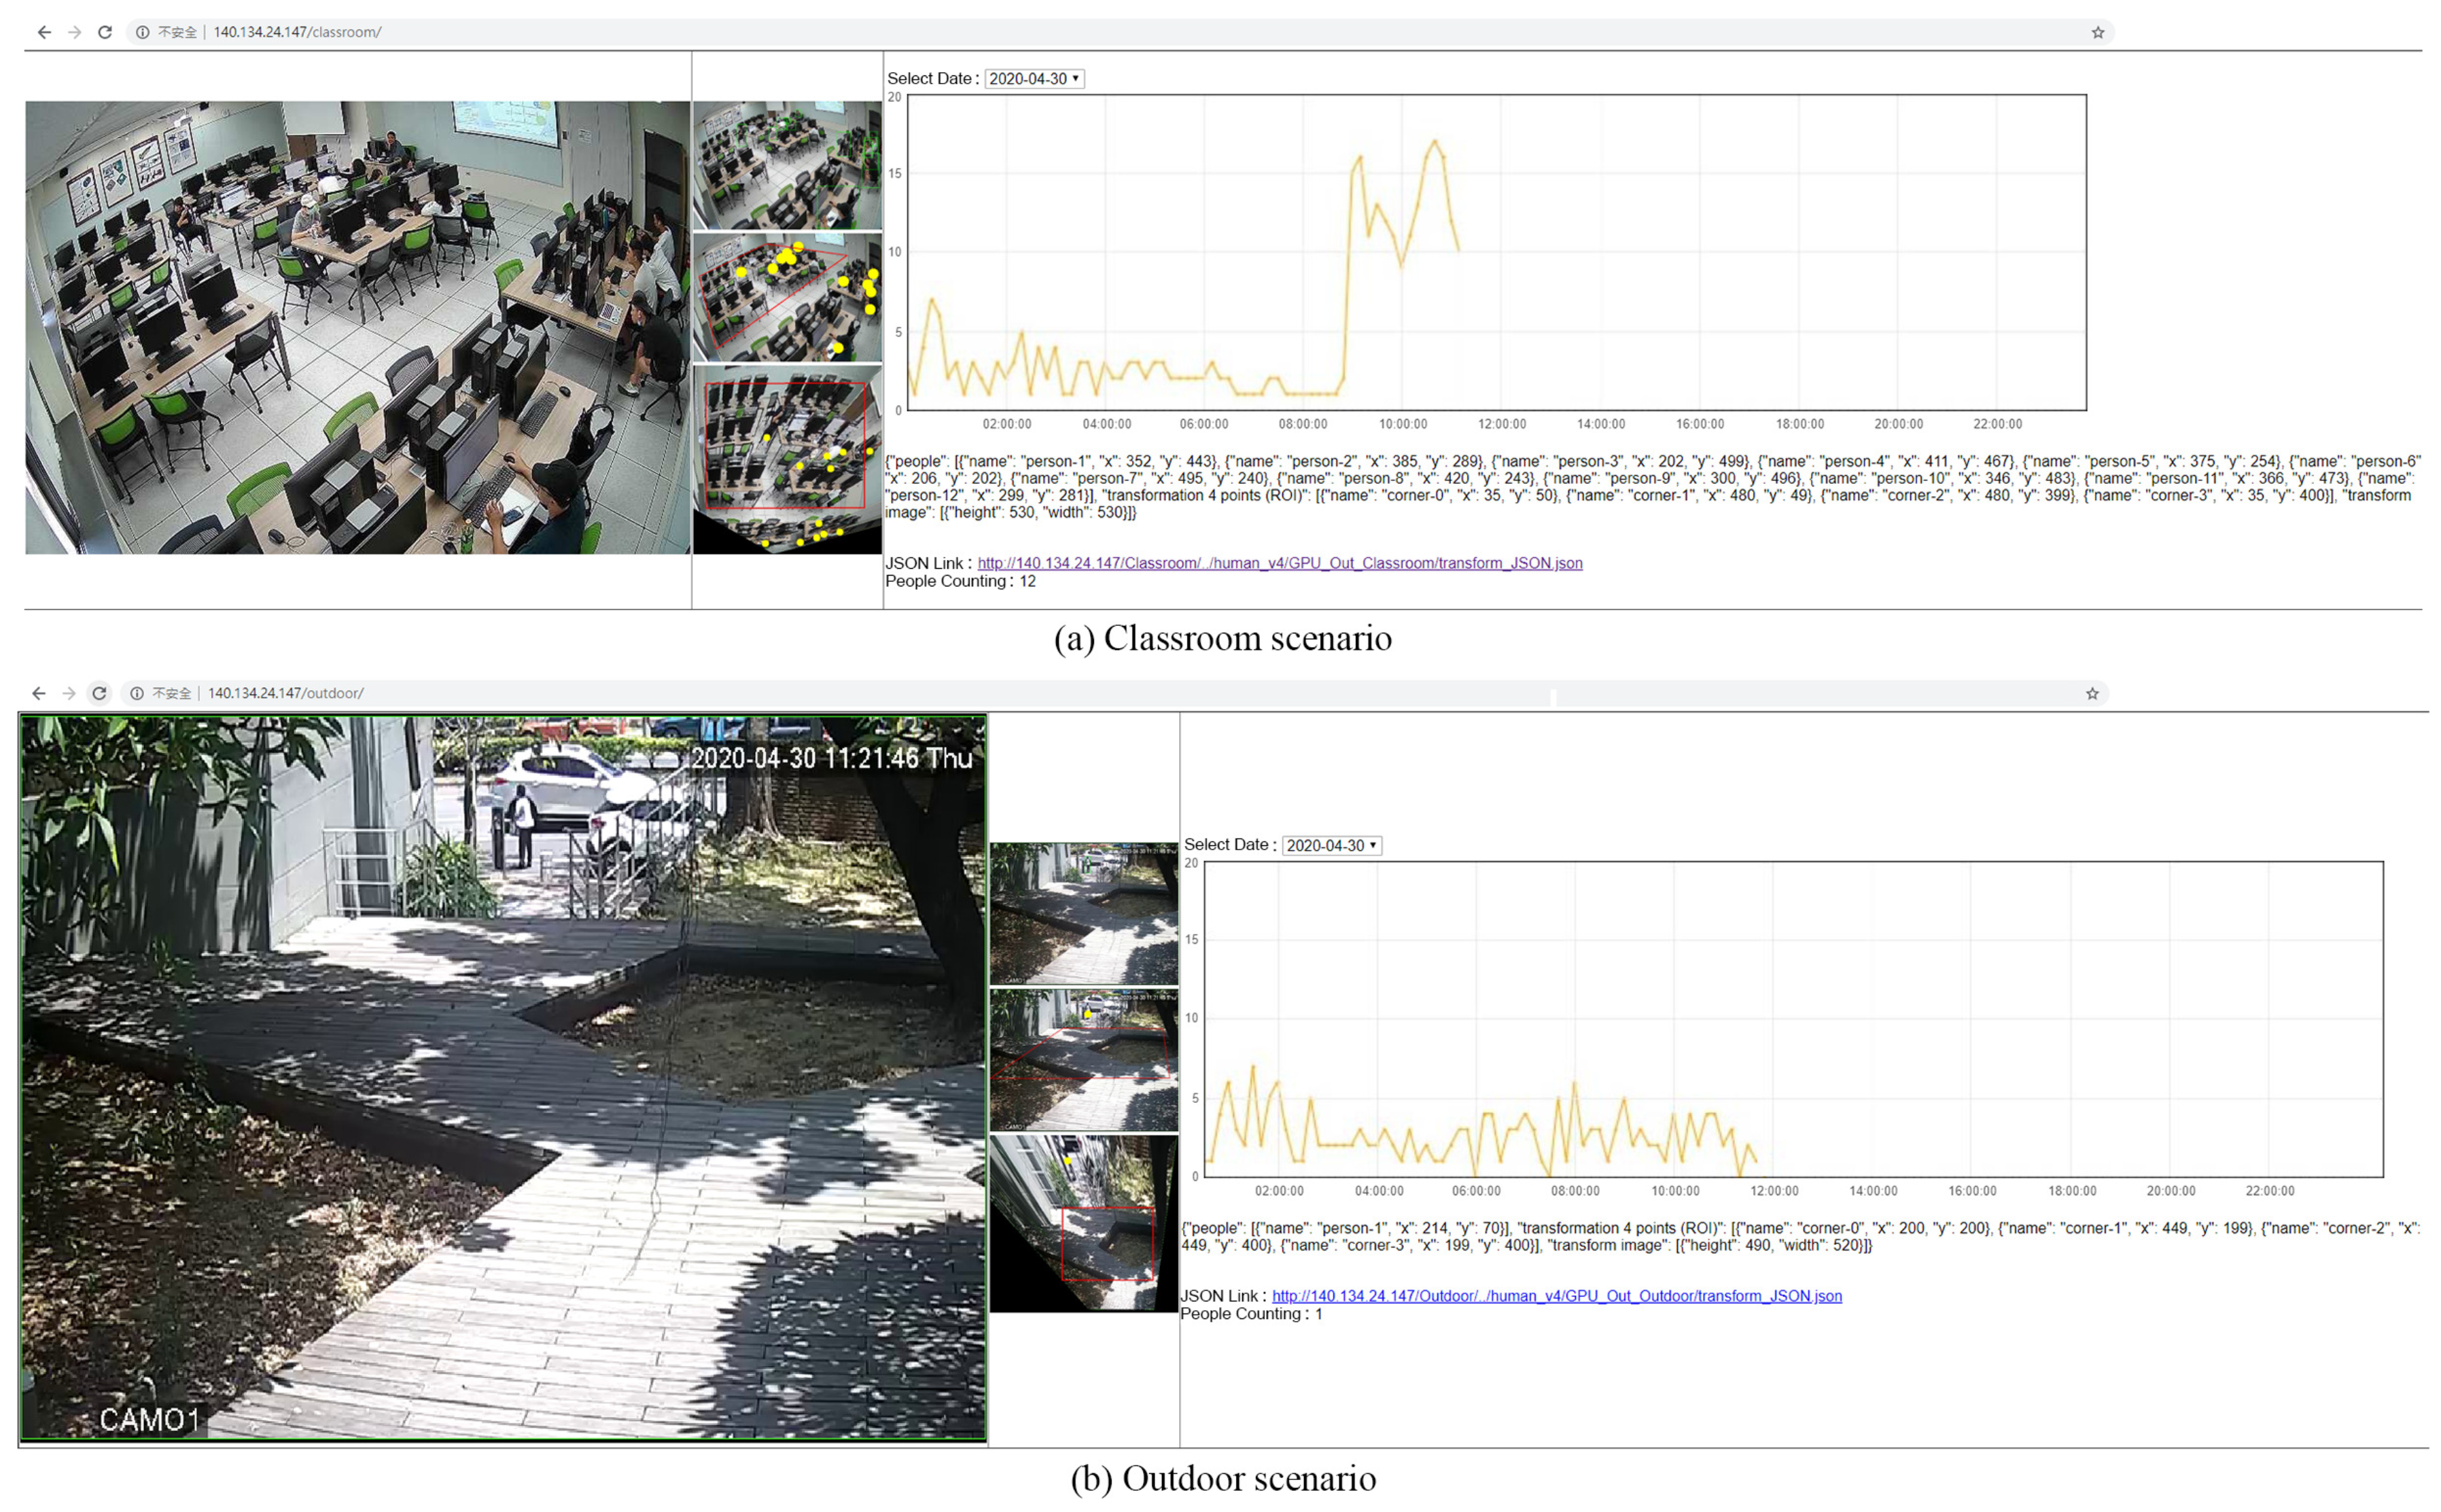
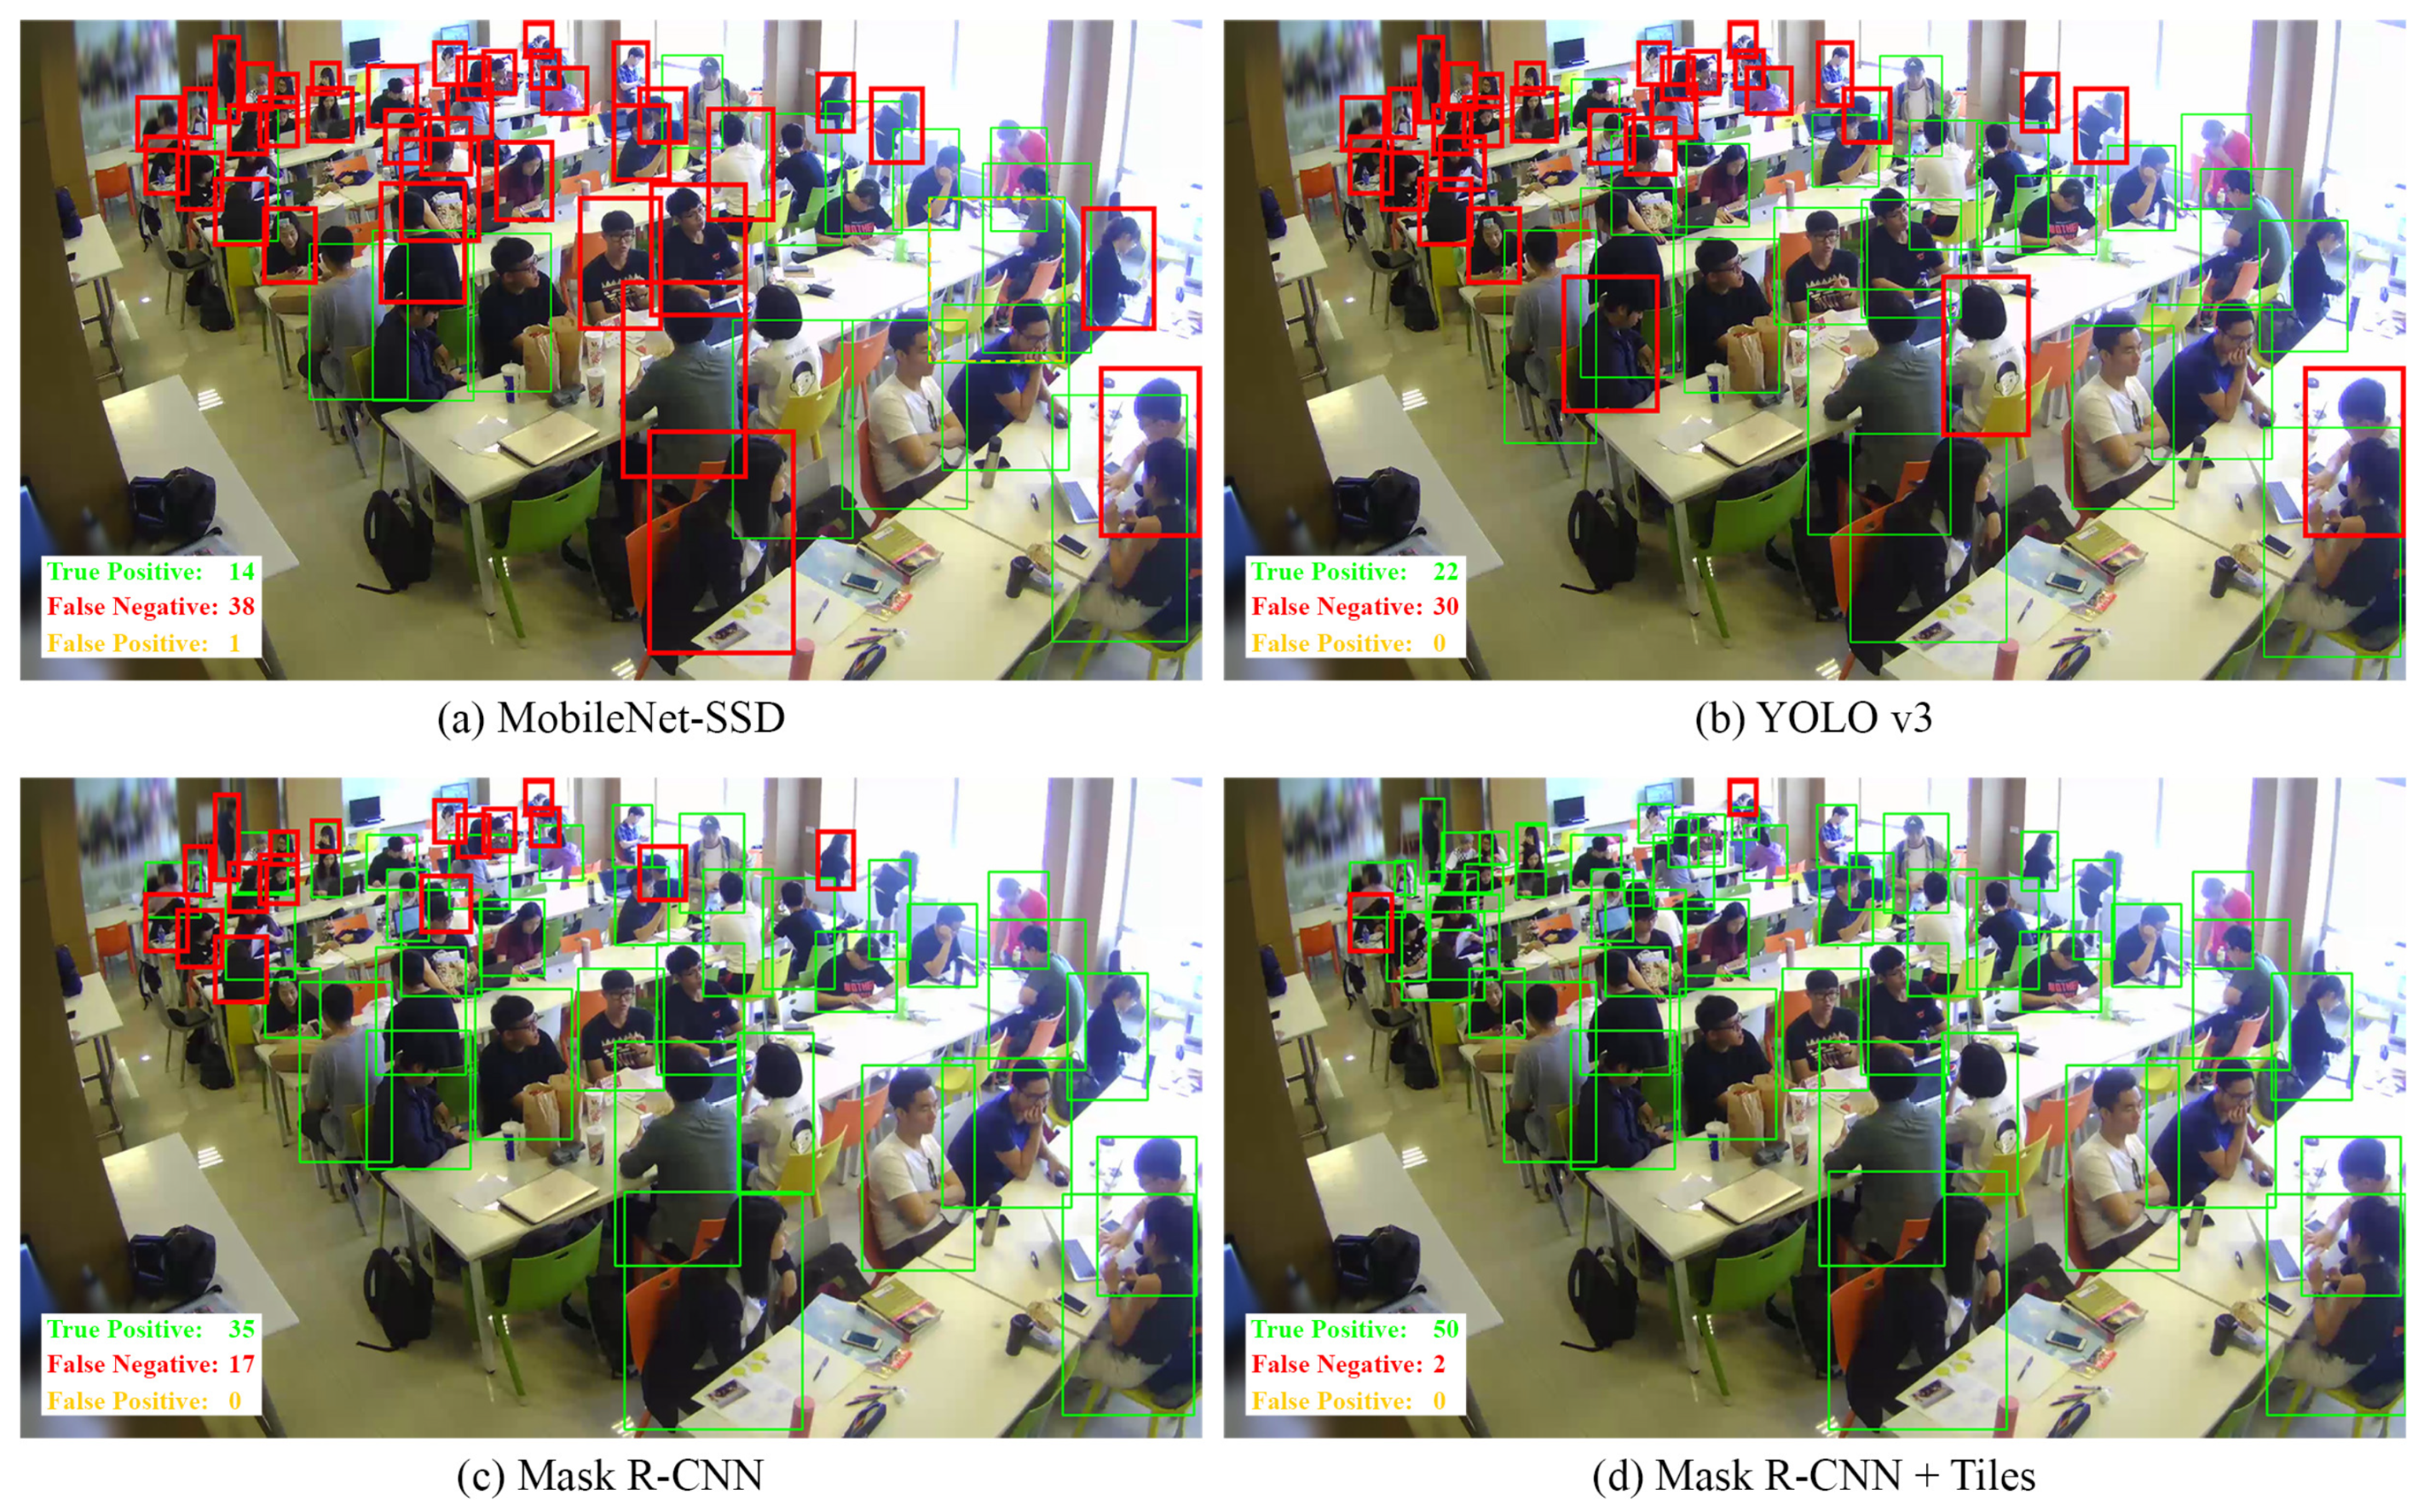
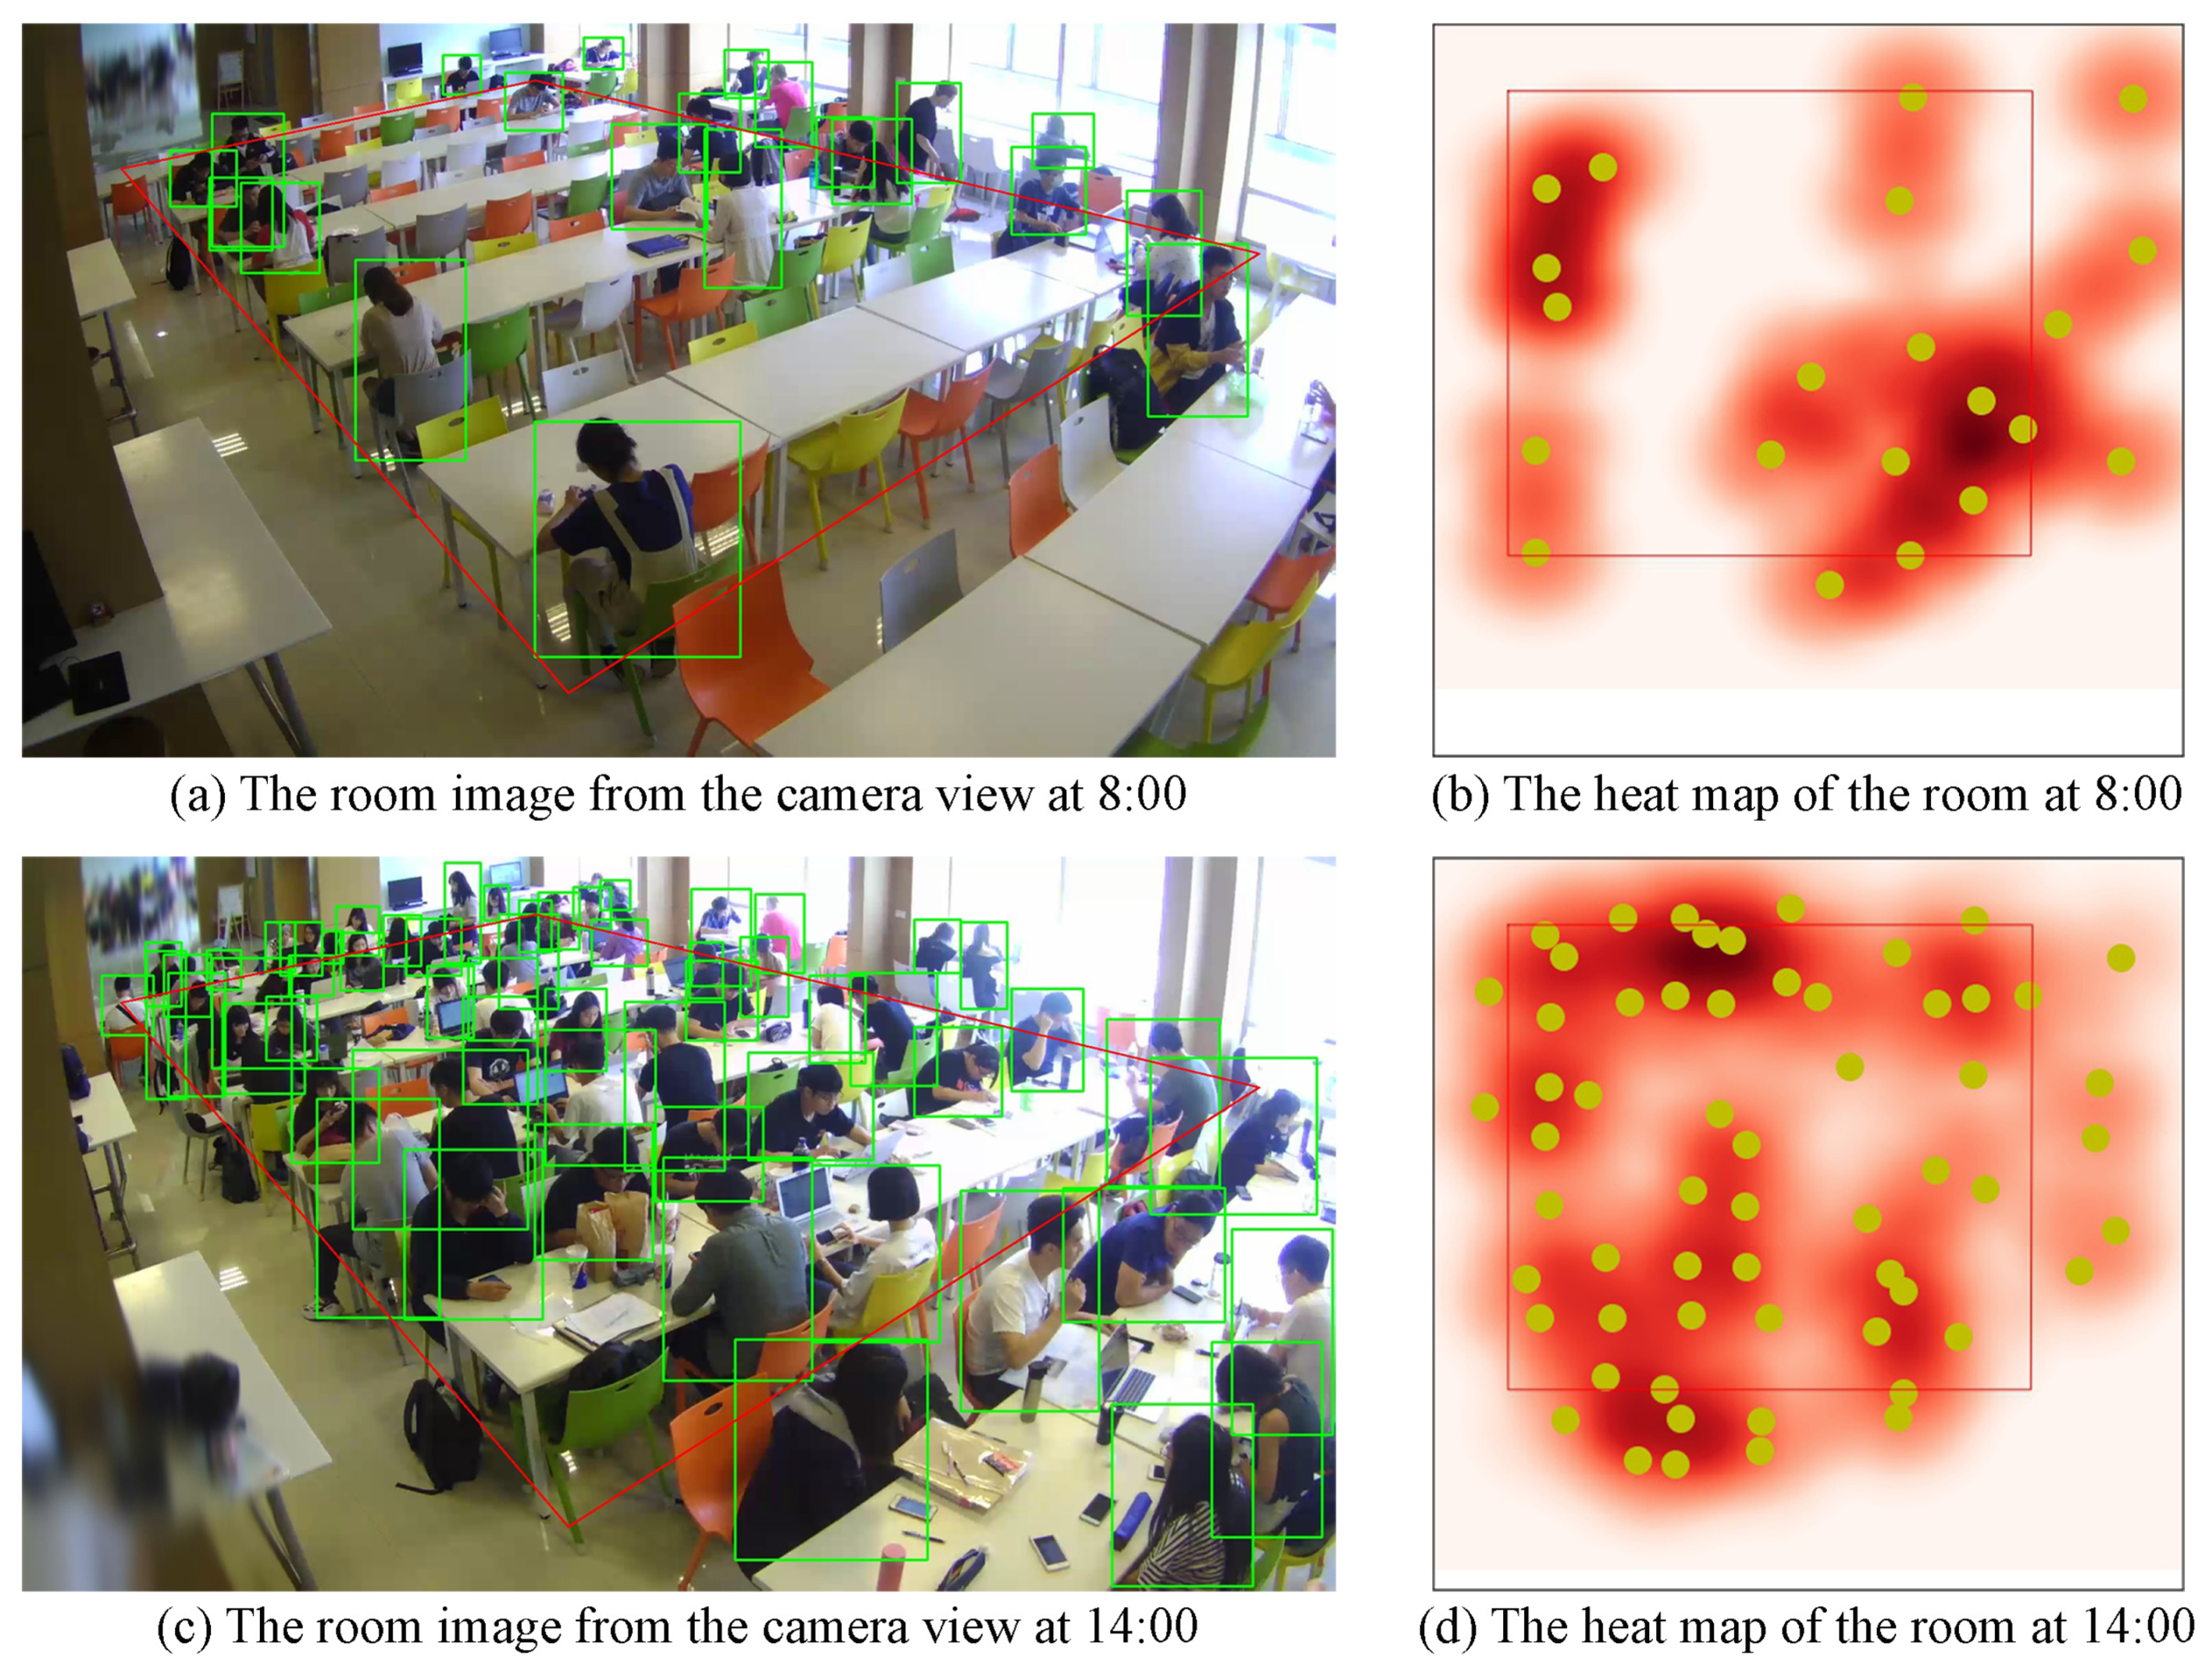
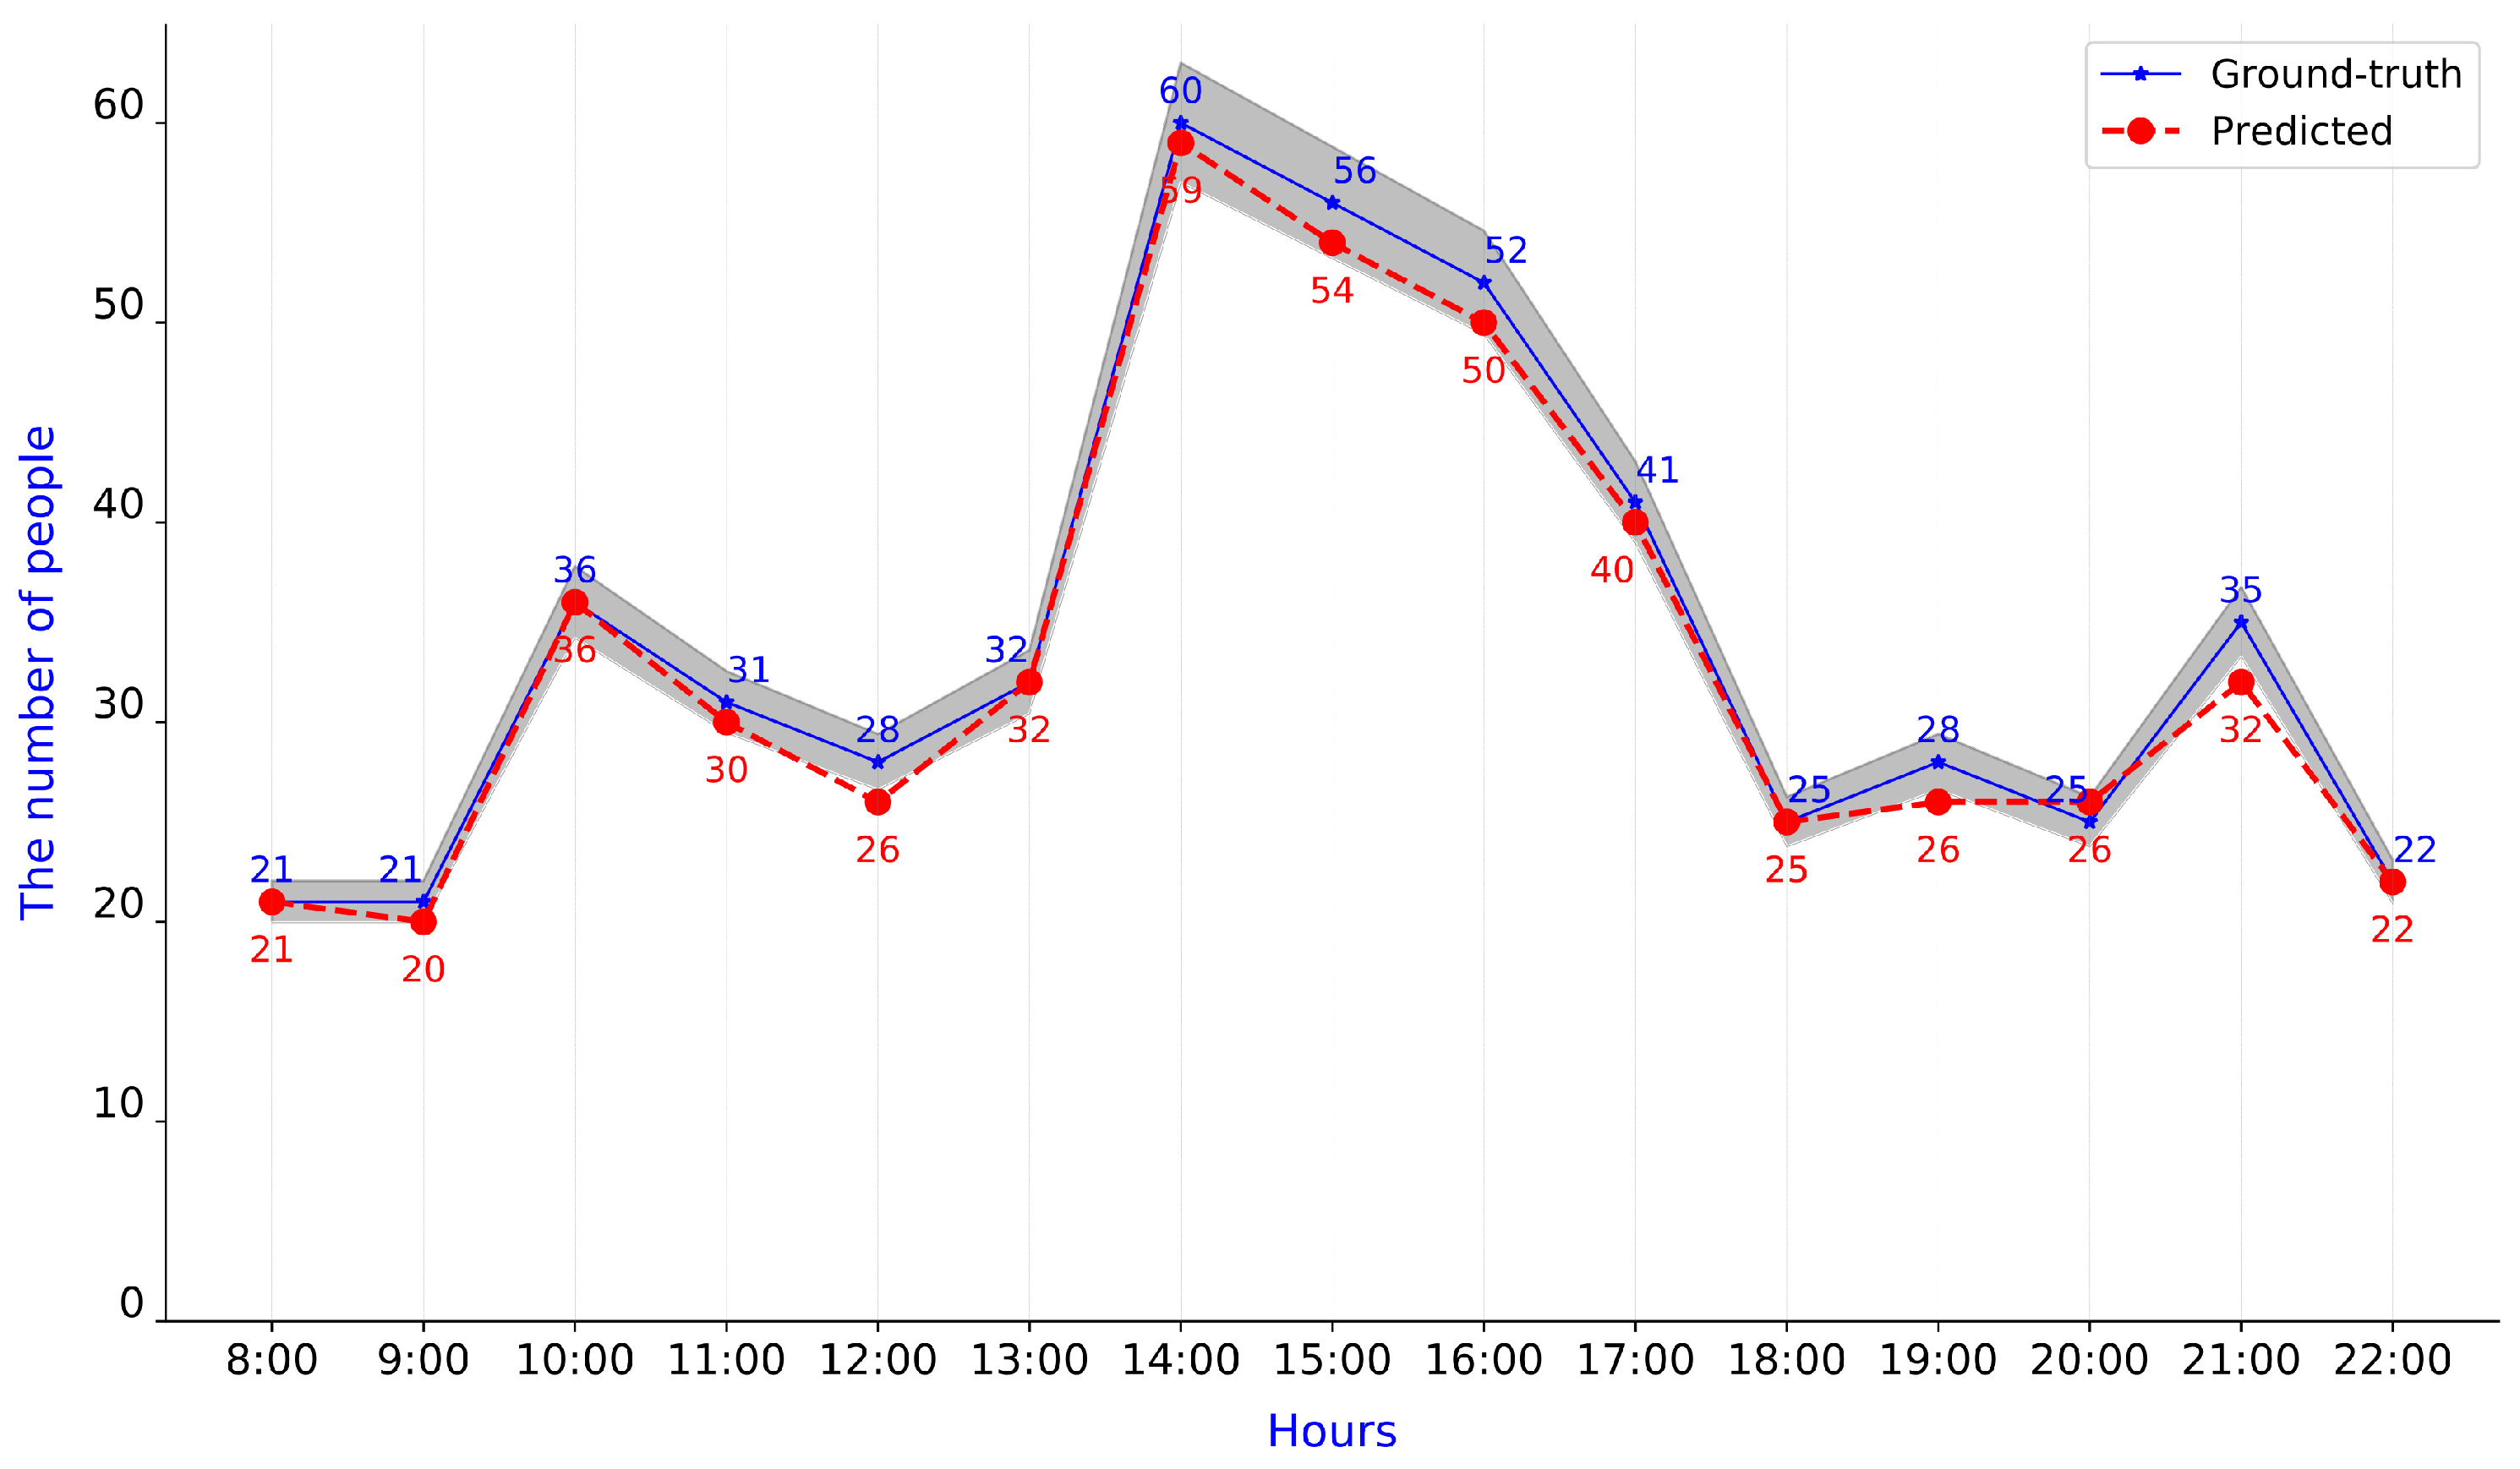
5.4. Analysis of Monitoring System

This section presents an analysis of our proposed system. In this system, users can easily observe and analyze the monitored room in different views, such as a camera view or top view. Additionally, we can quickly determine the hot areas in the room, as shown in Figure 14. This figure shows the reading room at different times, and the yellow points in Figure 14b,d denote people’s positions. Figure 14a,b show room images from the camera view and the room’s heat map at 8:00, respectively. At this time, the density of people is low, and users can easily view the room. When the density of people increases, room monitoring becomes difficult from the camera view, as shown in Figure 14c. However, it is more straightforward from the 2D top-view image and heat map of the room, as shown in Figure 14d.
As mentioned above, our proposed Mask R-CNN + Tiles scheme achieved high accuracy. Figure 15 shows the predicted number of people in the reading room during opening hours from 8:00 to 22:00. In this figure, the gray polygon represents a 10% relative error tolerance region. Figure 15 shows that the highest predicted people count is inside the gray polygon. In other words, this scheme consistently achieved high accuracy. Additionally, we analyzed some information regarding room use. The average number of people in the room is 33.3 per hour. The density of people often reaches a peak from 14:00 to 16:00.
Along with the accuracy, the processing rate is another important factor that affects the performance of the system. The trade-off between accuracy and processing rate is considered when designing and evaluating the system. In the proposed system, density of people was shown on a heat map and refreshed every 10 s owing to the lower frequency and speed of movement in the room. Therefore, our proposed Mask R-CNN + Tiles scheme has an acceptable processing rate of 0.53 frames per second (fps), as shown in Table 2.

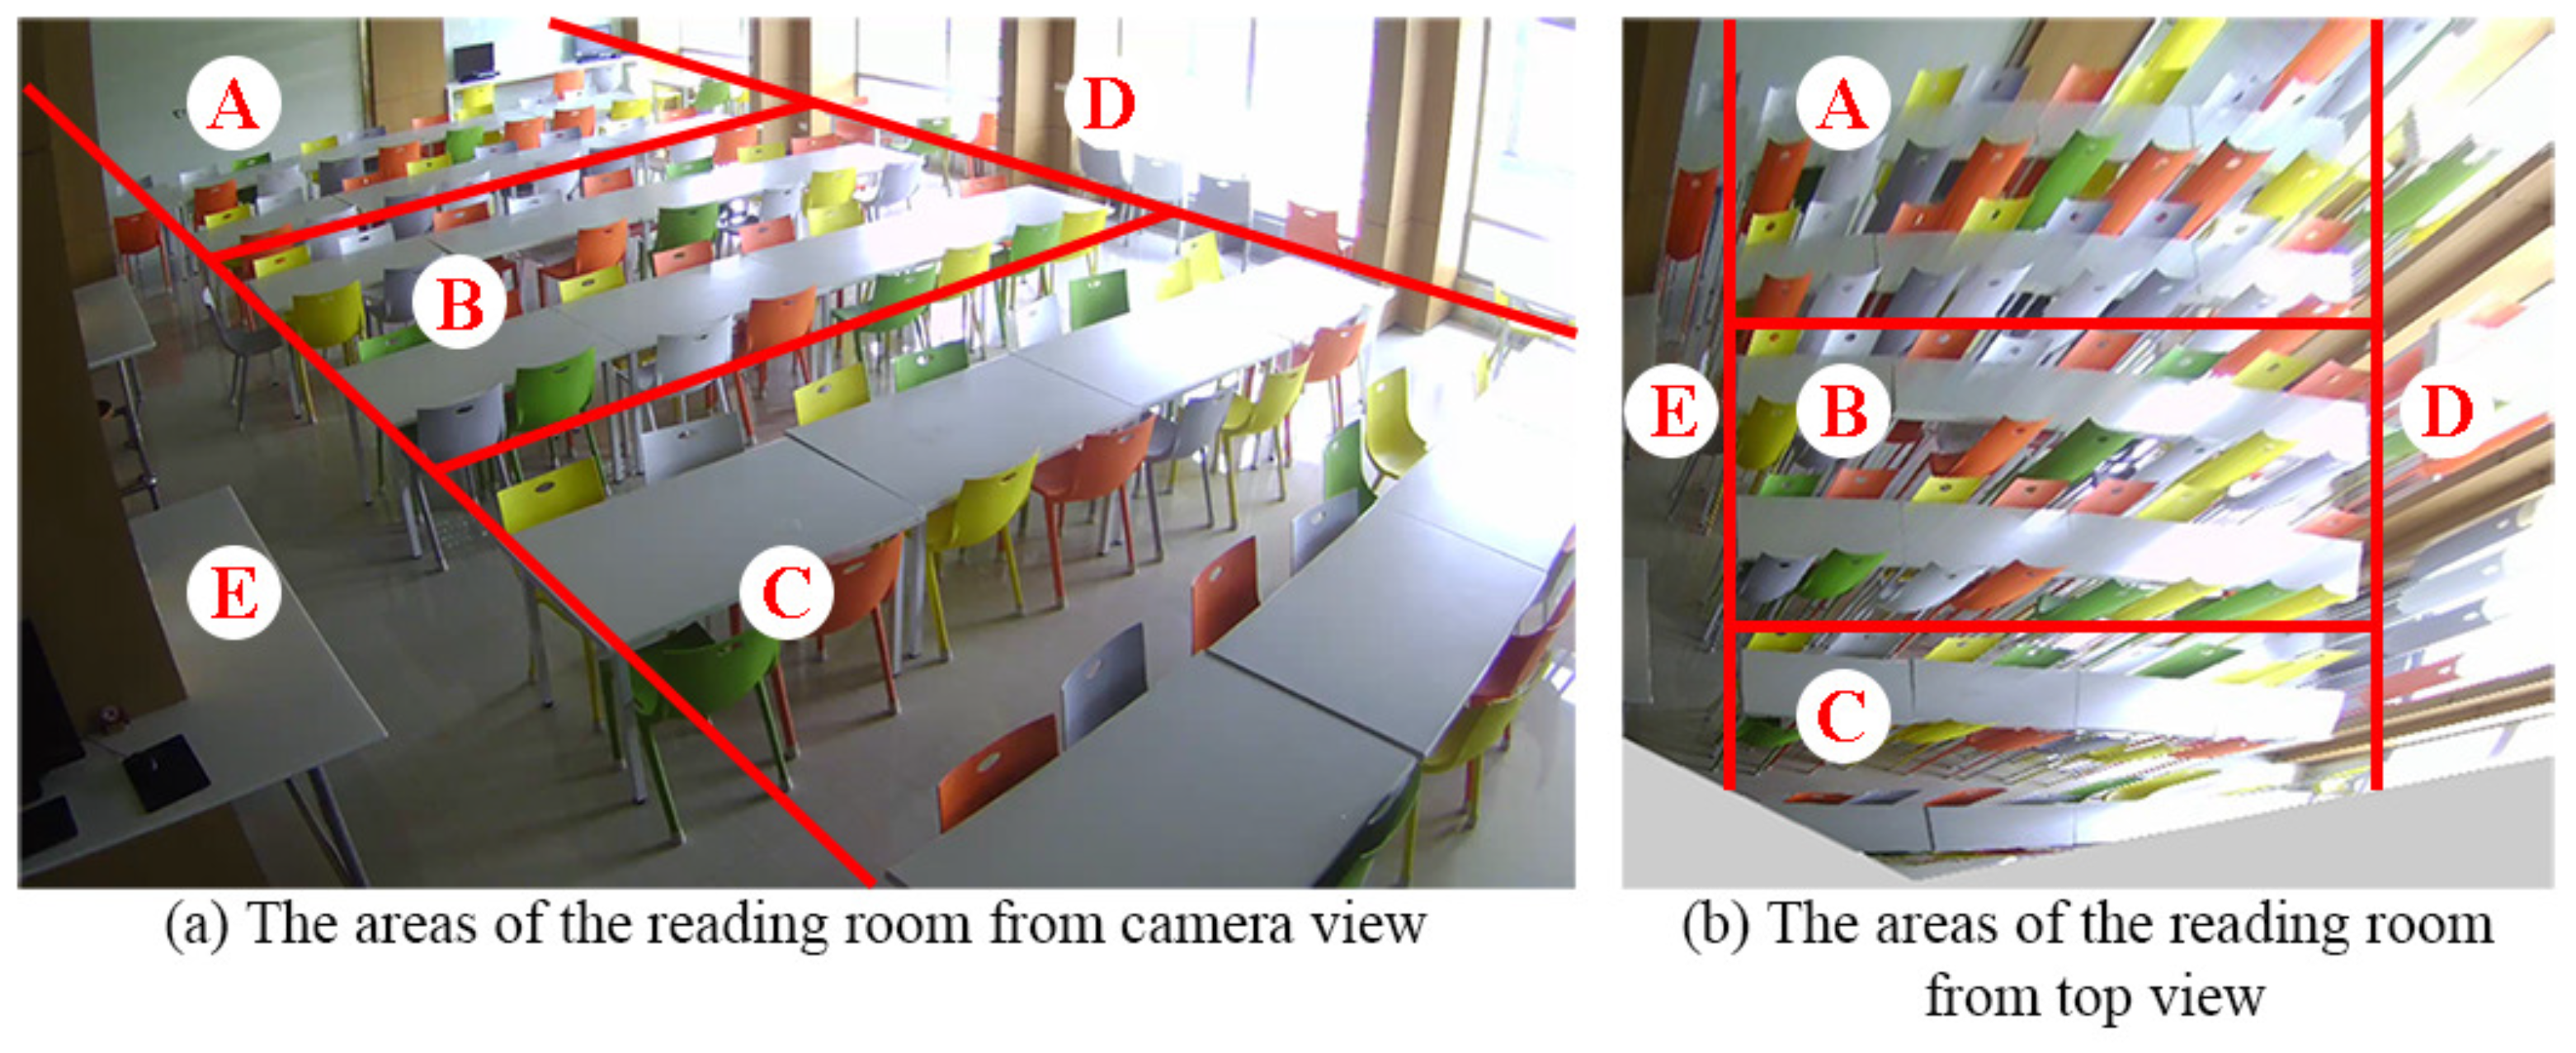
5.5. Evaluation of Used Areas in Room

To evaluate the frequently used areas, they are labeled as shown in Figure 16. After statistical analysis, the average numbers of predicted people per day in different areas are demonstrated as shown in Figure 17. Areas A, B, and C, the main areas of the reading room, have relatively more people than areas D and E. Owing to the smaller sizes and locations (near doors or windows) of tables and chairs in Areas D and E, they have only 81 and 21 people, respectively, compared with 136 people in Area A.

5.6. Summary

In our experiments, the MobileNet-SSD and YOLO v3 schemes exhibited great performance in simple situations. However, these two schemes showed unsatisfactory performance results and many false-negative detections in complicated situations such as crowds of people, small-sized people, and the variety of activities in the room. The Mask R-CNN scheme had better detection in small-sized people, but with many false-negative detections. The proposed Mask R-CNN + Tiles scheme achieved excellent performance, especially for small-sized people far from the camera. By applying the tiles scheme, small-sized people were detected more efficiently. Furthermore, two algorithms were proposed to merge the bounding boxes in the overlapping areas. In the room monitoring system, it is a common situation where the objects in the upper part of the image look small owing to their distance from the camera.

6. Conclusions

This study examined a room monitoring system using deep learning and perspective correction techniques. It also proposed a new person detection scheme that combines the Mask R-CNN scheme and the tile technique, including two algorithms to merge bounding boxes. For person detection, this study compared the proposed Mask R-CNN + Tiles scheme with the MobileNet-SSD, YOLO v3, and Mask R-CNN schemes. The results showed that the proposed scheme outperformed the MobileNet-SSD, YOLO v3, and Mask R-CNN schemes in terms of detection accuracy, MAE, and RMSE. Further, analyses and evaluations of the results indicated that our proposed system was practical and provided outstanding performance. Additionally, new person coordinates in the 2D image were generated from the final bounding boxes and a heat map was created based on the 2D image; these should enable users to examine the system quickly in different views.
There are two assumptions of our system. Firstly, the video camera has to send an image to our machine (GPU-based computational environment) every 10 s. Basically, traditional video cameras do not provide ftp client service, therefore, we installed a virtual machine (using Oracle VM VirtualBox tool to run Windows 7) in our operating system (Windows 10) to open the full screen of IE browser and send the images of the browser to our back-end ftp server for analysis. In addition, we wrote an image capture program (Python code) for the virtual machine and that enabled images to be sent to our provided ftp server every 10 s for people counting service in our GPU-based machine. Secondly, the study is run on a single machine and the computing time will be doubled if two or more than two images are simultaneously processed. Therefore, we set process schedule for the incoming images because one image can be processed by one GPU card at a time.
There are many limitations when identifying people in spatial images and some improvements can be made in the future to increase the accuracy of identification. For example, two or more video cameras can be mounted in front, front left and front right of target people in a computer lab to avoid the situation where people are blocked by their computers. When outdoors, we can place video cameras on the path where people walk to collect images. It is also important to avoid occlusion, such as the occlusion of leaves. The less people are concealed, the better the image is. In addition, images captured by a single video camera can hardly provide enough people information for accurately calculating the amount of people. Therefore, it is suggested that at least two video cameras are used to perform target capture and increase the accuracy of identification through cross-comparison of the images.
In the future, we will improve the processing time of this system by applying parallel processing techniques and continue to collect and analyze data for the system. We also intend to extend this system to other areas such as retail stores and supermarkets.

Author Contributions

H.-H.N. and F.-C.L. conceived and designed the experiments; H.-H.N. performed the experiments; F.-C.L., Y.-T.S., M.T., and C.-R.D. analyzed the data and contributed to the materials and analysis tools; H.-H.N. and F.-C.L. wrote the manuscript. Finally, Y.-T.S., M.T., and C.-R.D. gave relevant materials and valuable comments for this paper. All authors have read and agreed to the published version of the manuscript.

Funding

The proposed system has been successfully put into practice to develop several projects, including people counting for reading and computer rooms in Feng Chia University. In the future, this system will be implemented to supervise people and generate real-time alerts when they fail to follow social distancing rules during a pandemic.

Acknowledgments

This work was supported by the Ministry of Science and Technology, Republic of China (Grant Number: MOST107-2119-M-035-006). We also thank our many research assistants and colleagues in Feng Chia University for image collection and manual labeling.

Conflicts of Interest

The authors declare no conflict of interest.

References

  1. Tariq, O.B.; Lazarescu, M.T.; Iqbal, J.; Lavagno, L. Performance of machine learning classifiers for indoor person localization with capacitive sensors. IEEE Access 2017, 5, 12913–12926. [Google Scholar] [CrossRef]
  2. Setiawan, A.; Yazid, A.S.; Wahyudi, M.D.R. Room monitoring system using openWRT-based webcam. Int. J. Inform. Dev. 2015, 4, 15–23. [Google Scholar] [CrossRef] [Green Version]
  3. Mahamad, A.K.; Saon, S.; Hashim, H.; Ahmadon, M.A.; Yamaguchi, S. Cloud-based people counter. Bull. Electr. Eng. Inform. 2020, 9, 284–291. [Google Scholar] [CrossRef]
  4. Lee, G.C.; Lee, S.H.; Yoo, J. 3-D people counting with a stereo camera on gpu embedded board. Appl. Sci. 2018, 8, 2017. [Google Scholar] [CrossRef] [Green Version]
  5. Nogueira, V.; Oliveira, H.; Silva, J.A.; Vieira, T.; Oliveira, K. RetailNet: A deep learning approach for people counting and hot spots detection in retail stores. In Proceedings of the 32nd SIBGRAPI Conference on Graphics, Patterns and Images (SIBGRAPI), Rio de Janeiro, Brazil, 28–31 October 2019; pp. 155–162. [Google Scholar]
  6. Dow, C.R.; Ngo, H.H.; Lee, L.H.; Lai, P.Y.; Wang, K.C.; Bui, V.T. A crosswalk pedestrian recognition system by using deep learning and zebra-crossing recognition techniques. Softw. Pract. Exp. 2019, 1–15. [Google Scholar] [CrossRef]
  7. Kiran, A.G.; Murali, S. Automatic rectification of perspective distortion from a single image using plane homography. Int. J. Comput. Sci. Appl. 2013, 3, 47–58. [Google Scholar]
  8. Yang, S.J.; Ho, C.C.; Chen, J.Y.; Chang, C.Y. Practical homography-based perspective correction method for license plate recognition. In Proceedings of the 2012 International Conference on Information Security and Intelligent Control, Yunlin, Taiwan, 14–16 August 2012; pp. 198–201. [Google Scholar]
  9. Suran, K. QR code image correction based on corner detection and convex hull algorithm. J. Multimed. 2013, 8, 662–668. [Google Scholar]
  10. Li, K.; Meng, F.; Huang, Z.; Wang, Q. A correction algorithm of QR code on cylindrical surface. J. Phys. Conf. Ser. 2019, 1237, 1–6. [Google Scholar] [CrossRef]
  11. Santana-Cedrés, D.; Gomez, L.; Alemán-Flores, M.; Salgado, A.; Esclarín, J.; Mazorra, L.; Alvarez, L. Automatic correction of perspective and optical distortions. Comput. Vis. Image Underst. 2017, 161, 1–10. [Google Scholar] [CrossRef]
  12. Yang, S.; Lin, C.; Liao, K.; Zhao, Y.; Liu, M. Unsupervised fisheye image correction through bidirectional loss with geometric prior. J. Vis. Commun. Image Represent. 2020, 66, 1–10. [Google Scholar] [CrossRef]
  13. Rong, J.; Huang, S.; Shang, Z.; Ying, X. Radial lens distortion correction using convolutional neural networks trained with synthesized images. In Proceedings of the 13th Asian Conference on Computer Vision (ACCV’16), Taipei, Taiwan, 20–24 November 2016; pp. 35–49. [Google Scholar]
  14. Yin, X.; Wang, X.; Yu, J.; Zhang, M.; Fua, P.; Tao, D. FishEyeRecNet: A multi-context collaborative deep network for fisheye image rectification. In Proceedings of the European Conference on Computer Vision (ECCV), Munich, Germany, 8–14 September 2018; pp. 469–484. [Google Scholar]
  15. Lőrincz, S.B.; Pável, S.; Csató, L. Single view distortion correction using semantic guidance. In Proceedings of the 2019 International Joint Conference on Neural Networks (IJCNN), Budapest, Hungary, 14–19 July 2019; pp. 1–6. [Google Scholar]
  16. Liao, K.; Lin, C.; Zhao, Y.; Gabbouj, M. DR-GAN: Automatic radial distortion rectification using conditional gan in real-time. IEEE Trans. Circuits Syst. Video Technol. 2020, 30, 725–733. [Google Scholar] [CrossRef]
  17. Ren, S.; He, K.; Girshick, R.; Sun, J. Faster R-CNN: Towards real-time object detection with region proposal networks. Adv. Neural Inf. Process. Syst. 2015, 28, 91–99. [Google Scholar] [CrossRef] [PubMed] [Green Version]
  18. Liu, W.; Anguelov, D.; Erhan, D.; Szegedy, C.; Reed, S.; Fu, C.Y.; Berg, A.C. SSD: Single shot multibox detector. arXiv 2016, arXiv:1512.02325. [Google Scholar]
  19. Redmon, J.; Farhadi, A. YOLOv3: An incremental improvement. arXiv 2018, arXiv:1804.02767. [Google Scholar]
  20. Lin, T.Y.; Goyal, P.; Girshick, R.; He, K.; Dollar, P. Focal loss for dense object detection. In Proceedings of the IEEE International Conference on Computer Vision (ICCV), Venice, Italy, 22–29 October 2017; pp. 2980–2988. [Google Scholar]
  21. He, K.; Gkioxari, G.; Dollár, P.; Girshick, R. Mask R-CNN. arXiv 2018, arXiv:1703.06870. [Google Scholar]
  22. Girshick, R.; Donahue, J.; Darrell, T.; Malik, J. Rich feature hierarchies for accurate object detection and semantic segmentation. In Proceedings of the IEEE Conference on Computer Vision and Pattern Recognition, Columbus, OH, USA, 23–28 June 2014; pp. 580–587. [Google Scholar]
  23. Girshick, R. Fast R-CNN. In Proceedings of the IEEE International Conference on Computer Vision, Santiago, Chile, 7–13 December 2015; pp. 1440–1448. [Google Scholar]
  24. Plastiras, G.; Kyrkou, C.; Theocharides, T. Efficient convnet-based object detection for unmanned aerial vehicles by selective tile processing. In Proceedings of the 12th International Conference on Distributed Smart Cameras, Eindhoven, The Netherlands, 3–4 September 2018; pp. 1–6. [Google Scholar]
  25. Růžička, V.; Franchetti, F. Fast and accurate object detection in high resolution 4K and 8K video using GPUs. In Proceedings of the 2018 IEEE High Performance Extreme Computing Conference (HPEC), Waltham, MA, USA, 25–27 September 2018; pp. 1–7. [Google Scholar]
  26. Unel, F.O.; Ozkalayci, B.O.; Cigla, C. The power of tiling for small object detection. In Proceedings of the IEEE Conference on Computer Vision and Pattern Recognition (CVPR) Workshops, Long Beach, CA, USA, 16–20 June 2019; pp. 1–10. [Google Scholar]
  27. Wang, Y.; Zhang, Y.; Zhang, Y.; Zhao, L.; Sun, X.; Guo, Z. SARD: Towards scale-aware rotated object detection in aerial imagery. IEEE Access 2019, 7, 173855–173865. [Google Scholar] [CrossRef]
  28. Ward, S.; Gittens, M.; Rock, N.; James, K. CampusEMonitor: Intelligent campus environment room monitoring system. In Proceedings of the 2019 ACM SIGUCCS Annual Conference, New Orleans, LA, USA, 3–6 October 2019; pp. 165–172. [Google Scholar]
  29. An, J.; Chung, W.Y. Wavelength-division multiplexing optical transmission for EMI-free indoor fine particulate matter monitoring. IEEE Access 2018, 6, 74885–74894. [Google Scholar] [CrossRef]
  30. Htun, S.N.N.; Zin, T.T.; Hama, H. Virtual grounding point concept for detecting abnormal and normal events in home care monitoring systems. Appl. Sci. 2020, 10, 3005. [Google Scholar] [CrossRef]
  31. Basalamah, S.; Khan, S.D.; Ullah, H. Scale driven convolutional neural network model for people counting and localization in crowd scenes. IEEE Access 2019, 7, 71576–71584. [Google Scholar] [CrossRef]
  32. Anh, B.N.; Son, N.T.; Lam, P.T.; Chi, L.P.; Tuan, N.H.; Dat, N.C.; Trung, N.H.; Aftab, M.U.; Dinh, T.V. A computer-vision based application for student behavior monitoring in classroom. Appl. Sci. 2019, 9, 4729. [Google Scholar]
  33. Jiang, B.; Xu, W.; Guo, C.; Liu, W.; Cheng, W. A classroom concentration model based on computer vision. In Proceedings of the ACM Turing Celebration Conference-China (ACM TURC 2019), Chengdu, China, 17–19 May 2019; pp. 1–6. [Google Scholar]
  34. Matilda, S.; Shahin, K. Student attendance monitoring system using image processing. In Proceedings of the 2019 IEEE International Conference on System, Computation, Automation and Networking (ICSCAN), Puducherry, India, 29–30 March 2019; pp. 1–4. [Google Scholar]
  35. Liu, Z.; Wang, S.; Ding, X. ROI perspective transform based road marking detection and recognition. In Proceedings of the 2012 International Conference on Audio, Language and Image Processing, Shanghai, China, 16–18 July 2012; pp. 841–846. [Google Scholar]
  36. Li, X.; Li, S.; Bai, W.; Cui, X.; Yang, G.; Zhou, H.; Zhang, C. Method for rectifying image deviation based on perspective transformation. IOP Conf. Ser. Mater. Sci. Eng. 2017, 231, 1–6. [Google Scholar] [CrossRef] [Green Version]
  37. Ansari, I.; Lee, Y.; Jeong, Y.; Shim, J. Recognition of car manufacturers using faster R-CNN and perspective transformation. J. Korea Multimed. Soc. 2018, 21, 888–896. [Google Scholar]
  38. Ansari, I.; Shim, J. Brief paper: Vehicle manufacturer recognition using deep learning and perspective transformation. J. Multimed. Inf. Syst. 2019, 6, 235–238. [Google Scholar] [CrossRef]
  39. Geometric Image Transformations. Available online: https://docs.opencv.org/2.4/modules/imgproc/doc/geometric_transformations.html (accessed on 22 December 2019).
  40. Chen, Y.C. A tutorial on kernel density estimation and recent advances. arXiv 2017, arXiv:1704.03924. [Google Scholar] [CrossRef]
  41. Mask R-CNN. Available online: https://github.com/matterport/Mask_RCNN (accessed on 15 November 2019).
  42. Lin, T.Y.; Dollár, P.; Girshick, R.; He, K.; Hariharan, B.; Belongie, S. Feature pyramid networks for object detection. In Proceedings of the IEEE Conference on Computer Vision and Pattern Recognition (CVPR), Honolulu, HI, USA, 21–26 July 2017; pp. 2117–2125. [Google Scholar]
  43. He, K.; Zhang, X.; Ren, S.; Sun, J. Deep residual learning for image recognition. In Proceedings of the 2016 IEEE Conference on Computer Vision and Pattern Recognition (CVPR), Las Vegas, NV, USA, 27–30 June 2016; pp. 770–778. [Google Scholar]
  44. COCO—Common Objects in Context. Available online: http://cocodataset.org/#home (accessed on 15 November 2019).
  45. Rezatofighi, H.; Tsoi, N.; Gwak, J.; Sadeghian, A.; Reid, I.; Savarese, S. Generalized intersection over union: A metric and a loss for bounding box regression. In Proceedings of the IEEE Conference on Computer Vision and Pattern Recognition (CVPR), Long Beach, CA, USA, 16–20 June 2019; pp. 658–666. [Google Scholar]
  46. Intersection over Union (IoU) for Object Detection. Available online: https://www.pyimagesearch.com/2016/11/07/intersection-over-union-iou-for-object-detection/ (accessed on 22 December 2019).
  47. MobileNet-SSD. Available online: https://github.com/chuanqi305/MobileNet-SSD (accessed on 15 November 2019).
  48. Karnalim, O.; Budi, S.; Santoso, S.; Handoyo, E.D.; Toba, H.; Nguyen, H.; Malhotra, V. FACE—Face at classroom environment: Dataset and exploration. In Proceedings of the 2018 Eighth International Conference on Image Processing Theory, Tools and Applications (IPTA), Xi’an, China, 7–10 November 2018; pp. 1–6. [Google Scholar]
  49. Bondi, E.; Seidenari, L.; Bagdanov, A.D.; Bimbo, A.D. Real-time people counting from depth imagery of crowded environments. In Proceedings of the 11th IEEE International Conference on Advanced Video and Signal Based Surveillance (AVSS 2014), Seoul, Korea, 26–29 August 2014; pp. 337–342. [Google Scholar]
  50. PIROPO Dataset. Available online: https://sites.google.com/view/visionlearning/databases/piropo-database (accessed on 5 March 2020).
  51. Abu-El-Haija, S.; Kothari, N.; Lee, J.; Natsev, P.; Toderici, G.; Varadarajan, B.; Vijayanarasimhan, S. YouTube-8M: A large-scale video classification benchmark. arXiv 2016, arXiv:1609.08675. [Google Scholar]
  52. YouTube-8M Video. Available online: https://youtu.be/UHz4fh93SOc (accessed on 5 March 2020).
Figure 1. System overview.
Applsci 10 04423 g001
Figure 2. Perspective correction process.
Applsci 10 04423 g002
Figure 3. Proposed person detection process.
Applsci 10 04423 g003
Figure 4. Illustration of tile images.
Applsci 10 04423 g004
Figure 5. Mask region-based convolutional neural network (R-CNN) framework for instance segmentation [21].
Applsci 10 04423 g005
Figure 6. Illustration of an object residing on the border.
Applsci 10 04423 g006
Figure 7. Web-based user interface.
Applsci 10 04423 g007
Figure 8. Recall values of four schemes.
Applsci 10 04423 g008
Figure 9. Precision values of four schemes.
Applsci 10 04423 g009
Figure 10. Comparison of MobileNet-SSD, YOLO v3, Mask R-CNN, and Mask R-CNN + Tiles detection schemes for reading room dataset.
Applsci 10 04423 g010
Figure 11. Mean absolute error of four schemes.
Applsci 10 04423 g011
Figure 12. Root mean squared error of four schemes.
Applsci 10 04423 g012
Figure 13. The detection results of Mask R-CNN + Tiles scheme on five datasets.
Applsci 10 04423 g013
Figure 14. Heat map of reading room.
Applsci 10 04423 g014
Figure 15. Predicted number of people in reading room following the timeline.
Applsci 10 04423 g015
Figure 16. Labeling areas in the reading room.
Applsci 10 04423 g016
Figure 17. Predicted number of people in areas.
Applsci 10 04423 g017
Table 1. Testing dataset description.
DatasetsResolution of ImageNumber of Images UsedNumber of PeopleAverage Number of People Per Image
Classroom1024 × 1024,
1024 × 576,
576 × 1024
1007387.38
MICC people counting640 × 4801008858.85
PIROPO704 × 5761004314.31
YouTube-8M1440 × 1080100183618.36
Reading room1920 × 1072100240124.01
Table 2. Processing rate of four schemes.
SchemesMobileNet-SSDYOLO v3Mask R-CNNMask R-CNN + Tiles
Processing rate
(fps)
14.083.972.050.53

