Quantitative Analysis of Drag Reduction Methods for Blunt Shaped Automobiles


Abstract
1. Introduction
Layout of Paper
2. Literature Review
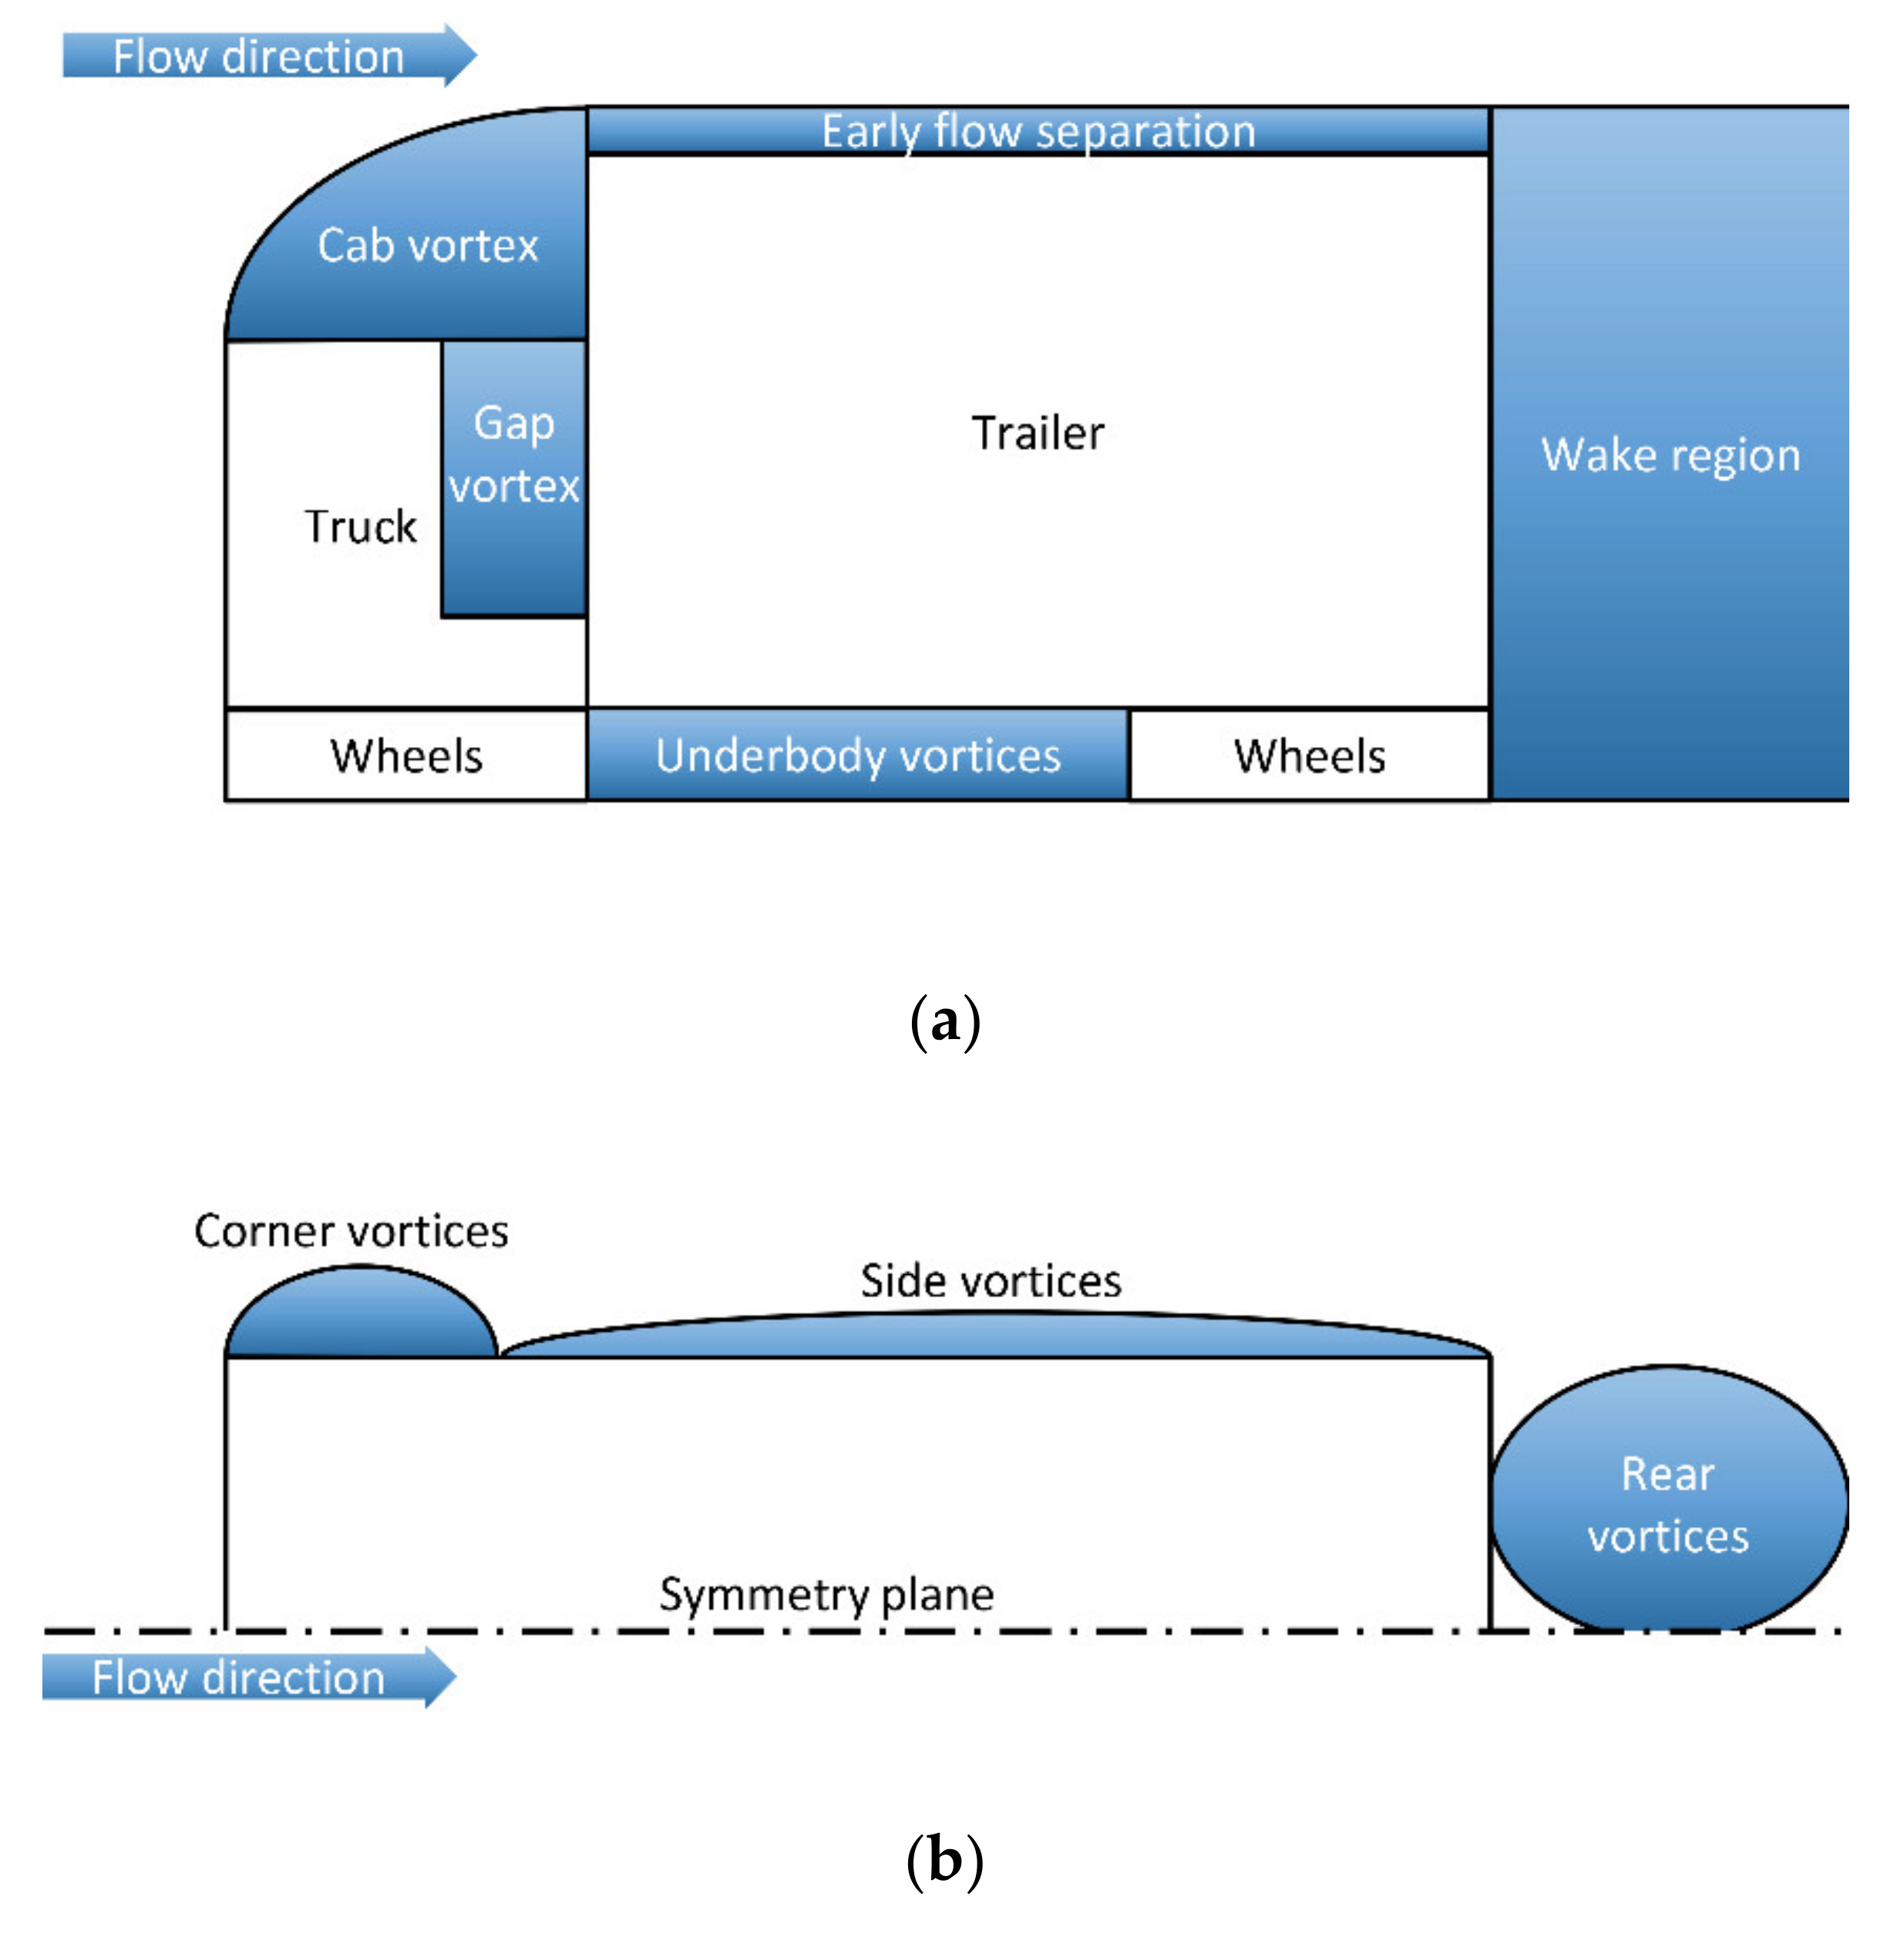
- What typical flow structures are created around a vehicle?
- What methods were used to reduce drag in the past decade?
- From the available methods, can active systems, shape, or topology optimization be a viable solution to reduce drag?
- What are the drag reduction capability limits for different methods?
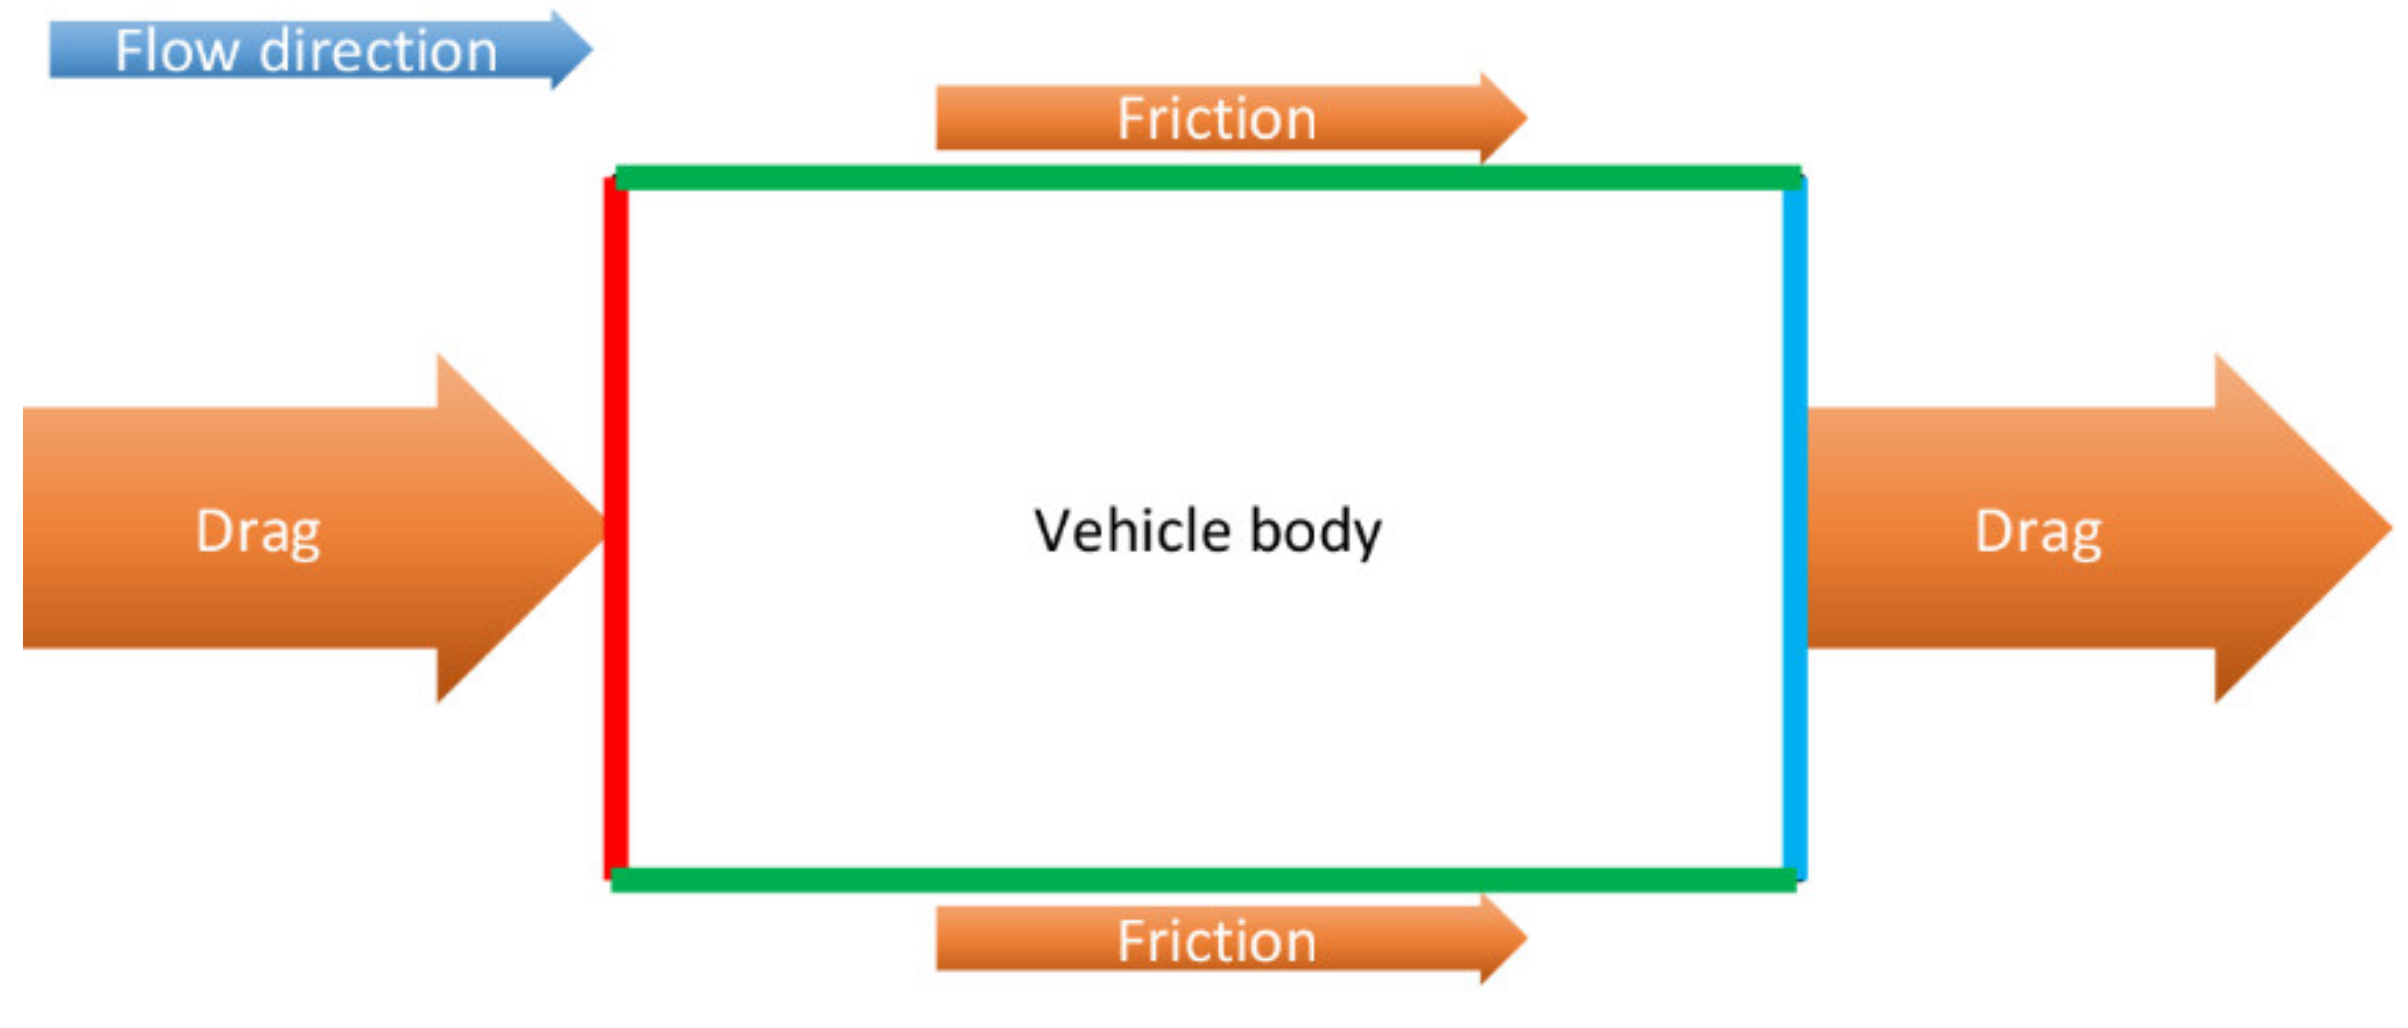
2.1. Aerodynamic Drag
2.1.1. Particle Image Velocimetry
2.1.2. Numerical Models
2.2. Vehicle Shapes
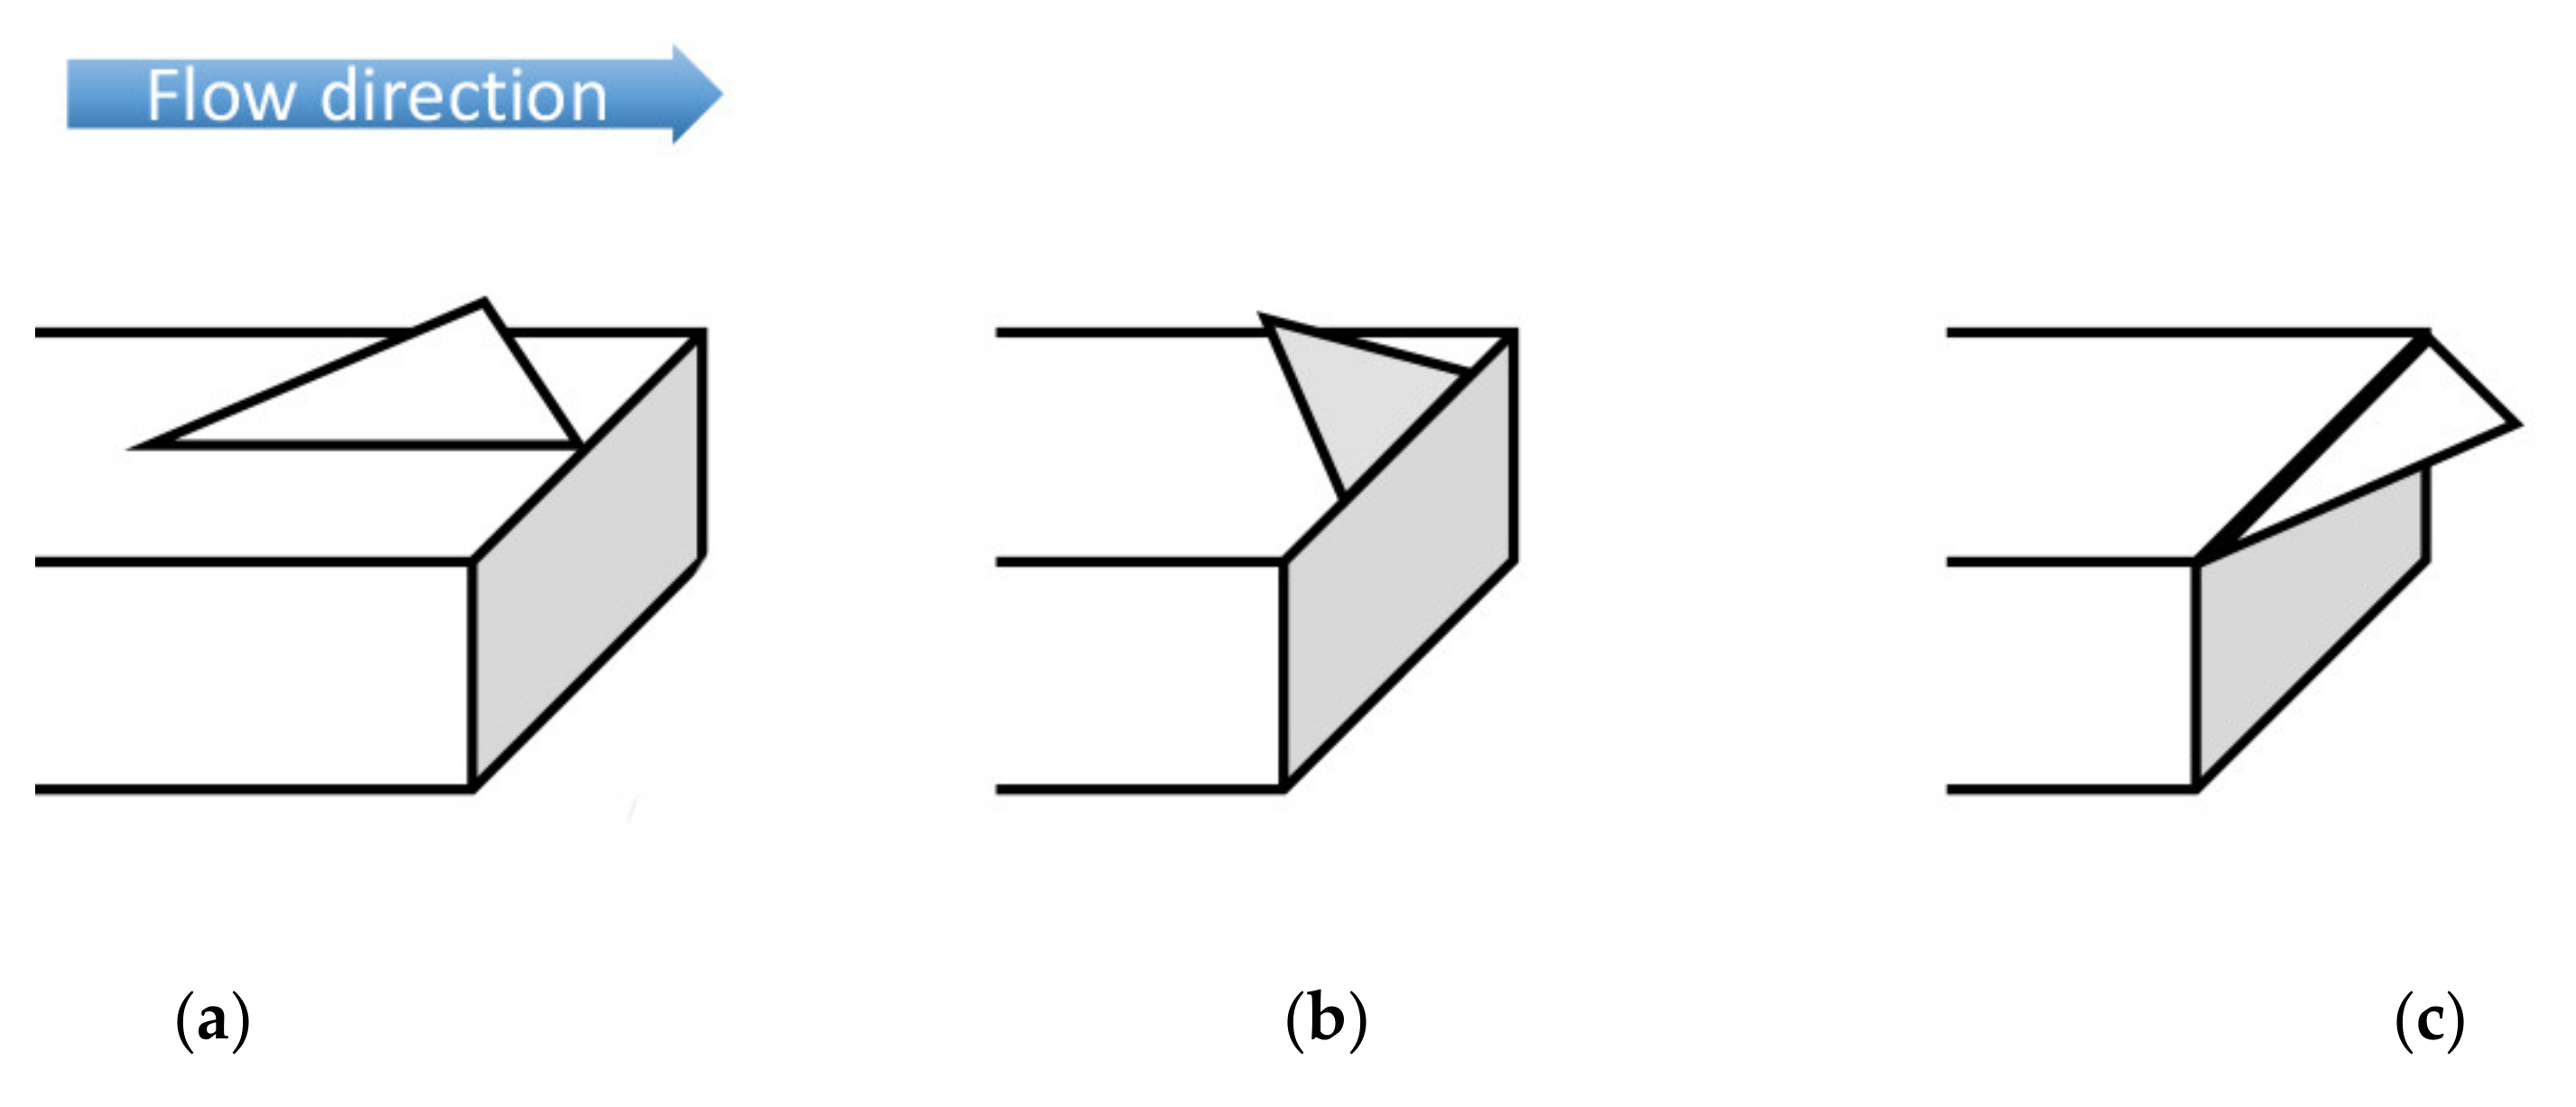
2.2.1. Hatchback
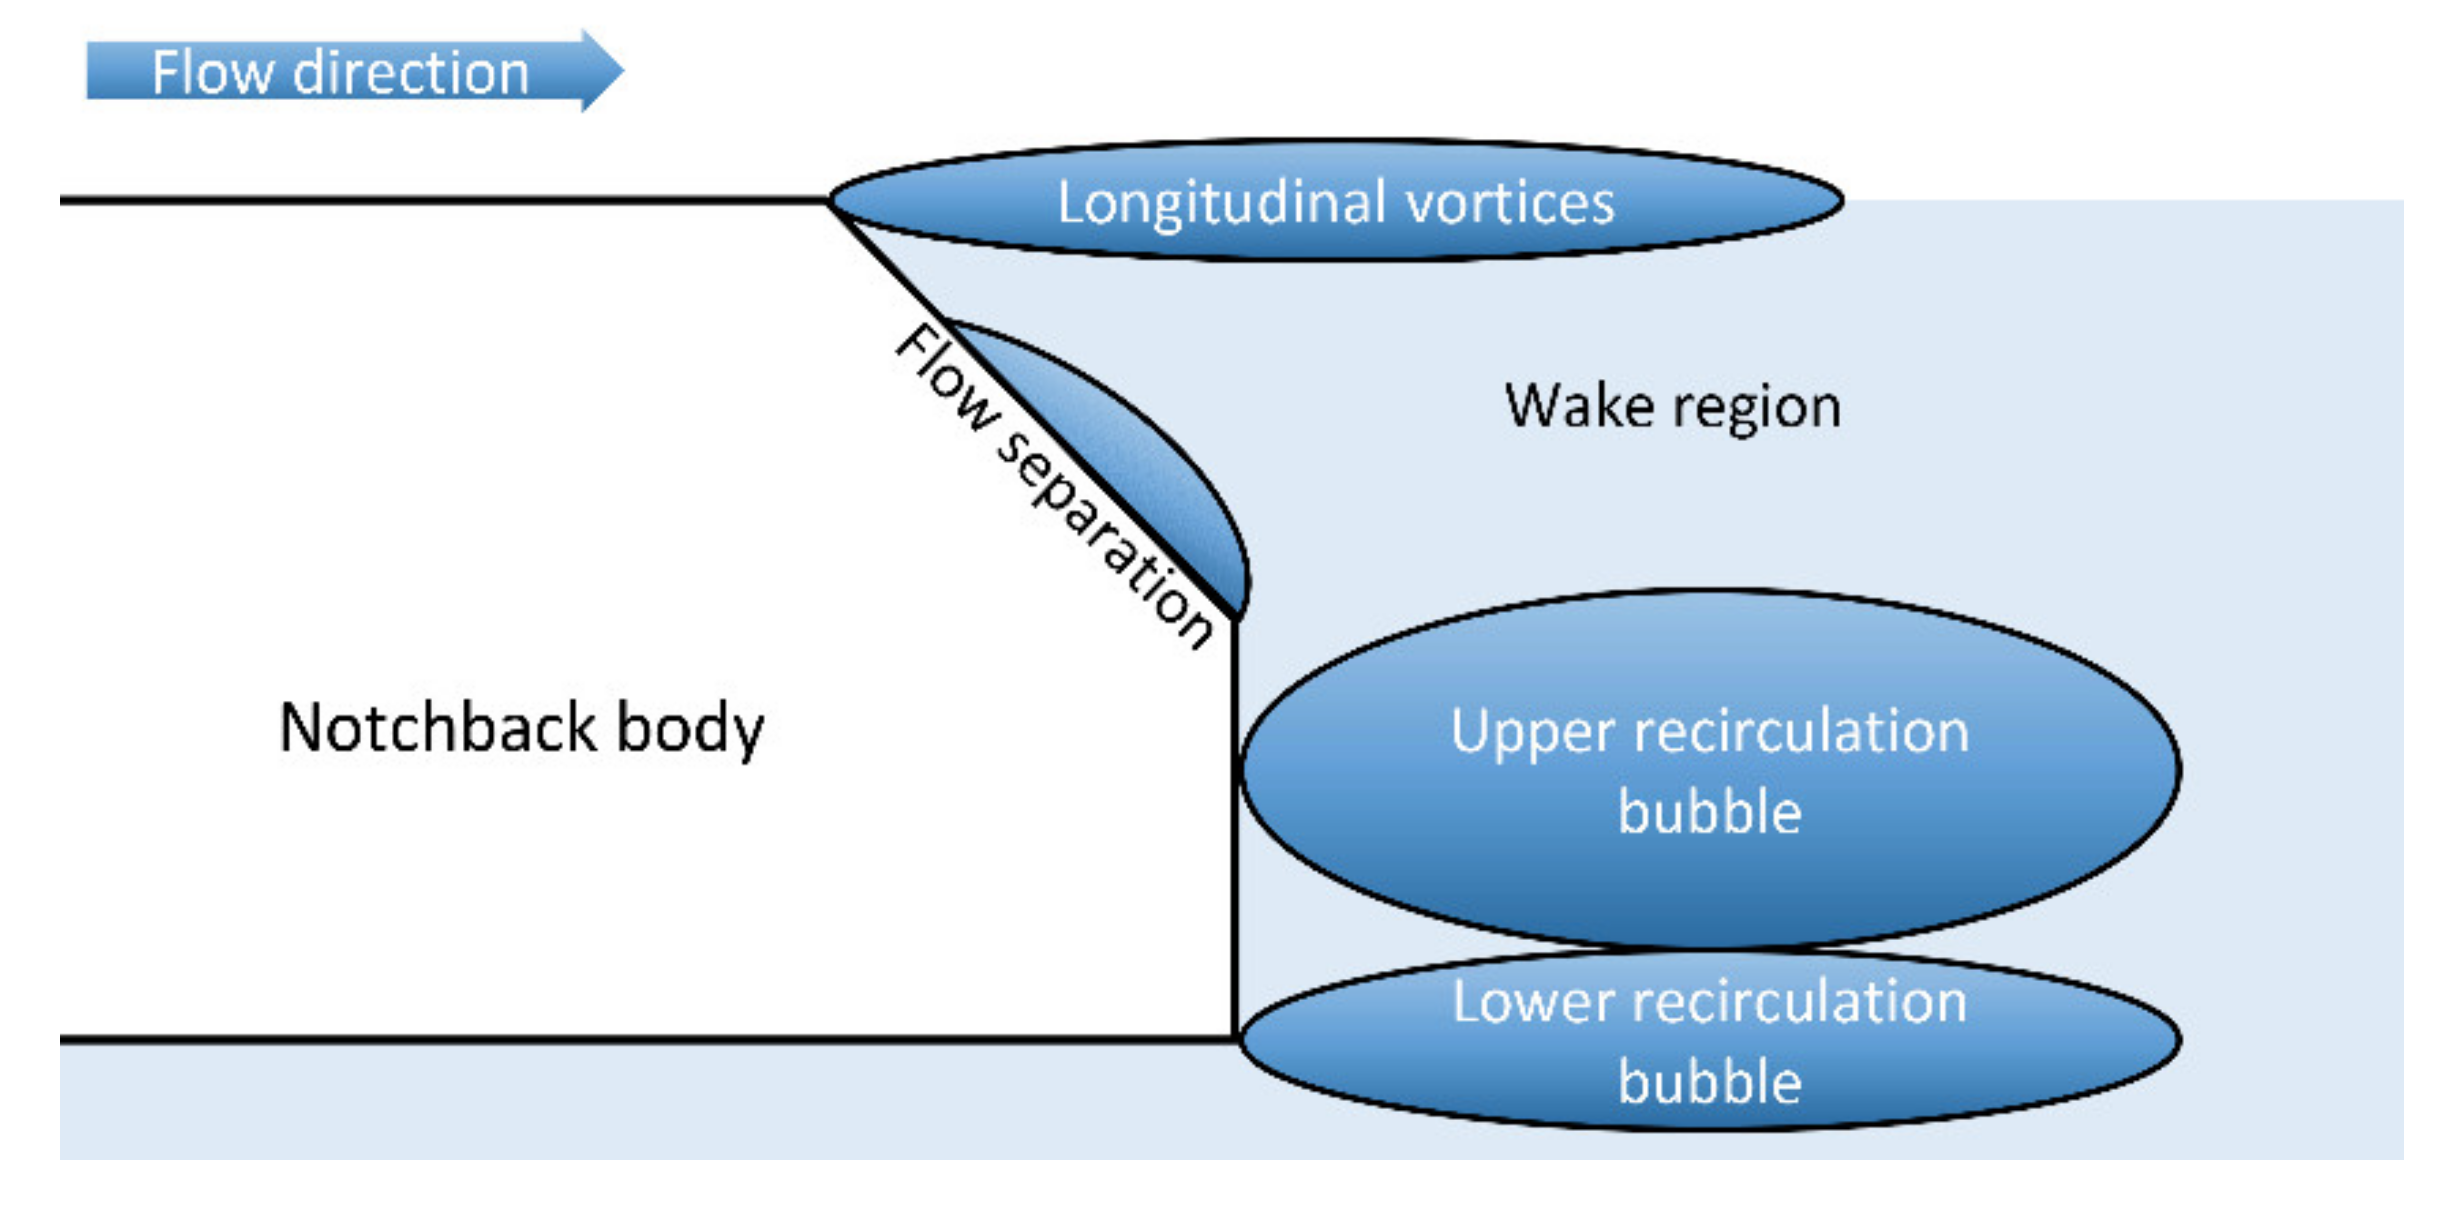
2.2.2. Notchback
2.3. Aerodynamic Drag Reduction
2.3.1. Active Systems
2.3.2. Shape Optimization
2.3.3. Topology Modification
3. Quantitative Analysis
4. Conclusions
Funding
Conflicts of Interest
References
- Spalart, P.R.; Strelets, M.; Travin, A. Direct numerical simulation of large-eddy-break-up devices in a boundary layer. Int. J. Heat Fluid Flow 2006, 27, 902–910. [Google Scholar] [CrossRef]
- Taylor, H.D. Summary Report on Vortex Generators; Research Department Report No. R-05280-9; United Aircraft Corporation: East Hartford, CT, USA, 1950. [Google Scholar]
- Chai, L.; Tassou, S.A. A Review of Airside Heat Transfer Augmentation with Vortex Generators on Heat Transfer Surface. Energies 2018, 11, 2737. [Google Scholar] [CrossRef]
- Alexandersen, J.; Andreasen, C.S. A Review of Topology Optimisation for Fluid-Based Problems. Fluids 2020, 5, 29. [Google Scholar] [CrossRef]
- Hucho, W.H.; Sovran, G. Aerodynamics of Road Vehicles. Annu. Rev. Fluid Mech. 1993, 25, 485–537. [Google Scholar] [CrossRef]
- Choi, H.; Lee, J.; Park, H. Aerodynamics of Heavy Vehicles. Annu. Rev. Fluid Mech. 2014, 46, 441–468. [Google Scholar] [CrossRef]
- Ahmed, S.; Ramm, G.; Faltin, G. Some Salient Features of the Time-Averaged Ground Vehicle Wake; SAE Technical Papers; SAE International: Warrendale, PA, USA, 1984. [Google Scholar] [CrossRef]
- Gil, P. Bluff Body Drag Control using Synthetic Jet. J. Appl. Fluid Mech. 2019, 12, 293–302. [Google Scholar] [CrossRef]
- Barros, D.; Borée, J.; Noack, B.R.; Spohn, A.; Ruiz, T. Bluff body drag manipulation using pulsed jets and Coanda effect. J. Fluid Mech. 2016, 805, 422–459. [Google Scholar] [CrossRef]
- Hui, Z.; Hu, X.; Guo, P.; Wang, Z.; Wang, J. Separation Flow Control of a Generic Ground Vehicle Using an SDBD Plasma Actuator. Energies 2019, 12, 3805. [Google Scholar] [CrossRef]
- Götz, H. Commercial Vehicles. In Aerodynamics of Road Vehicles, 1st ed.; Hucho, W.-H., Ed.; Butterworth & Co.: Cambridge, UK, 1987; pp. 295–354. [Google Scholar]
- Barden, J.; Gerova, K. An on-road investigation into the conditions experienced by a heavy goods vehicle operating within the United Kingdom. Transp. Res. Part D Transp. Environ. 2016, 48, 284–297. [Google Scholar] [CrossRef]
- Nabavi, M.; Siddiqui, M.H.K.; Dargahi, J. Experimental investigation of the formation of acoustic streaming in a rectangular enclosure using a synchronized PIV technique. Meas. Sci. Technol. 2008, 19, 65405. [Google Scholar] [CrossRef]
- Kourta, A.; Leclerc, C. Characterization of synthetic jet actuation with application to Ahmed body wake. Sensors Actuators A Phys. 2013, 192, 13–26. [Google Scholar] [CrossRef]
- Zhang, B.F.; Liu, K.; Zhou, Y.; To, S.; Tu, J.Y. Active drag reduction of a high-drag Ahmed body based on steady blowing. J. Fluid Mech. 2018, 856, 351–396. [Google Scholar] [CrossRef]
- Rao, A.N.; Zhang, J.; Minelli, G.; Basara, B.; Krajnovic, S. An LES Investigation of the Near-Wake Flow Topology of a Simplified Heavy Vehicle. Flow Turbul. Combust. 2018, 102, 389–415. [Google Scholar] [CrossRef]
- Hwang, B.G.; Lee, S.; Lee, E.J.; Kim, J.J.; Kim, M.; You, D.; Lee, S.-J. Reduction of drag in heavy vehicles with two different types of advanced side skirts. J. Wind. Eng. Ind. Aerodyn. 2016, 155, 36–46. [Google Scholar] [CrossRef]
- Yong, Z.; Zhengqi, G.; Shuichang, L. Transient Simulation Research on Automobile Aerodynamic Lift Based on LBM Method. Mechanika 2018, 23, 845–851. [Google Scholar] [CrossRef][Green Version]
- Lee, S.W.; Kim, H.L. Numerical Study of Active Aerodynamic Control via Flow Discharge on a High-Camber Rear Spoiler of a Road Vehicle. Appl. Sci. 2019, 9, 4783. [Google Scholar] [CrossRef]
- Weinman, K.; Fragner, M.; Deiterding, R.; Heine, D.; Fey, U.; Braenstroem, F.; Schultz, B.; Wagner, C. Assessment of the mesh refinement influence on the computed flow-fields about a model train in comparison with wind tunnel measurements. J. Wind. Eng. Ind. Aerodyn. 2018, 179, 102–117. [Google Scholar] [CrossRef]
- Fu, C.; Uddin, M.; Robinson, A.C. Turbulence modeling effects on the CFD predictions of flow over a NASCAR Gen 6 racecar. J. Wind. Eng. Ind. Aerodyn. 2018, 176, 98–111. [Google Scholar] [CrossRef]
- Chowdhury, H.; Juwono, R.; Zaid, M.; Islam, R.; Loganathan, B.; Alam, F. An experimental study on of the effect of various deflectors used for light trucks in Indian subcontinent. Energy Procedia 2019, 160, 34–39. [Google Scholar] [CrossRef]
- Boyer, H.; Sigurdson, L. Flow visualization of light vehicle–trailer systems aerodynamics. J. Vis. 2014, 18, 459–468. [Google Scholar] [CrossRef]
- McArthur, D.; Burton, D.; Thompson, M.; Sheridan, J. An experimental characterisation of the wake of a detailed heavy vehicle in cross-wind. J. Wind. Eng. Ind. Aerodyn. 2018, 175, 364–375. [Google Scholar] [CrossRef]
- Giappino, S.; Melzi, S.; Tomasini, G. High-speed freight trains for intermodal transportation: Wind tunnel study on the aerodynamic coefficients of container wagons. J. Wind. Eng. Ind. Aerodyn. 2018, 175, 111–119. [Google Scholar] [CrossRef]
- Pavia, G.; Passmore, M.; Varney, M.; Hodgson, G. Salient three-dimensional features of the turbulent wake of a simplified square-back vehicle. J. Fluid Mech. 2020, 888. [Google Scholar] [CrossRef]
- Aljure, D.; Lehmkuhl, O.; Rodriguez, I.; Oliva, A. Flow and turbulent structures around simplified car models. Comput. Fluids 2014, 96, 122–135. [Google Scholar] [CrossRef]
- Perzon, S.; Davidson, L. On transient modeling of the flow around vehicles using the Reynolds equation. In Proceedings of the ACFD 2000, Beijing, China, 17–20 October 2000; pp. 720–727. Available online: http://www.tfd.chalmers.se/~lada/postscript_files/sven_acfd_paper_2000.pdf (accessed on 7 January 2020).
- Wang, Y.; Sicot, C.; Borée, J.; Grandemange, M. Experimental study of wheel-vehicle aerodynamic interactions. J. Wind. Eng. Ind. Aerodyn. 2020, 198, 104062. [Google Scholar] [CrossRef]
- Pavia, G.; Passmore, M.; Varney, M. Low-frequency wake dynamics for a square-back vehicle with side trailing edge tapers. J. Wind. Eng. Ind. Aerodyn. 2019, 184, 417–435. [Google Scholar] [CrossRef]
- Luckhurst, S.; Varney, M.; Xia, H.; Passmore, M.; Gaylard, A. Computational investigation into the sensitivity of a simplified vehicle wake to small base geometry changes. J. Wind. Eng. Ind. Aerodyn. 2019, 185, 1–15. [Google Scholar] [CrossRef]
- Serre, E.; Minguez, M.; Pasquetti, R.; Guilmineau, E.; Deng, G.B.; Kornhaas, M.; Schäfer, M.; Fröhlich, J.; Hinterberger, C.; Rodi, W. On simulating the turbulent flow around the Ahmed body: A French–German collaborative evaluation of LES and DES. Comput. Fluids 2013, 78, 10–23. [Google Scholar] [CrossRef]
- Lienhart, H.; Stoots, C.; Becker, S. Flow and Turbulence Structures in the Wake of a Simplified Car Model (Ahmed Modell). In New Results in Numerical and Experimental Fluid Mechanics III; Springer: Berlin, Heidelberg, 2002; pp. 323–330. [Google Scholar] [CrossRef]
- Wang, P.; Fröhlich, J.; Michelassi, V.; Rodi, W. Large-eddy simulation of variable-density turbulent axisymmetric jets. Int. J. Heat Fluid Flow 2008, 29, 654–664. [Google Scholar] [CrossRef]
- Zhang, B.F.; Zhou, Y.; To, S. Unsteady flow structures around a high-drag Ahmed body. J. Fluid Mech. 2015, 777, 291–326. [Google Scholar] [CrossRef]
- Heft, A.I.; Indinger, T.; Adams, N.A. Introduction of a New Realistic Generic Car Model for Aerodynamic Investigations; SAE Technical Paper; SAE International: Detroit, Michigan USA, 2012. [Google Scholar] [CrossRef]
- Wieser, D.; Nayeri, C.; Paschereit, C.O. Wake Structures and Surface Patterns of the DrivAer Notchback Car Model under Side Wind Conditions. Energies 2020, 13, 320. [Google Scholar] [CrossRef]
- Wieser, D.; Schmidt, H.-J.; Müller, S.; Strangfeld, C.; Nayeri, C.; Paschereit, C.O. Experimental Comparison of the Aerodynamic Behavior of Fastback and Notchback DrivAer Models. SAE Int. J. Passeng. Cars Mech. Syst. 2014, 7, 682–691. [Google Scholar] [CrossRef]
- Avadiar, T.; Thompson, M.C.; Sheridan, J.; Burton, D. Characterisation of the wake of the DrivAer estate vehicle. J. Wind. Eng. Ind. Aerodyn. 2018, 177, 242–259. [Google Scholar] [CrossRef]
- Boysen, N.; Briskorn, D.; Schwerdfeger, S. The identical-path truck platooning problem. Transp. Res. Part B Methodol. 2018, 109, 26–39. [Google Scholar] [CrossRef]
- Jacuzzi, E.; Granlund, K. Passive flow control for drag reduction in vehicle platoons. J. Wind. Eng. Ind. Aerodyn. 2019, 189, 104–117. [Google Scholar] [CrossRef]
- Sugimachi, T.; Fukao, T.; Suzuki, Y.; Kawashima, H. Development of Autonomous Platooning System for Heavy-Duty Trucks. In Proceedings of the 7th IFAC Symposium on Advances in Automotive Control, The International Federation of Automatic Control, Tokyo, Japan, 2013; Volume 46, pp. 52–57. [Google Scholar] [CrossRef]
- Luo, F.; Larson, J.; Munson, T. Coordinated platooning with multiple speeds. Transp. Res. Part C Emerg. Technol. 2018, 90, 213–225. [Google Scholar] [CrossRef]
- He, M.; Huo, S.; Hemida, H.; Bourriez, F.; Robertson, F.; Soper, D.; Sterling, M.; Baker, C. Detached eddy simulation of a closely running lorry platoon. J. Wind. Eng. Ind. Aerodyn. 2019, 193, 103956. [Google Scholar] [CrossRef]
- Chowdhury, H.; Islam, R.; Hussein, M.; Zaid, M.; Loganathan, B.; Alam, F. Design of an energy efficient car by biomimicry of a boxfish. Energy Procedia 2019, 160, 40–44. [Google Scholar] [CrossRef]
- Zhang, C.; Uddin, M.; Robinson, A.C.; Foster, L.; Robinson, C. Full vehicle CFD investigations on the influence of front-end configuration on radiator performance and cooling drag. Appl. Therm. Eng. 2018, 130, 1328–1340. [Google Scholar] [CrossRef]
- Pastoor, M.; Henning, L.; Noack, B.R.; King, R.; Tadmor, G. Feedback shear layer control for bluff body drag reduction. J. Fluid Mech. 2008, 608. [Google Scholar] [CrossRef]
- Aubrun, S.; McNally, J.; Alvi, F.; Kourta, A. Separation flow control on a generic ground vehicle using steady microjet arrays. Exp. Fluids 2011, 51, 1177–1187. [Google Scholar] [CrossRef]
- Littlewood, R.P.; Passmore, M. Aerodynamic drag reduction of a simplified squareback vehicle using steady blowing. Exp. Fluids 2012, 53, 519–529. [Google Scholar] [CrossRef]
- Lehugeur, B.; Gilliéron, P.; Kourta, A. Experimental investigation on longitudinal vortex control over a dihedral bluff body. Exp. Fluids 2009, 48, 33–48. [Google Scholar] [CrossRef]
- Tounsi, N.; Mestiri, R.; Keirsbulck, L.; Oualli, H.; Hanchi, S.; Aloui, F. Experimental Study of Flow Control on Bluff Body using Piezoelectric Actuators. J. Appl. Fluid Mech. 2016, 9, 827–838. [Google Scholar] [CrossRef]
- Gao, N.; Li, Y.Q.; Bai, H.; Wu, C.J. Effects of Synthetic jets on a D-Shaped Cylinder wake at a Subcritical Reynolds Number. Flow Turbul. Combust. 2016, 97, 729–742. [Google Scholar] [CrossRef]
- Gilliéron, P.; Kourta, A. Aerodynamic drag control by pulsed jets on simplified car geometry. Exp. Fluids 2013, 54. [Google Scholar] [CrossRef]
- Brackston, R.; Wynn, A.; Morrison, J. Modelling and feedback control of vortex shedding for drag reduction of a turbulent bluff body wake. Int. J. Heat Fluid Flow 2018, 71, 127–136. [Google Scholar] [CrossRef]
- Eulalie, Y.; Fournier, E.; Gilotte, P.; Holst, D.; Johnson, S.; Nayeri, C.; Schütz, T.; Wieser, D. Active flow control analysis at the rear of an SUV. Int. J. Numer. Methods Heat Fluid Flow 2018, 28. [Google Scholar] [CrossRef]
- Leclerc, C.; Levallois, E.; Kourta, A.; Gilliéron, P. Aerodynamic Drag Reduction by Synthetic Jet: A 2D Numerical Study around a Simplified Car. In Proceedings of the 3rd AIAA Flow Control Conference, San Francisco, CA, USA, 5–8 June 2006. [Google Scholar]
- Bruneau, C.-H.; Creusé, E.; Gilliéron, P.; Mortazavi, I. Effect of the vortex dynamics on the drag coefficient of a square back Ahmed body: Application to the flow control. Eur. J. Mech. B Fluids 2014, 45, 1–11. [Google Scholar] [CrossRef]
- Li, J.; Deng, Y.D.; Wang, Y.; Su, C.; Liu, X. CFD-Based research on control strategy of the opening of Active Grille Shutter on automobile. Case Stud. Therm. Eng. 2018, 12, 390–395. [Google Scholar] [CrossRef]
- Dhanasekar, J.; Sengottuvel, P.; Palanikumar, K. Implementation of Effective Fuel Saving Methodology for Turbines using Air Drag in Vehicles. Mater. Today Proc. 2019, 16, 421–429. [Google Scholar] [CrossRef]
- Qi, L.; Wu, X.; Zeng, X.; Feng, Y.; Pan, H.; Zhang, Z.; Yuan, Y. An electro-mechanical braking energy recovery system based on coil springs for energy saving applications in electric vehicles. Energy 2020, 200, 117472. [Google Scholar] [CrossRef]
- Huri, D.; Mankovits, T. Automotive rubber part design using machine learning. IOP Conf. Series Mater. Sci. Eng. 2019, 659, 012022. [Google Scholar] [CrossRef]
- Huri, D.; Mankovits, T. Comparison of the material models in rubber finite element analysis. IOP Conf. Series Mater. Sci. Eng. 2018, 393, 012018. [Google Scholar] [CrossRef]
- Gunpinar, E.; Coskun, U.C.; Ozsipahi, M.; Gunpinar, S. A Generative Design and Drag Coefficient Prediction System for Sedan Car Side Silhouettes based on Computational Fluid Dynamics. Comput. Des. 2019, 111, 65–79. [Google Scholar] [CrossRef]
- Lee, E.J. Drag reduction of a heavy vehicle using a modified boat tail with lower inclined air deflector. J. Vis. 2017, 14, 319–752. [Google Scholar] [CrossRef]
- Lorite-Díez, M.; Jiménez-González, J.I.; Pastur, L.; Cadot, O.; Martínez-Bazán, C. Drag reduction on a three-dimensional blunt body with different rear cavities under cross-wind conditions. J. Wind. Eng. Ind. Aerodyn. 2020, 200, 104145. [Google Scholar] [CrossRef]
- Kim, J.J.; Hong, J.; Lee, S.-J. Bio-inspired cab-roof fairing of heavy vehicles for enhancing drag reduction and driving stability. Int. J. Mech. Sci. 2017, 132, 868–879. [Google Scholar] [CrossRef]
- Kim, J.J.; Kim, J.; Lee, S.-J. Substantial drag reduction of a tractor-trailer vehicle using gap fairings. J. Wind. Eng. Ind. Aerodyn. 2017, 171, 93–100. [Google Scholar] [CrossRef]
- Peng, J.; Wang, T.; Yang, T.; Sun, X.; Li, G. Research on the Aerodynamic Characteristics of Tractor-Trailers with a Parametric Cab Design. Appl. Sci. 2018, 8, 791. [Google Scholar] [CrossRef]
- Kim, J.J.; Kim, J.; Hann, T.; Kim, D.; Roh, H.S.; Lee, S.-J. Considerable drag reduction and fuel saving of a tractor–trailer using additive aerodynamic devices. J. Wind. Eng. Ind. Aerodyn. 2019, 191, 54–62. [Google Scholar] [CrossRef]
- Hassan, S.R.; Islam, T.; Ali, M.; Islam, Q. Numerical Study on Aerodynamic Drag Reduction of Racing Cars. Procedia Eng. 2014, 90, 308–313. [Google Scholar] [CrossRef]
- Vignesh, S.; Gangad, V.S.; Jishnu, V.; Maheswarreddy, K.A.; Mukkamala, Y.S. Windscreen angle and Hood inclination optimization for drag reduction in cars. Procedia Manuf. 2019, 30, 685–692. [Google Scholar] [CrossRef]
- He, P.; Mader, C.; Martins, J.R.R.A.; Maki, K.J. An aerodynamic design optimization framework using a discrete adjoint approach with OpenFOAM. Comput. Fluids 2018, 168, 285–303. [Google Scholar] [CrossRef]
- Hassaan, M.; Badlani, D.; Nazarinia, M. On the effect of boat-tails on a simplified heavy vehicle geometry under crosswinds. J. Wind. Eng. Ind. Aerodyn. 2018, 183, 172–186. [Google Scholar] [CrossRef]
- Holt, J.; Garry, K.; Velikov, S. A wind tunnel investigation into the effects of roof curvature on the aerodynamic drag experienced by a light goods vehicle. Int. J. Veh. Des. 2015, 67, 45. [Google Scholar] [CrossRef]
- Jadhav, C.R.; Chorage, R.P. Modification in commercial bus model to overcome aerodynamic drag effect by using CFD analysis. Results Eng. 2020, 6, 100091. [Google Scholar] [CrossRef]
- Liu, F.; Ji, X.; Hu, G.; Gao, J. A Novel Shape-Adjustable Surface and Its Applications in Car Design. Appl. Sci. 2019, 9, 2339. [Google Scholar] [CrossRef]
- Salati, L.; Schito, P.; Cheli, F. Strategies to reduce the risk of side wind induced accident on heavy truck. J. Fluids Struct. 2019, 88, 331–351. [Google Scholar] [CrossRef]
- Altaf, A.; Omar, A.A.; Asrar, W. Passive drag reduction of square back road vehicles. J. Wind. Eng. Ind. Aerodyn. 2014, 134, 30–43. [Google Scholar] [CrossRef]
- Bansal, R.; Sharma, R.B. Drag Reduction of Passenger Car Using Add-On Devices. J. Aerodyn. 2014, 2014, 678518. [Google Scholar] [CrossRef]
- Li, X.-K.; Liu, W.; Zhang, T.-J.; Wang, P.-M.; Wang, X. Analysis of the Effect of Vortex Generator Spacing on Boundary Layer Flow Separation Control. Appl. Sci. 2019, 9, 5495. [Google Scholar] [CrossRef]
- Li, X.; Yang, K.; Wang, X. Experimental and Numerical Analysis of the Effect of Vortex Generator Height on Vortex Characteristics and Airfoil Aerodynamic Performance. Energies 2019, 12, 959. [Google Scholar] [CrossRef]
- Li, X.-K.; Liu, W.; Zhang, T.-J.; Wang, P.-M.; Wang, X. Experimental and Numerical Analysis of the Effect of Vortex Generator Installation Angle on Flow Separation Control. Energies 2019, 12, 4583. [Google Scholar] [CrossRef]
- Gutierrez-Amo, R.; Fernandez-Gamiz, U.; Errasti, I.; Zulueta, E. Computational Modelling of Three Different Sub-Boundary Layer Vortex Generators on a Flat Plate. Energies 2018, 11, 3107. [Google Scholar] [CrossRef]
- Errasti, I.; Fernandez-Gamiz, U.; Martínez-Filgueira, P.; Blanco, J.M. Source Term Modelling of Vane-Type Vortex Generators under Adverse Pressure Gradient in OpenFOAM. Energies 2019, 12, 605. [Google Scholar] [CrossRef]
- Godard, G.; Foucaut, J.; Stanislas, M. Control of a decelerating boundary layer. Part 2: Optimization of slotted jets vortex generators. Aerosp. Sci. Technol. 2006, 10, 394–400. [Google Scholar] [CrossRef]
- Godard, G.; Stanislas, M. Control of a decelerating boundary layer. Part 3: Optimization of round jets vortex generators. Aerosp. Sci. Technol. 2006, 10, 455–464. [Google Scholar] [CrossRef]
- Hansen, M.O.L.; Charalampous, A.; Foucaut, J.-M.; Cuvier, C.; Velte, C.M. Validation of a Model for Estimating the Strength of a Vortex Created from the Bound Circulation of a Vortex Generator. Energies 2019, 12, 2781. [Google Scholar] [CrossRef]
- Lo, K.H.; Kontis, K. Flow characteristics over a tractor-trailer model with and without vane-type vortex generator installed. J. Wind. Eng. Ind. Aerodyn. 2016, 159, 110–122. [Google Scholar] [CrossRef]
- Shivam, S.S.; Guleria, A.; Mukkamala, Y.S. Aerodynamic Drag Reduction of a Notchback Car Geometry by Delaying Flow Separation using Vortex Generators. Int. J. Eng. Res. 2015, V4, 521–524. [Google Scholar] [CrossRef]
- Ibarra-Udaeta, I.; Errasti, I.; Fernandez-Gamiz, U.; Zulueta, E.; Sancho, J. Computational Characterization of a Rectangular Vortex Generator on a Flat Plate for Different Vane Heights and Angles. Appl. Sci. 2019, 9, 995. [Google Scholar] [CrossRef]
- Aider, J.-L.; Beaudoin, J.-F.; Wesfreid, J.E. Drag and lift reduction of a 3D bluff-body using active vortex generators. Exp. Fluids 2009, 48, 771–789. [Google Scholar] [CrossRef]
- Ali, M.H.; Mashud, M.; al Bari, A.; Islam, M.M. Aerodynamic drag reduction of a car by vortex generation. Int. J. Mech. Eng. 2012, 2, 2277–7059. [Google Scholar]
- Sardana, H.; Singh, M. Reduction of Drag of SUV Similar to Tata Sumo Using Vortex Generator. J. Theor. Appl. Mech. 2018, 48, 19–30. [Google Scholar] [CrossRef]
- Selvaraju, P.N.; Parammasivam, K.M. Empirical and Numerical Analysis of Aerodynamic Drag on a Typical SUV Car Model at Different Locations of Vortex Generator. J. Appl. Fluid Mech. 2019, 12, 1487–1496. [Google Scholar] [CrossRef]
- Sen, W.; Rahman, K.A.; Tanim, I.K. Experimental and CFD Analysis on Car with Several Types of Vortex Generators. In Proceedings of the International Conference on Mechanical Engineering and Renewable Energy 2019, Chittagong, Bangladesh, 11–13 December 2019. [Google Scholar]
- Fourrié, G.; Keirsbulck, L.; Labraga, L.; Gilliéron, P. Bluff-body drag reduction using a deflector. Exp. Fluids 2010, 50, 385–395. [Google Scholar] [CrossRef]
- Tian, J.; Zhang, Y.; Zhu, H.; Xiao, H. Aerodynamic drag reduction and flow control of Ahmed body with flaps. Adv. Mech. Eng. 2017, 9, 1–17. [Google Scholar] [CrossRef]
- Gilliéron, P.; Kourta, A. Aerodynamic drag reduction by vertical splitter plates. Exp. Fluids 2009, 48, 1–16. [Google Scholar] [CrossRef]
- Cihan, B. Numerical Drag Reduction of a Ground Vehicle by NACA2415 Airfoil Structured Vortex Generator and Spoiler. Int. J. Automot. Technol. 2019, 20, 943–948. [Google Scholar] [CrossRef]
- Gopal, P.; Senthilkumar, T.; Rameshkumar, C. Aerodynamic drag reduction in a passenger vehicle using vortex generator with varying yaw angles. ARPN J. Eng. Appl. Sci. 2012, 7, 1180–1186. [Google Scholar]


| Reference and Year | Method | DR | CDinitial | Count |
|---|---|---|---|---|
| Pastoor et al., 2008 [47] | SJA (St = 0.1) | 15.00% | 0.980 | 147 |
| Aubrun et al., 2011 [48] | SJF | 14.00% | 0.240 | 34 |
| Littlewood et al., 2012 [49] | SJF | 12.00% | 0.980 | 118 |
| Gilléron et al., 2013 [53] | pulse jet actuation (St = 3.6) | 20.00% | 0.488 | 98 |
| Kourta et al., 2013 [14] | SJA (St = 5.5) | 8.50% | 0.410 | 35 |
| Barros et al., 2016 [9] | pulse jet actuation (St = 12.1) | 18.00% | 0.293 | 53 |
| Tounsi et al., 2016 [51] | SJA (St = 5.84) | 10.00% | 0.293 | 29 |
| Gao et al., 2016 [52] | SJA (St = 0.2) | 5.00% | 0.293 | 15 |
| Li et al., 2018 [58] | active grille shutter control mechanism | 2.91% | 0.346 | 10 |
| Zhang et al., 2018 [15] | SJF | 29.00% | 0.293 | 85 |
| Hui et al., 2019 [10] | plasma actuator (f = 6.7 kHz) | 7.92% | 0.293 | 23 |
| Wang et al., 2020 [29] | wheel-vehicle interaction | 12.00% | 0.393 | 47 |
| Reference and Year | Method | DR | CDinitial | Count |
|---|---|---|---|---|
| Rakibul Hassan et al., 2014 [70] | rear under-body slice | 22.00% | 0.323 | 71 |
| Hwang et al., 2016 [17] | flap-type side skirts | 5.30% | 0.709 | 38 |
| Kim et al., 2017 [66] | cab fairings | 22.50% | 0.708 | 159 |
| Kim et al., 2017 [67] | gap fairings | 16.40% | 0.684 | 112 |
| Lee et al., 2017 [64] | boat tails | 9.02% | 0.709 | 64 |
| Peng et al., 2018 [68] | fairings | 8.49% | 0.451 | 38 |
| Kim et al., 2019 [69] | flap-type side skirts | 26.50% | 0.693 | 184 |
| Chowdhury et al., 2019 [22] | fairings | 22.00% | 0.700 | 154 |
| Lorite-Díez et al., 2020 [65] | curved boat tail | 9.10% | 0.329 | 30 |
| Reference and Year | Method | DR | CDinitial | Count |
|---|---|---|---|---|
| Aider et al., 2010 [91] | trapezoid wing | 12.00% | 0.410 | 49 |
| Gilliéron et al., 2010 [98] | front splitter plate | 27.00% | 0.293 | 79 |
| Gilliéron et al., 2010 [98] | rear splitter plate | 12.00% | 0.293 | 35 |
| Fourrié et al., 2011 [96] | rectangular flap | 9.00% | 0.293 | 26 |
| Hasan Ali et al., 2012 [92] | bump-shaped winglet | 2.00% | 0.350 | 7 |
| Gopal et al., 2012 [100] | delta winglet | 90.00% | 0.110 | 99 |
| Altaf et al., 2014 [78] | elliptical rear flap | 11.11% | 0.646 | 72 |
| Altaf et al., 2014 [78] | rectangular rear flap | 6.85% | 0.646 | 44 |
| Altaf et al., 2014 [78] | triangular rear flap | 6.43% | 0.646 | 42 |
| Altaf et al., 2014 [78] | perforated elliptical rear flap | 8.86% | 0.646 | 57 |
| Altaf et al., 2014 [78] | perforated rectangular rear flap | 5.37% | 0.646 | 35 |
| Altaf et al., 2014 [78] | perforated triangular rear flap | 5.26% | 0.646 | 34 |
| Bansal et al., 2014 [79] | spoiler | 2.02% | 0.351 | 7 |
| Bansal et al., 2014 [79] | rectangular flap | 3.87% | 0.351 | 14 |
| Bansal et al., 2014 [79] | delta winglet | 1.17% | 0.351 | 4 |
| Bansal et al., 2014 [79] | spoiler with winglet | 4.35% | 0.351 | 15 |
| Tian et al., 2017 [97] | rear flap at top | 17.90% | 0.201 | 36 |
| Tian et al., 2017 [97] | rear flap at bottom | 11.20% | 0.201 | 23 |
| Tian et al., 2017 [97] | side flap | 21.20% | 0.201 | 43 |
| Selvaraju et al., 2019 [94] | delta winglet | 9.04% | 0.341 | 31 |
| Lee et al., 2019 [19] | spoiler | 3.10% | 0.080 | 2 |
| Cihan 2019 [99] | spoiler with winglet | 22.59% | 0.415 | 94 |
© 2020 by the author. Licensee MDPI, Basel, Switzerland. This article is an open access article distributed under the terms and conditions of the Creative Commons Attribution (CC BY) license (http://creativecommons.org/licenses/by/4.0/).
Share and Cite
Szodrai, F. Quantitative Analysis of Drag Reduction Methods for Blunt Shaped Automobiles. Appl. Sci. 2020, 10, 4313. https://doi.org/10.3390/app10124313
Szodrai F. Quantitative Analysis of Drag Reduction Methods for Blunt Shaped Automobiles. Applied Sciences. 2020; 10(12):4313. https://doi.org/10.3390/app10124313
Chicago/Turabian StyleSzodrai, Ferenc. 2020. "Quantitative Analysis of Drag Reduction Methods for Blunt Shaped Automobiles" Applied Sciences 10, no. 12: 4313. https://doi.org/10.3390/app10124313
APA StyleSzodrai, F. (2020). Quantitative Analysis of Drag Reduction Methods for Blunt Shaped Automobiles. Applied Sciences, 10(12), 4313. https://doi.org/10.3390/app10124313