Abstract
The classification of pulmonary nodules using computed tomography (CT) and positron emission tomography (PET)/CT is often a hard task for physicians. To this end, in our previous study, we developed an automated classification method using PET/CT images. In actual clinical practice, in addition to images, patient information (e.g., laboratory test results) is available and may be useful for automated classification. Here, we developed a hybrid scheme for automated classification of pulmonary nodules using these images and patient information. We collected 36 conventional CT images and PET/CT images of patients who underwent lung biopsy following bronchoscopy. Patient information was also collected. For classification, 25 shape and functional features were first extracted from the images. Benign and malignant nodules were identified using machine learning algorithms along with the images’ features and 17 patient-information-related features. In the leave-one-out cross-validation of our hybrid scheme, 94.4% of malignant nodules were identified correctly, and 77.7% of benign nodules were diagnosed correctly. The hybrid scheme performed better than that of our previous method that used only image features. These results indicate that the proposed hybrid scheme may improve the accuracy of malignancy analysis.
1. Introduction
1.1. Background
Lung cancer is the leading cause of cancer-related deaths among men and women worldwide [1]. In its early stages, lung cancer exhibits poor symptoms; thus, screening is important for early detection. When lung nodules are detected during such screening, it becomes necessary to accurately classify the detected lesion as benign or malignant, for appropriate treatment.
Computed tomography (CT) is widely used for lung cancer screening [2]. Screening with CT examinations has been reported to be effective for improving prognosis. If the suspicious lesions are found in CT images, positron emission tomography (PET)/CT examination is performed for detailed analysis. In PET examinations, fluorodeoxyglucose (FDG) accumulates more in cancer cells than in normal cells. Radiologists diagnose morphological abnormalities from CT images and determine functional abnormalities using the metabolism-related information in PET images. Many studies have reported that FDG-PET and FDG-PET/CT perform better on the classification of benign and malignant tumors than CT examinations alone [3,4,5].
Notably, benign nodules associated with inflammatory disease often exhibit elevated FDG uptake as malignant nodules. Therefore, it is often difficult to distinguish benign from malignant nodules [3]. In these cases, bronchoscopic biopsy is performed to confirm the diagnosis. However, patients are at risk for pain and complications, such as bleeding and/or pneumothorax.
Here, we focus on patient metadata for lung cancer diagnosis; these metadata can be collected non-invasively. Age, gender, and smoking status have all been shown to correlate with the risk of lung cancer; this information can be used to further improve the analysis accuracy. Further, minimally invasive laboratory tests can be performed for determining the patient’s general condition. If such information can be analyzed along with PET and CT images, a comprehensive evaluation of the nodules’ malignancy may become possible. Therefore, in this study, we focused on the automated analysis of the malignancy potential of the pulmonary nodules using PET/CT images combined with patient-related information.
1.2. Related Works
Several studies have reported on benign and/or malignant classification of pulmonary nodules using image analysis [6,7,8,9,10,11,12]. Way et al. developed a scheme for the automated classification of the lung nodule CT images using the linear discriminant analysis (LDA) or support vector machines (SVMs) with stepwise feature selection [6]. The evaluation of 256 CT scans in that study revealed that the area under the receiver operating characteristic (AUROC) curve was 0.857. Chen et al. introduced a method that used an ensemble of artificial neural networks (ANNs) for classifying pulmonary nodules [7]. The leave-one-out cross-validation of that method yielded the AUROC of 0.915. Nie et al. developed a semi-automated scheme for classifying benign and malignant pulmonary nodules by integrating the PET and CT imaging results [8].
Recently, approaches combining non-imaging medical data, such as electronic medical records (EMRs), for medical analysis have been reported [13,14,15,16,17]. Studies combining heterogeneous types of medical data are described below.
Zhang et al. proposed an automated classification method for Parkinson’s disease and controls using magnetic resonance (MR) images and EMR information [13]. Young et al. introduced MR images, PET images, apolipoprotein E (APOE), and cerebrospinal fluid (CSF) information for predicting mild dementia outcomes in patients who were likely to develop Alzheimer’s disease [14]. Patel et al. developed a method for depression diagnosis; the method combines MR images with demographics and cognitive ability scores [15]. Regarding lung cancer, Wang developed an automated detection scheme using CT images, body mass index (BMI), and smoking-related information [16]. Furthermore, Yamada et al. reported an automated classification scheme for lung cancer types by combining liquid-based cytological (LBC) images and EMR information [17].
Personalized analysis schemes can improve the accuracy of clinical decision support systems. However, to the best of our knowledge, an automated classification method for pulmonary nodules combining PET/CT images with patient information has not been developed yet.
1.3. Objective
In this study, we propose a hybrid scheme for the automated classification of pulmonary nodules using PET/CT images and patient information. The primary objectives of our study were (1) to extract the characteristic features using PET/CT images and (2) to develop an integrated analysis method that utilizes the patient information obtained from EMRs.
In this article, the architecture of the developed classification method is first described. Furthermore, the effectiveness of the classification of pulmonary nodules using only images vs. images with patient information is discussed.
2. Materials and Methods
We collected 36 early- and delayed-phase PET/CT images from suspected lung cancer patients. The used cohort included 18 benign and 18 malignant cases. The histology of the benign cases consisted of five cases of pneumonia (organizing pneumonia (OP), cryptococcus, and pneumocystis pneumonia (PCP)), one case of granuloma, fungal infection, hamartoma, tuberculosis, nontuberculous mycobacterial infection (NTM), and eight other cases. Of the 18 malignant cases, one, four, and thirteen cases were small cell carcinoma, squamous carcinomas, and adenocarcinomas, respectively [18]. All these cases could not be determined by image diagnosis alone, thus a lung biopsy was performed for final diagnosis.
The PET/CT imaging studies were performed using a Siemens True Point mCT (Siemens). Both types of the images were obtained using 200 × 200 pixel matrices (voxel volume, 4.07 × 4.07 × 2.00 mm3; scan time, 2.0 min/table), and were obtained with free breathing. Early- and delayed-phase PET imaging was performed 60 min and 120 min, respectively, after the administration of 3.7 MBq/kg of fluorodeoxyglucose (FDG).
In addition, conventional CT images at maximal inspiration were also collected. These conventional CT images were acquired using Aquilion ONE (Canon Medical Systems) with 512 × 512 pixel matrices (voxel volume, 0.625 × 0.625 × 0.500 mm3) with the lung kernel. In the cases of more than one CT exam per patient, we selected images that were acquired at the time closest to the PET/CT examination.
We also collected patient information corresponding to the collected PET/CT images. In this study, we collected age, gender, smoking status, and laboratory test results as patient information. Seventeen types (personal information: 3, laboratory test results: 14) of patient information were collected. For the laboratory test results, the results closest to the PET/CT examination were collected. Details of the collected information are shown in the Table 1. The number within the brackets ( ) in Table 1 refers to the number of features in that category.

Table 1.
Collected data from electronic medical records (EMRs) in this study.
This study was approved by the institutional review board, and patient agreements were obtained under the condition that all data were anonymized (No. HM17–002).
2.1. Method Overview
An overview of the proposed method is shown in Figure 1. In this method, several characteristic features were extracted from PET and CT images, and nodules were automatically identified as benign or malignant, using patient information.
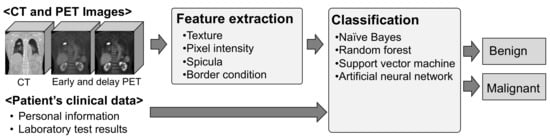
Figure 1.
Overview of the proposed scheme.
2.2. Extraction of Image Features From the PET/CT Images
The locations and diameters of the nodules to be analyzed using the acquired PET and conventional CT images were specified by a trained radiologist. Based on this information, the volumes of interest (VOI) around the pulmonary nodules in the analyzed CT and PET images were extracted. Using the VOI from the acquired PET and conventional CT images, 25 features, such as standardized uptake value (SUV), CT value, texture features, and the nodules’ border contrast were calculated, as shown in Table 2. The number within the brackets ( ) in Table 2 refers to the number of features in that category. A details description of the calculation procedure is given in our previous paper [18]. The calculation of image features is summarized below.
Table 2.
Calculated features from positron emission tomography (PET) and computed tomography (CT) images.
- (i)
- Texture
- Texture patterns in the lungs are an important for assessing malignancy. In this study, a method that was proposed by Haralick et al. based on the grey level co-occurrence matrix (GLCM) was used. Five types of features (contrast, dissimilarity, correlation, homogeneity, and energy) were calculated using θ of 0° (T1_0–T5_0) and 90° (T1_90–T5_90) in the trans-axial plane of the CT images.
- (ii)
- Pixel intensity
- Malignant nodules generally have a high pixel intensity in PET and CT images. Therefore, max and peak values of standardized uptake values (SUV) of early and delayed PET images were measured. Then, the difference in SUV between the delayed and early phases was defined as ΔSUV.
- (iii)
- Spicula
- A spicula around the nodules is often presented in the malignant nodules. In this study, spicula in CT images was detected using Gabor filters.
- (iv)
- Border condition
- The border of a malignant nodule is often unclear. Therefore, the contrast at the border was calculated using the difference between CT values of the outer and inner borderlines of the nodules.
- (v)
- Shape
- Nodule shapes differ between malignant and benign cases. Malignant nodules often have a ball-like shape, while benign ones have a line-like shape. We used the eigenvalues of the Hessian matrix to evaluate nodule shape.
2.3. Preprocessing of Patient Information
Preprocessing of the patient information was performed. Sometimes, EMRs contain missing data. To address this issue, methods have been developed that analyze only those cases that do not contain missing data; alternatively, data imputation techniques can be used. In general, missing data can be imputed using pre-observed values, average values, or some statistical estimates of “typical” values.
In this study, average value interpolation was used for data imputation. Then, continuous variables were normalized to the mean of 0 and the variance of 1. In addition, categorical variables were expressed as dummy variables.
2.4. Classification
Classification of the nodules as benign/malignant was conducted using the obtained characteristic features. We evaluated several popular machine-learning-based classifiers (naive Bayes classifier, random forest, SVM, and ANN). The parameters of these classifiers are listed in Table 3. The classifiers were implemented in the Orange 3.0 open-source data-mining package [19].
Table 3.
Parameters of the used classifiers.
3. Results
The nodules’ classification scheme was evaluated using the receiver operating characteristic (ROC) curve. The classification performance was evaluated via the leave-one-out cross-validation.
To analyze the distinguishing characteristics of our method, we compared the following four approaches: (1) classification using patient information alone; (2) classification using patient information and CT images; (3) classification using patient information, CT images, and early-phase PET images; and (4) classification using patient information, CT images, and early- and delayed-phase PET images. The ROC curves for each of the above approaches are shown in Figure 2a. The AUROC values for approaches (1), (2), (3), and (4) were 0.520, 0.881, 0.920, and 0.901, respectively. The ROC curves obtained from the previous study are shown in Figure 2b for a performance comparison using the same cohort. The AUROC values only for the CT image, CT images and early-phase PET images, and CT images and early- and delayed-phase PET images were 0.730, 0.860, and 0.895, respectively [18].
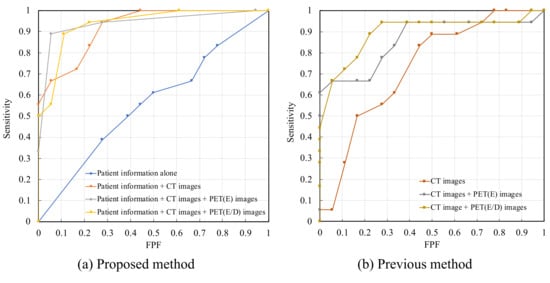
Figure 2.
Receiver operating characteristic (ROC) curves; (a) Proposed method; (b) Previous method.
Considering the accuracy of calling malignant nodules as 0.944, the accuracies of calling benign nodules using approaches (2), (3), and (4) were 0.722, 0.722, and 0.777, respectively. In addition, when only images were used, the classification accuracy of benign nodules for the methods using CT images, CT images, early-phase PET images, and CT images and early- and delayed-phase PET images were 0.277, 0.611, and 0.722, respectively [1,8].
Comparing the four machine learning methods, the classifier that yielded the highest accuracy was the ANN for Model #1 and the SVM for Models #2, 3, and 4. Table 4 compares the classification performance of the proposed method and the previous method. Among these models, the method that used patient information, CT images, and early- and delayed-phase PET images (Model #4) was the most accurate. Figure 3 shows an example of the classification results for Model #4. In Figure 3a, the nodules in the green frames were incorrectly classified when using only imaging. However, after patient information was incorporated, it became possible to correctly classify these images.
Table 4.
Classification results for different input features. The results of I–IV were obtained using the proposed method. The results of V–VII were obtained using the previous method [18].
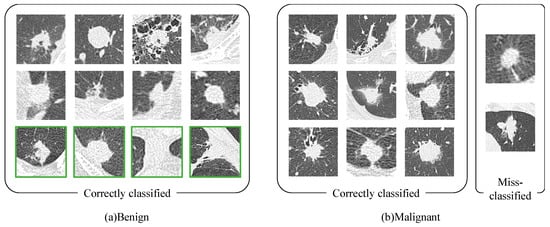
Figure 3.
Classification results for Model #4 (patient information, CT images, and early-and delayed-phase PET images); (a) Benign; (b) Malignant.
4. Discussion
We developed a novel method for classifying pulmonary tumors, which combines CT and PET images, as well as patient-related information. The classification results in Figure 3 show that the four cases that could not be classified correctly using our previous method were correctly identified using the currently proposed method. One case of granulomas, OP, cryptococcus, and other were included in each of these four cases. In all of these cases, the tumor was near the chest wall. Images that were affected by the chest wall may have been correctly identified by utilizing patient information. We analyzed the details of the patient information that was classified correctly using the proposed method. It is generally known that lung cancer often occurs in elderly men. Of these four cases, three cases were female. Additionally, two of these cases were a 48-year-old male and a 63-year-old female, who were relatively young. Furthermore, the amount of an enzyme called lactate dehydrogenase (LD) is often increased in the blood, because tumors require large amounts of energy. The LD value was normal in two of these four cases.
For a sufficiently high malignant tumor classification rate (0.944), the correct classification rate for benign tumors was the highest using the proposed method. In particular, when patient information was combined with CT images, an improvement of 44.5% was obtained, compared with the method that only uses CT images. These results indicate that information about the patient metabolism and inflammation (which can be extracted from PET images) might have been supplemented by blood-related information (which can be extracted from the patient metadata). Therefore, when only CT examination can be performed as an imaging examination, patient information may be useful to improve the classification accuracy of lung tumors.
Comparing Model #3 and #4, Model #3 (without delay-phased PET images) had slightly higher AUROC (Table 4). Delay-phased PET images are generally useful information for diagnosing lung cancer. However, some inflammatory diseases do not necessarily contribute to an improvement in classification accuracy because these SUV increase, similar to malignant tumors. The reason why Model #3 had the highest AUROC was that the information contained in delay-phased PET images was sufficiently complemented by providing the patient information.
We also analyzed effective features for classification of the image features and the patient information. Among the image features, the effectiveness of ESUVmax, DSUVmax, ESUVpeak, DSUVpeak, ΔSUVmax, and ΔSUVpeak was high. Image features have richer information than patient information, because lesion conditions can be expressed. Among the patient information, the effectiveness of C-reactive protein (CRP), LD, platelet (PLT), lymphocytes, and age was high. In the future work, the approach to feature selection may need to be improved.
A limitation of this study is that only a few cases were considered. Some validation cohort should be tested to confirm the accuracy of the proposed method. In this study, we used the same cases as in the previous study, for evaluating the effect of introducing additional information. In the future, we will perform evaluations using more cases, including those that are registered at other facilities.
5. Conclusions
In this study, we proposed an automated classification scheme for pulmonary nodules, using PET/CT images and patient information. Our experimental results indicate that additional information, collected as patient information, can improve the classification accuracy.
Author Contributions
Methodology, A.Y. and A.T.; software, A.T.; validation, A.T. and A.Y.; data curation, A.T., A.Y., and M.H.; writing—original draft preparation, A.Y. and A.T.; writing—review and editing, M.H., K.S., H.T., K.I., and H.F.; supervision, A.T. and K.S.; project administration, A.T. and K.S.; funding acquisition, A.T., H.T., and K.I. All authors have read and agreed to the published version of the manuscript.
Funding
This research was partially supported by a Grant-in-Aid for Scientific Research on Innovative Areas (Multidisciplinary Computational Anatomy, No.26108005) and a Grant-in-Aid for Scientific Research (No. 17K09070) from the Ministry of Education, Culture, Sports, Science and Technology, Japan.
Conflicts of Interest
The authors declare no conflicts of interest.
References
- Cancer Facts & Figures 2019—American Cancer Society. Available online: https://www.cancer.org/content/dam/cancer-org/research/cancer-facts-and-statistics/annual-cancer-facts-and-figures/2019/cancer-facts-and-figures-2019.pdf (accessed on 20 March 2020).
- Sone, S.; Takashima, S.; Li, F.; Yang, Z.; Honda, T.; Maruyama, Y.; Hasegawa, M.; Yamanda, T.; Kubo, K.; Asakura, K. Mass screening for lung cancer with mobile spiral computed tomography scanner. Lancet 1998, 351, 1242–1245. [Google Scholar] [CrossRef]
- Gould, M.K.; Maclean, C.C.; Kuschner, W.G.; Rydzak, C.E.; Owens, D.K. Accuracy of positron emission tomography for diagnosis of pulmonary nodules and mass lesions: A meta-analysis. JAMA 2001, 285, 914–924. [Google Scholar] [CrossRef] [PubMed]
- Yi, C.A.; Lee, K.S.; Kim, B.T.; Choi, J.Y.; Kwon, O.J.; Kim, H.; Shim, Y.M.; Chung, M.J. Tissue characterization of solitary pulmonary nodule: Comparative study between helical dynamic CT and integrated PET/CT. J. Nucl. Med. 2006, 47, 443–450. [Google Scholar] [PubMed]
- Sim, Y.T.; Goh, Y.G.; Dempsey, M.F.; Han, S.; Poon, F.W. PET-CT evaluation of solitary pulmonary nodules: Correlation with maximum standardized uptake value and pathology. Lung 2013, 191, 625–632. [Google Scholar] [CrossRef] [PubMed]
- Way, T.W.; Sahiner, B.; Chan, H.P.; Hadjiiski, L.; Cascade, P.N.; Chughtai, A.; Bogot, N.; Kazerooni, E. Computer-aided diagnosis of pulmonary nodules on CT scans: Improvement of classification performance with nodule surface features. Med. Phys. 2009, 36, 3086–3098. [Google Scholar] [CrossRef] [PubMed]
- Chen, H.; Xu, Y.; Ma, Y.; Ma, B. Neural network ensemble-based computer-aided diagnosis for differentiation of lung nodules on CT images: Clinical evaluation. Acad. Radiol. 2010, 17, 595–602. [Google Scholar] [CrossRef] [PubMed]
- Nie, Y.; Li, Q.; Li, F.; Pu, Y.; Appelbaum, D.; Doi, K. Integrating PET and CT information to improve diagnostic accuracy for lung nodules: A semiautomatic computer-aided method. J. Nucl. Med. 2006, 47, 1075–1080. [Google Scholar] [PubMed]
- Patrice, M.; Shouliang, Q.; He, M.; Weiming, G.; Yudong, Y.; Wei, Q. Detection and Classification of Pulmonary Nodules Using Convolutional Neural Networks: A Survey. IEEE Access 2019, 7, 78075–78091. [Google Scholar] [CrossRef]
- Xinzhuo, Z.; Liyao, L.; Shouliang, Q.; Yueyang, T.; Jianhua, L.; Wei, Q. Agile convolutional neural network for pulmonary nodule classification using CT images. Int. J. Comput. Assist. Radiol. Surg. 2018, 13, 585–595. [Google Scholar] [CrossRef]
- Rahul, P.; Lawrence, H.; Dmitry, G.; Matthew, S.; Robert, G. Predicting Nodule Malignancy Using a CNN Ensemble Approach. In Proceedings of the 2018 International Joint Conference on Neural Networks (IJCNN), Rio, Brazil, 8–13 July 2018; pp. 1–8. [Google Scholar]
- Yijing, L.; Pengyi, H.; Peng, Z.; Xinnan, X.; Jian, W.; Wei, C. Dense Convolutional Binary-Tree Networks for Lung Nodule Classification. IEEE Access 2018, 6, 49080–49088. [Google Scholar] [CrossRef]
- Xi, Z.; Jingyuan, C.; Fei, W. Integrative Analysis of Patient Health Records and Neuroimages via Memory-Based Graph Convolutional Network. In Proceedings of the 2018 IEEE International Conference on Data Mining (ICDM), Singapore, 17–20 November 2018. INSPEC Accession Number: 18366989. [Google Scholar]
- Young, J.; Modat, M.; Cardoso, M.J.; Mendelson, A.; Cash, D.; Ourselin, S. Alzheimer’s Disease Neuroimaging Initiative. Accurate multimodal probabilistic prediction of conversion to Alzheimer’s disease in patients with mild cognitive impairment. Neuroimage Clin. 2013, 19, 735–745. [Google Scholar] [CrossRef]
- Patel, M.J.; Andreescu, C.; Price, J.C.; Edelman, K.L.; Reynolds, C.F., III; Aizenstein, H.J. Machine learning approaches for integrating clinical and imaging features in late-life depression classification and response prediction. Int. J. Geriatr. Psychiatry 2015, 30, 1056–1067. [Google Scholar] [CrossRef]
- Jiachen, W.; Riqiang, G.; Yuankai, H.; Shunxing, B.; Yunxi, X.; Sanja, L.A.; Travis, J.O.; Pierre, P.M.; Bennett, A.L. Lung Cancer Detection Using Co-learning from Chest CT Images and Clinical Demographics. In Proceedings of the SPIE International Society for Optical Engineering, San Diego, CA, USA, 16–21 February 2019. [Google Scholar]
- Yamada, A.; Teramoto, A.; Kiriyama, Y.; Tsukamoto, T.; Imaizumi, K.; Hoshi, M.; Saito, K.; Fujita, H. Pilot Study on Automated Classification of Lung Cancer Types from Liquid-Based Cytological Image and Electronic Medical Record. Med. Imag. Tech. 2019, 37, 230–234. [Google Scholar] [CrossRef]
- Teramoto, A.; Tsujimoto, M.; Inoue, T.; Tsukamoto, T.; Imaizumi, K.; Toyama, H.; Saito, K.; Fujita, H. Automated Classification of Pulmonary Nodules through a Retrospective Analysis of Conventional CT and Two-phase PET Images in Patients Undergoing Biopsy. Asia Ocean J. Nucl. Med. Biol. 2018, 7, 29–37. [Google Scholar] [CrossRef]
- Janez, D.; Tomaž, C.; Aleš, E.; Črt, G.; Tomaž, H.; Mitar, M.; Martin, M.; Matija, P.; Marko, T.; Anže, S.; et al. Orange: Data Mining Toolbox in Python. J. Mach. Learn. Res. 2013, 14, 2349–2353. [Google Scholar] [CrossRef]
© 2020 by the authors. Licensee MDPI, Basel, Switzerland. This article is an open access article distributed under the terms and conditions of the Creative Commons Attribution (CC BY) license (http://creativecommons.org/licenses/by/4.0/).