Effects of Ethanol–Diesel on the Combustion and Emissions from a Diesel Engine at a Low Idle Speed


Abstract
1. Introduction
2. Methodology
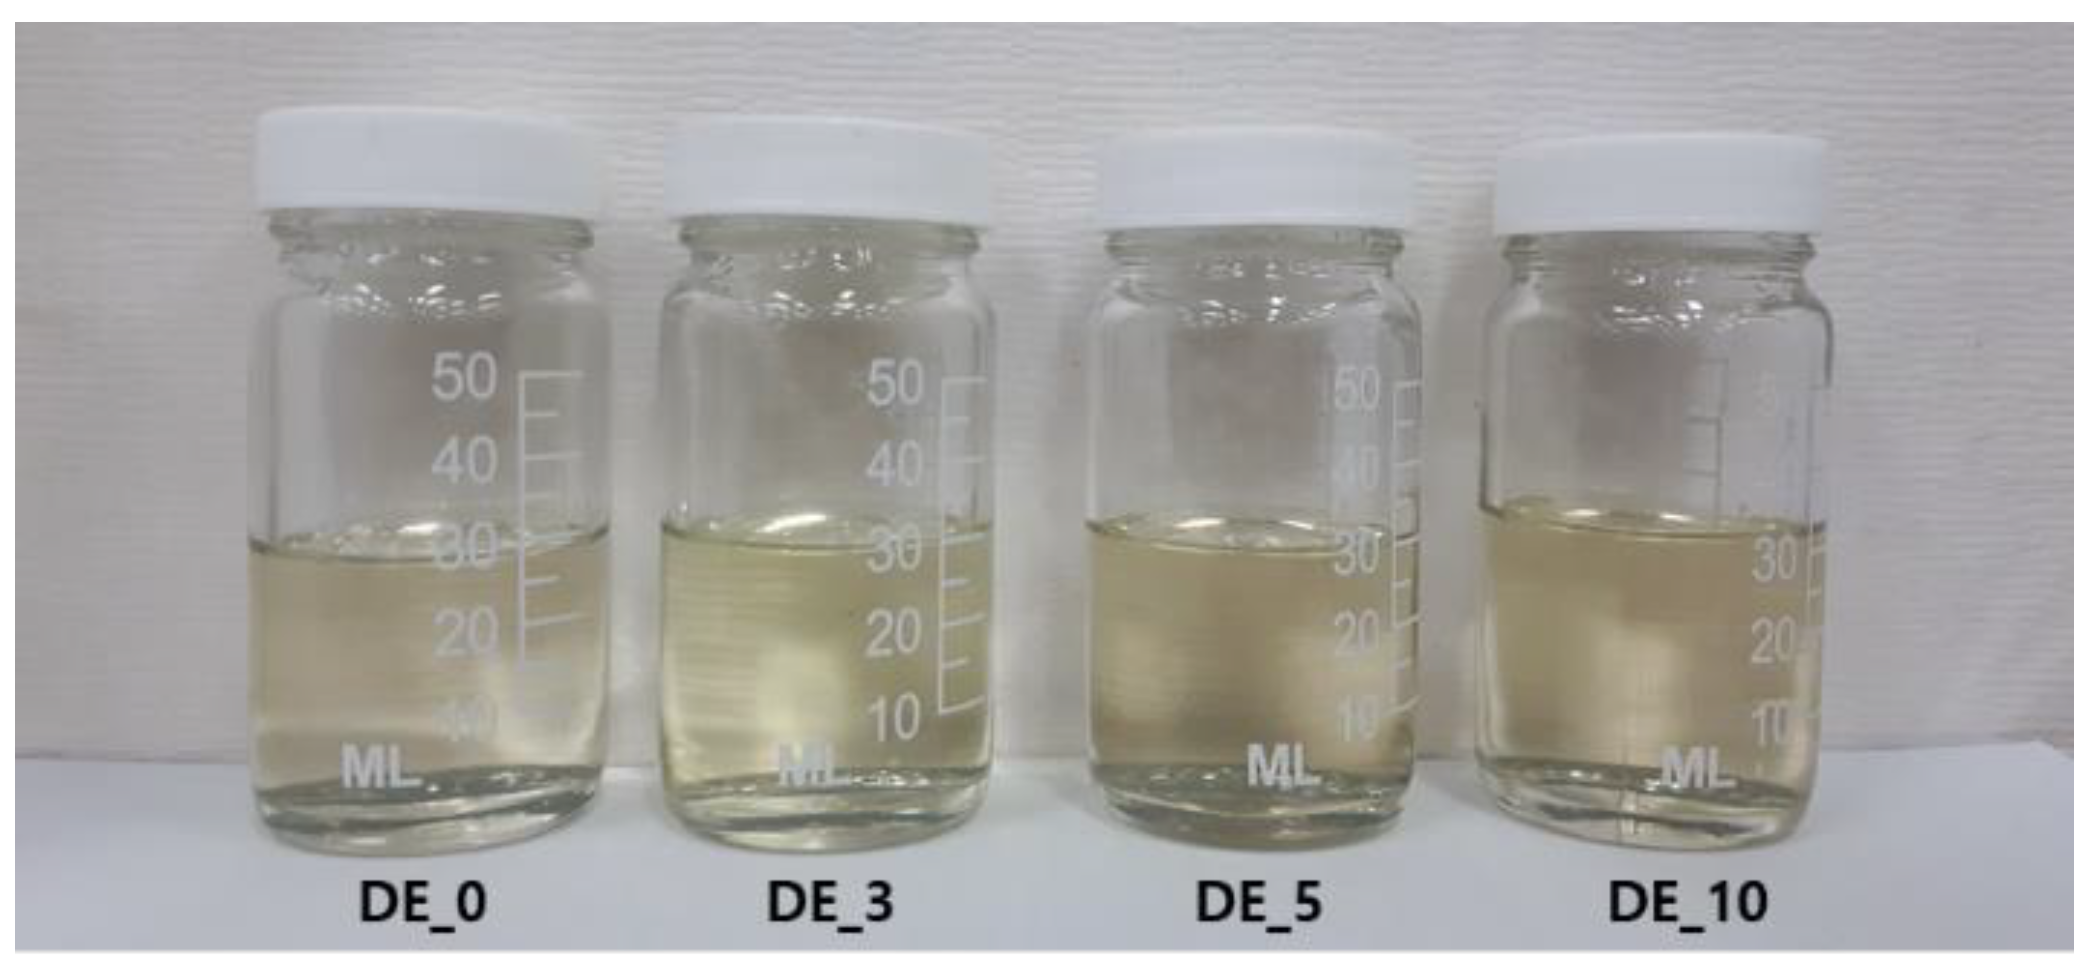
2.1. Test Fuels
2.2. Experimental Setup and Measurements
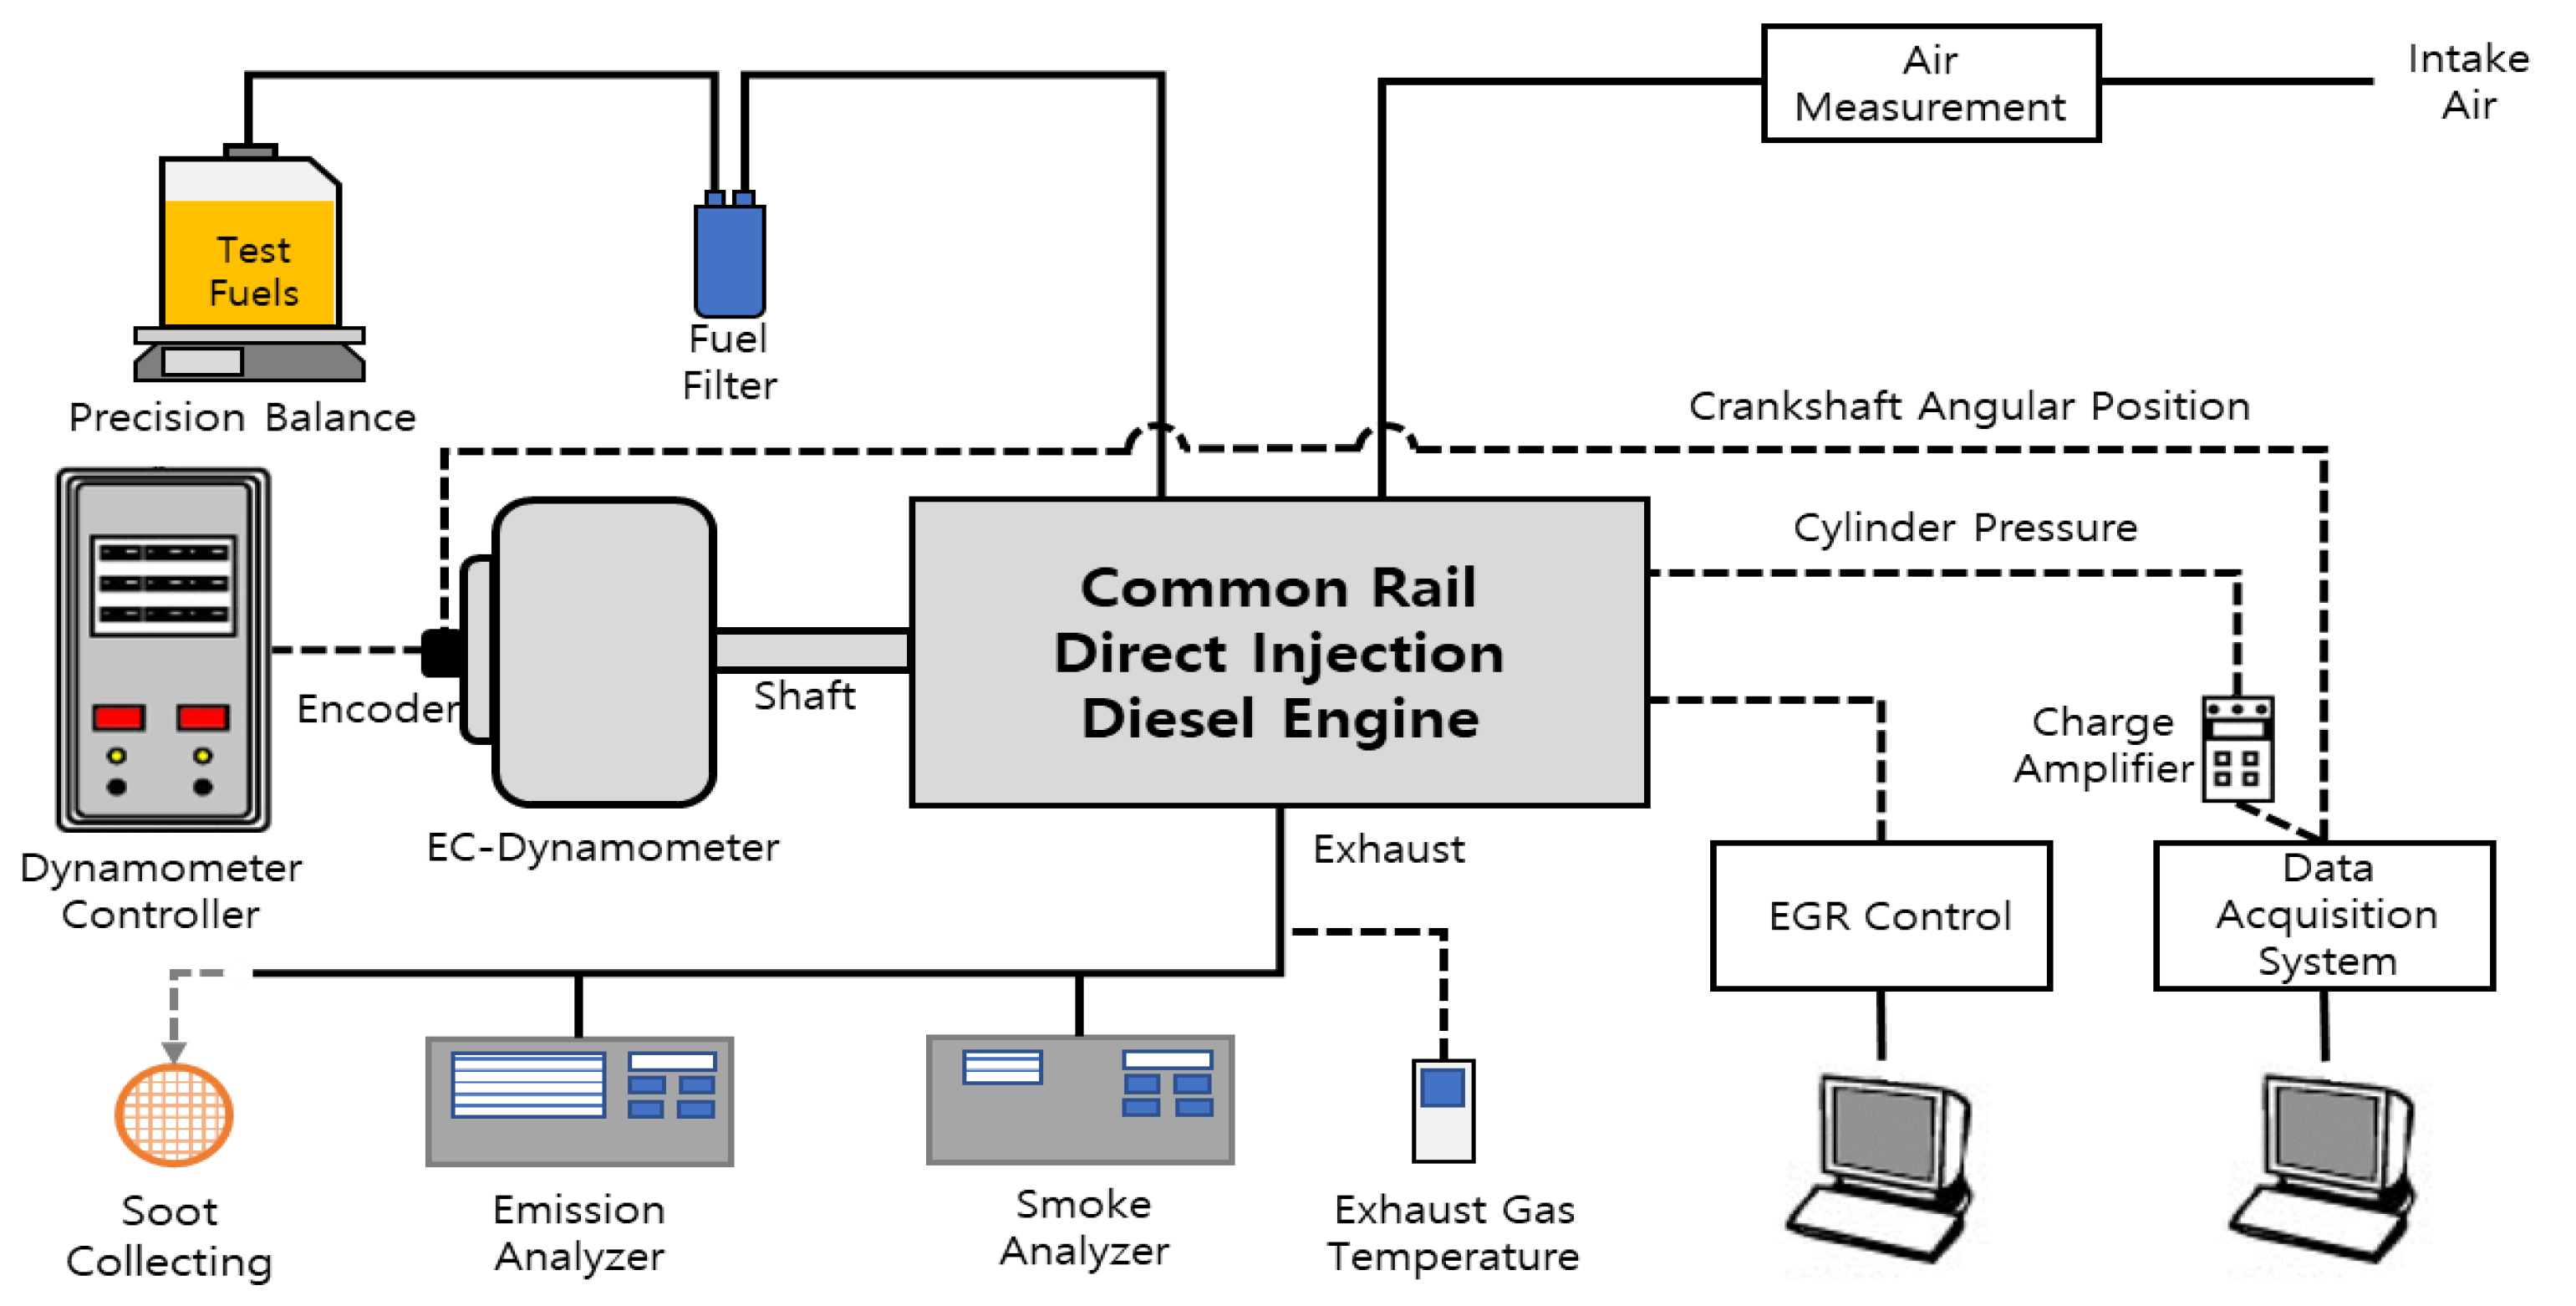
2.2.1. Engine and Experimental Setups
2.2.2. Test Procedure
3. Results and Discussion
3.1. Combustion Characteristics
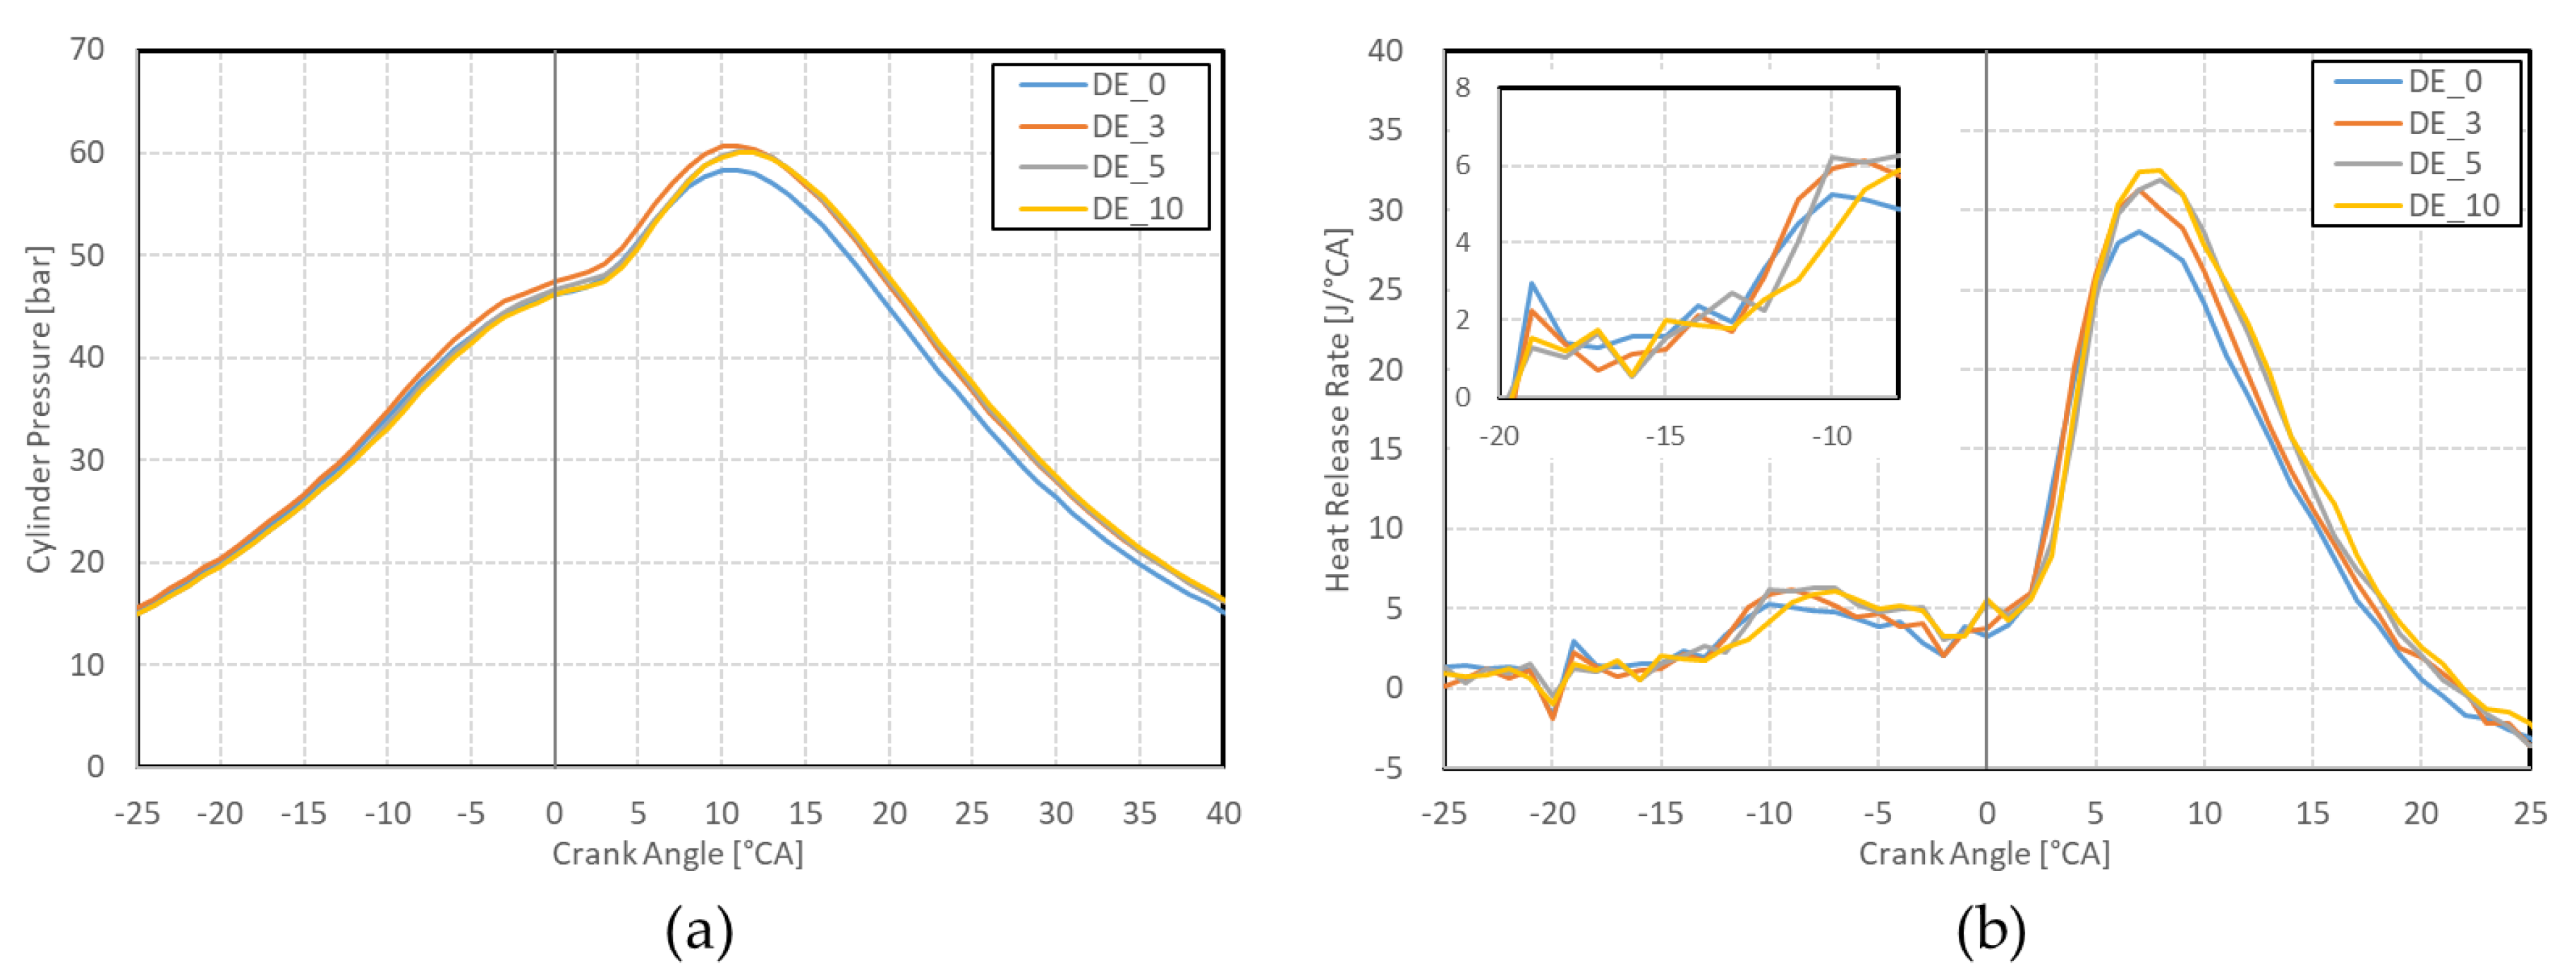
3.1.1. Combustion Pressure and Heat Release Rate
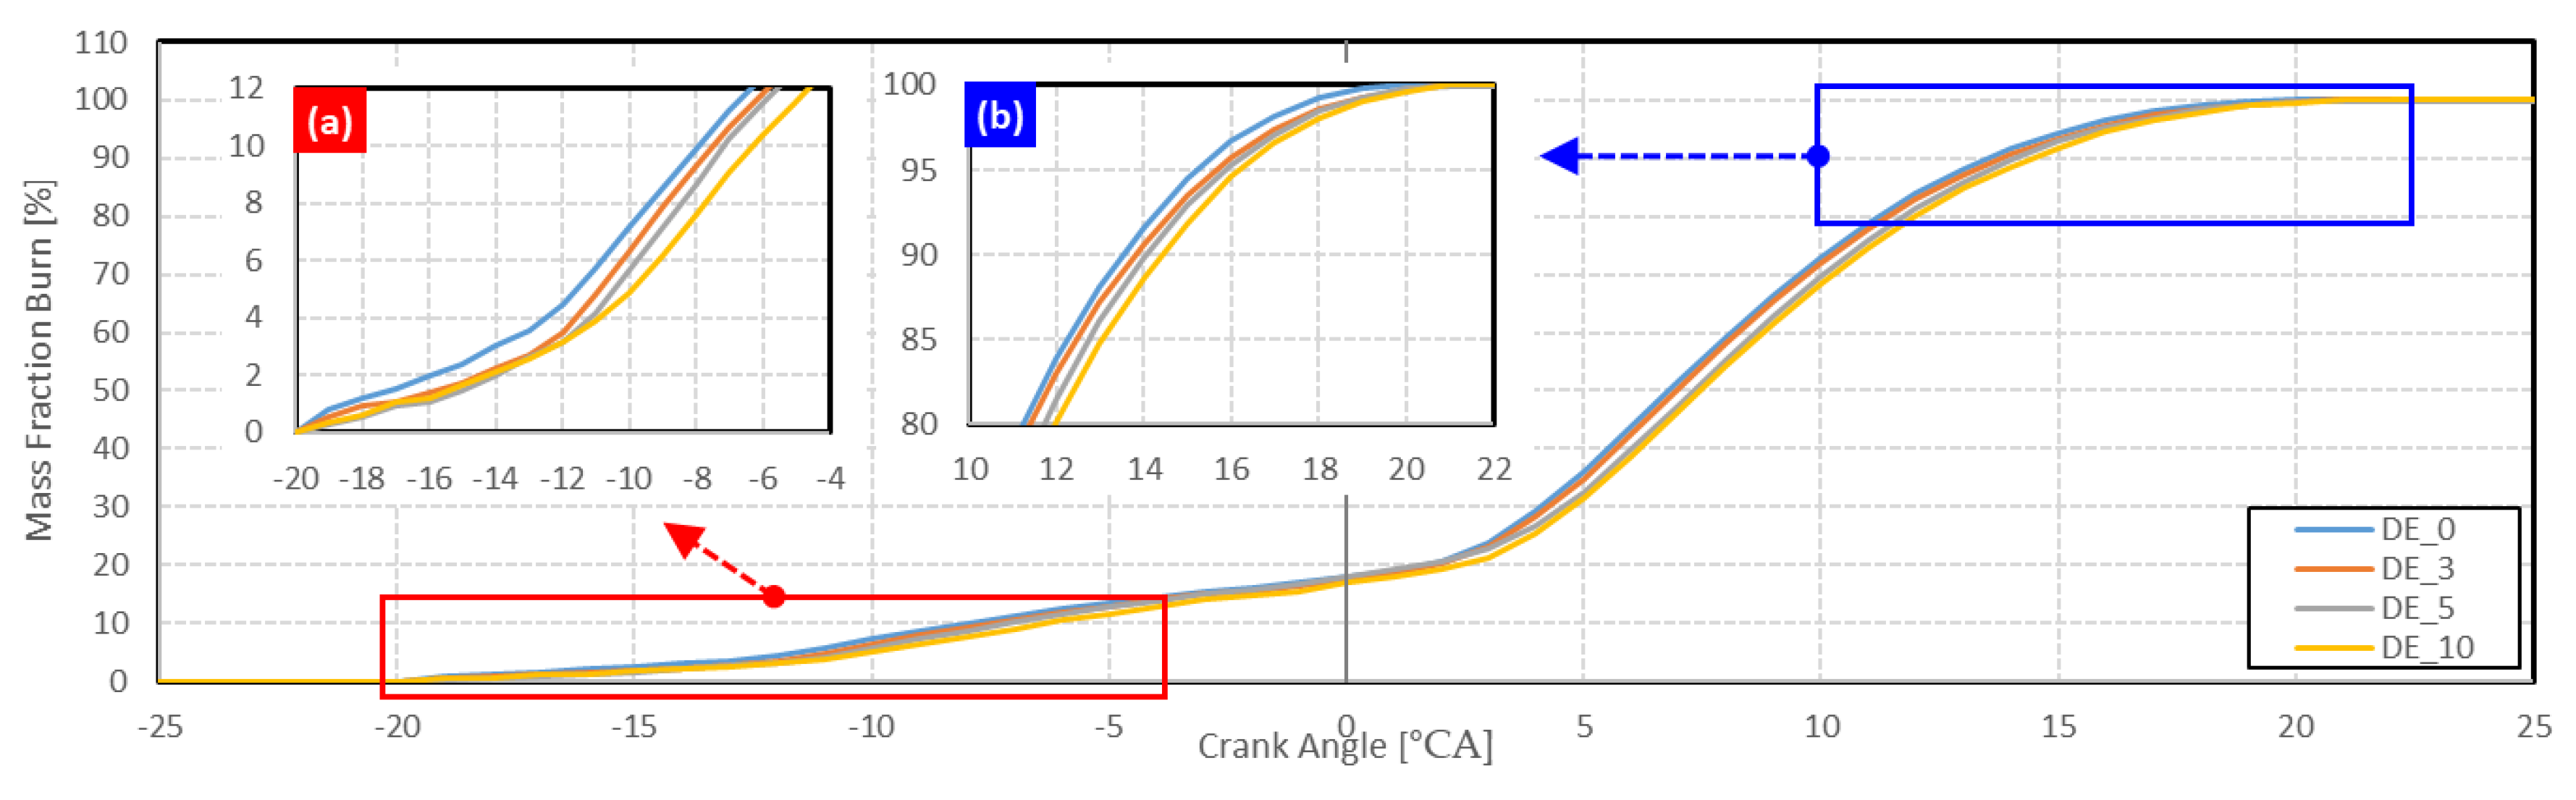
3.1.2. Combustion Phase
3.1.3. Combustion Stability
3.2. Emissions Characteristics
3.2.1. Gaseous Emissions
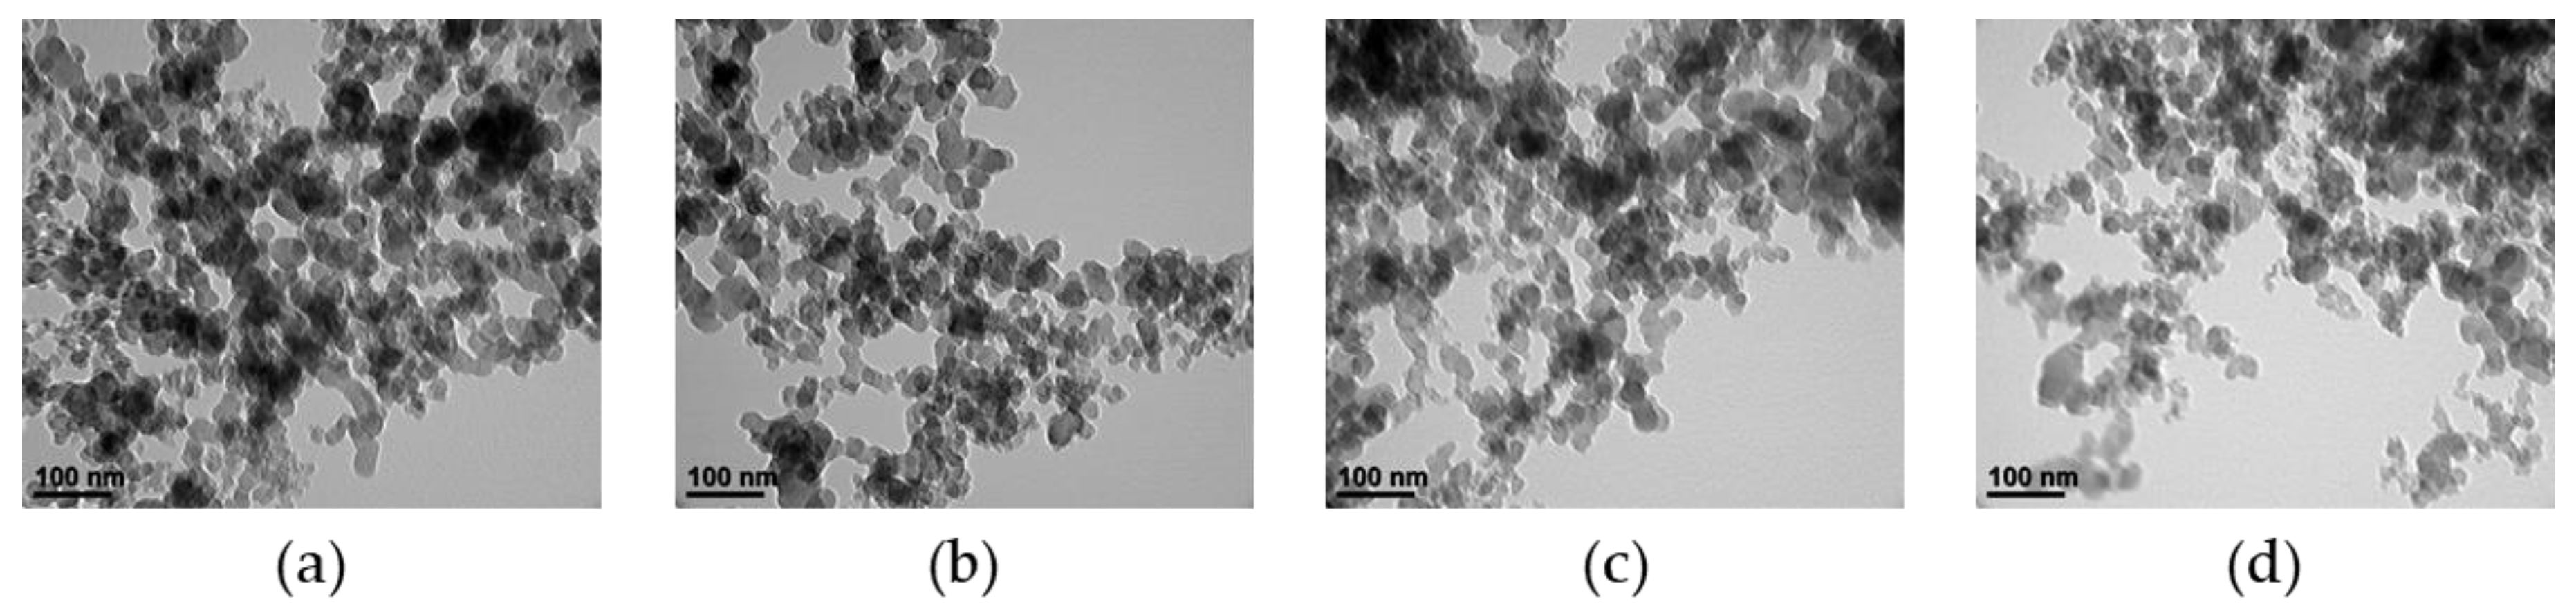
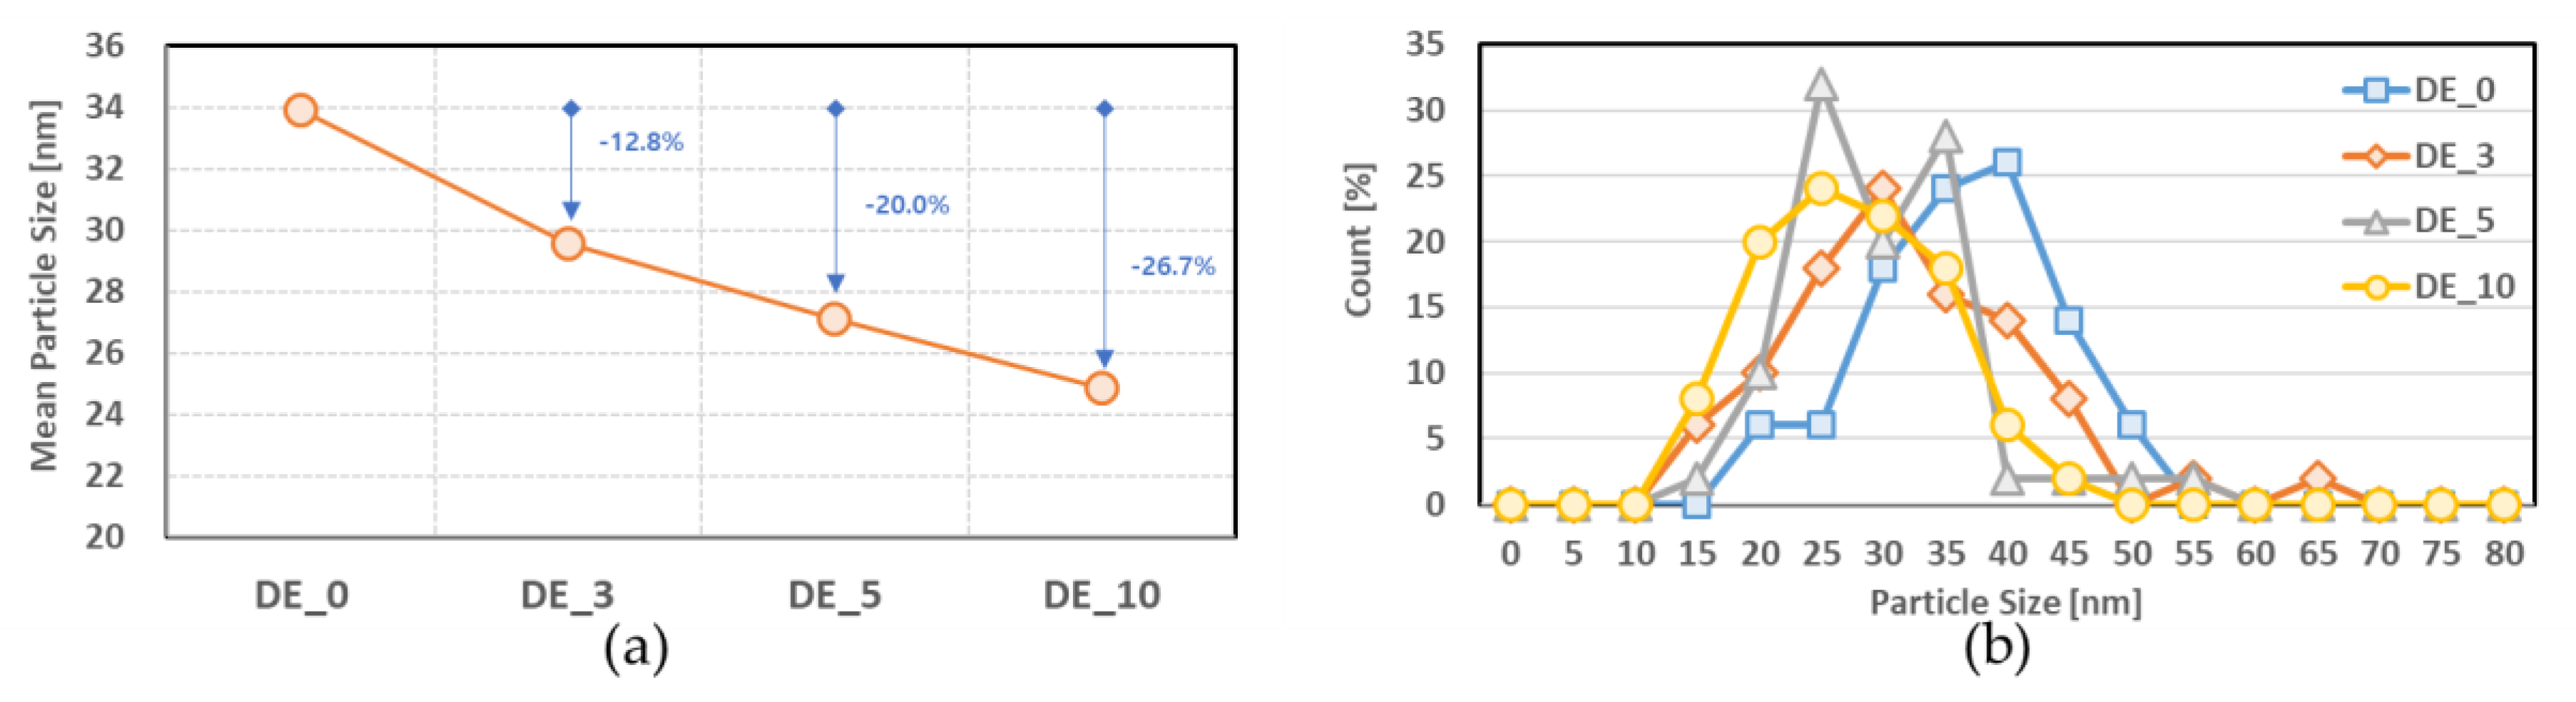
3.2.2. Soot Morphology
4. Conclusions
- The maximum combination pressure and maximum heat release rate of ethanol-blended fuels were higher than those of pure diesel fuel. By increasing the ethanol blend ratio, the maximum combustion pressure decreased and the maximum heat release increased.
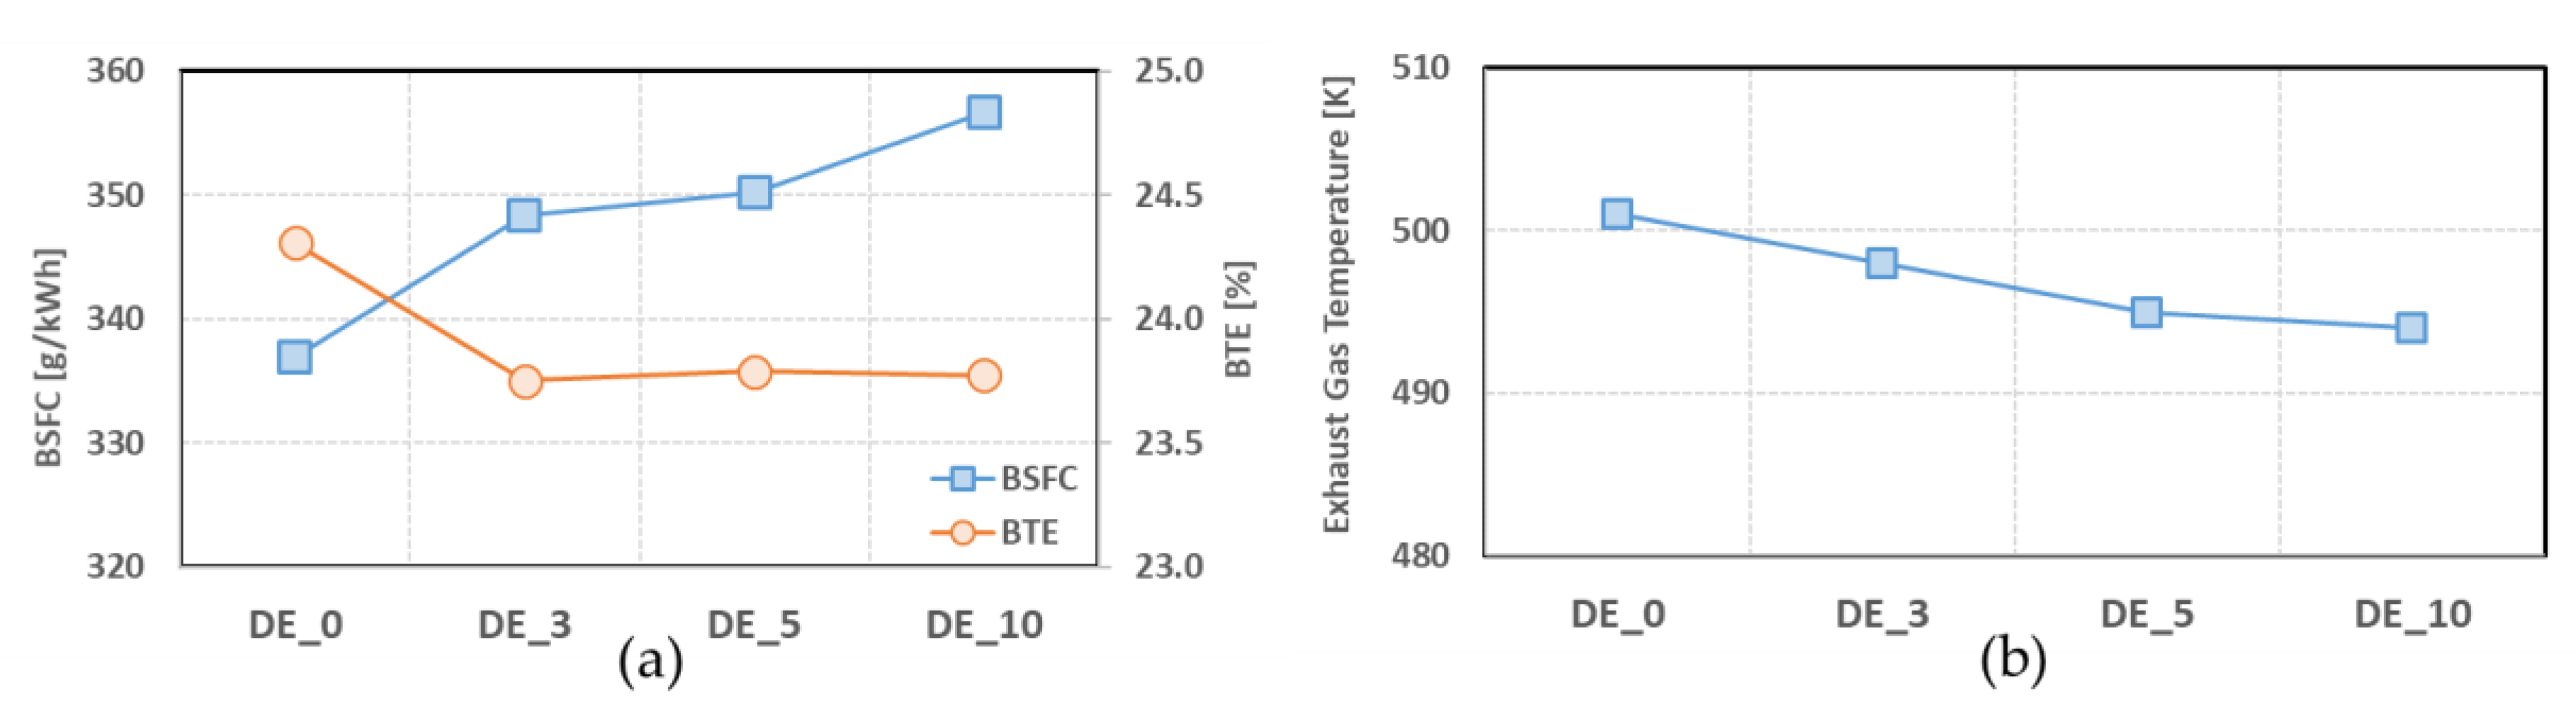
- The BSFC increased when ethanol was blended, and increased with the blend ratio; however, the BTEs of ethanol-blended fuels were lower than when pure diesel fuel was used.
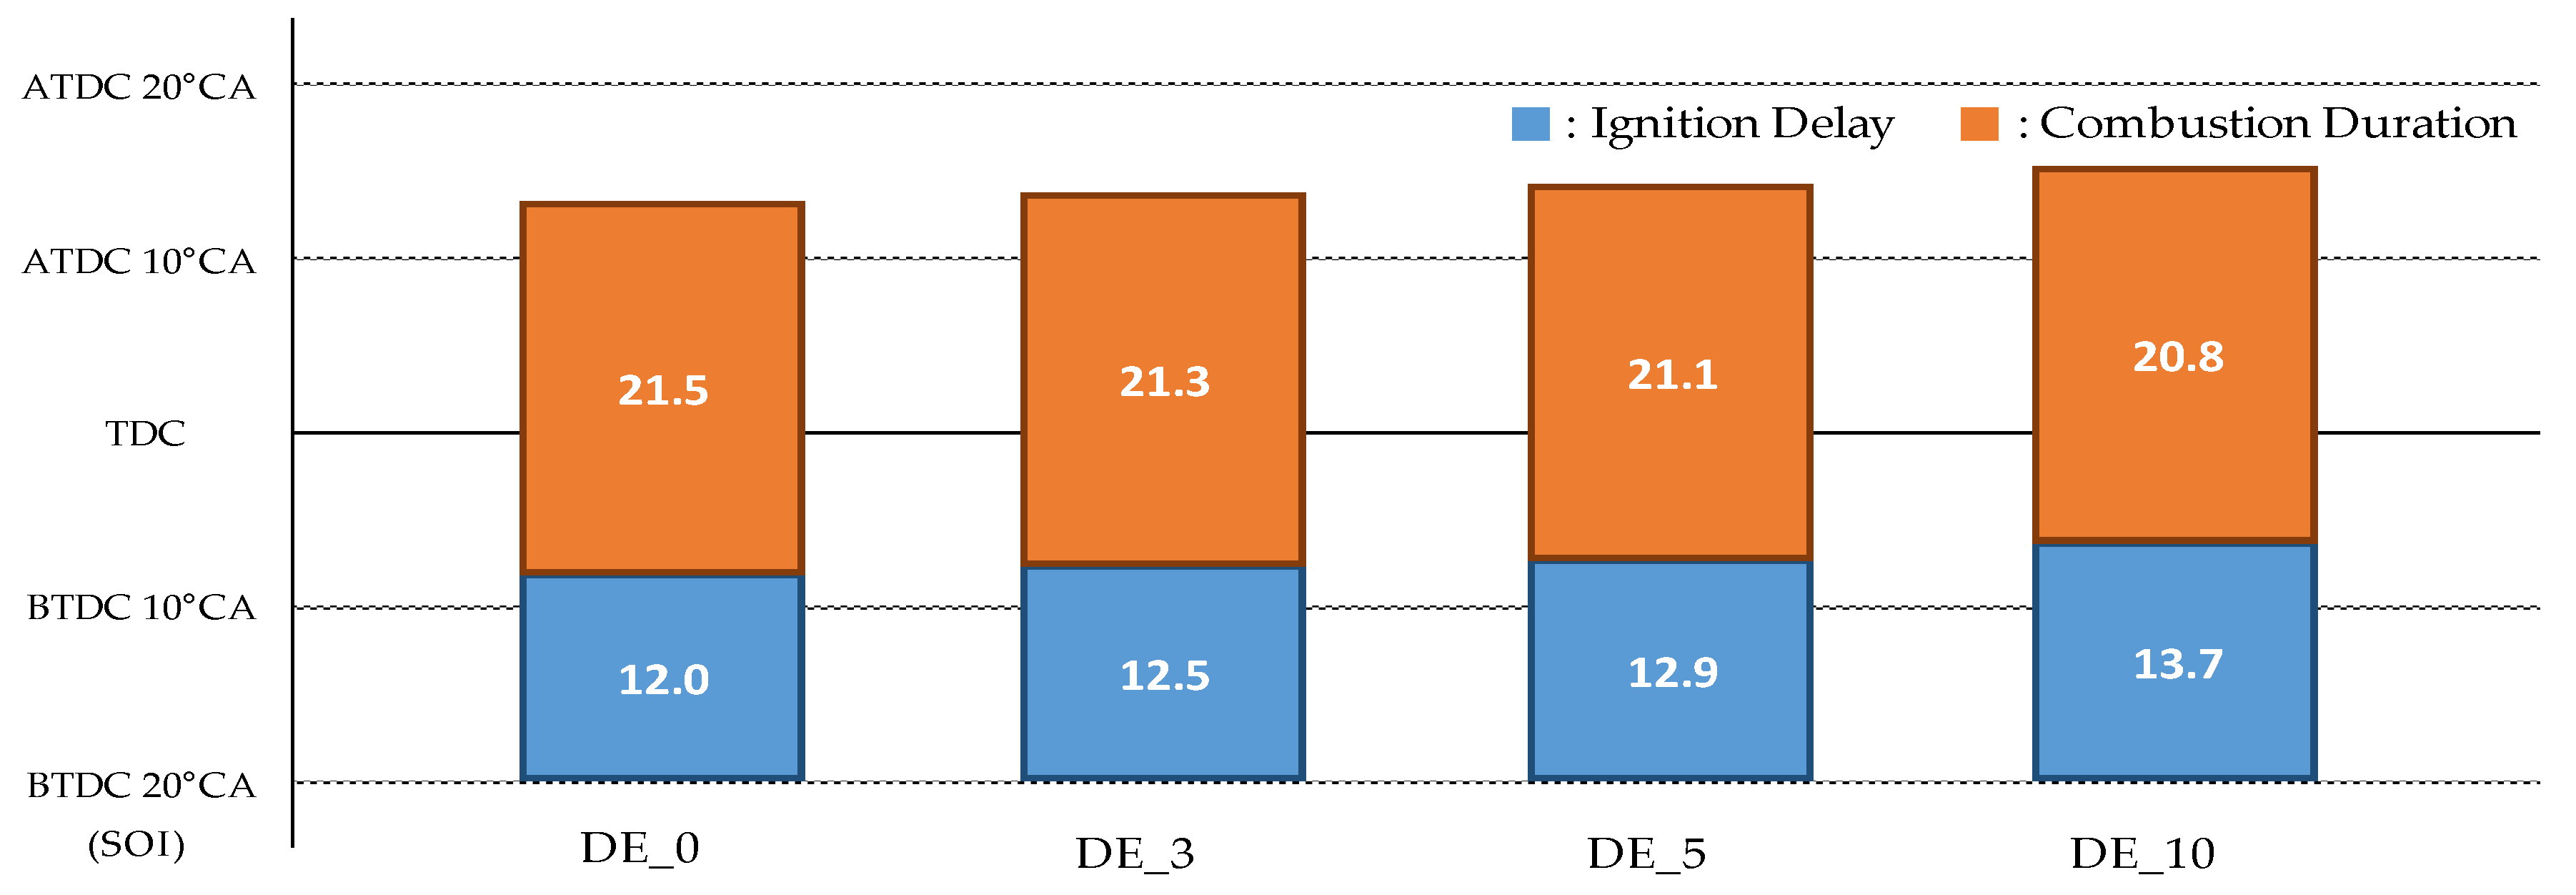
- As ethanol was blended and the blending ratio increased, the ignition delay increased, and the combustion duration decreased.
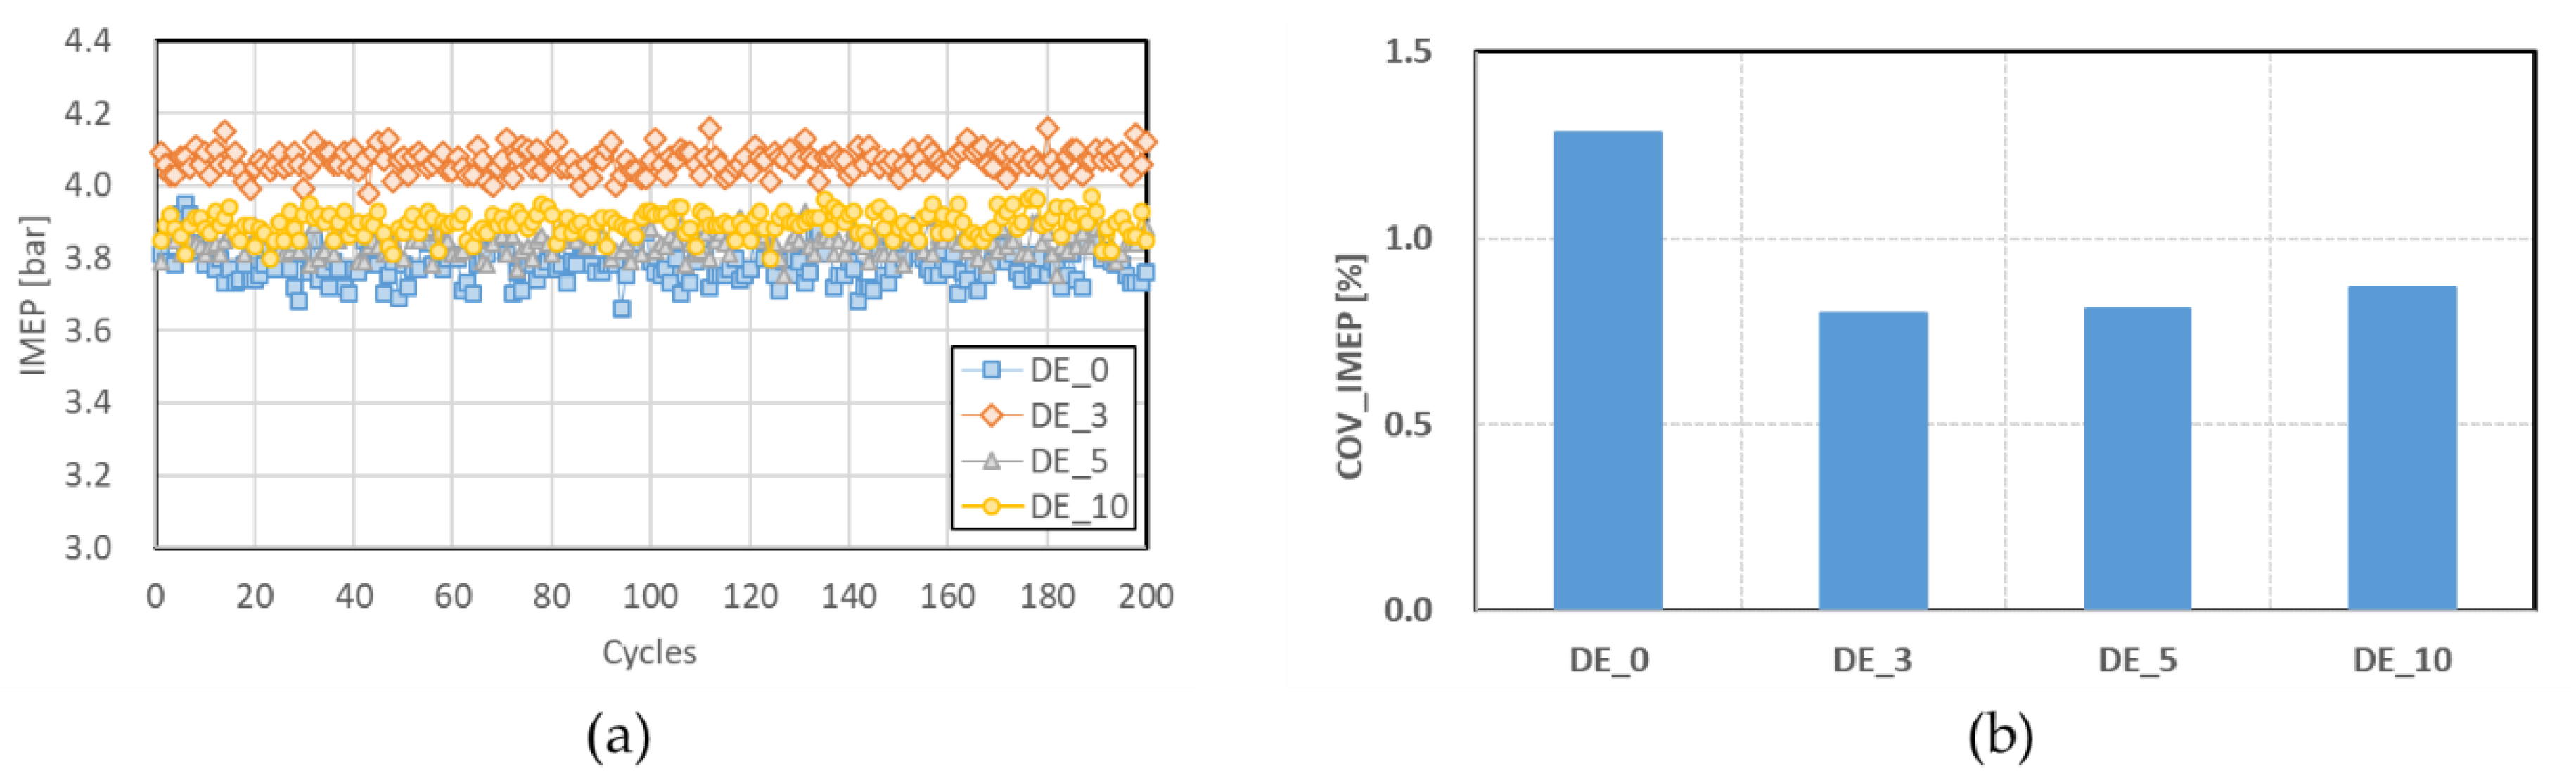
- The COVIMEP values of the ethanol-blended fuels were lower than those of the pure diesel fuel, and tended to increase as the ethanol blending ratio increased above 3%.
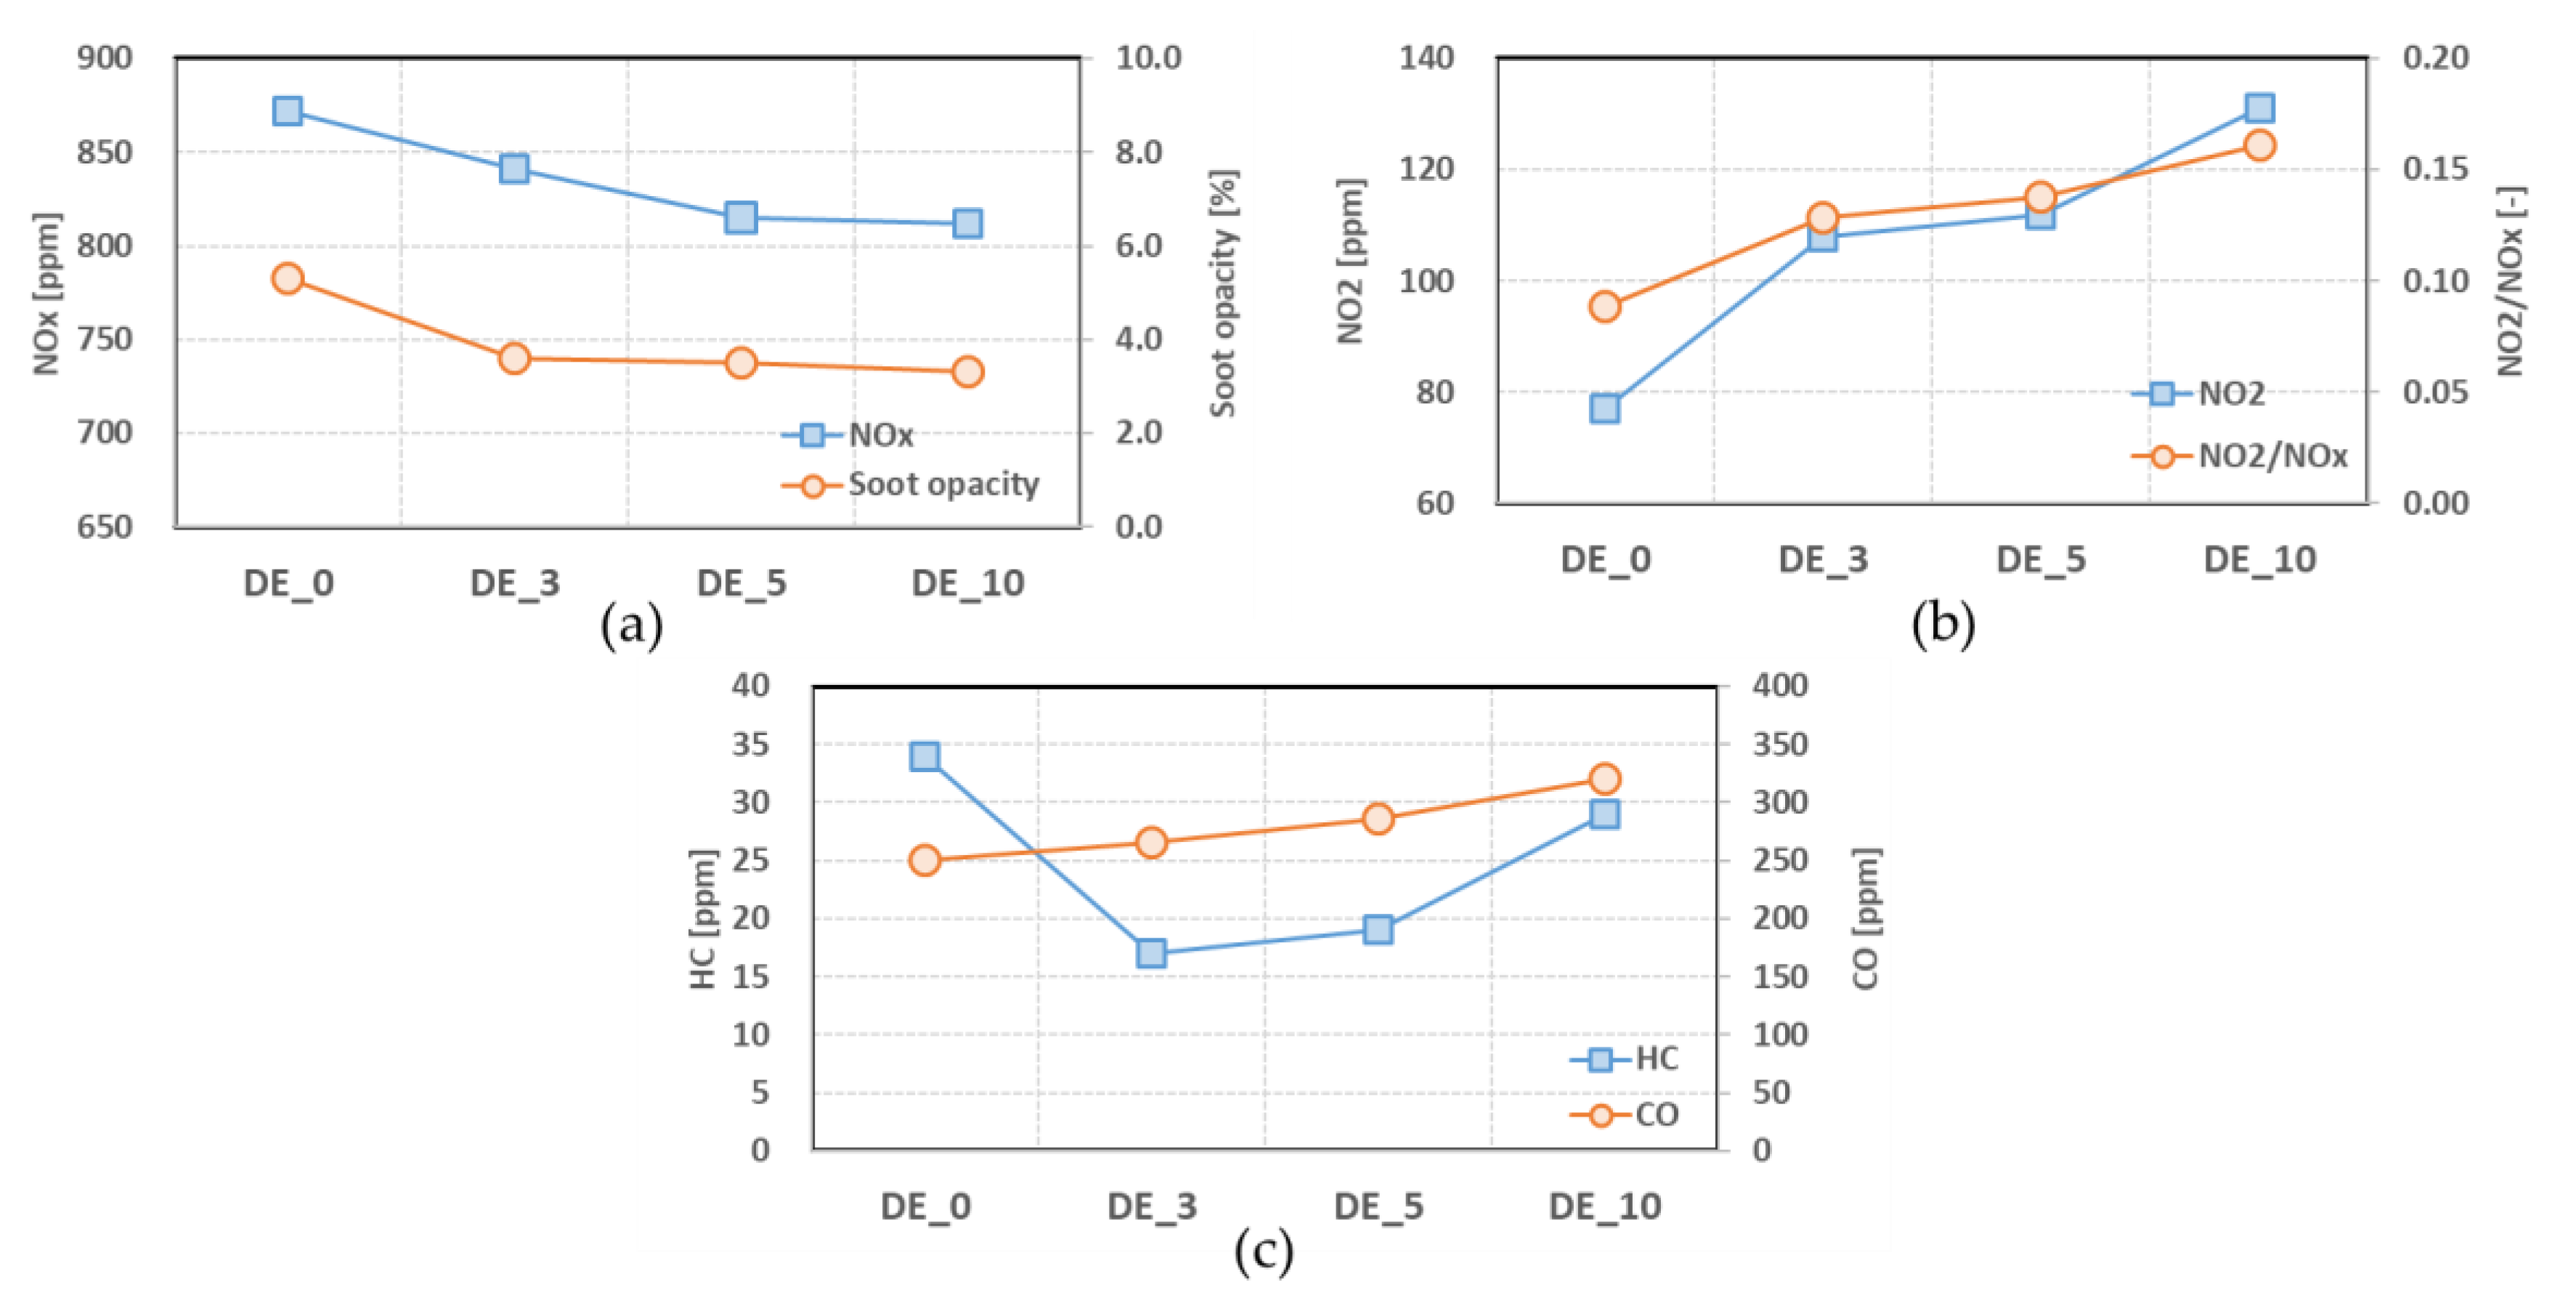
- When ethanol was blended and the blending ratio increased, the NOx and soot opacity decreased, but CO emissions increased. The emission ratio of NO2 in NOx also increased with more ethanol. The levels of HC showed a tendency to increase as the ethanol blending ratio increased, although the HC emissions of ethanol–diesel blended fuels are lower than those of pure diesel fuel.
- As the ethanol blending ratio increased, the mean size of the soot particles decreased, and the distribution of small particles increased.
Author Contributions
Acknowledgments
Conflicts of Interest
Abbreviations
| °CA | Crank Angle |
| ATDC | After Top Dead Center |
| BMEP | Brake Mean Effective Pressure |
| BSFC | Brake Specific Fuel Consumption |
| BTDC | Before Top Dead Center |
| BTE | Brake Thermal Efficiency |
| CA10 | The crank angle of 10% Mass Fraction Burned |
| CA50 | The crank angle of 50% Mass Fraction Burned |
| CA90 | The crank angle of 90% Mass Fraction Burned |
| CO | Carbon Monoxide |
| COV | Coefficient of Variation |
| DE_0 | 100% Diesel + 0% Ethanol, Pure petroleum diesel |
| DE_3 | 97% Diesel + 3% Ethanol |
| DE_5 | 95% Diesel + 5% Ethanol |
| DE_10 | 90% Diesel + 10% Ethanol |
| HC | Hydrocarbon |
| IMEP | Indicated Mean Effective Pressure |
| LHV | Lower Heating Value |
| MFB | Mass Fraction Burned |
| NOx | Nitric Oxide |
| TEM | Transmission Electron Microscopy |
References
- Bajpai, D.; Tyagi, V.K. Biodiesel: Source, production, composition, properties and its benefits. J. Oleo Sci. 2006, 55, 487–502. [Google Scholar] [CrossRef]
- Mahmudul, H.; Hagos, F.; Mamat, R.; Adam, A.A.; Ishak, W.; Alenezi, R.J.R.; Reviews, S.E. Production, characterization and performance of biodiesel as an alternative fuel in diesel engines—A review. Renew. Sustain. Energy Rev. 2017, 72, 497–509. [Google Scholar] [CrossRef]
- Lim, Y.-K.; Shin, S.-C.; Kim, J.-R.; Yim, E.-S.; Song, H.-O.; Kim, D. Characteristic analysis of GTL fuel as an automobile diesel. Appl. Chem. Eng. 2008, 19, 617–623. [Google Scholar]
- Suh, H.K.; Lee, C.S. A review on atomization and exhaust emissions of a biodiesel-fueled compression ignition engine. Renew. Sustain. Energy Rev. 2016, 58, 1601–1620. [Google Scholar] [CrossRef]
- Rajasekar, E.; Selvi, S. Review of combustion characteristics of CI engines fueled with biodiesel. Renew. Sustain. Energy Rev. 2014, 35, 390–399. [Google Scholar] [CrossRef]
- Hoekman, S.K.; Broch, A.; Robbins, C.; Ceniceros, E.; Natarajan, M. Review of biodiesel composition, properties, and specifications. Renew. Sustain. Energy Rev. 2012, 16, 143–169. [Google Scholar] [CrossRef]
- Alptekin, E.; Canakci, M. Determination of the density and the viscosities of biodiesel–diesel fuel blends. Renew. Energy 2008, 33, 2623–2630. [Google Scholar] [CrossRef]
- Çelebi, Y.; Aydın, H.J.F. An overview on the light alcohol fuels in diesel engines. Fuel 2019, 236, 890–911. [Google Scholar] [CrossRef]
- Gerdes, K.; Suppes, G.J. Miscibility of ethanol in diesel fuels. Ind. Eng. Chem. Res. 2001, 40, 949–956. [Google Scholar] [CrossRef]
- Ge, J.C.; Yoon, S.K.; Kim, M.S.; Choi, N.J.J.A.S. Application of canola oil biodiesel/diesel blends in a common rail diesel engine. Appl. Sci. 2017, 7, 34. [Google Scholar] [CrossRef]
- Kim, H.Y.; Ge, J.C.; Choi, N.J.J.A.S. Application of palm oil biodiesel blends under idle operating conditions in a common-rail direct-injection diesel engine. Appl. Sci. 2018, 8, 2665. [Google Scholar] [CrossRef]
- Kim, H.Y.; Ge, J.C.; Choi, N.J.J.E. Effects of fuel injection pressure on combustion and emission characteristics under low speed conditions in a diesel engine fueled with palm oil biodiesel. Energies 2019, 12, 3264. [Google Scholar] [CrossRef]
- Rakopoulos, D.; Rakopoulos, C.; Kakaras, E.; Giakoumis, E. Effects of ethanol–diesel fuel blends on the performance and exhaust emissions of heavy duty DI diesel engine. Energy Convers. Manag. 2008, 49, 3155–3162. [Google Scholar] [CrossRef]
- Sayin, C.J.F. Engine performance and exhaust gas emissions of methanol and ethanol–diesel blends. Fuel 2010, 89, 3410–3415. [Google Scholar] [CrossRef]
- Alptekin, E.J.F. Evaluation of ethanol and isopropanol as additives with diesel fuel in a CRDI diesel engine. Fuel 2017, 205, 161–172. [Google Scholar] [CrossRef]
- He, B.-Q.; Shuai, S.-J.; Wang, J.-X.; He, H.J.A.E. The effect of ethanol blended diesel fuels on emissions from a diesel engine. Atmos. Environ. 2003, 37, 4965–4971. [Google Scholar] [CrossRef]
- Li, D.-G.; Zhen, H.; Xingcai, L.; Wu-Gao, Z.; Jian-Guang, Y.J.R.E. Physico-chemical properties of ethanol–diesel blend fuel and its effect on performance and emissions of diesel engines. Renew. Energy 2005, 30, 967–976. [Google Scholar] [CrossRef]
- Xing-Cai, L.; Jian-Guang, Y.; Wu-Gao, Z.; Zhen, H.J.F. Effect of cetane number improver on heat release rate and emissions of high speed diesel engine fueled with ethanol–diesel blend fuel. Fuel 2004, 83, 2013–2020. [Google Scholar] [CrossRef]
- Di, Y.; Cheung, C.; Huang, Z.J.A.E. Comparison of the effect of biodiesel-diesel and ethanol-diesel on the gaseous emission of a direct-injection diesel engine. Atmos. Environ. 2009, 43, 2721–2730. [Google Scholar] [CrossRef]
- Huang, J.; Wang, Y.; Li, S.; Roskilly, A.P.; Yu, H.; Li, H.J.A.T.E. Experimental investigation on the performance and emissions of a diesel engine fuelled with ethanol–diesel blends. Appl. Therm. Eng. 2009, 29, 2484–2490. [Google Scholar] [CrossRef]
- Jamrozik, A.J.E.C. The effect of the alcohol content in the fuel mixture on the performance and emissions of a direct injection diesel engine fueled with diesel-methanol and diesel-ethanol blends. Energy Convers. Manag. 2017, 148, 461–476. [Google Scholar] [CrossRef]
- Tutak, W.; Jamrozik, A.; Pyrc, M.; Sobiepański, M.J.A.T.E. A comparative study of co-combustion process of diesel-ethanol and biodiesel-ethanol blends in the direct injection diesel engine. Appl. Therm. Eng. 2017, 117, 155–163. [Google Scholar] [CrossRef]
- Rahman, S.A.; Masjuki, H.; Kalam, M.; Abedin, M.; Sanjid, A.; Sajjad, H.J.E.C. Impact of idling on fuel consumption and exhaust emissions and available idle-reduction technologies for diesel vehicles—A review. Energy Convers. Manag. 2013, 74, 171–182. [Google Scholar] [CrossRef]
- Brodrick, C.-J.; Dwyer, H.A.; Farshchi, M.; Harris, D.B.; King, F.G., Jr.; Association, W.M. Effects of engine speed and accessory load on idling emissions from heavy-duty diesel truck engines. J. Air Waste Manag. Assoc. 2002, 52, 1026–1031. [Google Scholar] [CrossRef] [PubMed]
- Khan, A.S.; Clark, N.N.; Thompson, G.J.; Wayne, W.S.; Gautam, M.; Lyon, D.W.; Hawelti, D. Idle emissions from heavy-duty diesel vehicles: Review and recent data. J. Air Waste Manag. Assoc. 2006, 56, 1404–1419. [Google Scholar] [CrossRef] [PubMed]
- McCormick, R.L.; Graboski, M.S.; Alleman, T.L.; Yanowitz, J. Idle emissions from heavy-duty diesel and natural gas vehicles at high altitude. J. Air Waste Manag. Assoc. 2000, 50, 1992–1998. [Google Scholar] [CrossRef]
- Storey, J.M.; Thomas, J.F.; Lewis, S.A.; Dam, T.Q.; Edwards, K.D.; DeVault, G.L.; Retrossa, D.J. Particulate Matter and Aldehyde Emissions from Idling Heavy-Duty Diesel Trucks; SAE Technical Paper 0148-7191; SAE: Warrendale, PA, USA, 2003. [Google Scholar]
- Gao, Z.; Lin, S.; Ji, J.; Li, M.J.E. An experimental study on combustion performance and flame spread characteristics over liquid diesel and ethanol-diesel blended fuel. Energy 2019, 170, 349–355. [Google Scholar] [CrossRef]
- Hansen, A.C.; Zhang, Q.; Lyne, P.W. Ethanol–diesel fuel blends—A review. Bioresour. Technol. 2005, 96, 277–285. [Google Scholar] [CrossRef]
- Lapuerta, M.; Armas, O.; Garcia-Contreras, R.J.F. Stability of diesel–bioethanol blends for use in diesel engines. Fuel 2007, 86, 1351–1357. [Google Scholar] [CrossRef]
- Gnanamoorthi, V.; Devaradjane, G. Effect of compression ratio on the performance, combustion and emission of DI diesel engine fueled with ethanol–Diesel blend. J. Energy Inst. 2015, 88, 19–26. [Google Scholar] [CrossRef]
- Garai, A.; Mondal, S.; Pal, S.; Chatterjee, S.; Sen, S.; Mukhopadhyay, A.J.E.T.; Science, F. Experimental investigation of spray formation in a hybrid atomizer using diesel, ethanol and ethanol blended diesel. Exp. Therm. Fluid Sci. 2019, 100, 158–170. [Google Scholar] [CrossRef]
- Heywood, J. Internal Combustion Engine Fundamentals; McGraw-Hill: New York, NY, USA, 1988. [Google Scholar]
- Cooney, C.P.; Worm, J.J.; Naber, J.D. Combustion characterization in an internal combustion engine with ethanol− gasoline blended fuels varying compression ratios and ignition timing. Energy Fuels 2009, 23, 2319–2324. [Google Scholar] [CrossRef]
- Li, B.; Li, Y.; Liu, H.; Liu, F.; Wang, Z.; Wang, J.J.A.E. Combustion and emission characteristics of diesel engine fueled with biodiesel/PODE blends. Appl. Energy 2017, 206, 425–431. [Google Scholar] [CrossRef]
- Caton, J.A. Combustion phasing for maximum efficiency for conventional and high efficiency engines. Energy Convers. Manag. 2014, 77, 564–576. [Google Scholar] [CrossRef]
- Martins, F.P.; Lacava, P.T.; de Andrade, C.R.; Garzuzi, S. Alternative Fuels: A Review About Anhydrous and Hydrous Ethanol Properties; SAE Technical Paper 0148-7191; SAE: Warrendale, PA, USA, 2016. [Google Scholar]
- Kun-Balog, A.; Sztankó, K.; Józsa, V. Pollutant emission of gaseous and liquid aqueous bioethanol combustion in swirl burners. Energy Convers. Manag. 2017, 149, 896–903. [Google Scholar] [CrossRef]
- He, C.; Li, J.; Ma, Z.; Tan, J.; Zhao, L. High NO2/NOx emissions downstream of the catalytic diesel particulate filter: An influencing factor study. J. Environ. Sci. 2015, 35, 55–61. [Google Scholar] [CrossRef]
- Ge, J.C.; Kim, H.Y.; Yoon, S.K.; Choi, N.J. Reducing volatile organic compound emissions from diesel engines using canola oil biodiesel fuel and blends. Fuel 2018, 218, 266–274. [Google Scholar] [CrossRef]
- Lapuerta, M.; Armas, O.; Garcia-Contreras, R. Effect of ethanol on blending stability and diesel engine emissions. Energy Fuels 2009, 23, 4343–4354. [Google Scholar] [CrossRef]
- Wei, J.; Fan, C.; Qiu, L.; Qian, Y.; Wang, C.; Teng, Q.; Pan, M. Impact of methanol alternative fuel on oxidation reactivity of soot emissions from a modern CI engine. Fuel 2020, 268, 117352. [Google Scholar] [CrossRef]
- Wei, J.; Zeng, Y.; Pan, M.; Zhuang, Y.; Qiu, L.; Zhou, T.; Liu, Y. Morphology analysis of soot particles from a modern diesel engine fueled with different types of oxygenated fuels. Fuel 2020, 267, 117248. [Google Scholar] [CrossRef]


| Properties | Units | Diesel | Bioethanol |
|---|---|---|---|
| Density at 15 °C | kg/m3 | 836.8 | 799.4 |
| Viscosity at 40 °C | mm2/s | 2.719 | 1.10 |
| Lower heating value | MJ/kg | 43.96 | 28.18 |
| Cetane number | - | 55.8 | 8.0 |
| Flash point | °C | 55 | 12.0 |
| Oxygen content | wt.% | 0 | 34.3 |
| Hydrogen content | wt.% | 13.0 | 13.1 |
| Carbon content | wt.% | 85.7 | 52.2 |
| Engine Parameters | Unit | Specification |
|---|---|---|
| Engine Type | - | In-line 4 Cylinder, WGT Turbocharged, EGR |
| Maximum Power/Torque | kW/Nm | 84.6(@4000 rpm)/260(@2000 rpm) |
| Bore × Stroke | mm × mm | 83 × 92 |
| Displacement | cc | 1991 |
| Compression Ratio | - | 17.7:1 |
| Number of Injector nozzle holes | - | 5 |
| Injector type | - | Solenoid |
| Injector hole diameter | mm | 0.17 |
| Table | Unit | Condition |
|---|---|---|
| Engine Speed | rpm | 750 ± 10 (Low idle speed) |
| Engine Load | Nm | 40 |
| Cooling Water Temperature | °C | 85 ± 5 |
| Intake Air Temperature | °C | 25 ± 5 |
| Fuel Injection Pressure | bar | 280 |
| Injection Timing | °CA | Main BTDC 2/Pilot BTDC 20 |
| Test Fuel | Max Combustion Pressure (Pmax) | Location of Pmax | Max Heat Release Rate (HRRmax) | Location of HRRmax | Exhaust Gas Temperature | BSFC | BTE |
|---|---|---|---|---|---|---|---|
| (bar) | (°CA) | (J/°CA) | (°CA) | (K) | (g/kWh) | (%) | |
| DE_0 | 58.3 | ATDC 11 | 28.64 | ATDC 7 | 501 | 336.9 | 24.3 |
| DE_3 | 60.7 | ATDC 11 | 31.30 | ATDC 7 | 498 | 348.3 | 23.8 |
| DE_5 | 60.1 | ATDC 11 | 31.86 | ATDC 8 | 495 | 350.3 | 23.8 |
| DE_10 | 60.0 | ATDC 11 | 32.53 | ATDC 8 | 494 | 356.7 | 23.8 |
© 2020 by the authors. Licensee MDPI, Basel, Switzerland. This article is an open access article distributed under the terms and conditions of the Creative Commons Attribution (CC BY) license (http://creativecommons.org/licenses/by/4.0/).
Share and Cite
Kim, H.Y.; Ge, J.C.; Choi, N.J. Effects of Ethanol–Diesel on the Combustion and Emissions from a Diesel Engine at a Low Idle Speed. Appl. Sci. 2020, 10, 4153. https://doi.org/10.3390/app10124153
Kim HY, Ge JC, Choi NJ. Effects of Ethanol–Diesel on the Combustion and Emissions from a Diesel Engine at a Low Idle Speed. Applied Sciences. 2020; 10(12):4153. https://doi.org/10.3390/app10124153
Chicago/Turabian StyleKim, Ho Young, Jun Cong Ge, and Nag Jung Choi. 2020. "Effects of Ethanol–Diesel on the Combustion and Emissions from a Diesel Engine at a Low Idle Speed" Applied Sciences 10, no. 12: 4153. https://doi.org/10.3390/app10124153
APA StyleKim, H. Y., Ge, J. C., & Choi, N. J. (2020). Effects of Ethanol–Diesel on the Combustion and Emissions from a Diesel Engine at a Low Idle Speed. Applied Sciences, 10(12), 4153. https://doi.org/10.3390/app10124153