1. Introduction
In recent decades, technological evolution in tunneling engineering has provided machines able to perform excavation, to install final lining elements and to move excavated soil (geotechnical engineering meaning/definition) in a continuous, automatized and controlled process [
1]. These machines, commonly known as Tunnel Boring Machines (TBM), represent nowadays a reference standard often associated with excavation technology called Earth Pressure Balance (EPB), which requires the continuous injection of chemicals in a process defined soil conditioning.
Soil conditioning is required primarily to modify the properties of the excavated soil and to keep a correct distribution of the pressure applied to the front face to reduce settlement effects on pre-existing buildings. This allows a proper outflow of the same soil from the front of the excavation chamber through the screw conveyor, towards the conveyor belt, to reduce, in cases of coarse-grained soils, the abrasion of the surfaces of the metallic excavation tools [
2] and to reduce, in cases of fine-grained soils, the tendency of the soil to adhere to the metal surfaces of the excavation tools, reducing torque and decreasing the risk of the excavation head block (clogging effect) [
3].
The injected chemicals, named conditioning agents or conditioning mixtures, are generally composed of a water solvent phase (>50%), surfactants (10–40%) and additives (0.1–5.0%). The surfactants (generally anionic) represent the main chemical component of the mixture and consist of a negatively charged head (in water, they release a cation, usually sodium) with a high polarity and a non-polar carbonic tale. Their main role is to vary the water surface tension by incorporating the external air into spherical-like shaped structures, forming bubbles of different sizes and, as a consequence, foam [
4]. The durability of the foam is therefore a function of the stability of the protective film constituted by surfactant molecules and water and is influenced by the viscosity of the liquid phase, by the mechanical resistance of the film and by other factors [
5].
Regarding additives, such compounds can be organic and inorganic (mainly salts to modify the viscosity, the colligative properties, the density of the mixture or to maintain the pH in a specific range), which mainly have different properties such as antifreeze, antimicrobial and stabilizers [
6,
7].
The most common anionic surfactant used in commercial conditioning mixtures is the anionic surfactant sodium lauryl ether sulphate (SLES), whose persistence in the environment and biodegradability has been widely discussed as of a single compound [
8,
9,
10,
11,
12]. However, in commercial formulations, additional chemicals (stabilizing agents, preservatives, anti-freezing and anti-redeposition agents) are included to increase the quality of the commercial product. The impact of such chemicals is studied by considering the in silico approach and ecotoxicology assays [
13]. Therefore, a study of the biodegradation of the whole conditioning mixtures is necessary. The closed bottle method, according to the Organisation for Economic Co-operation and Development (OECD) guideline 301 D [
14,
15], is recommended as a simple test for the evaluation of the biodegradation of organic compounds [
16]. Such tests involve the determination of the Biochemical Oxygen Demand (BOD) at selected time intervals up to 28 days. When biodegradation occurs, microorganisms consume oxygen until the complete removal of organic substances is achieved. First, surfactant biodegradation is involved, while the ultimate biodegradation (BOD
u) occurs when all surfactant molecules are mineralized [
17]. In the presence of only biodegradable substrates, Chemical Oxygen Demand (COD) represents a measure of the total oxygen required for the stabilization of the organic compounds and can provide an estimation of the BOD
u [
18].
For organic compounds, biodegradation is also measured as Total Organic Carbon (TOC) removal, though oxygen consumption can be attributed also to the biological oxidation of non-carbonaceous compounds, such as ammonia nitrification [
19]. It is well known that biodegradation rate is dependent on the type of bacterial strain/consortium adopted and different organic removal rates can be obtained: for instance, the degradation of SLES was 11% with
Serratia odorifera and a complete biodegradation can be reached if
Serratia is coupled with
Acinetobacter [
20].
The use of a specific inoculum has proved to be crucial in defining a reproducible procedure and to compare results obtained by similar tests on different chemical mixtures [
21].
The
Bacillus Clausii is an inoculum source commercially available and its use does not require particular precautions. It was demonstrated that this kind of probiotic, used to prevent and treat human and animal diseases, is resistant to pharmaceutical compounds especially antibiotics [
22]. Basing on such assumptions, it is a good candidate to be used for the study of biodegradability even on complex matrices such as excavation conditioning mixtures.
In a previous work [
23], the biodegradability of three commercial polymeric foams, adopted during TBM-EPB excavation technology, has been studied by considering the procedure of closed bottle tests up to 28 days and with two different bacterial sources:
Bacillus Clausii and soil humus. The methodology is based on the determination of the BOD, COD and TOC of the conditioning mixture over the time. The adoption of a mixed consortium (soil) proved to be suitable to establish the high biodegradation behavior of polymeric foams after 10 days of closed bottle tests, while the adoption of a specific inoculum (
Bacillus Clausii), despite 28 days of investigation to observe the development of the biodegradation process, guarantees the achievement of repeatable and reproducible results, a crucial aspect in a comparative study.
The present study was aimed at developing a short-time and reproducible procedure that, on the basis of the execution of simple laboratory Accelerated Biodegradation Tests (ABT), allowed the evaluation of the biodegradability of conditioning mixtures under different operative conditions, such as dosage and type of inoculum. First, the study involved the execution of closed bottle tests (OECD guideline 301 D) for the evaluation of the BOD value after five days (BOD5) to compare two different inocula (Bacillus Clausii and soil humus) in the assessment of the mixtures’ biodegradation. In a second series of tests, a rapid and replicable procedure (ABT) was proposed and tested, using Bacillus Clausii as the inoculum. In the view of optimization of such a procedure, the effects of temperature and pH on the biodegradation process were evaluated. All the results have been elaborated through a non-linear data fitting using kinetic models known in the literature to obtain quantitative parameters for literature data comparisons.
2. Materials and Methods
Three of the most commonly employed conditioning mixtures in EPB-TBM tunneling activities, indicated as A, B and C, were used as mixture models for the present study. The information of each mixture reported in the safety data sheets includes the concentration of SLES and the co-presence of 1,2-Benzisothiazol-3(2H)-one in B and hexylene glycol in C, as additives, as shown in
Table 1, where the Total Organic Carbon (TOC) and Chemical Oxygen Demand (COD) are also reported.
For each conditioning mixture, three solutions were prepared by dissolving A, B and C in demineralized water. Three different dilution ratios were used: 1:500, 1:750 and 1:1000 (v/v) corresponding to 0.20, 0.13 and 0.10% vol., respectively. Biodegradability tests were performed according to the closed bottles procedure to assess the biodegradability of the investigated mixtures at different dosage (0.20 and 0.10%), and to evaluate the effect of the inoculum selected on the biodegradation rate. Bacillus Clausii was compared to a mixed inoculum obtained by dissolving in water commercial soil humus (Altea Natural Humus; Composition of the dry product: Nitrogen (N) content 2 wt% and Organic (C) content 26 wt%).
After a vigorous mixing, the suspension was separated by sedimentation for 30 min and the supernatant was then kept under continuous aeration [
24].
For the closed bottle procedure, different mineral stock solutions were prepared according to the OECD method, in particular:
- -
Solution 1 [8.50 g/L of KH2PO4, 21.75 g/L of K2HPO4, 33.40 g/L of Na2HPO4∙2H2O and 0.50 g/L of NH4Cl];
- -
Solution 2 [27.50 g/L of CaCl2];
- -
Solution 3 [22.50 g/L of MgSO4∙7H2O];
- -
Solution 4 [0.25 g/L of FeCl3∙6H2O].
A diluting water solution was prepared by dissolving the mineral stock solutions (1 mL for each mineral) to 1.0 L of demineralized water. This solution was kept in vigorous aeration for 20 min and the foam agent was then added. The bottles were filled with 250 mL of the prepared foam agent solution and 2.0 mL of bacteria inoculum were added. Each bottle is provided by a cup with a digital display that allowed the online monitoring of the BOD value as oxygen consumption.
Neutral pH condition and room temperature (25 °C) were maintained during the closed bottle tests. TOC (determined by a TOC-L analyzer Shimadzu) and COD (determined through colorimetric method [
25]) were measured to define a general description of the process by using two indexes: the BOD(t)/COD(t = 0) and COD(t)/TOC(t) ratios. The first parameter (also known as the biodegradation index [
26]) defines the rate of oxidable compounds removal, while the second one could highlight the presence of reducing species different from organics.
The mineralization of organic compounds into CO
2 and H
2O was evaluated by TOC removal %, calculated by the following equation:
where TOC [mg/L] was measured at the beginning of the tests (t = 0) and at a selected time t. In the adopted conditions, the mean values of the TOC (t = 0) were 152.08, 210.77 and 316.16 mg/L (for the conditioning mixture (A); 70.03, 99.70 and 149.56 mg/L (for the conditioning mixture (B); 72.24, 115.21 and 172.67 mg/L (for the conditioning mixture (C), at 0.10, 0.13 and 0.20%, respectively.
In the ABT 1.5 L of the solution, prepared according to the procedure previously reported, was maintained under a vigorous aeration (~1 L/min) to provide the oxygen necessary to the microorganism source during biological oxidation. The same BOD closed bottle operative conditions have been adopted in ABT. In the latter case, the effect of an intermediate dosage (0.13%), pH and temperature were investigated. H2SO4 (1.0 M) and NaOH (2.0 M) were used to reach acid (pH = 3) and alkaline (pH = 8) pH conditions, respectively, while 20, 30 and 40 °C were chosen as the operative temperatures. A pH meter (Crison 421) and a thermometer were adopted during the monitoring of the tests.
All results have been reported as the mean value of at least three repetitions for each test: a standard deviation below 10% was calculated in all tests.
The fitting of the experimental results, in term of organic carbon concentration (c) and time (t), collected over the ABT were performed by considering three kinetic models Monod (Equation (2)) [
27], Blackman (Equation (3)) [
28] and Tessier (Equation (4)) [
29], whose reaction rate expressions are reported below:
where the microorganism growth rate µ
M [mg/l h] and the substrate saturation constant K
s [mg/L] can be calculated through the Runge–Kutta iterative method (Equation (5)) with a step-size h = 0.5 h [
30].
The choice of the best representative model of the process was carried out by evaluating the error function expressed as the difference between the experimental (
cexp) data and the calculated (
ccalc) one with the model (ε) for all the values (n), as reported in the Equation (6):
3. Results and Discussion
In a previous investigation, BOD curves up to 28 days for the mixtures A, B and C (0.20%) were reported and a significative enhancement on biodegradation was observed by adopting soil bacterial inoculum [
23]. The high activity of the microorganisms was highlighted already after 10 days of test, when, from the comparison of the TOC, COD and BOD data, a comparison between the different biodegradability of the foaming agents was possible to be made [
23].
This type of investigation is required in the case of an a priori evaluation on the choice of the foaming agent to be used during the excavation activities’ joint geotechnical assessments. In case of an on-line monitoring, a short methodology may be useful especially when, for example, adverse conditions on TBM operations, and a dosage change of foam is required. In this case, time is a crucial parameter for establishing the effects of a change in dosages.
For this reason, five days of closed bottle tests as short tests were performed at different polymer concentration (0.20 and 0.10%) and two different inocula (
Bacillus Clausii and soil). In
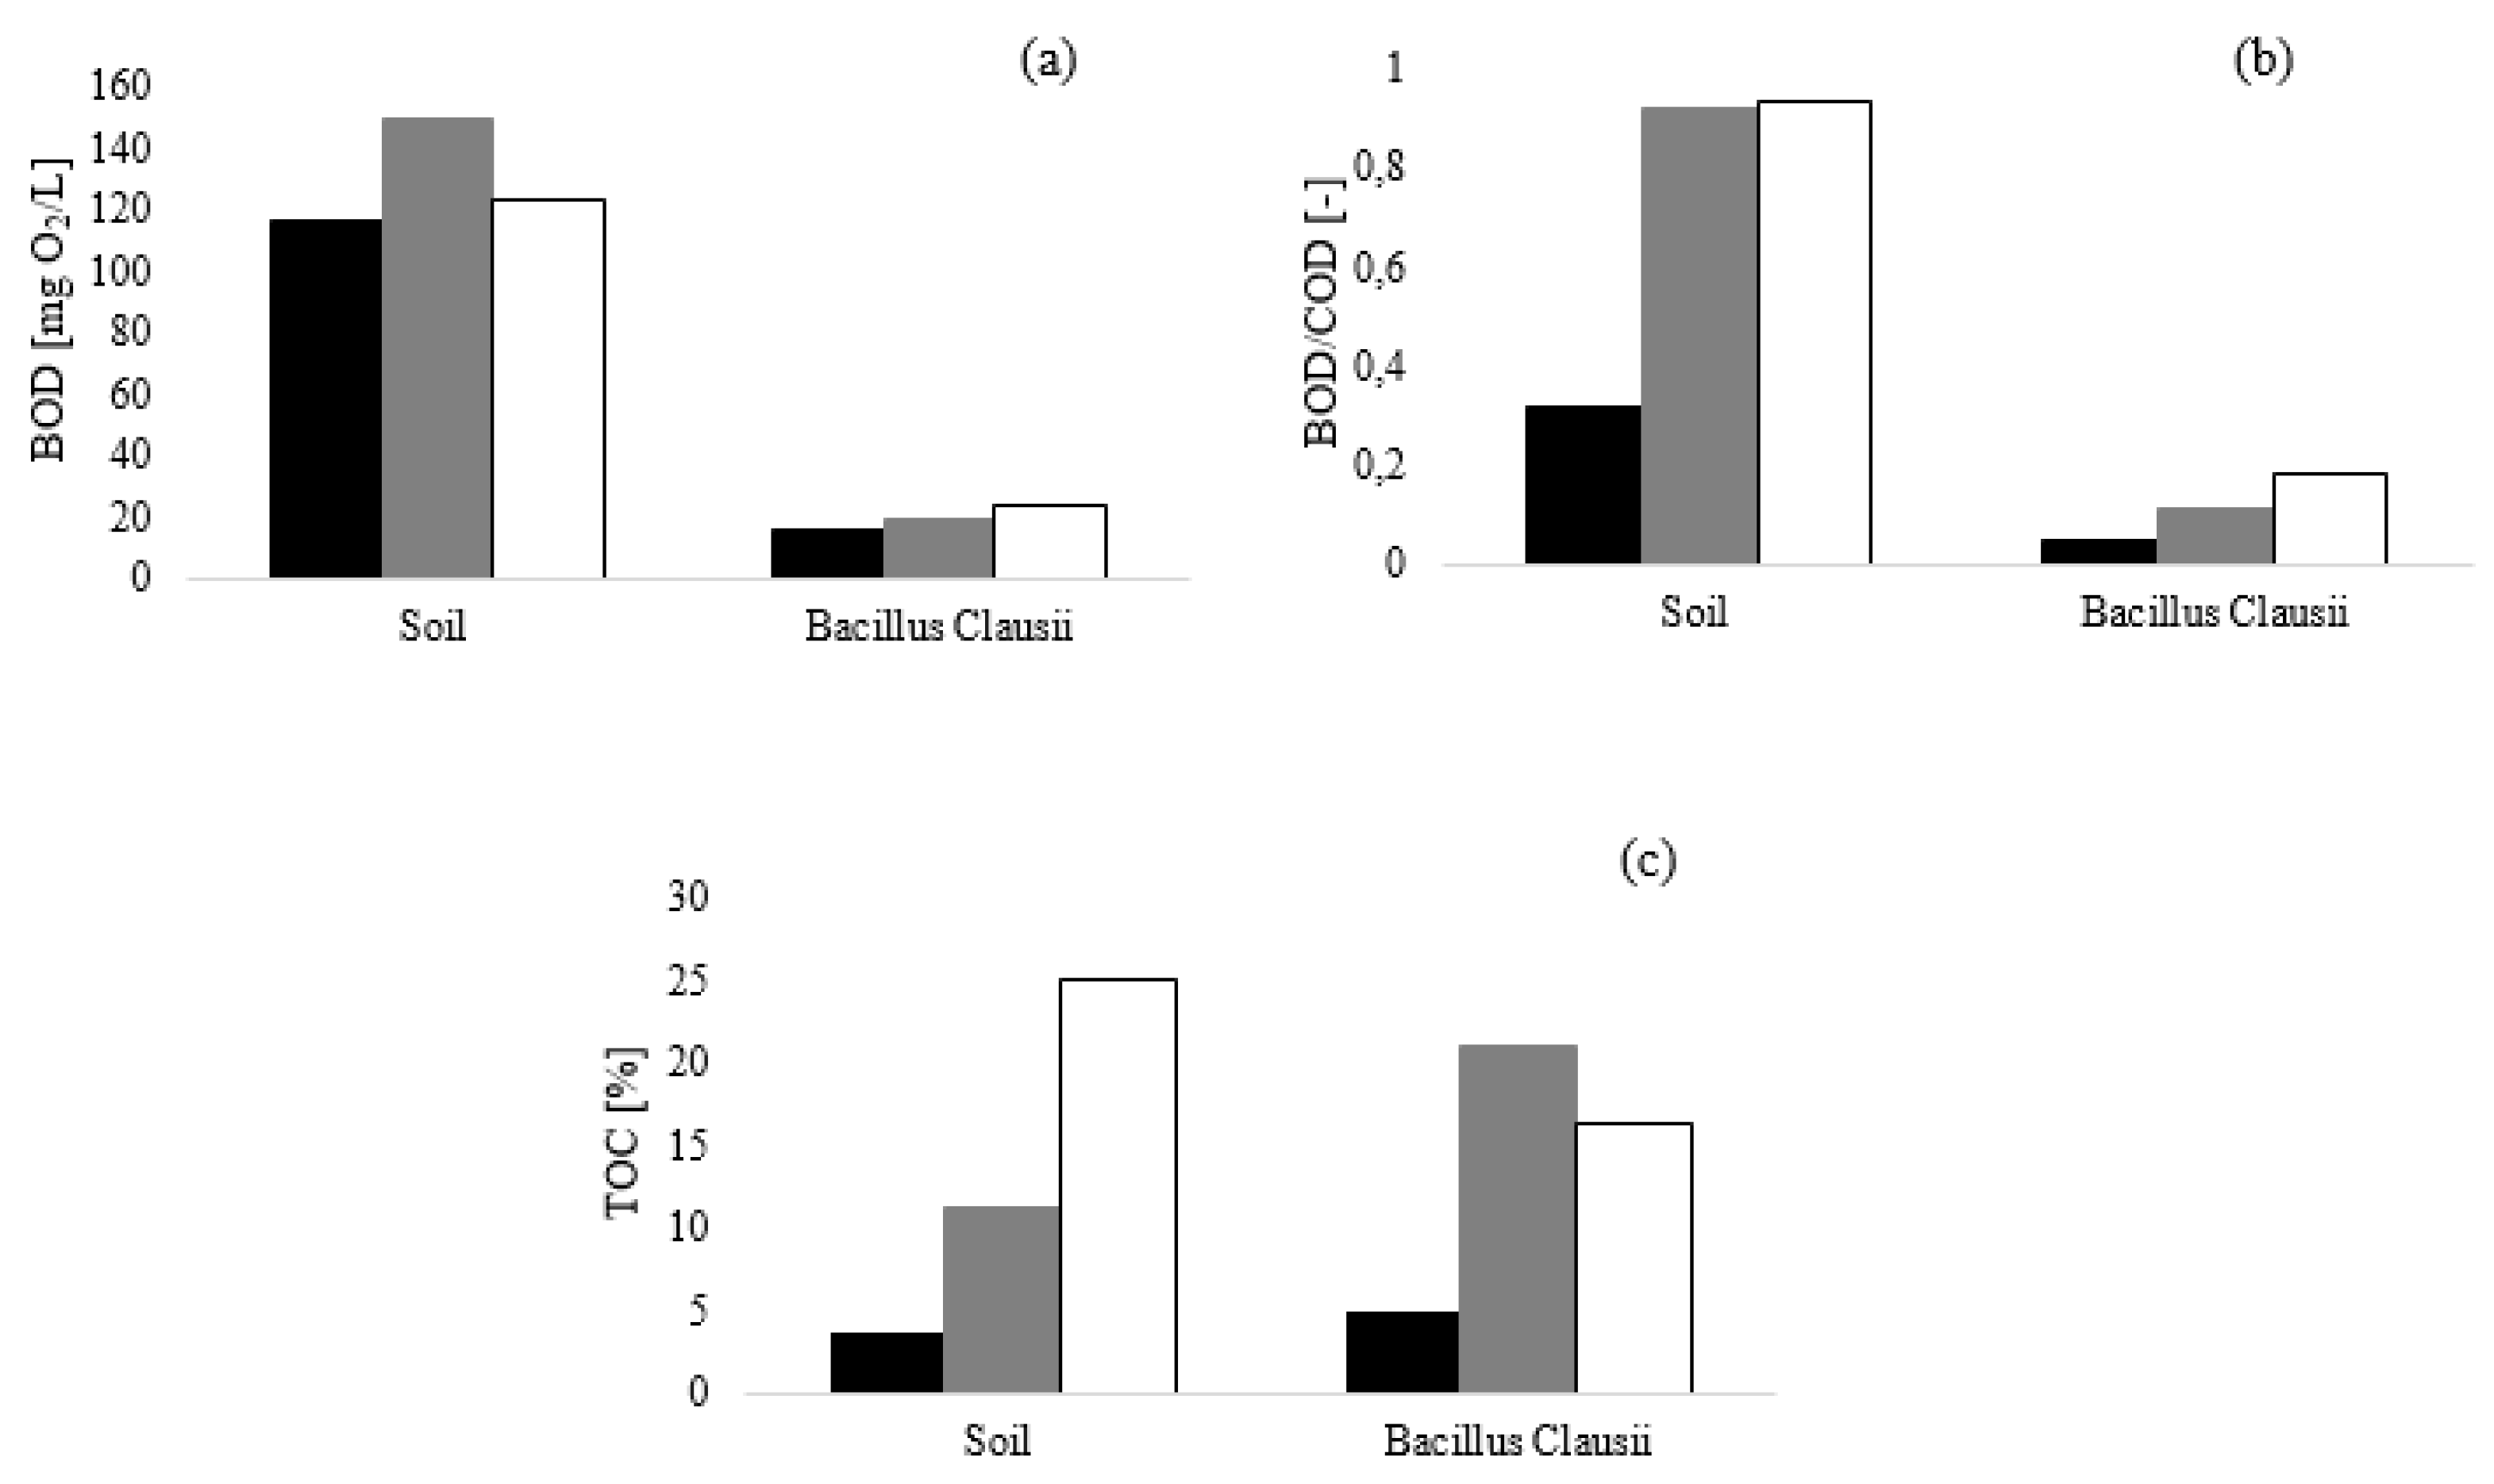
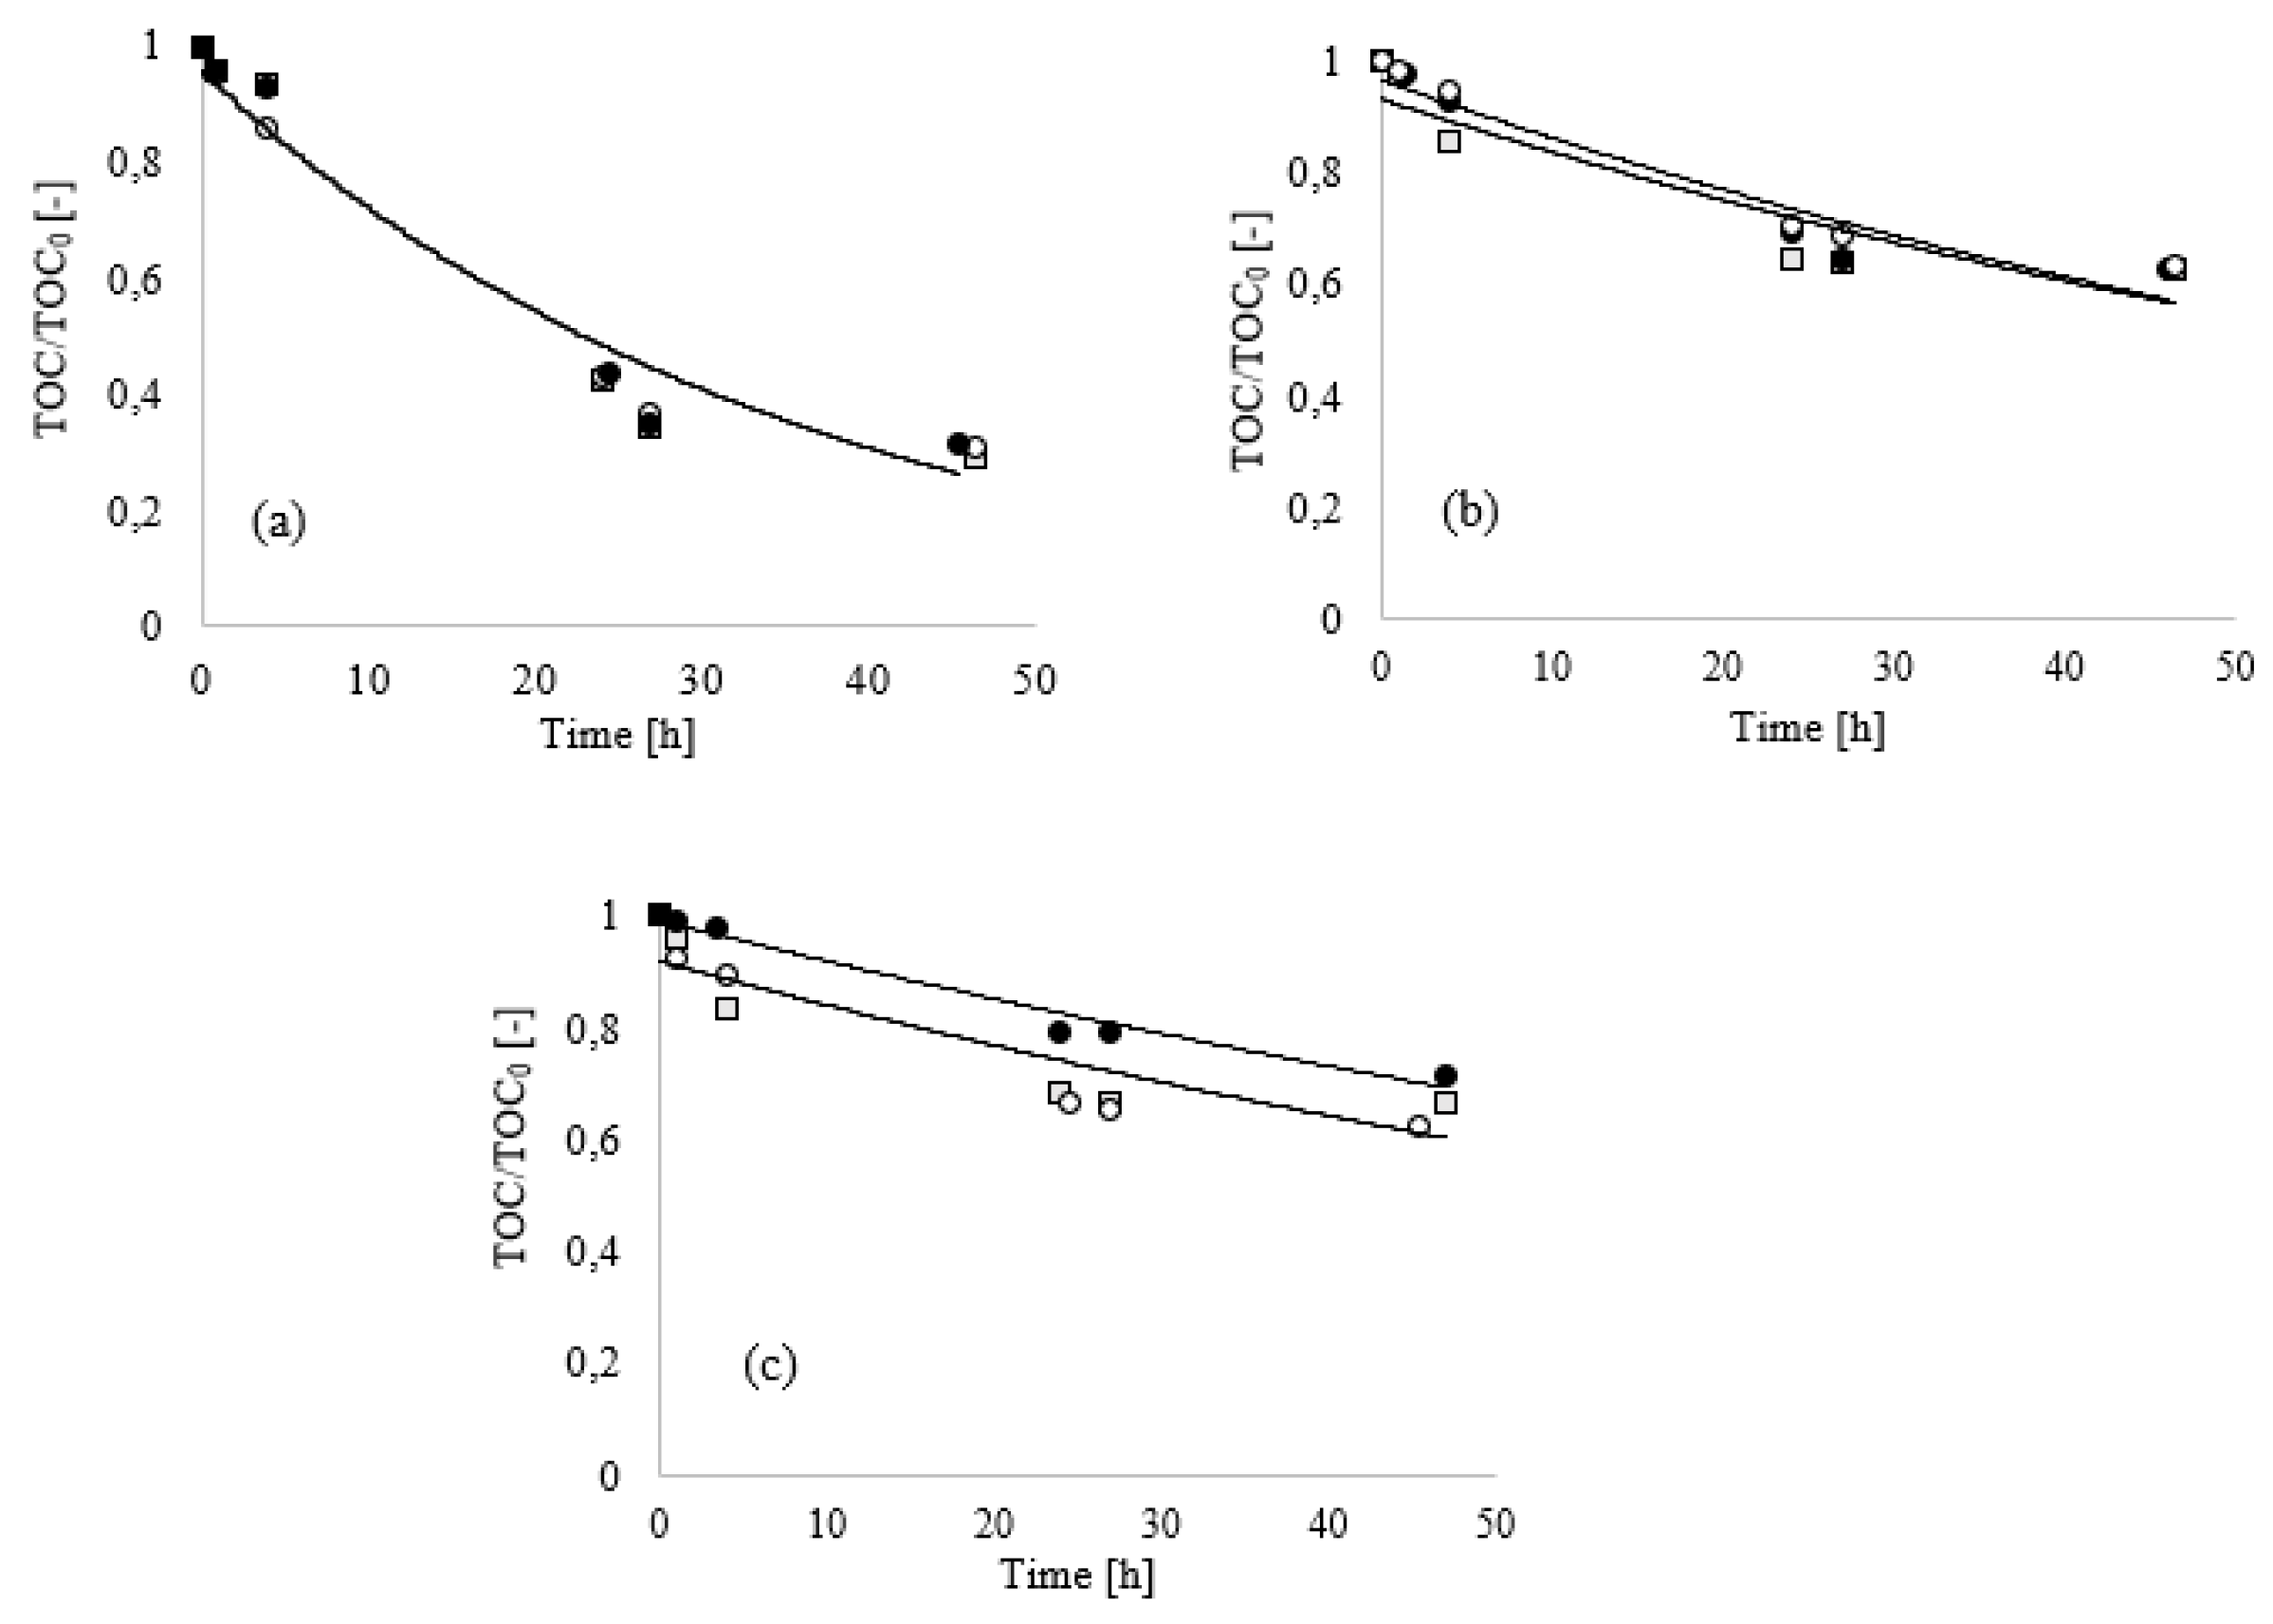
Figure 1, the results of the biodegradation tests of the mixtures A, B and C dosed at 0.20% are presented.
The results obtained after five days showed that the presence of a mixed consortium (soil bacterial inoculum) resulted in an enhancement of substrate biodegradation compared to
Bacillus Clausii (
Figure 1a), thus suggesting that the investigated conditioning mixtures exhibited a high response to biodegradation especially for B (BOD/COD = 0.92) and C (BOD/COD = 0.93).
For sample A, the low value of BOD/COD index (
Figure 1b) at the same dosage is due to the high TOC initial value of this foaming agent, compared to B and C. To support this observation, the results of organic mineralization in term of TOC are reported in
Figure 1c. Only a slight TOC removal was observed both when soil humus supernatant and
Bacillus Clausii were used as inoculum in BOD tests. This result is not in accordance with the measured BOD: when
Bacillus Clausii was used, the reached BOD value after five days (15.9 mg O
2/L) was lower than 86% compared to the BOD reached when the soil humus supernatant was employed. This result can be ascribed to the higher respiration activity of a mixed consortium such as soil humus supernatant with respect to a single bacterial strain [
31]. This last aspect is extremely important for a reproducible and representative test of the process: the use of a specific inoculum guarantees the collection of more reliable and reproducible data.
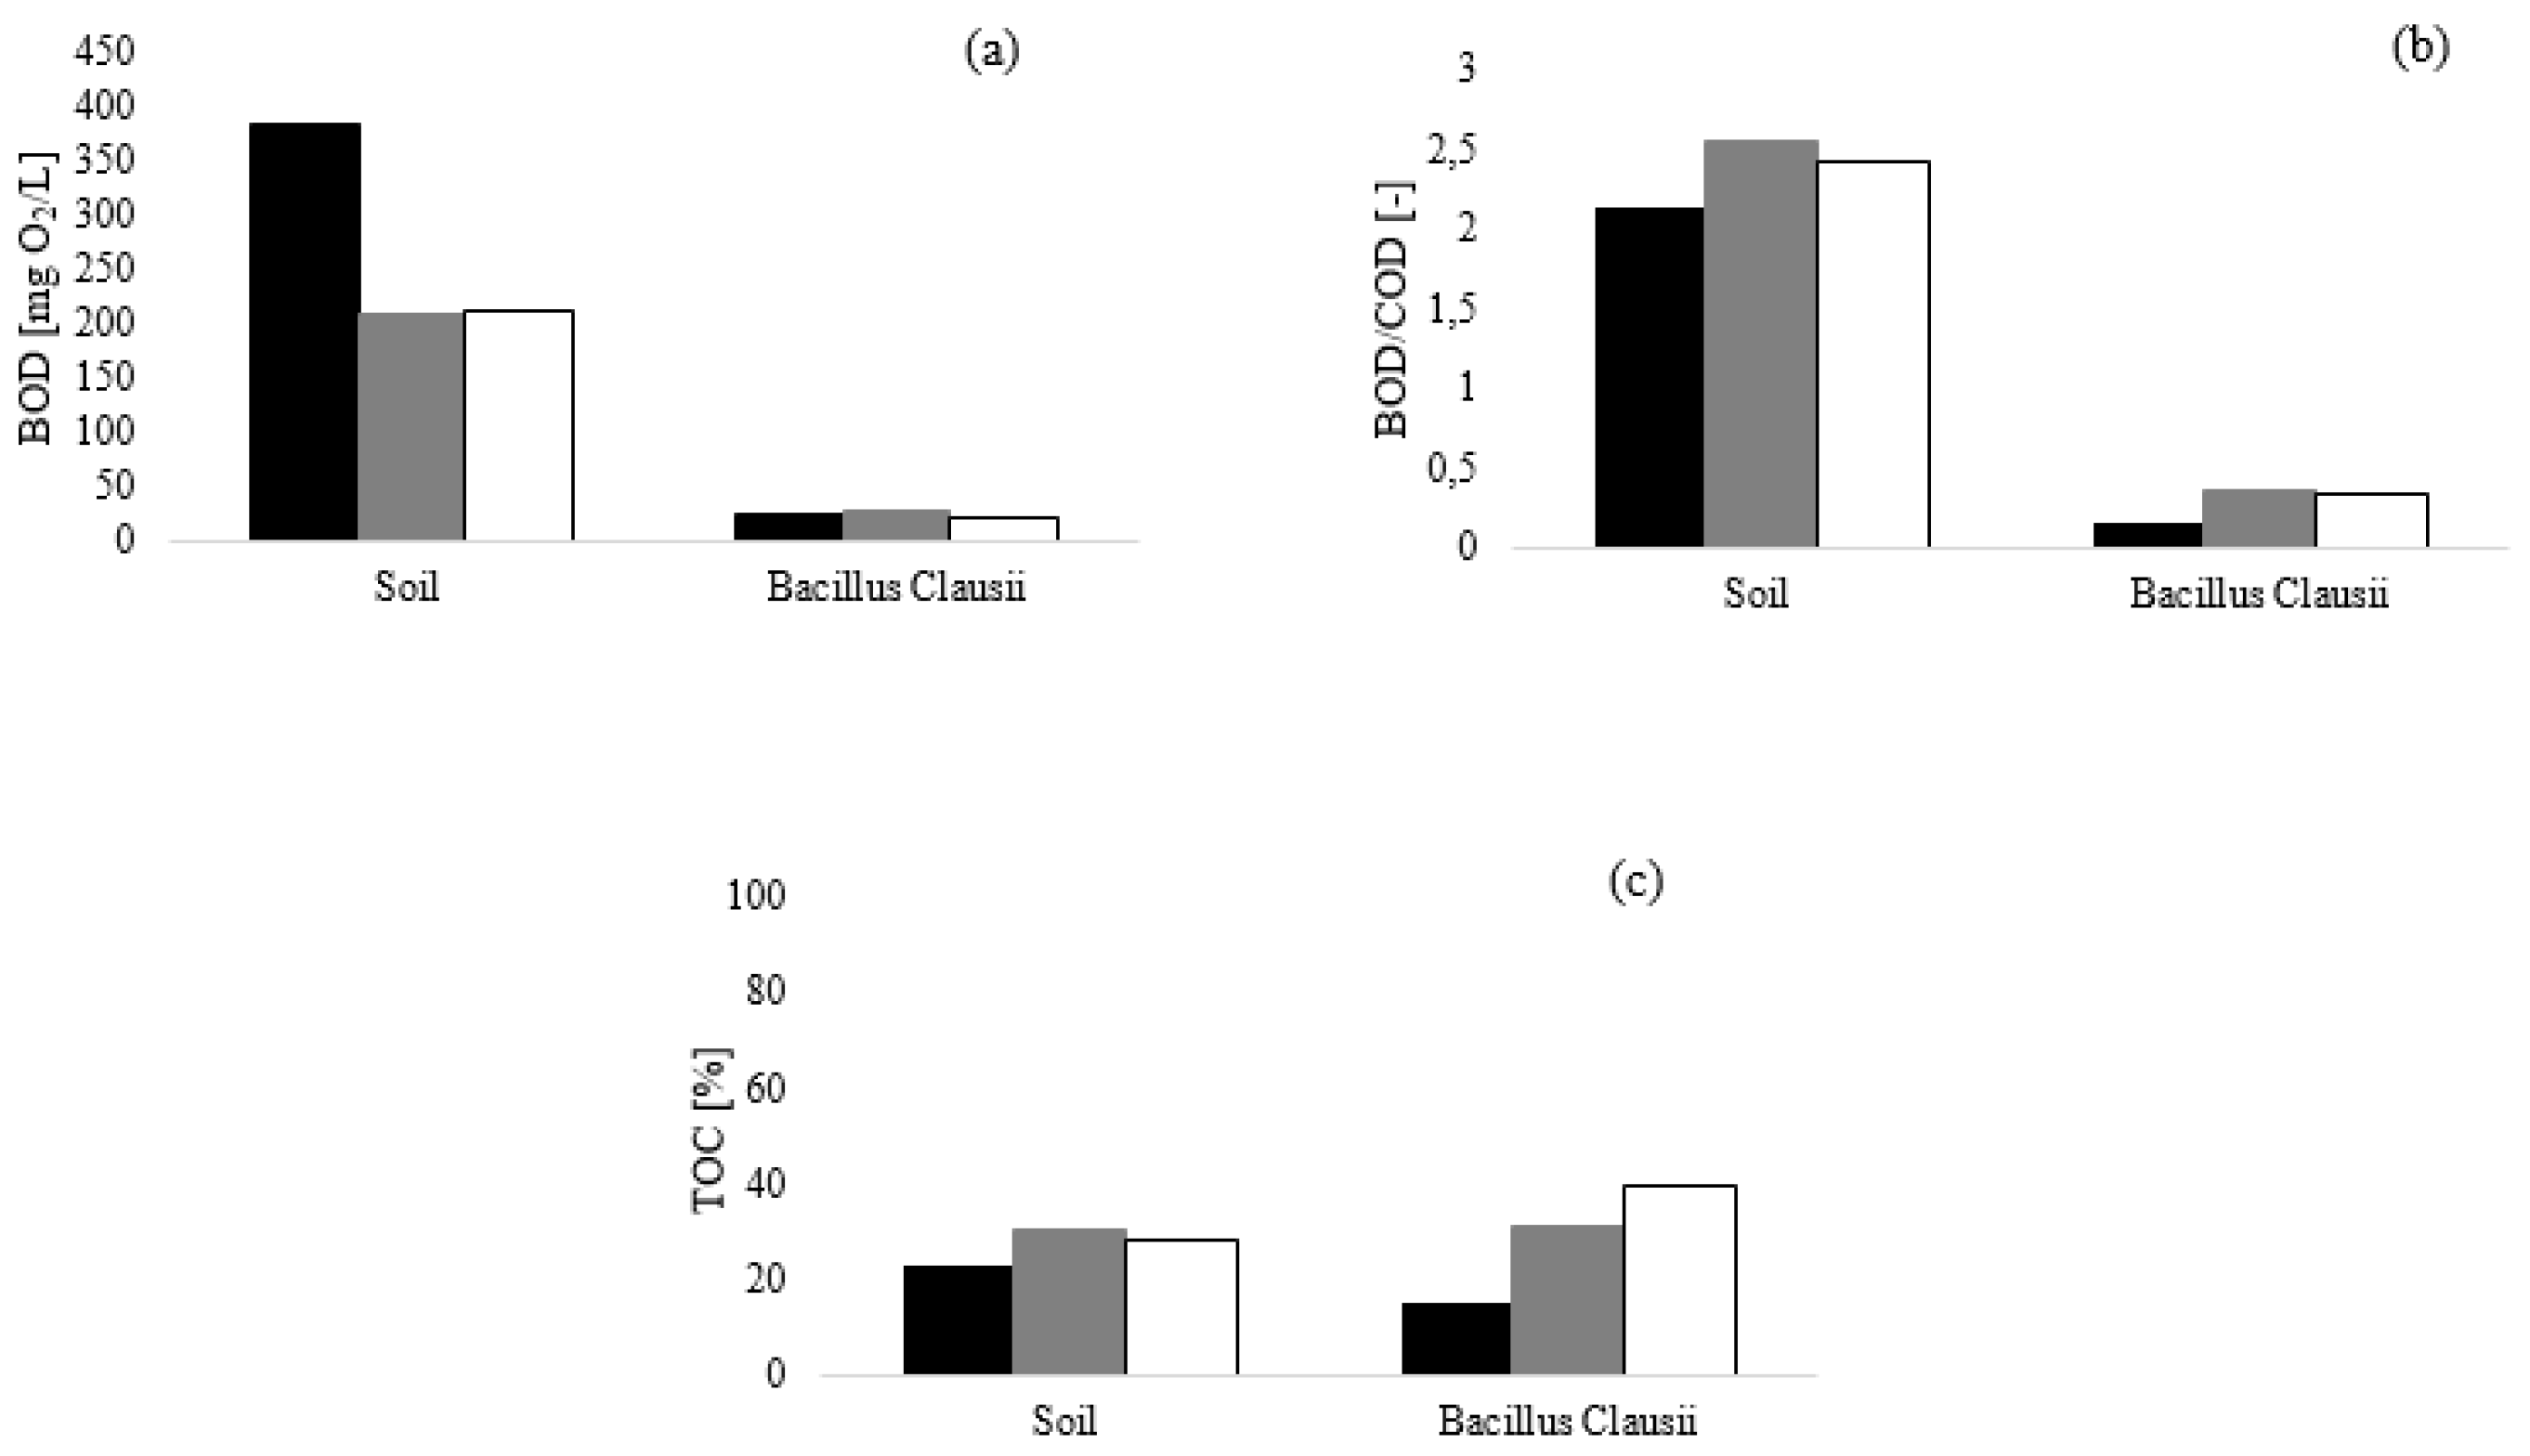
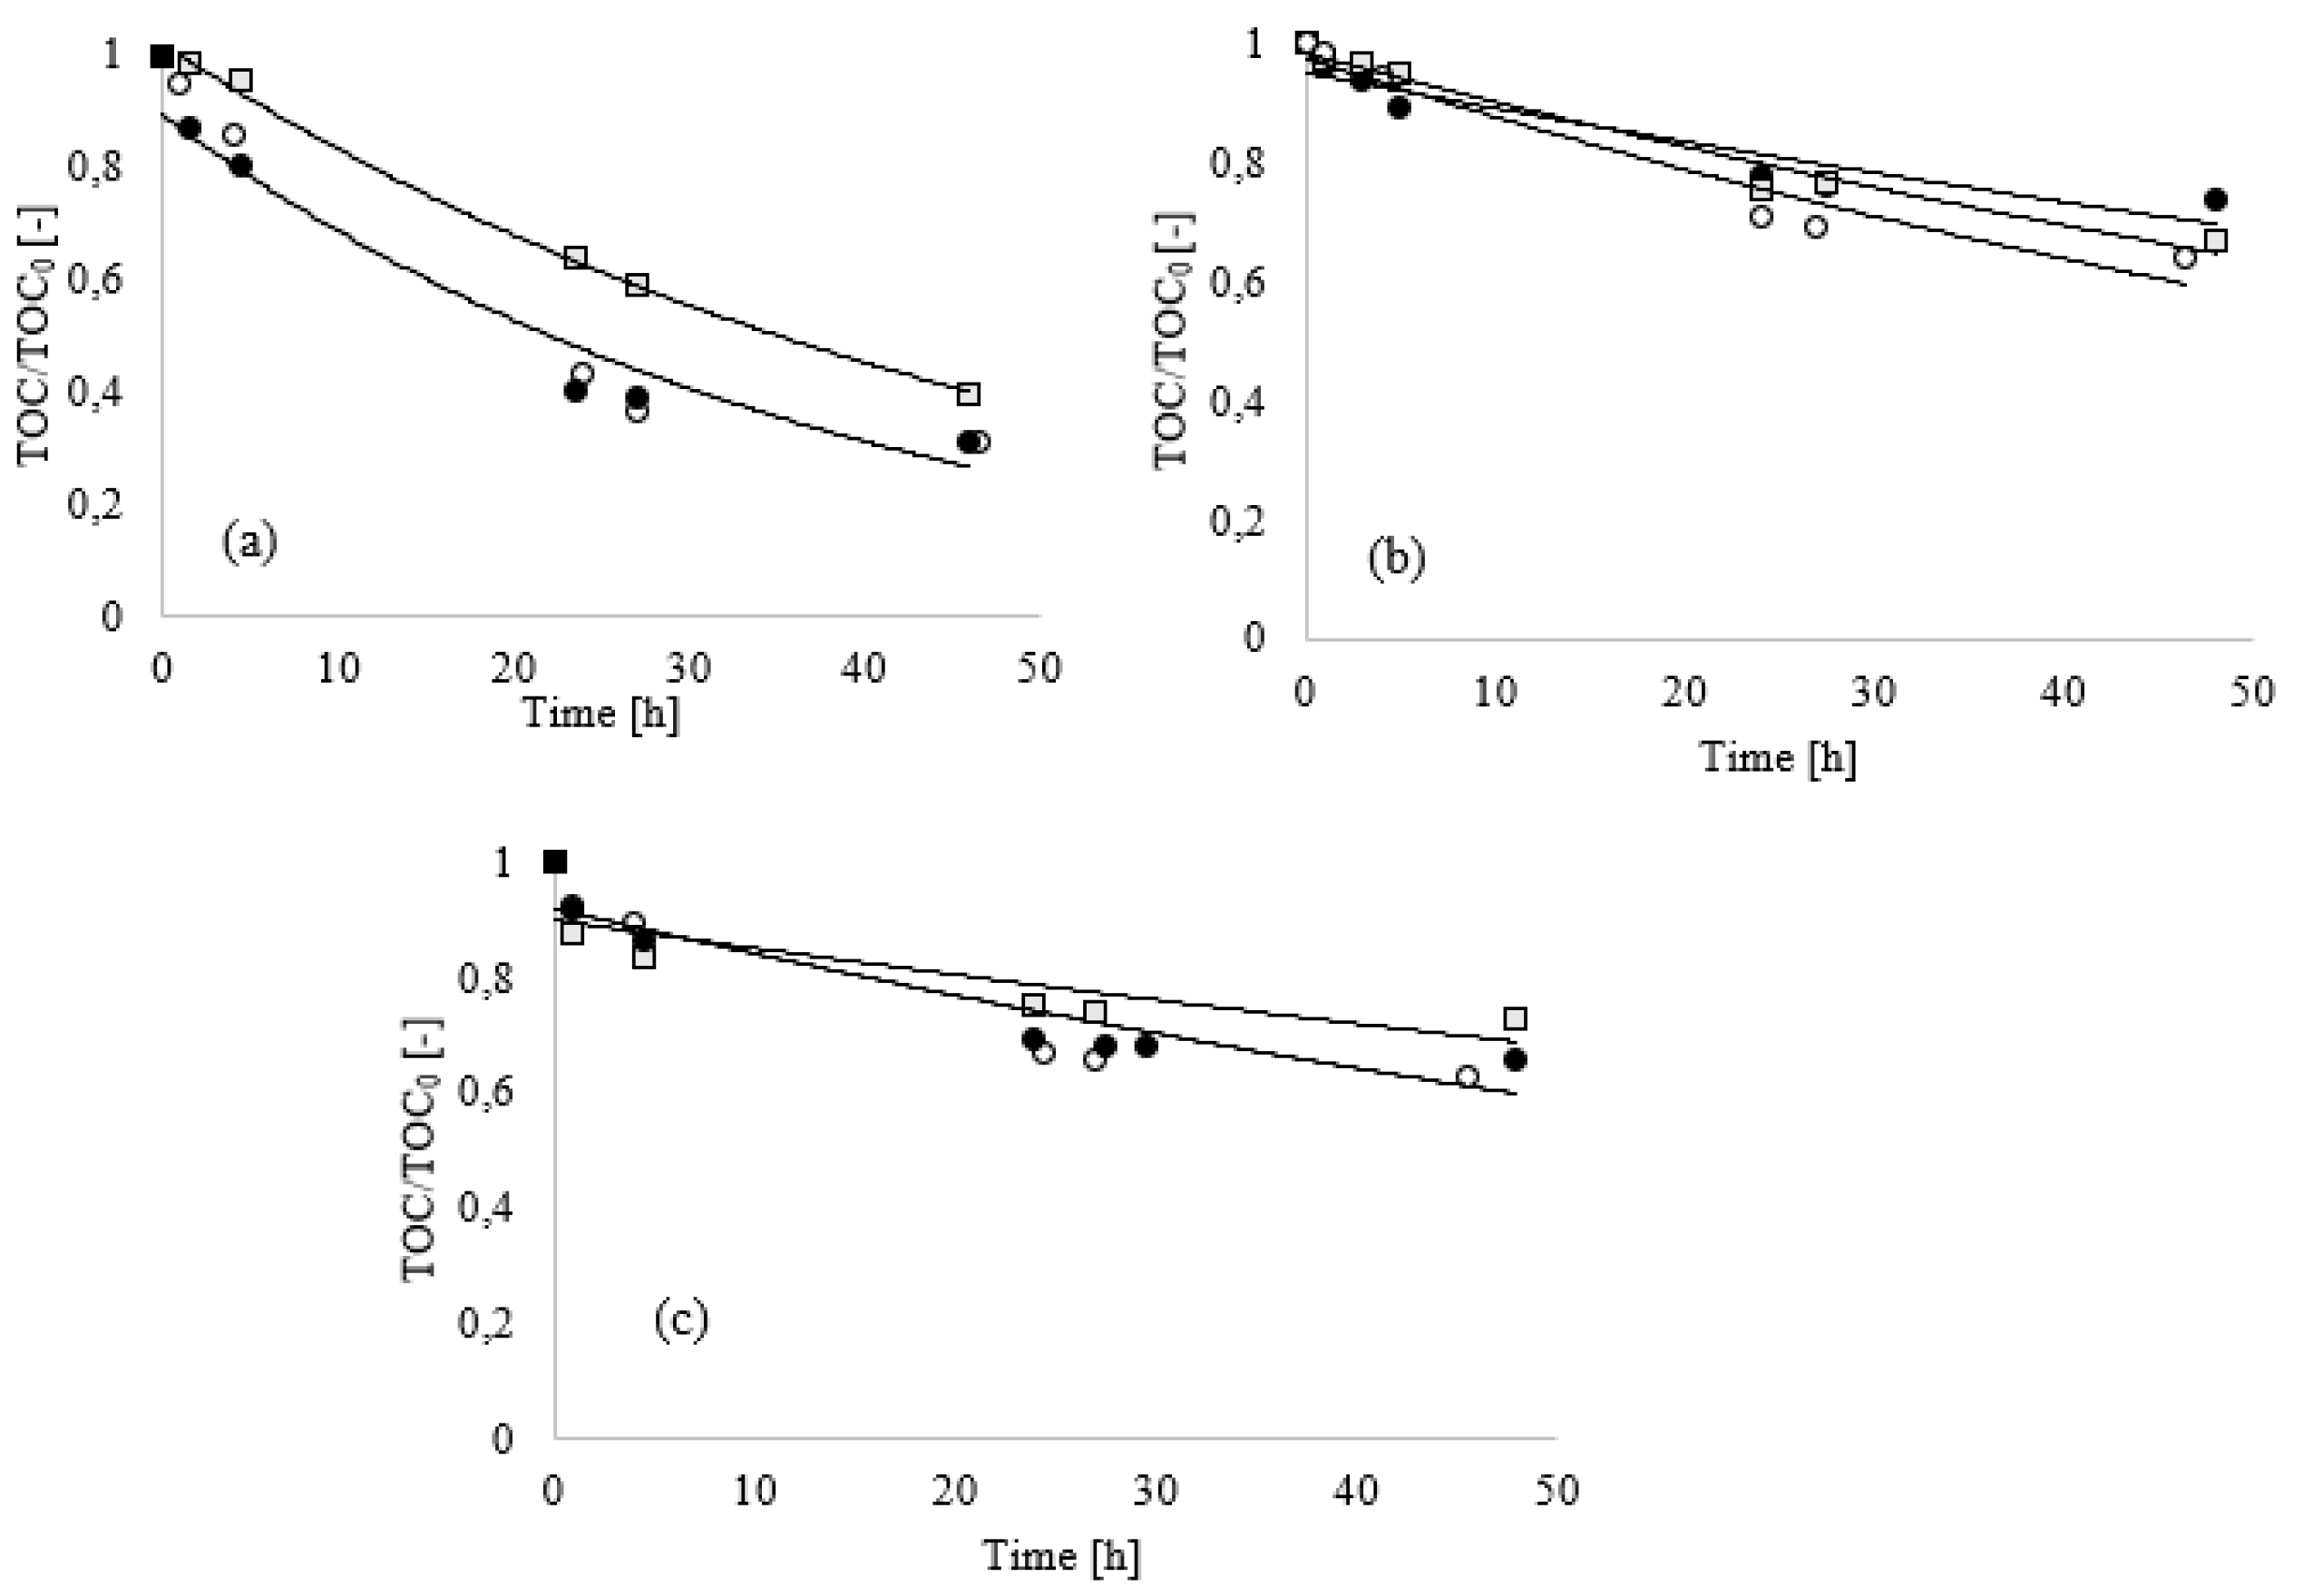
Figure 2 shows the results obtained at a dosage of 0.10%, where the inhibition due to the high concentration of conditioning agent did not occur.
Dilution of the conditioning mixtures resulted in an enhancement of biodegradation. As already observed, the BOD values (
Figure 2a) strongly depended on the used inoculum. The BOD values measured after five days were 383.5, 210.1 and 211.3 mgO
2/L, respectively, for the conditioning mixtures A, B and C, when soil humus was used as the inoculum, thus suggesting a higher biodegradation rate for the 0.10% mixtures with respect to the 0.20% mixtures. Conversely, when the
Bacillus Clausii was used as inoculum, a substantial increase in BOD values was not observed (23.54, 28.07 and 20.36 mgO
2/L for A, B and C, respectively). Such remarkable difference in BOD values between the two used inocula was due to the different respiration activity, as previously discussed.
Additionally, at 0.20% dosage, a notable enhancement of the biodegradation process was observed when mixed bacterial culture was used, as highlighted by the BOD/COD indexes reported in
Figure 2b. Comparing the results obtained with the two inocula, a strong difference in terms of biodegradation index between soil humus and
Bacillus Clausii was observed. In the tests performed with
Bacillus Clausii, lower biodegradation indexes were calculated with respect to those of soil humus. In the latter case, after only five days of test, BOD
5 exceeded the correspondent initial COD
0 value, thus suggesting the presence of other species not chemically oxidable but biodegradable, such as some Nitrogen Organic Compounds (NOCs).
This effect could be explained by the possible development of the nitrification process during the BOD closed bottle tests, due to the possible presence of nitrifying microorganism in a mixed consortium such as soil humus [
32]. This last consideration supports the conclusion that using a single species inoculum helps ensure reproducible data.
Meanwhile, as showed in
Figure 2c, no substantial differences in TOC removals were calculated and this highlights that the adopted bacterial strain inoculated in the BOD test had the same ability to remove the organic compounds of foaming agents.
The simplicity of the study and the possibility of obtaining results in a short time make this approach applicable during excavation activities, as a support to the evaluation of biodegradation processes of conditioned soils.
Until now, the use of a specific inoculum in closed bottle tests at five days did not allow obtaining exhaustive information about the biodegradation of the products or to make comparisons with other products. Clearly, according to OECD guidelines and regulations, the use of a specific inoculum such as Bacillus Clausii is not required. However, from a scientific and practical point of view, the development of a rapid and easy test that yields reproducible and reliable results might allow selection of the most proper (most biodegradable) foaming agent, once the geotechnical requirements have been established, without the necessity of performing BOD28 tests.
For this reason, biodegradation tests were developed maintaining the system under a continuous air supply and in the presence of Bacillus Clausii as a bacterial inoculum. These tests were termed accelerated because they required less time to develop than the 5, 10 and 28 days required by the closed bottle technique. The ABT tests were performed by considering an additional dosage (0.13%) helpful for the kinetic study.
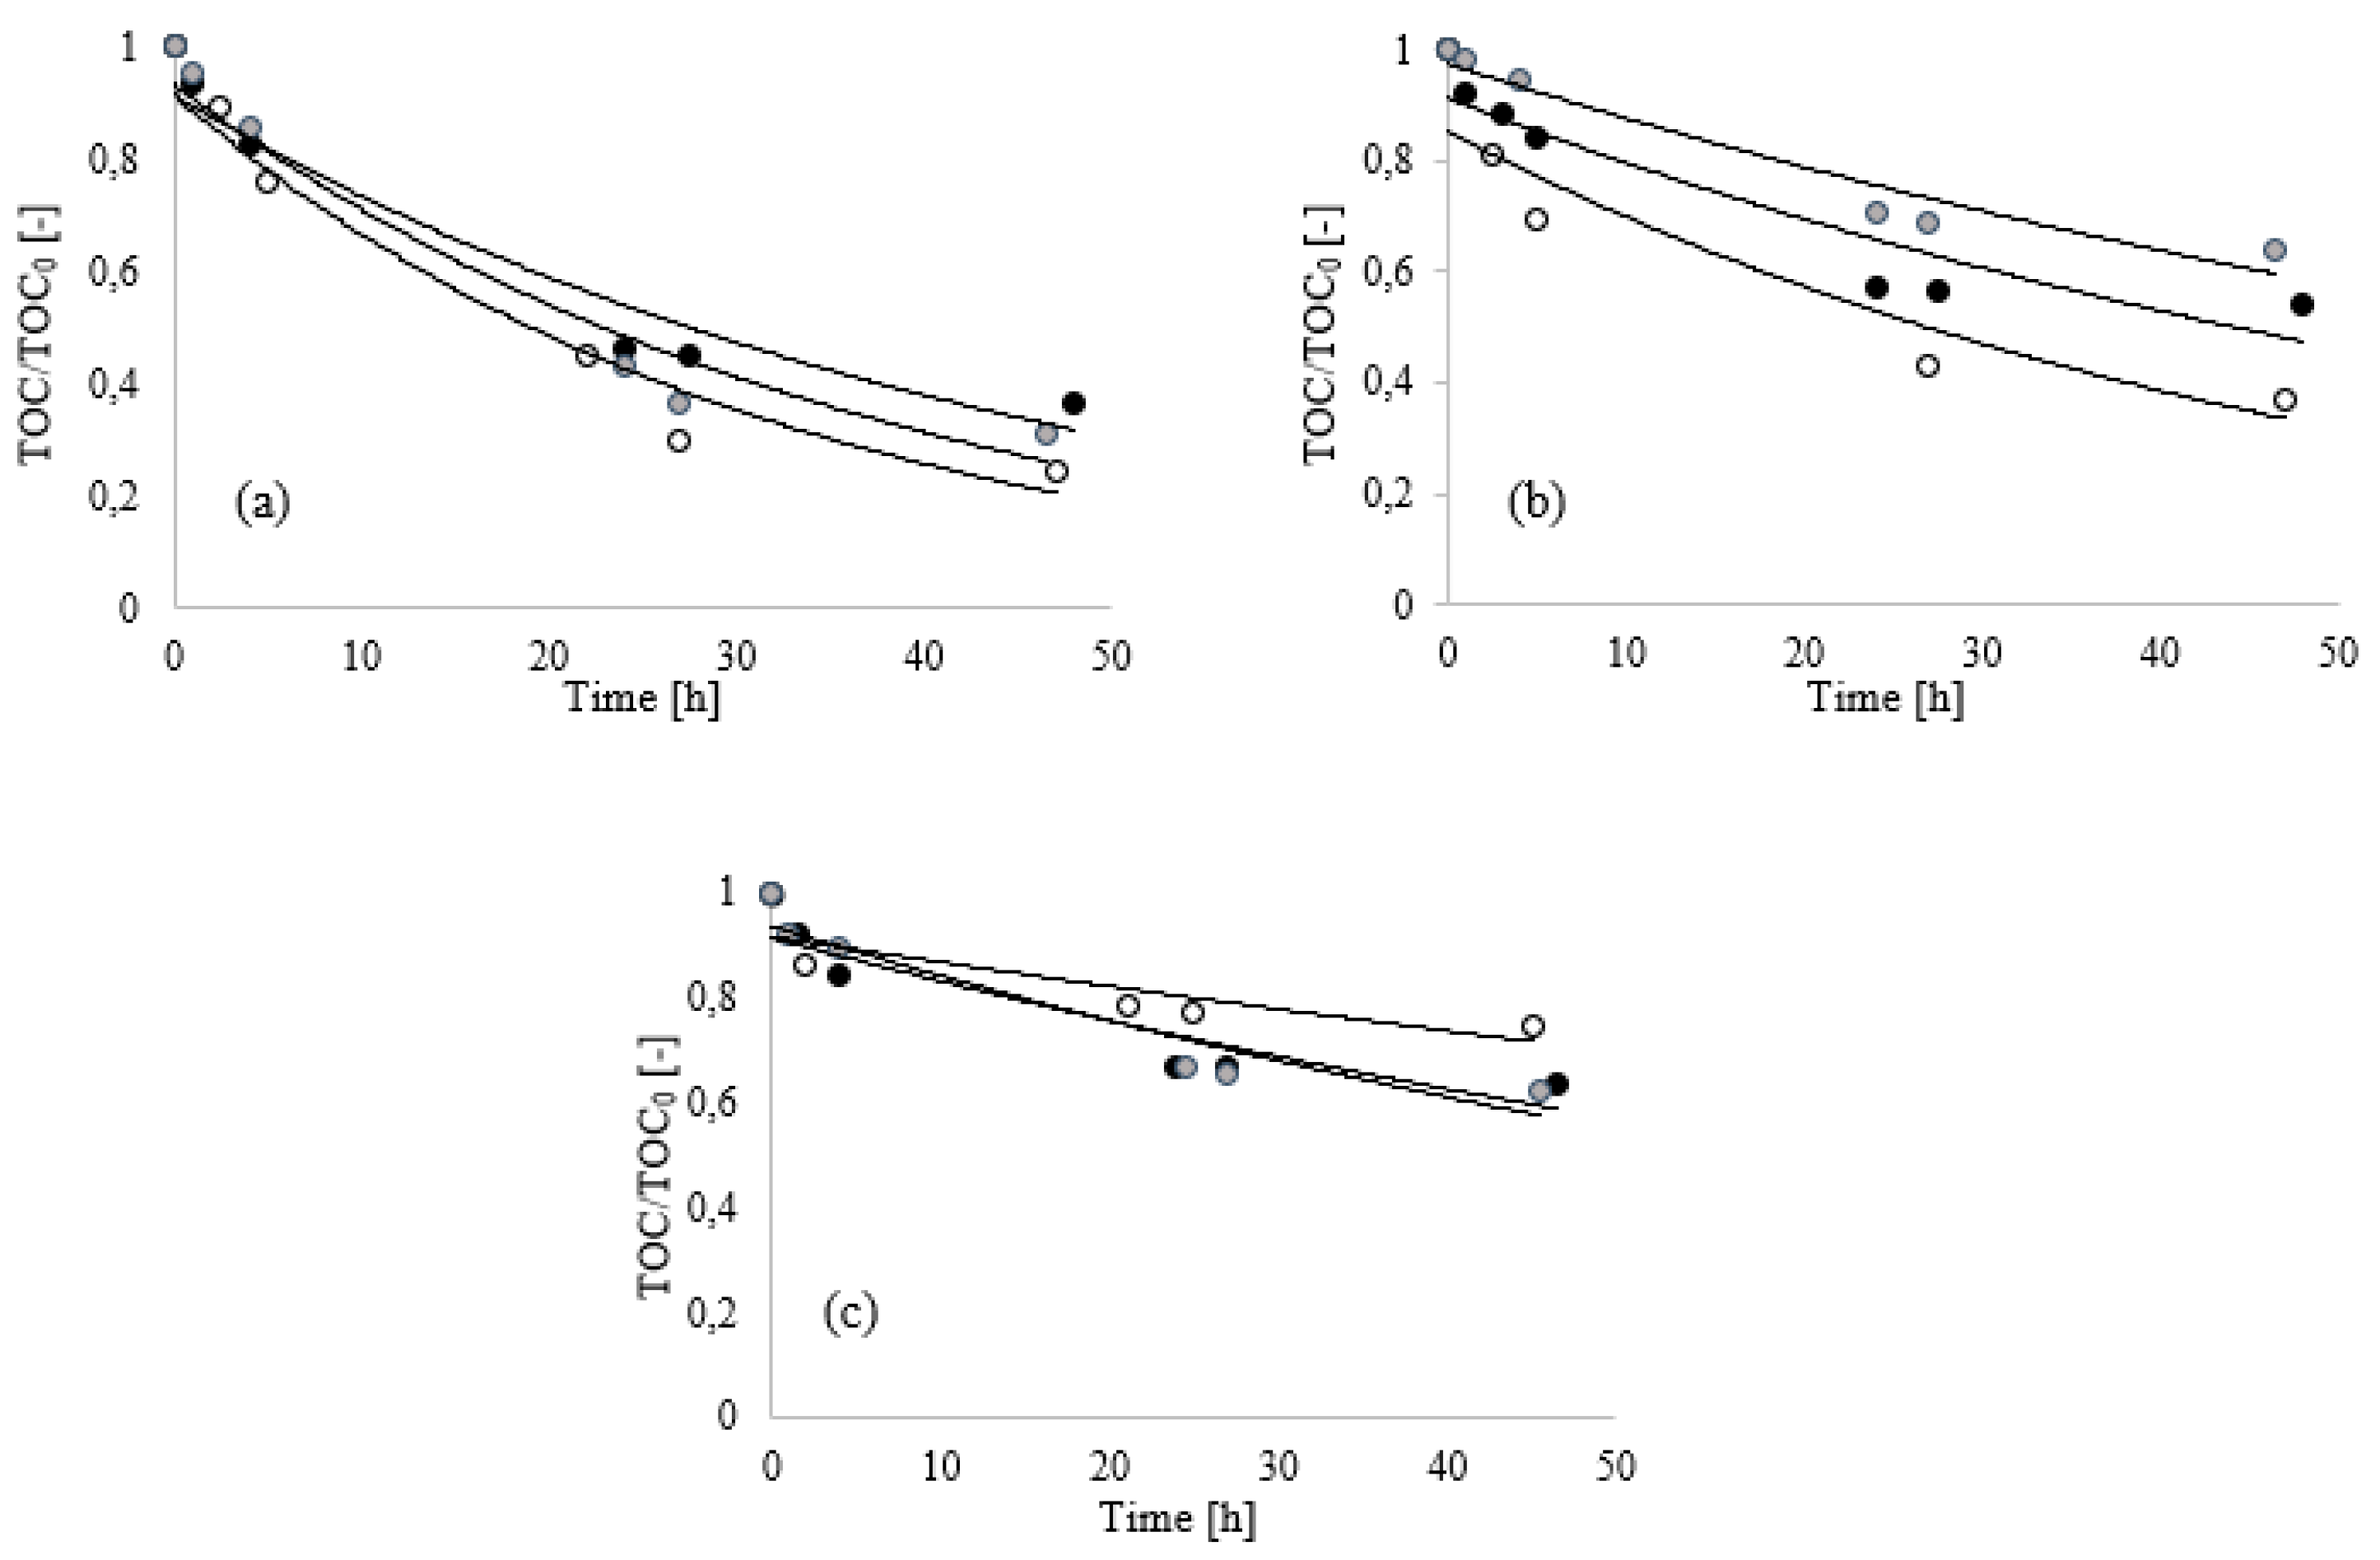
In
Figure 3, the results of ABT of the three foaming agents (A, B and C) at three dosages (0.20, 0.13 and 0.10%) at 30 °C and neutral pH condition (pH = 6) are reported.
In
Figure 3, it is possible to observe that the concentration had a significant effect in the first hours for mixture B (
Figure 3b). In fact, the removal rate increased with increasing organic carbon content, with a removal of about 60% after 47 h of treatment when B was used at the higher dosage (0.20%). With the decrease in the initial TOC (0.13 and 0.10%), the process showed slowing down as a consequence of the low availability of organic compounds to be consumed during the biological process.
A similar trend was observed when mixture A (
Figure 3a) was used at different concentrations, confirming that in the adopted range, the use of such mixtures did not compromise the development of a bioremediation process and did not affect the removal. Tests conducted on mixtures A and B have not indicated an inhibition for a high substrate concentration; conversely, such interference was clearly evident in the case of the third foaming agent (C), where the concentration of the additives was decidedly higher than A and B (
Table 1).
In
Figure 3c, the inhibition due to the high organic carbon content was highlighted when the concentration was 0.2% with a slowing of the TOC removal process. From the fitting of the experimental data using the models previously described, it was defined that a first order kinetic model, and specifically, the Blackman model, better described the experimental data, showing the lowest objective function values (
Table 2). In
Table 2 are reported all the objective functions (Equation (6)), confirming that the lower values calculated with the Blackman model compared to the Monod and Tessier models, define Blackman as a better representation of the experimental data.
Based on the objective functions calculated, Blackman can be considered a suitable model that adequately describes the results of TOC trend in all the investigated concentrations. By considering the Blackman model process (Equation (3)), the mass balance can be defined from integration of Equation (7) with boundary conditions of the initial time and a generic time (t):
The first values of μ
M and K
s for the iterative cycles have been set on the basis of data available in the literature [
33,
34,
35].
Table 3 shows the values of the kinetic constants and the estimated reaction time to achieve a 20 or a 50% removal of the initial TOC of the mixtures.
Results show that the tested mixtures showed a different behavior. Mixture A, at any dosage tested in this work, showed a fast organics removal with respect to the other mixtures. In particular, though the removal followed the same initial trend at any tested concentration, at the higher dosage (0.20%), a shorter time was required (about 17.33 h) to achieve a 50% reduction of the initial amount of organics. This behavior could be attributed to the typical first kinetic order reaction that is promoted by the high value of c0 (Equation (8)).
The trend of TOC removal in tests with mixture C was quite different: although a positive effect of the increasing TOC initial value was detected up to 0.13% dosage, a further increase caused a remarkable slowing down of the biodegradation process.
When considering the safety data sheets of mixture C, it resulted, in fact, composed of volatile compounds (mono-C10-16-alkyl esters) which are quickly removed (stripping) from the solution through the action of bubbling air into the system. To confirm this evidence, analogous tests without the addition of the inoculum were performed with a foam dosage of 0.20%. In such condition, a TOC decrease was observed, as a consequence of the stripping of volatile substances from the mixture. In particular, after only 1 h of aeration, a TOC removal of 10% was observed for the C mixture, while a negligible TOC removal (~2%) was measured for the other mixtures, suggesting the limited concentration of volatile compounds on both formulations. After 1 h, a stabilization of the foam was observed and no variation in TOC trends was measured.
For this reason, a different trend in TOC removal was observed (
Figure 3c) before the first 20 h treatment and, after this time, a plateau was reached for all the concentrations investigated. The presence of volatile compounds justifies the addition in C formulation of stabilizers with high viscosity and low volatility (hexylene glycol) necessary to maintain such volatile compounds in the liquid phase. Due to the presence of these compounds, biological treatment is less effective for C, especially when the solution is more concentrated (0.20%) [
36].
When mixture B was used at the lower dosages (0.10 and 0.13%) and for all the solutions prepared with mixture C, a TOC removal of 50% was not achieved during the 50 h tests, as a consequence of the limitations previously discussed about the presence of the additives (
Figure 3).
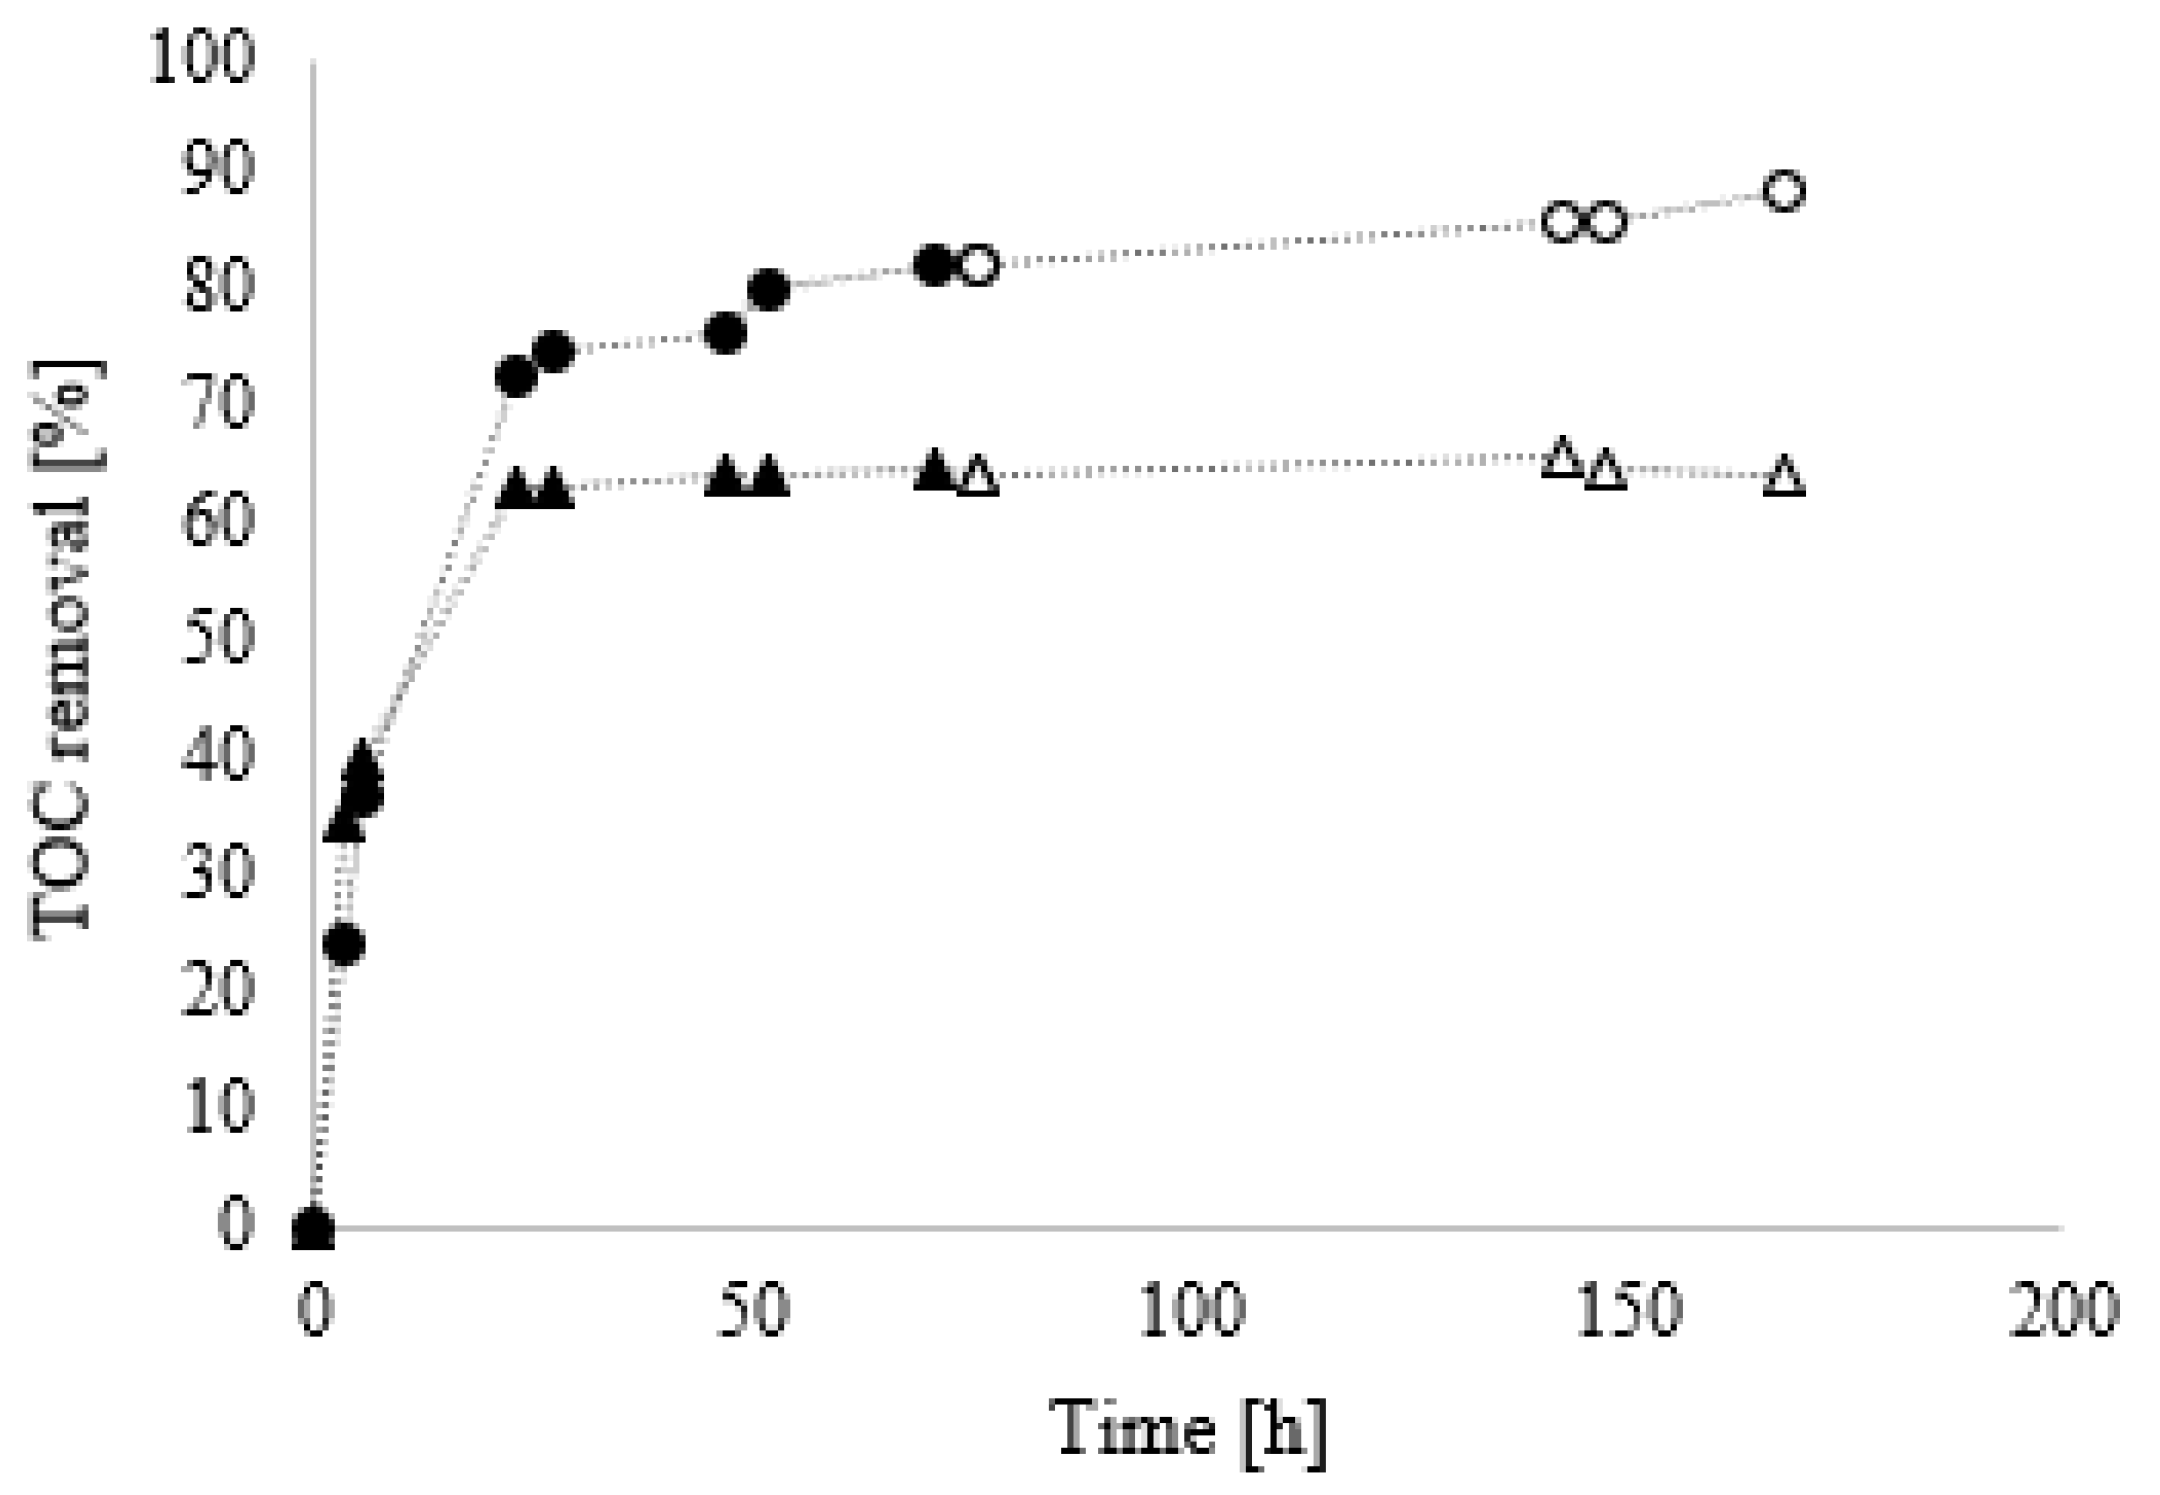
To evaluate any possible interference of the biodegradation process due to the presence of additives, further investigations, similar to those previously discussed, were performed on solutions with different concentrations of the mixtures A and B at the same initial TOC value, corresponding to the TOC measured for mixture A at 0.20% dosage (
Figure 4).
From
Figure 4, it is possible to observe the effect of the additives present in B, as reported in
Table 1. Mixture A showed a greater predisposition to biodegradation compared to B: in particular, after 72 h of treatment, the TOC removal efficiency values were 80 and 64% for A and B, respectively (first cycle). No further removal over time was observed after that point. To verify if this arrest on biodegradation could be correlated to the low availability of an active inoculum, after 72 h of treatment, 2.0 mL of fresh
Bacillus Clausii were added to both solutions and the TOC was monitored. In this second cycle, an additional TOC removal was observed for mixture A (up to 90%), while the persistence of the plateau for mixture B was observed. This result confirmed that B was in range of optimal concentrations for its biodegradation. When this dosage reaches levels where the presence of additives affects the biodegradation process (0.37%), the inhibition effect starts to occur.
With this type of test, in less than five days, it was possible to make considerations in line with what reported in our previous work using the same conditioning mixture [
23], but they were not appreciable with closed bottle tests performed in five days.
Since the temperature and the pH of the solutions can influence the biodegradation process, additional tests were conducted considering two temperature values equal to 20 and 40 °C (
Figure 5) and pH equal to 4 and 8 (
Figure 6).
According to the results displayed in
Figure 5 and the values of the kinetic parameters reported in
Table 4, it is possible to observe that, in the investigated range, temperature did not significantly influence the biodegradation process of mixtures A and B, whilst a remarkable influence was observed for mixture C.
The temperature was not effective for the biodegradation of mixture A, and the TOC removal of 50% was reached in similar times. When mixture C was tested, a remarkable difference in the estimated time required for a 20% removal of TOC was observed, and, to achieve a removal of the 50%, a substantial difference in the estimated time values was determined for both the conditioning mixtures B and C. This result suggests that the high temperature (40 °C) combined with the high additives dosages (
Table 1) could cause a loss of microorganism viability [
34].
Similar considerations were also conducted by evaluating the effect of pH. Variations of this parameter were more significant than those observed for temperature.
By the analysis of the TOC removal trends reported in
Figure 6, a reduction in biodegradation rate under acidic pH condition (pH = 4) was observed in the treatment of mixture A (
Figure 6a), while a slight significative effect was detected in the treatment of mixtures B and C (
Figure 6b,c). This limiting effect of the acid pH is not remarkable in tests conducted with mixtures B and C, as there is already slower biodegradation shown at high pH (pH = 8) compared to that obtained in the test with mixture A due to the presence of additives, an aspect previously discussed. Overall, the results confirmed that the performance of the bacterial inoculum adopted were optimized at pH = 6.

 ,
, 


