1. Introduction
Waves play an important role in coastal zone morphodynamic; in particular, they influence on erosive and accumulative processes of the sand deposits. Recent investigations demonstrated the main role of wave transformation processes—for example, wave propagation in the form of bore and low-frequency motions correlated with the transformation of irregular waves with a group structure that can affect sediment transport in the nearshore and swash zones [
1,
2,
3,
4].
It was shown that, due to non-linear wave transformation, the sediments can move in the cross-shore direction and affect the underwater bottom profile shape. This is due to the asymmetry of near-bed orbital velocities, which is connected with wave asymmetry (for example, [
5,
6,
7]). However, the relation between cross-shore sediment transport and the wave nonlinearity is not fully understood up to now because the interaction processes between waves, sandy particles and the seabed are complex. However, there are many commonly used formulae to predict sediment transport resulting from near-bed orbital velocity asymmetry under non-linear Stokes-type waves [
8,
9,
10,
11,
12,
13,
14]. There are also many models based on the parametrizations of wave asymmetry changes. The most successful parameterization is based on the Ursell number and parameter analogues, a biphase (phase shift between the first and second non-linear harmonics of waves) suggested in [
15]. However, the verification of this parametrization on various experimental data does not always give a good match [
16,
17]. The main reason for this may be the non-linear wave transformation due to near-resonance interactions.
Most parts of the coastal zone can be attributed to the so-called intermediate water depth, the approximate boundaries of which are 0.05 < h/L < 0.5, where h is the depth and L is the wavelength. While propagating at these depths, waves transform under the influence of weakly non-linear dispersive processes associated with the growth of multiple non-linear harmonics due to near-resonant triad interactions (for example, [
18,
19])
where
is determined by the dispersion relation (
k is the wave number and
ω is the angular frequency),
δ is the detuning or deviation from the full resonance conditions caused by the dispersion effects.
Near-resonance interactions in waves at an intermediate depth generate a periodic energy exchange between the main (first) and second non-linear harmonics. This process is accompanied by the periodic oscillations of their amplitudes as the waves propagate to a shore. It has been theoretically shown that the characteristic spatial length of these oscillations is proportional to the 2
π/δ, i.e., with decreasing water depth at
δ→0, such oscillations will not be observed [
19,
20].
The existence of a periodic energy exchange between harmonics in irregular waves was confirmed by field experimental studies of the irregular wave transformation in the coastal zone [
21,
22]. According to these experimental data, the characteristic scenarios of wave transformation with a periodic energy exchange between the first and second non-linear harmonics were identified and the conditions for their implementation, depending on the average slope of the sea bottom and the steepness of waves at the entrance to the coastal zone, were determined. They revealed typical scenarios of non-linear wave transformation differ in the number of observed spatial periods of exchange between the first and second non-linear harmonics and in the position of the absolute maximum of the second non-linear harmonic, which can be reached in the inner part of the coastal zone or only near the coastline. As a consequence of the periodic energy exchange between non-linear harmonics, the amplitude–frequency composition of individual irregular waves is subject to changes as well, as the waves approach the shore. Any shift in the ratio of the amplitudes of the first and second harmonics leads to fluctuations in the higher statistical wave moments, wave symmetry and the symmetry of orbital near-bottom velocities, which directly affects the processes of cross-shore sediment transport [
23]. As shown in [
24], periodical fluctuations in the biphase are the main reason for the impossibility of the unambiguous parameterization of changes in wave symmetry in the coastal zone.
The hypothesis about spatially periodic energy exchange between the first and second non-linear harmonics being one of the mechanisms of formation of underwater sand bars was already stated in [
25]. This was later confirmed by comparing real and modeled (monochromatic waves with the parameters of a typical storm were used) underwater bottom profiles for the Georgian Bay of Lake Ontario. Similar results were obtained for two selected underwater profiles for the Lake Huron coast and on the Atlantic coast of Canada [
26]. However, this hypothesis has not been carefully tested with field data, which include simultaneous measurements of wave parameters and the evolution of the underwater profile. It also remains unclear what happens with the coast profile if it already has underwater bars. For example, will the spatial periodic energy exchange between harmonics contributing to the formation of new morphological forms, will it support the existing ones, or will it be a force that moves the existing bars?
On the other hand, it is considered as a well-known fact, confirmed in many laboratory experiments, that “strong” storms erode the shores and underwater profile, while “small” or “weak” storms, on the contrary, restore them (for example, [
27]). However, the exact mechanism of the underwater profile restoration in relation to the changes in wave regimes and scenarios of wave transformation is unknown.
The main goals of this work are to investigate: (1) how the change in the amplitudes of harmonics and the phase shift between them affects the wave transport of sediment, (2) whether there are characteristic features, and (3) what happens when the scenario of nonlinear wave transformation changes.
Despite the success of numerical modeling in engineering practice, semi-empirical formulas are still used and, as was noted in [
5], the verification of the applicability of various engineering formulations to describe the physical processes remains very important. Therefore, at the same time, we will verify one of the main widely used Bailard’s formulations [
8] for the ability to adequately reproduce the effect of a non-linear wave transformation scenario on cross-shore sedimentation processes.
2. Materials and Methods
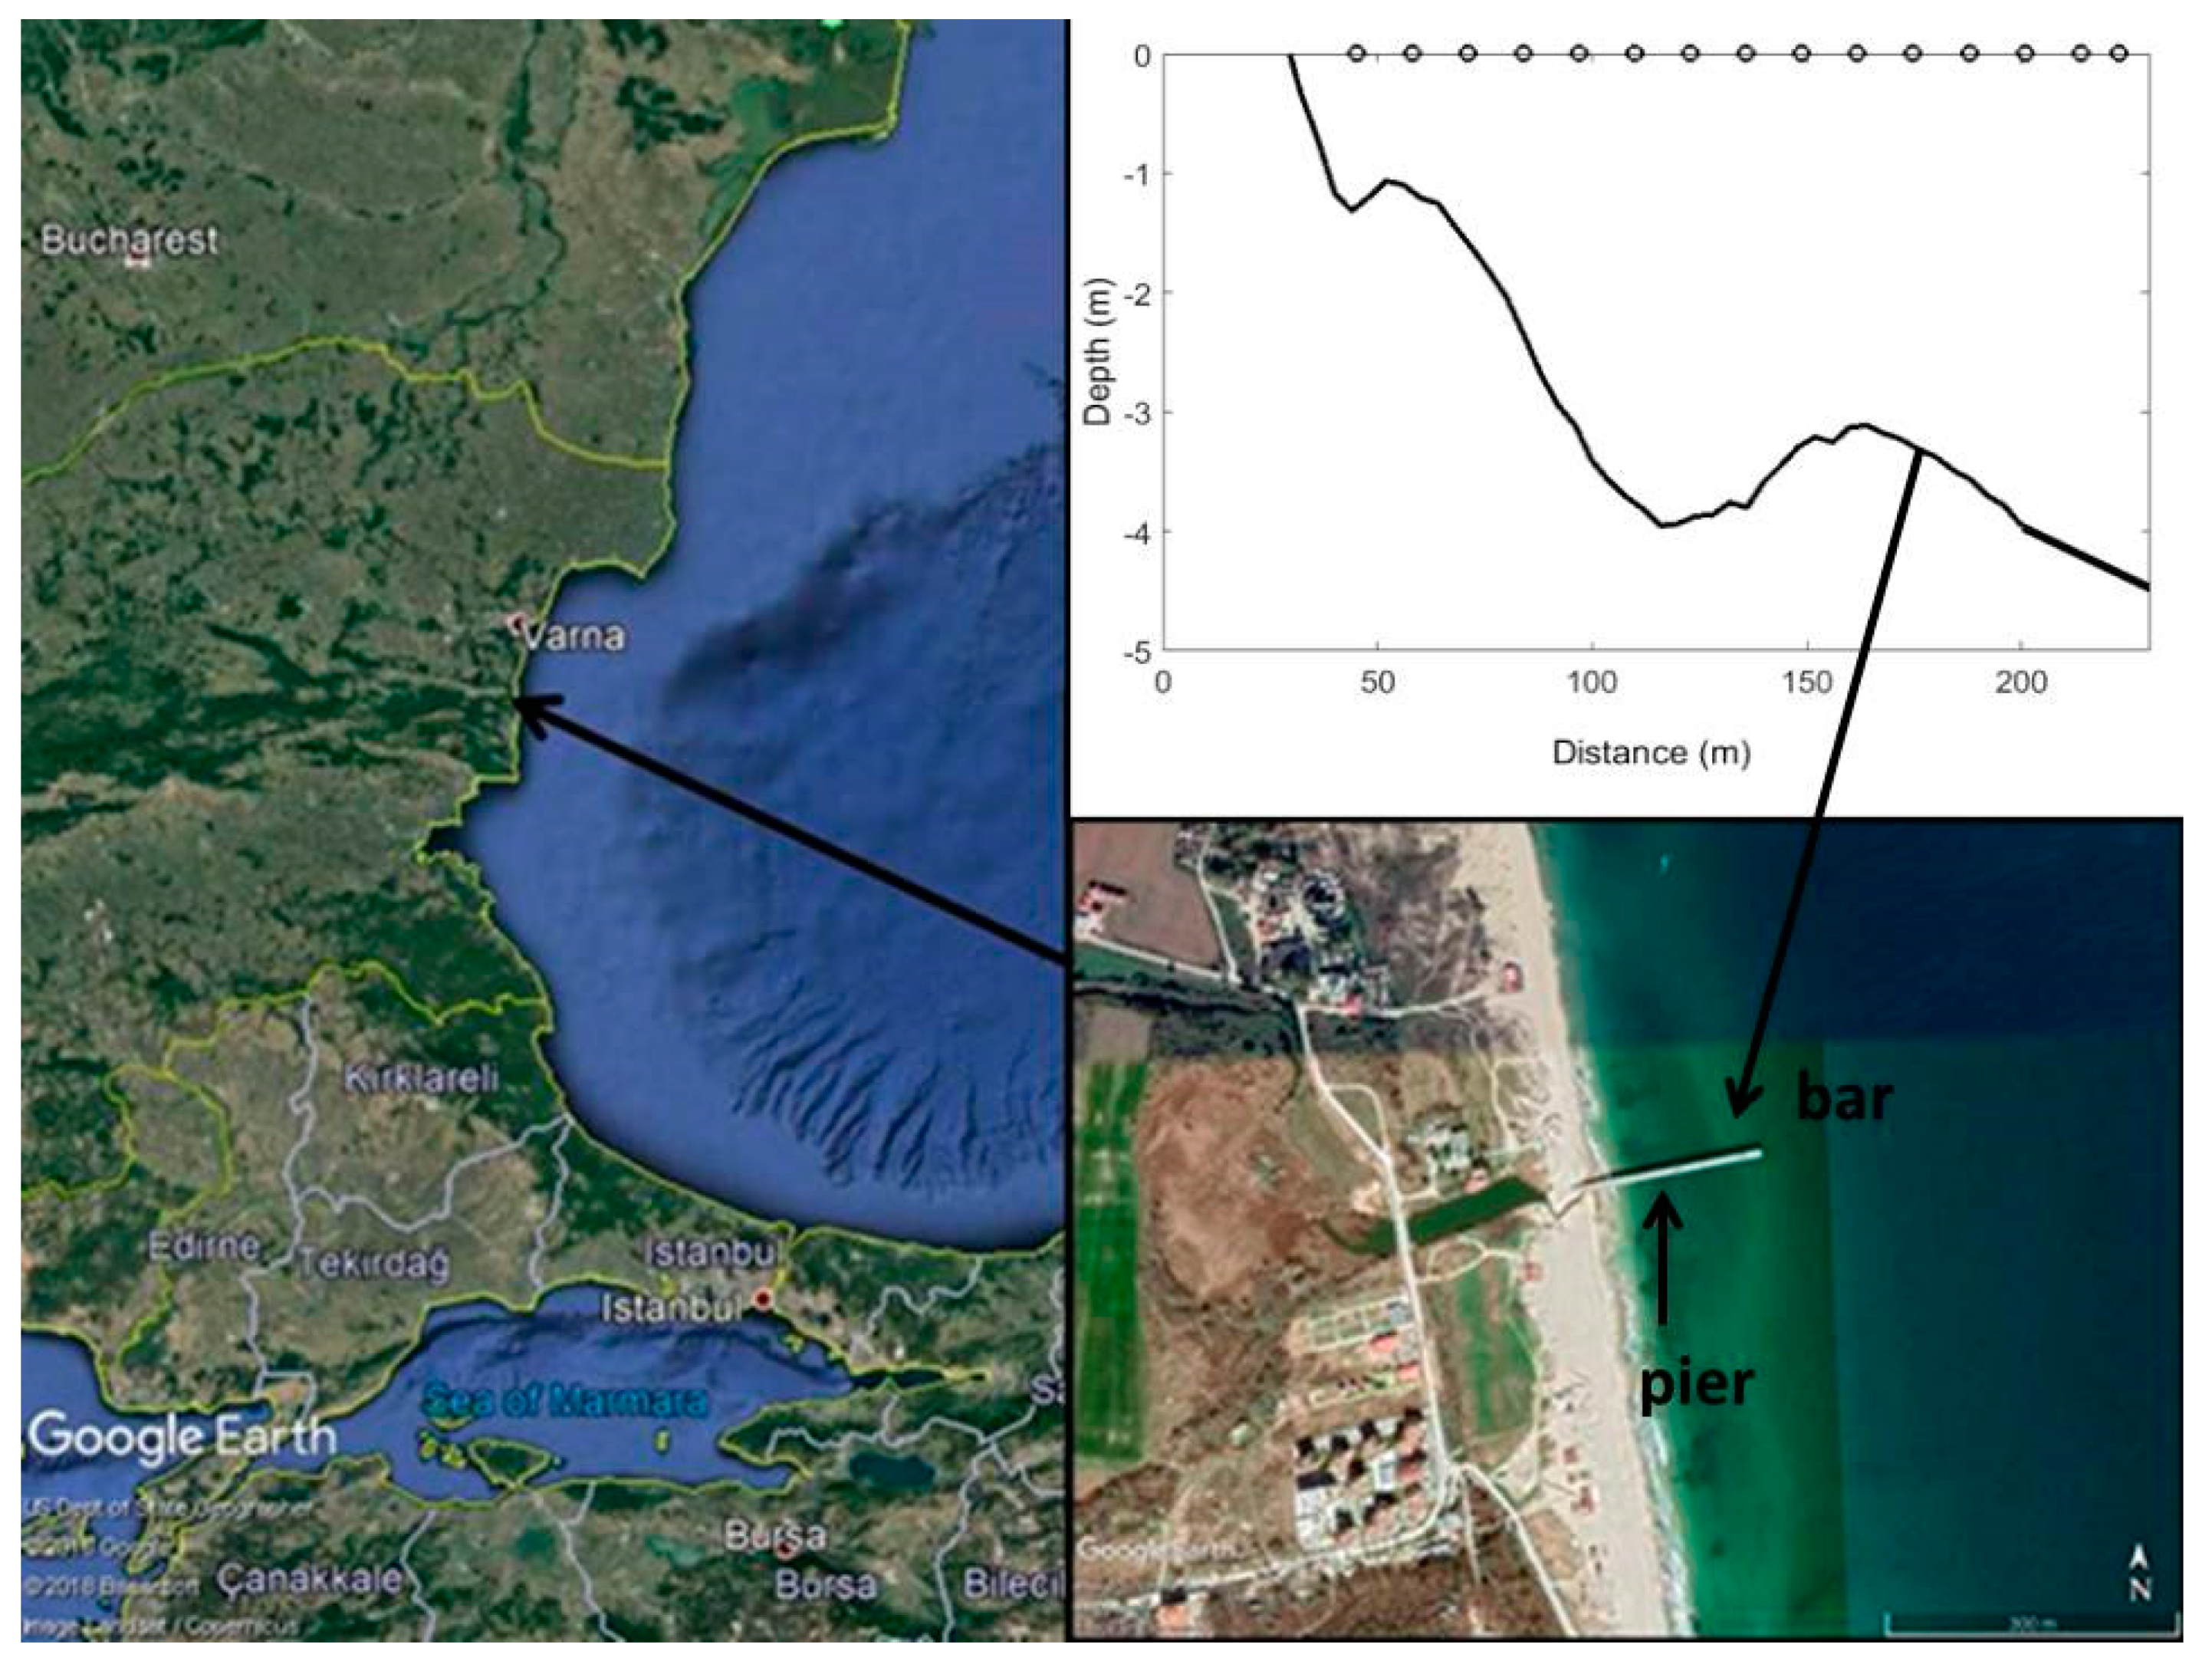
For the analysis, the data of the field experiment carried out in September–October 2007 in the Shkorpilovtsi settlement (Bulgaria) at a special experimental pier belonging to the Institute of Oceanology of the Bulgarian Academy of Sciences were used. The pier is located on the Kamchiya–Shkorpilovsky beach site on the Black Sea (
Figure 1), which does not have a sediment budget deficit and has been relatively stable over the past 50 years. The study site has a rectilinear shoreline with almost parallel isobaths. During the experiment, the approach of the storm waves was almost perpendicular to the coastline, and the longshore current was either very weak or even absent, i.e., it can be assumed that the changes in the underwater topography and coastline were determined mainly by wave action and the cross-shore wave-driven currents, like undertow [
28].
During the experiment, along the pier, with a length of 230 m, 15 string wave gauges were installed: seven are the capacitive type and eight are the resistance type. The free surface elevations (waves) were measured with sampling frequencies of 5 and 200 Hz, respectively (
Figure 1). The length of the series of measurements lasted from 20 min to 1 h. For analysis, long records were divided into 20 min sections corresponding to the quasi-stationary state of the wave regime.
The sea bottom in the area is composed mainly of anisomeric sand, in which quartz components predominate (96%). The other 4% consists of fine shell particles. In the upper part of the underwater bottom profile (up to 2.5 m depth), over 95% of bottom sediments consist of coarse and medium sands (0.30/0.70 mm). With increasing water depth sediment, decreasing grain size and at depths greater than 8 m, the size over 90% of sediments is less than 0.25 mm [
29].
Synchronously with the wave measurements, the seabed variations along the pier were measured using a special metal stick lowered from the pier deck every 2 m, from the shore to a depth of about 4 m. Point “0” was on the shore and corresponded to 30 m from the shoreline position. The accuracy of this kind of measurement for strong wave conditions does not exceed 10 cm, and for conditions of calm and moderate excitement it is significantly less [
29,
30]. Despite such a simple method of measurement, it remains the only possible in situ measurement under storm conditions, since other modern methods require a calm sea.
The seabed variation profiles were measured once or three times per day, depending on the wave regime. In total, 37 profiles and 65 wave records were obtained. The sea bottom profile during the experiment had one nearly stable bar, with its top located at a distance of 140–160 m. Sometimes, a second underwater bar was formed near the shore (up to 100 m) and existed for several days.
To estimate the cross-shore sediment discharge, Bailard’s formula was used [
8]:
where
= 0.01 is the coefficient of bottom friction, ρ is the sand density,
= 0.1 and
= 0.02 are the coefficients of turbulent viscosity and turbulent diffusion, respectively, tan
б = 0.5 is the coefficient of particles’ inner friction, where б is the sediment internal friction angle,
is the sediments fall velocity, and
and
are third and fourth moments of near-bottom velocity, respectively.
The first term of Formula (2) concerns the bedload sediment transport and the second one represents the transport of suspended sediments, as shown in [
31,
32]:
where
u1 and
u2 are the amplitudes of first and second harmonics of horizontal velocity.
Numerous experimental studies have shown that velocities within a coastal zone are linearly related to the free surface elevations and can be calculated with good accuracy using the linear wave theory (for example, [
33,
34,
35]). Therefore,
where
i = 1, 2,
a1 and
a2 are the amplitudes of first and second nonlinear harmonics,
φ is the shift of phases between
a1 and
a2 (biphase),
ω is the angular frequency,
k1,2 is the wave number,
h is the water depth.
For the calculation of the biphase in irregular waves, a bispectral analysis was applied [
36]:
where
is the bispectrum,
ω is the angular frequency,
A are the complex Fourier-amplitudes of free surface, and
E is an averaging operator. The frequencies of the first and second harmonics are determined by the positions of the local maxima of the wave spectrum.
As can be seen from Formulas (2)–(4) the sediment discharge q on a given water depth depends on the amplitudes of first and second non-linear wave harmonics and the phase shift between them. In this case, the biphase (its cosine) determines the direction of sediment flow, and the value of the sediment discharge depends on the amplitudes of non-linear harmonics and on the cosine of the biphase. That is, the non-linear transformation of waves in the coastal zone, as a result of which the amplitudes and the phase shift between them change, will significantly affect the sediment discharge.
Deformations of the bottom topography depend on the sediment discharge gradient and can be calculated as:
where
h is the depth. The positive sign (+) corresponds to the increase in depth, i.e., erosion of sea bottom and removal of sandy material, and the negative sign (−) corresponds to the decrease in depth, i.e., the accumulation of sandy material at the bottom.
To account for the undertow – off-shore directed flow always arising to compensate for the on-shore directed mass transport due to the Stokes drift at waves propagation, a simple formula was used:
where
H is the wave height, and
g is the gravitational acceleration.
3. Discussion of Results
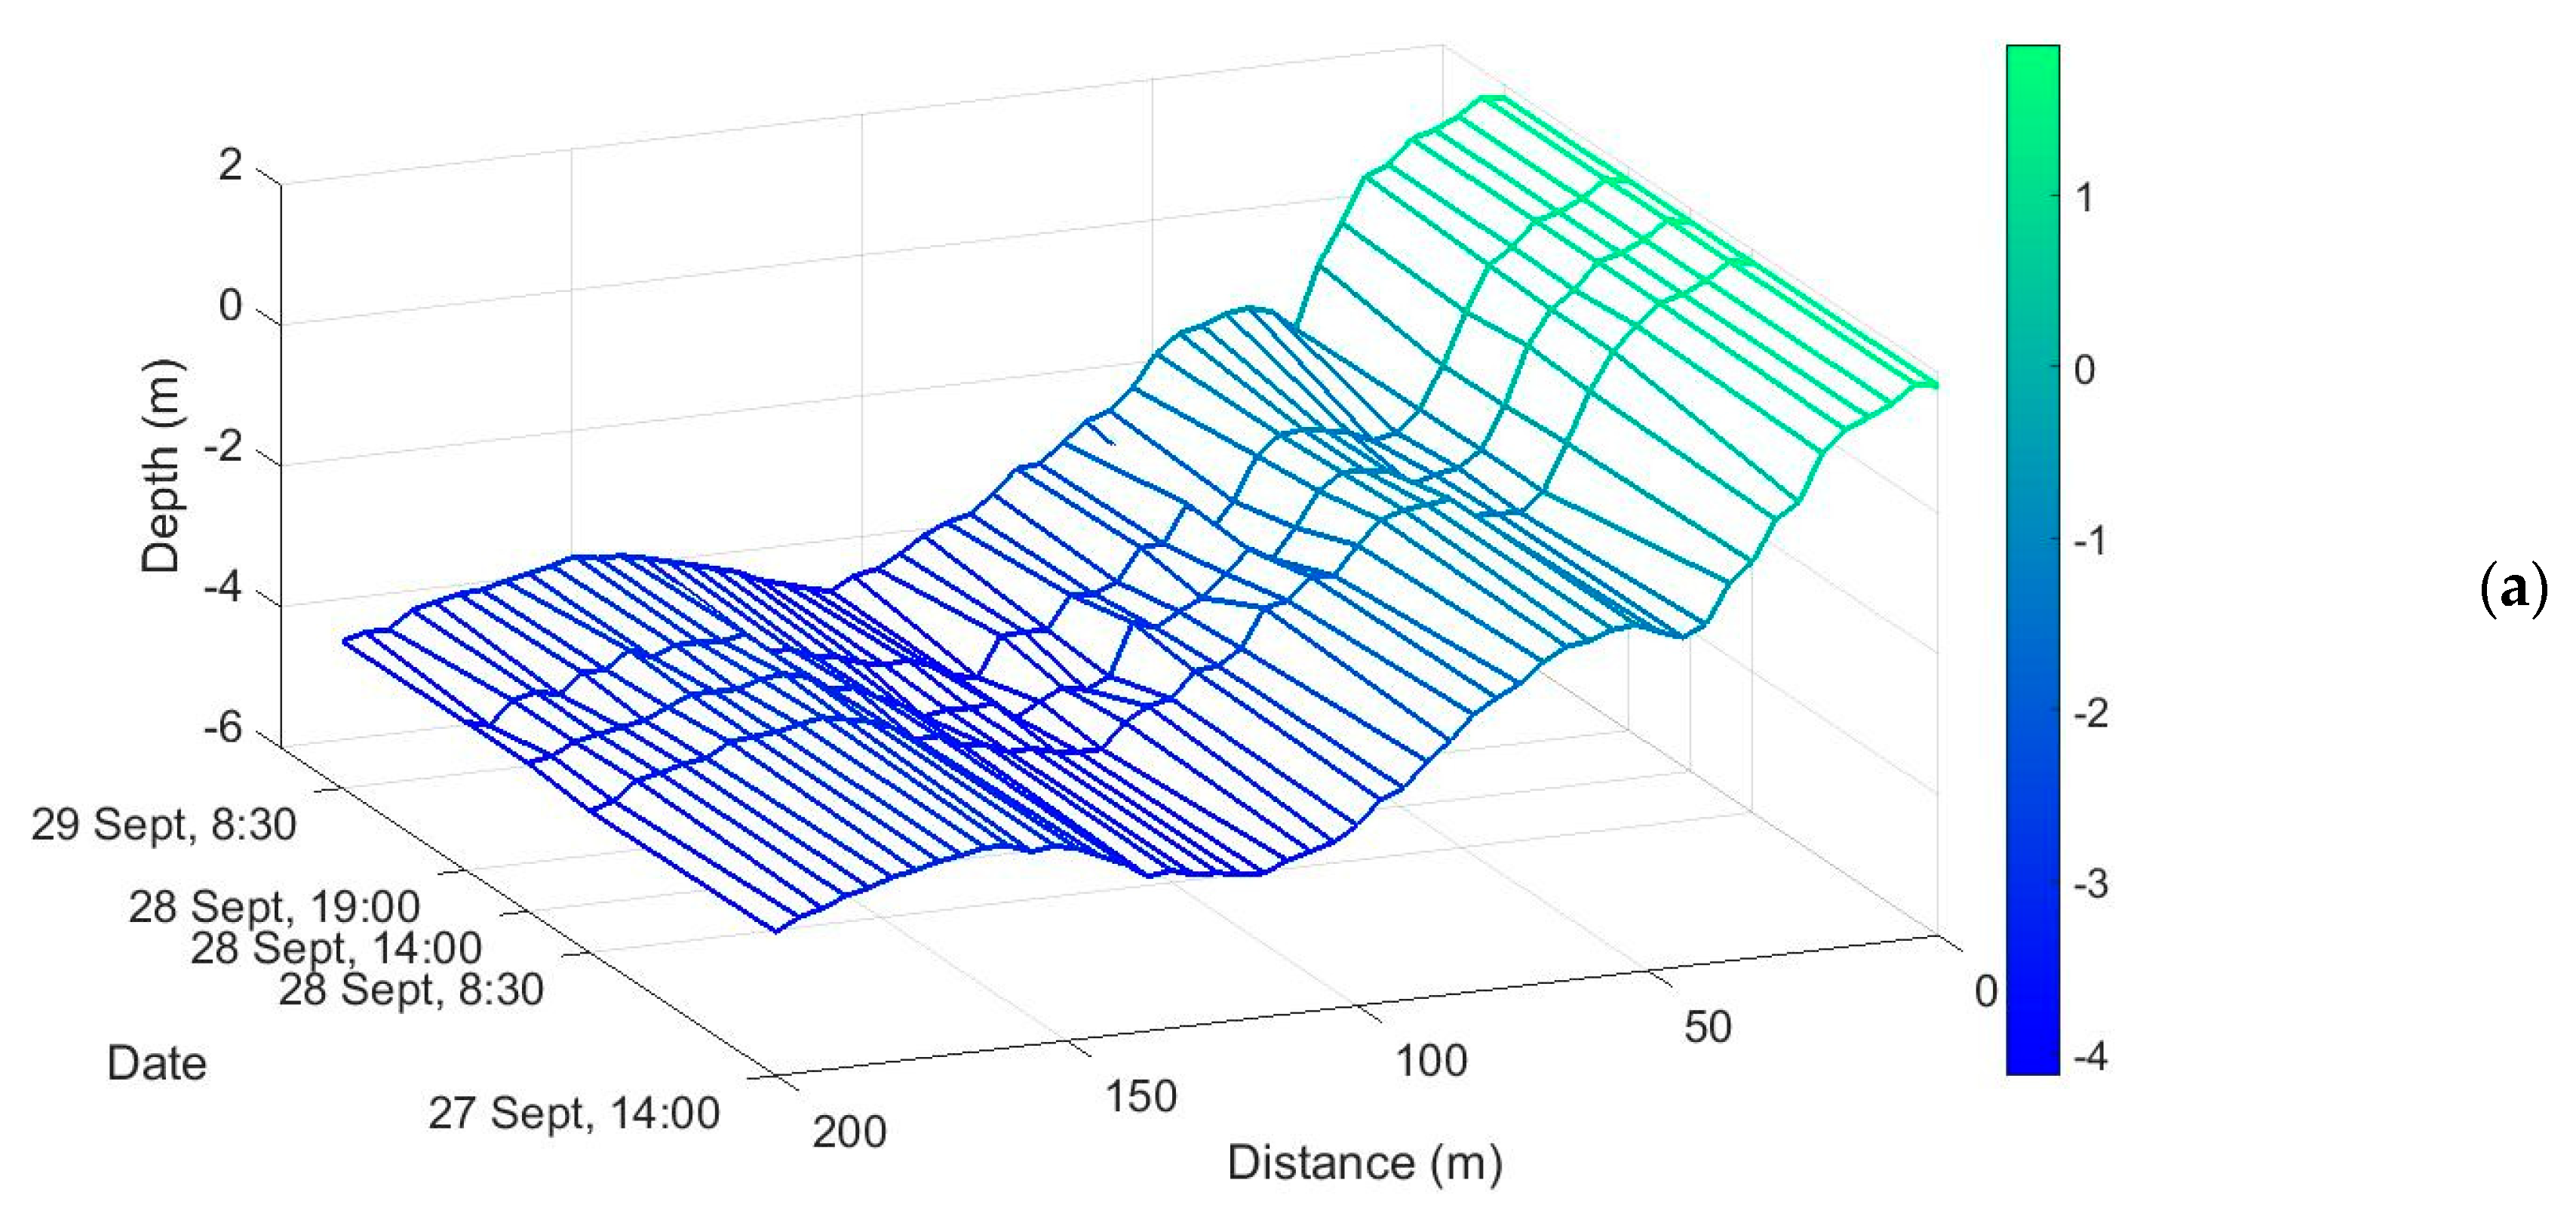
In order to analyze the influence of non-linear wave transformation on the cross-shore sediment transport, the sea bottom profile evolution graphs that were recorded from 14:00 on 27 September until the morning of 29 September 2007 were compared (
Figure 2).
Comparing the profile on 27 September and the profile average over three measurements during the day of 28 September, it can be seen that the wave regime of 28 September led to the erosion of the underwater slope and formed a storm bar at distances of 50–70 m. The change in the wave regime from the evening of 28 September to the morning of 29 September led to the smoothing out of the erosion and accumulation of sand by the movement of the storm bar to the shore at the distances of 35–60 m.
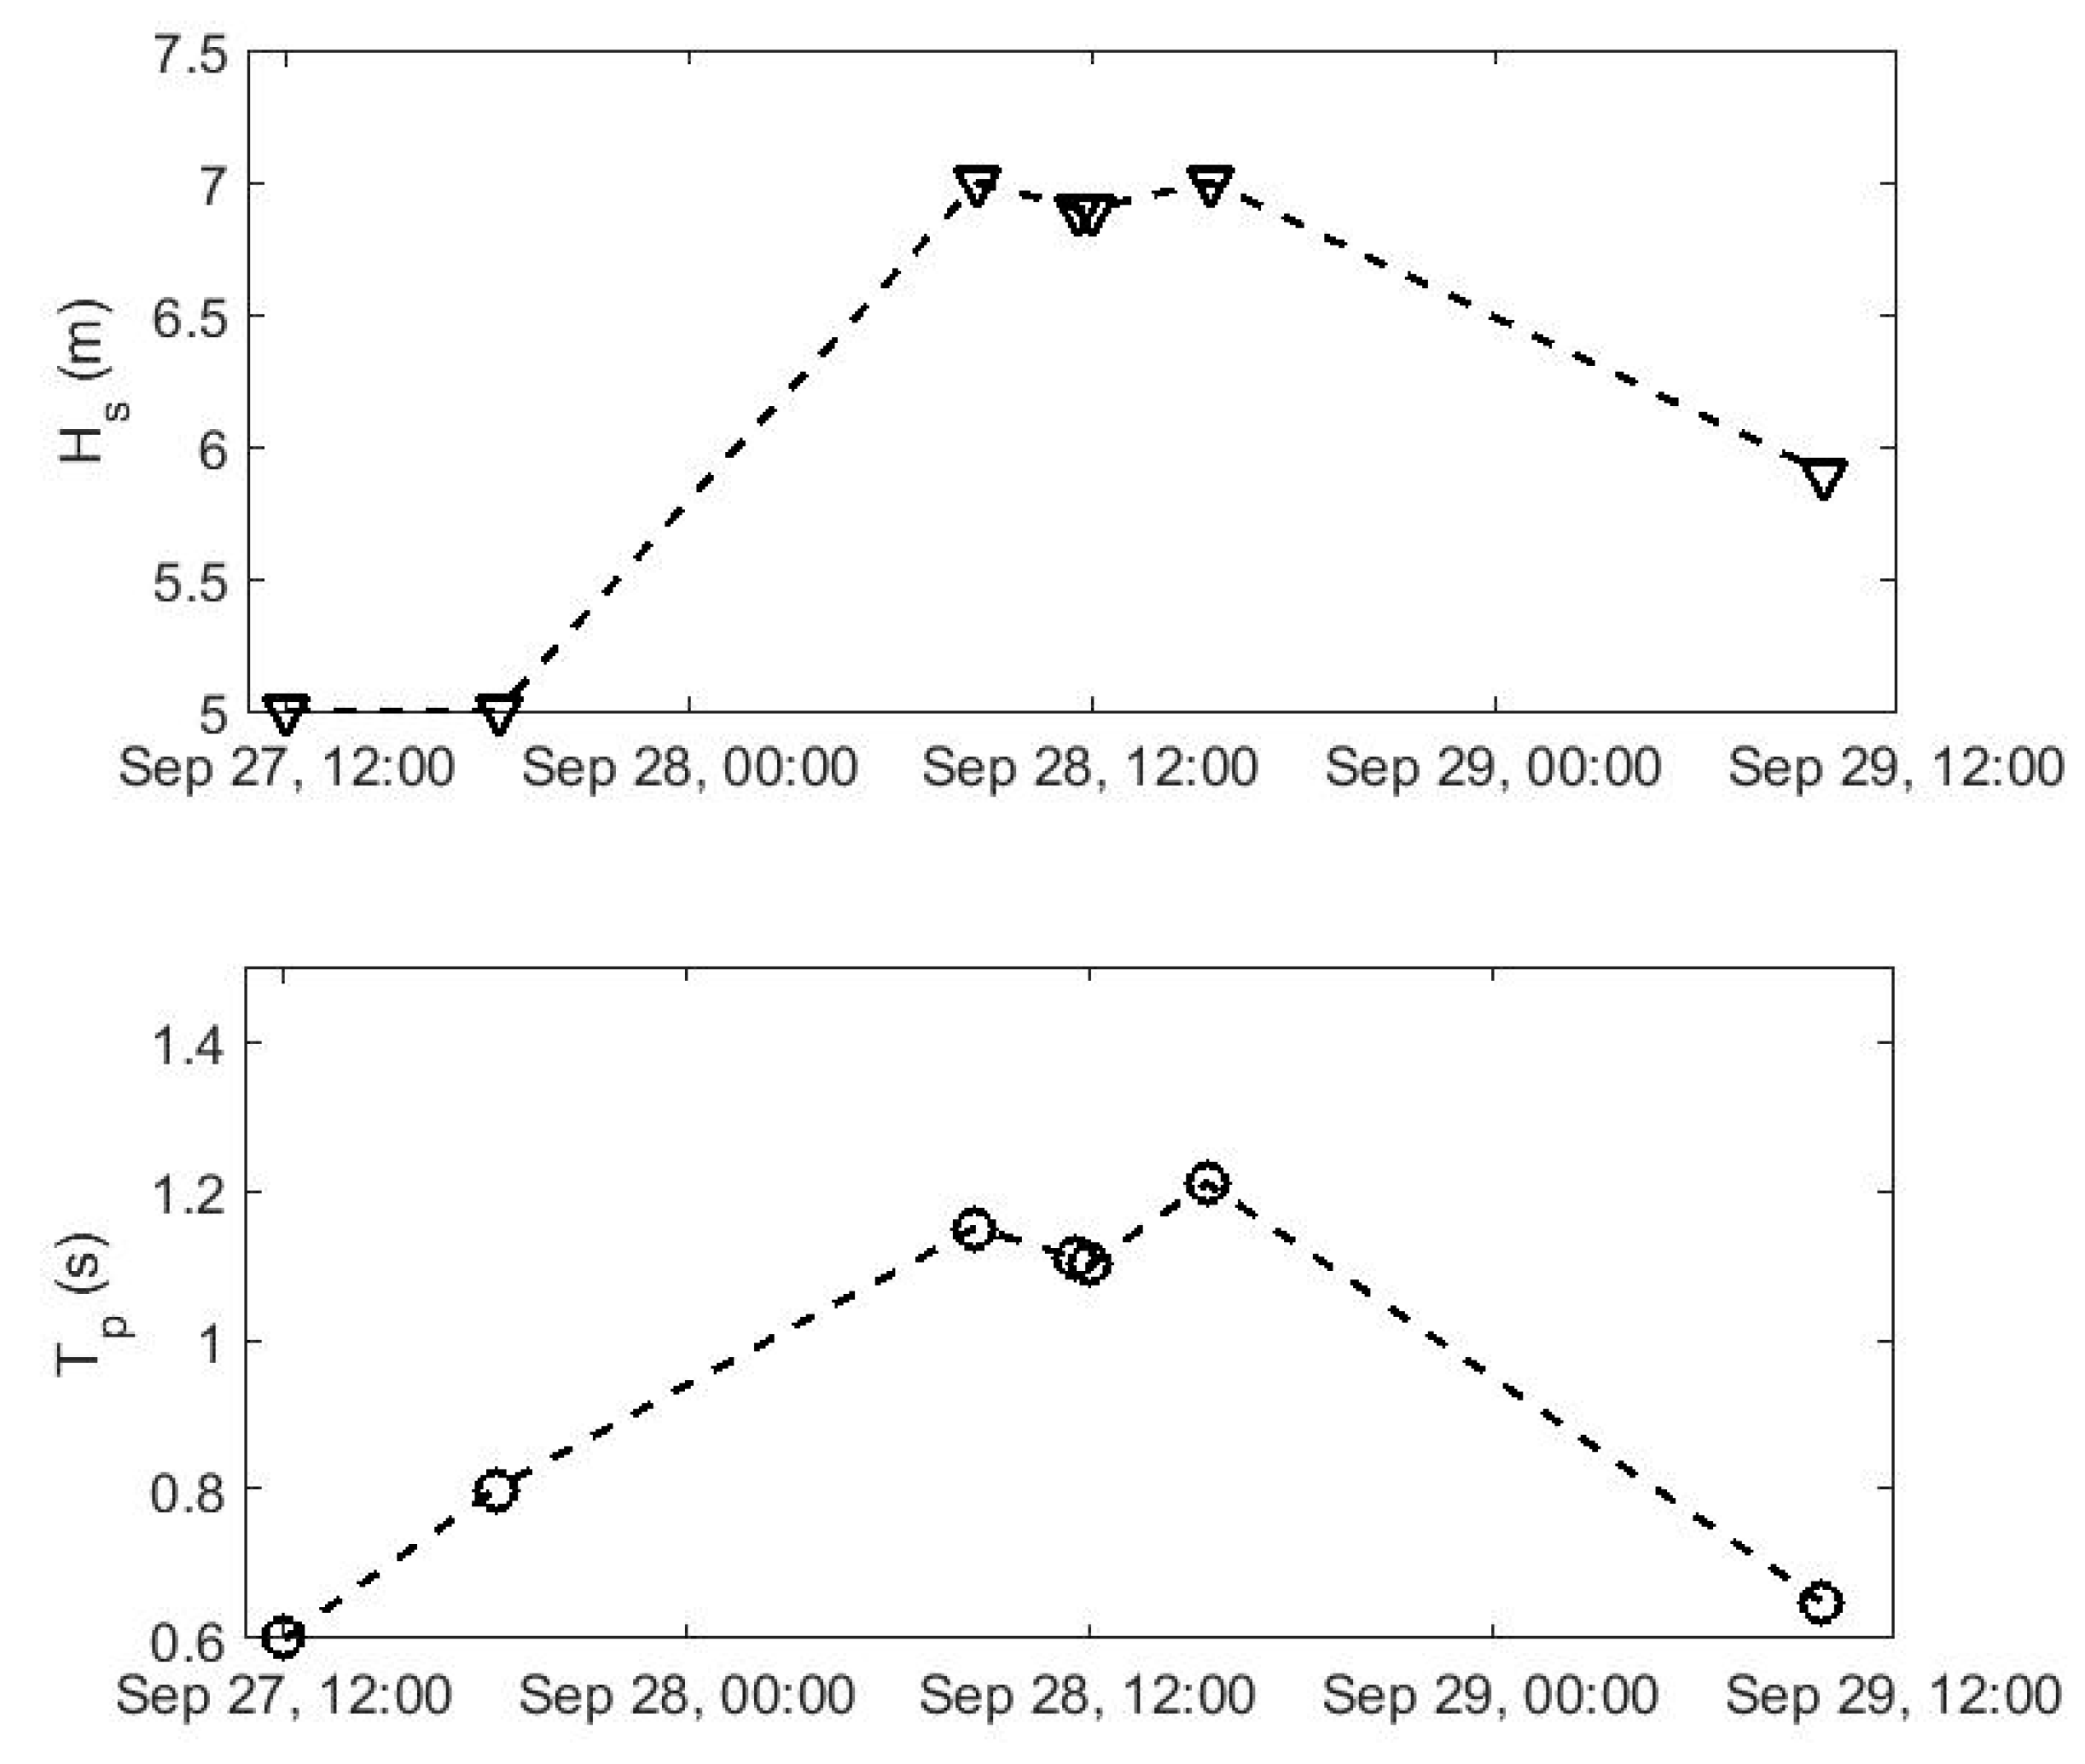
In the evening of 27 September, the sea swell was weak, the significant wave height at a distance of 220 m from the coast was 0.6 m, the peak period was 5 s. In the morning of 28 September, the wave regime altered, and until the evening the wave conditions were virtually stable: light swell with a peak period of about 7 s and significant wave height varying within the range of 1.1 m. Up until the morning of 29 September, the swell gradually attenuated, followed by a decrease in the period and height of the waves. The parameters of wave regimes—significant wave height (H
s) and spectrum peak period (T
p) at a distance of 220 m—recorded from the morning of 27 September to 29 September are presented in
Figure 3.
The waves propagated perpendicularly to the coast at all measurement points, and registration was carried out synchronously at 15 points along the coastal zone. According to visual observations, the breaking of all waves on 28 September occurred at a distance of 70–85 m from the coast, while the plunging breakers prevailed. As for the breaking of the highest waves, which was happening at a distance of 140–160 m from the coast, as the dominant wave breaking type was spilling, plunging breakers were significantly rarer. On 29 September, the waves broke only on the beach.
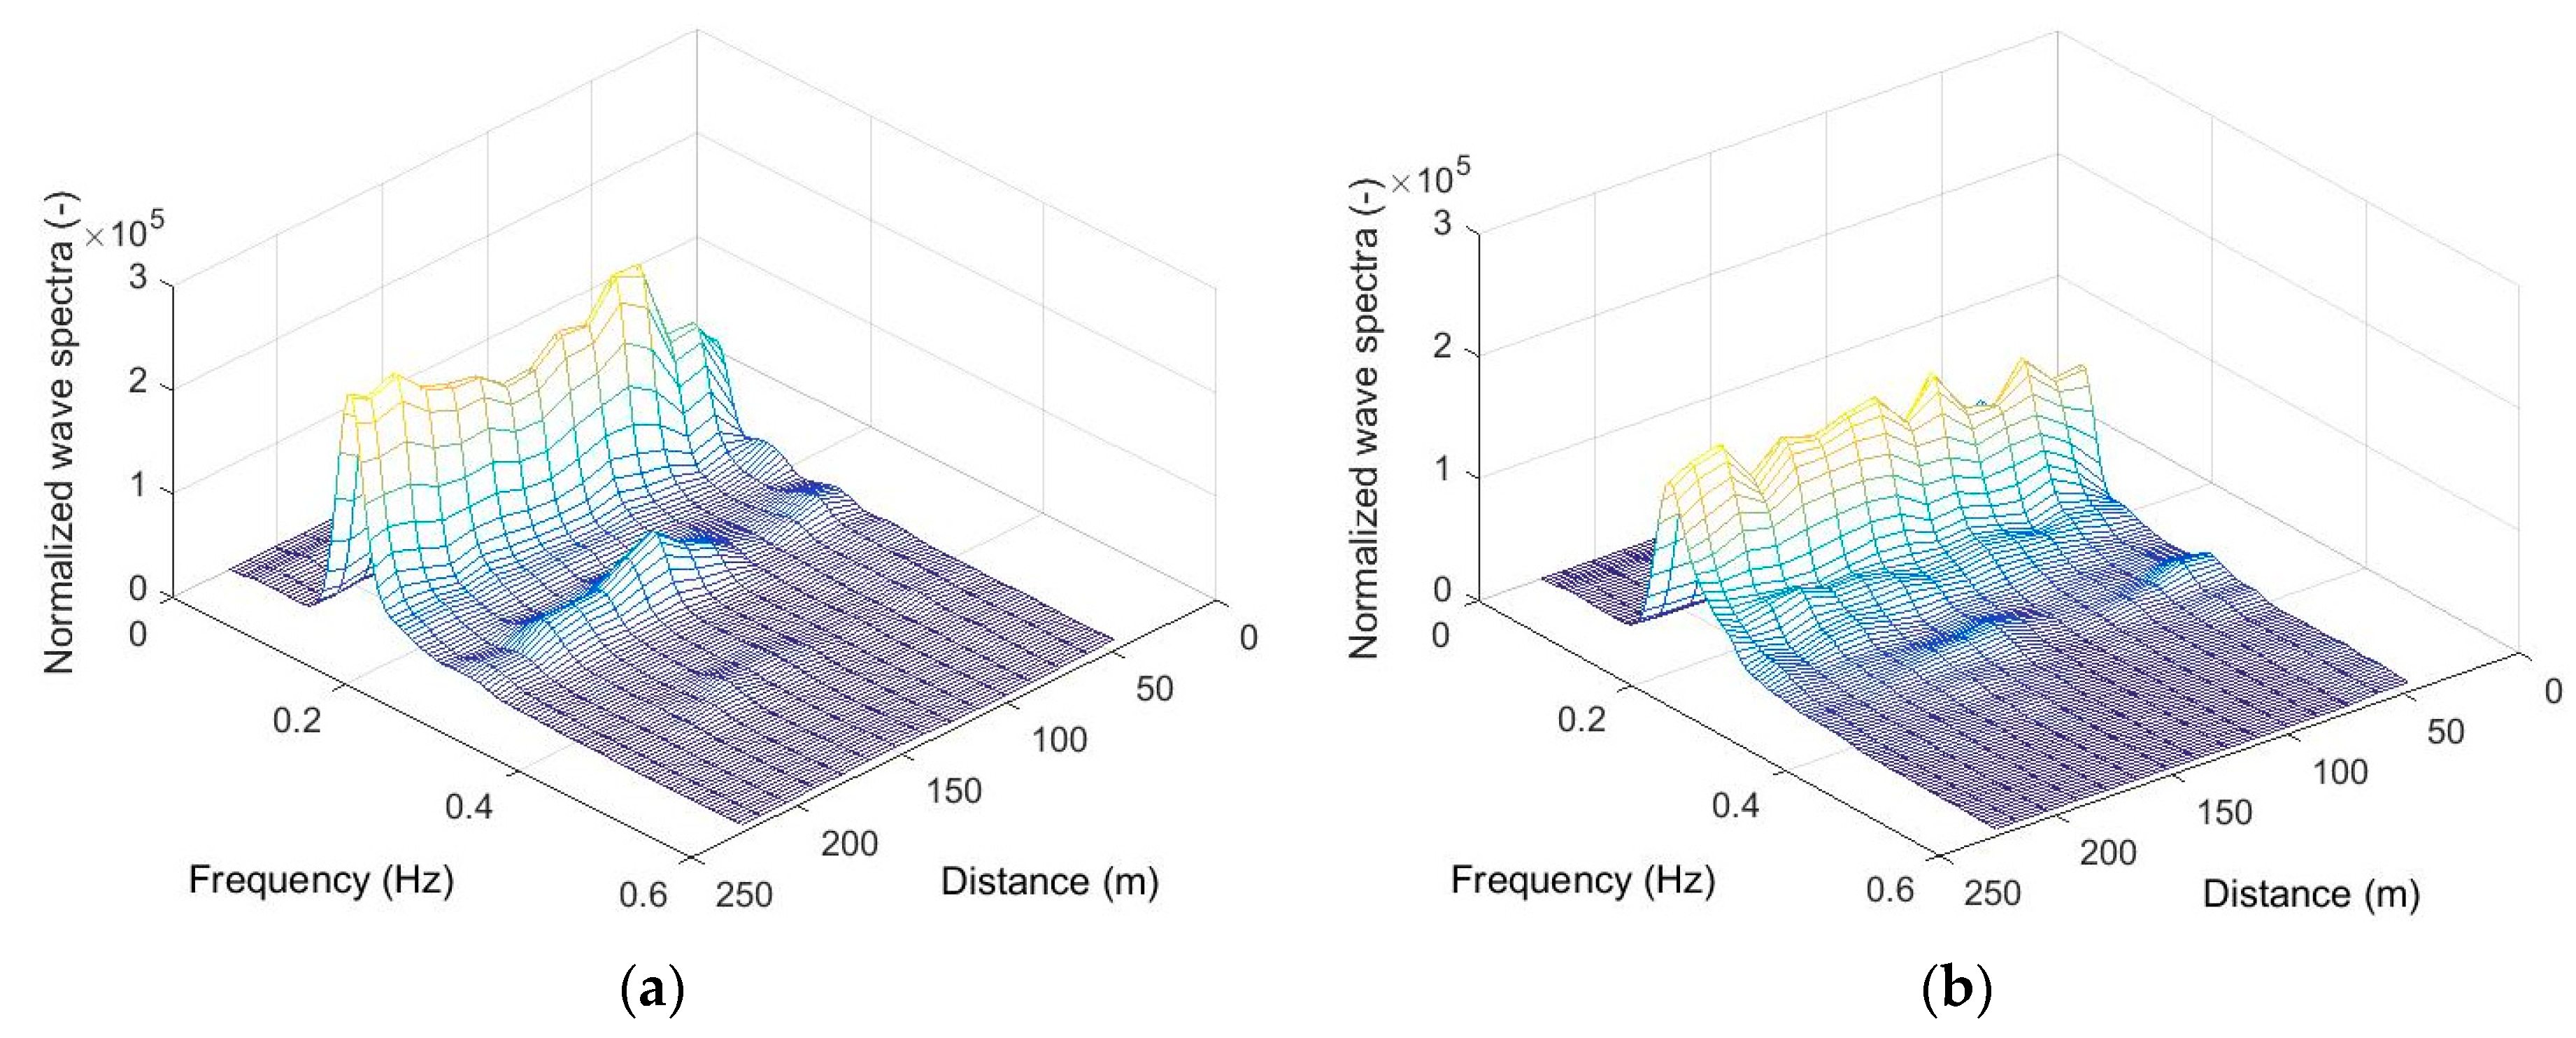
The evolutions of the typical wave spectrum of 28 September, with the example of wave run 34, and the wave spectrum of the morning of 29 September (wave run 42) are shown in
Figure 4a,b, respectively. The spectra were created by Welch’s method with a Hamming window. Since the wave heights in different series of measurements differed as well, for the sake of a proper comparison, all spectra were pre-normalized to the corresponding wave dispersion.
As can be seen from
Figure 4, the wave spectra were narrow enough to separate the frequency ranges of the first and second harmonics. The frequency ranges of harmonics were determined by the minimum between the two peaks of the spectrum, corresponding to the frequencies of the maximum of first and second harmonics. For example, in
Figure 4a, the frequency ranges of the first and second harmonics are 0.11–0.2 Hz and 0.22–0.35 Hz, respectively.
The spatial evolution of the frequency range energy of the amplitudes of the first and second harmonics (hereafter referred to as simply the first and second harmonics) was presented as a percentage of change in the spectral energy of the corresponding frequency range, provided that the total energy of the spectrum over the frequency range of the first and second harmonics was 100%.
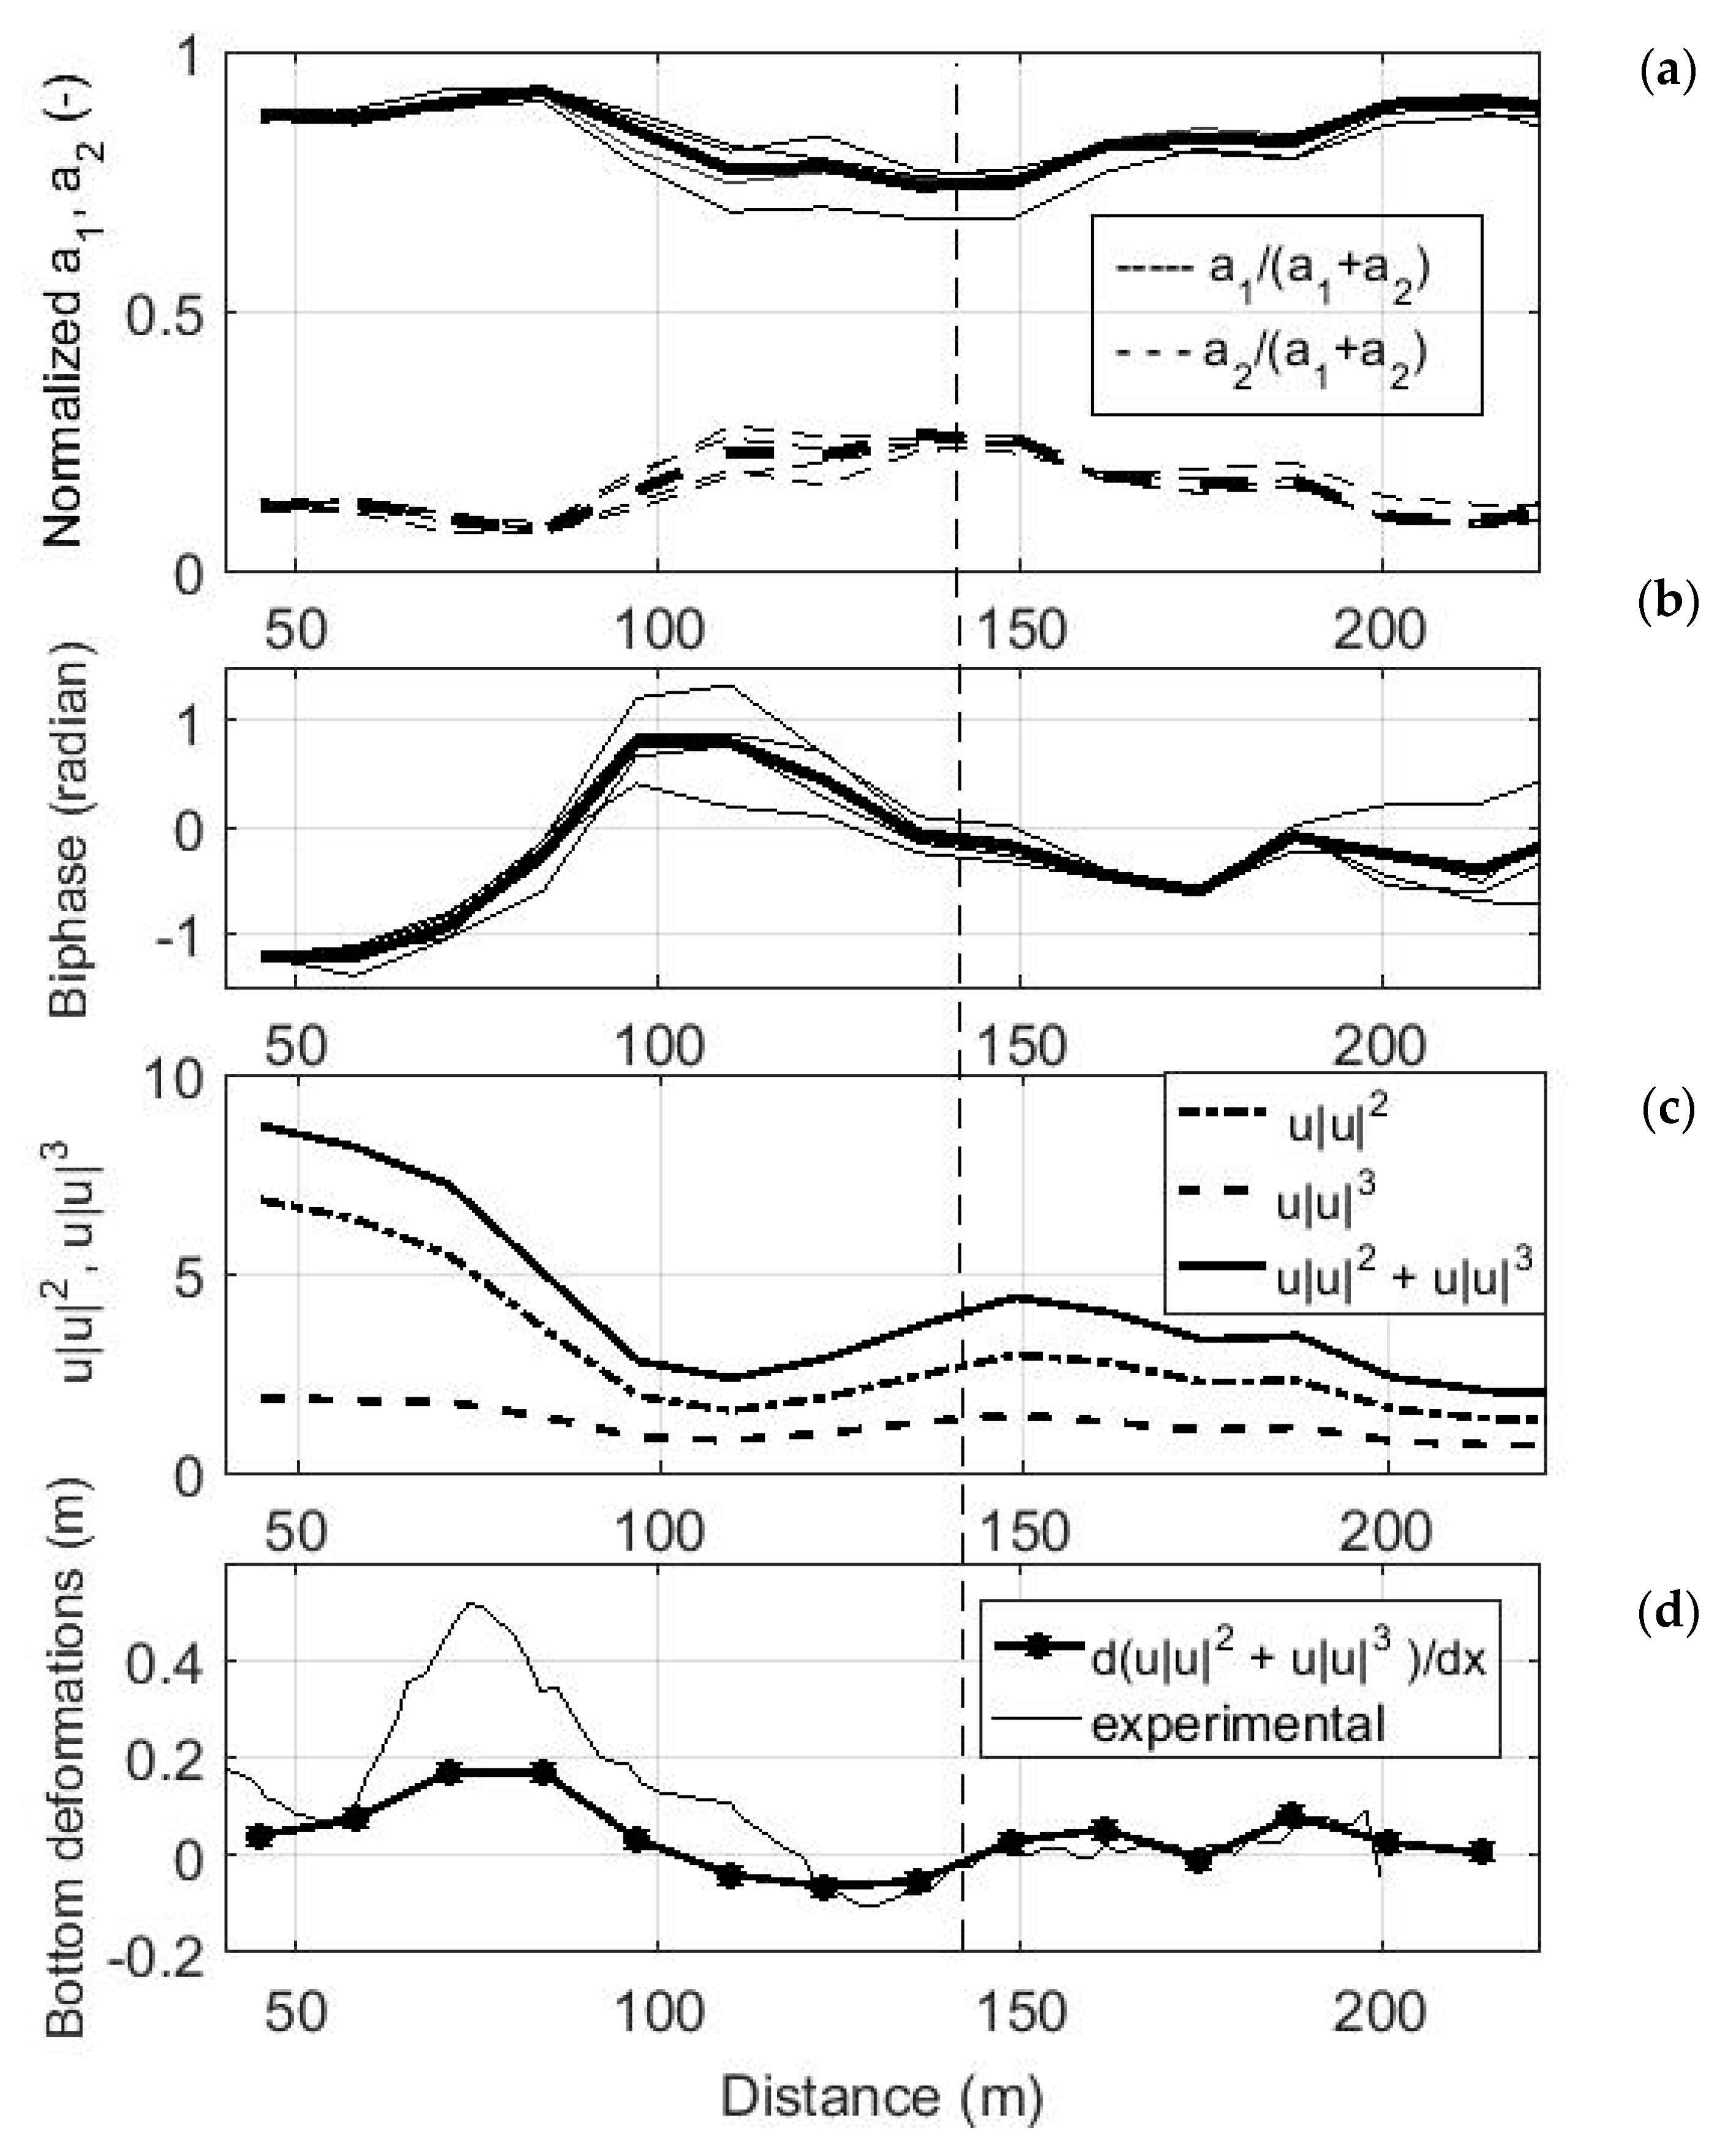
The evolution of amplitudes 1 and 2 of the non-linear harmonics and biphases for the selected wave runs, 34–39, were measured during the day of 28 September, and wave run 42, which was measured in the morning of 29 September, are presented in
Figure 5a,b and
Figure 6a,b, respectively.
Let us consider the evolution of the spectra and amplitudes of non-linear harmonics and the phase shift between them more closely (
Figure 4,
Figure 5a and
Figure 6a). It can clearly be seen that, as the waves propagate, the periodic exchange of energy between the main and second non-linear harmonics takes place. As the waves approach the shore, the amplitude of the second harmonic begins to increase, and the first begins to decrease, then the energy begins to transfer back from the second harmonic to the first one. On 28 September, the absolute maximum of the second harmonic amplitude was spotted within the coastal zone (distance 150 m from the coast,
Figure 4a and
Figure 5a), and one pronounced energy exchange period was observed between them.
On 29 September, the absolute maximum of the second non-linear harmonic was spotted closer to the coast and almost two complete periods of energy exchange between the harmonics were observed. The change in the biphase for these cases, calculated with the use of Formula (6), is shown in
Figure 5b and
Figure 6b. As waves propagate towards the shore, the biphase varies between [−π/2, +π/2], which, according to Formulas (3) and (4), will always result in a positive sediment discharge, directed toward the shore. As shown in [
24,
37], such a change in the biphase is characteristic of non-linear wave transformation over an inclined bottom and wave breaking by spilling and plunging types, which is confirmed by laboratory and field data.
During the periodic energy exchange between non-linear harmonics, when the second harmonic arises and starts to grow, at the beginning the biphase is negative (
Figure 5b distance 150–175 m,
Figure 6b distance 140–175 m from the coast) and then it gradually increases to zero.
The zero value of the biphase corresponds to the maximum amplitude of the second harmonic (distance 140 m,
Figure 5a,b and 150 m,
Figure 6a,b). After that, the amplitude of the second harmonic begins to decrease, and the backward stage of the periodic exchange takes place, followed by an increase in the amplitude of the first harmonic. In this case, the biphase increases and its values are the interval of 0.6–1.4 radian (
Figure 5b, distance 110 m) and 0.8 radian (
Figure 6b distance 125 m). In general, as shown in [
24] the value of the biphase at the point where the second harmonic reaches its maximum amplitude is close to π/2. In the selected examples, we do not observe this critical value in the biphase, possibly because we do not have detailed information, due to the limited spatial resolution of our wave measurements.
Figure 5c,d and
Figure 6c,d show changes in the sediment discharge components calculated with the use of Formulas (3) and (4) and estimated bottom deformations based on changes in the gradient of the sum of these two components. We do this only at a qualitative level, because of heterogeneous sediments on the sea bottom. However, as can be seen from Formula (2), the coefficient before the first term (the bedload sediment transport) is equal to 0.2. The coefficient before the second term (the transport of suspended sediments) depends on the sediment fall velocity. For the considered study site, the sand sizes vary from 0.30 to 0.70 mm and the corresponding sediment fall velocities will be in the range from 0.039 to 0.1 m/s. Thus, the coefficient before the second term will vary from 0.2 to 0.51, increasing with a decrease in grain size. For a sand size of 0.30 mm, the transport of suspended sediments will in 2.5 times more than that of bedload sediments, but for a sand size of 0.70 mm, the contribution of suspended and bedload sediments will be equal to the given qualitative assessments.
It can be noted that the periodic exchange of energy encourages the following scenario of sediment discharge spatial fluctuation, and its components describing bedload and suspended sediment transports (
Figure 5c and
Figure 6c): the energy of the second harmonic grows and decreases along with the discharge. As can be seen from
Figure 5c and
Figure 6c, the maximum values of the main components of the cross-shore sediment discharge coincide with the maximum of the second harmonic. The cosine of the biphase at this moment also reaches its maximum; it equals one, since the biphase is equal to zero. The minimum values of the main components of the cross-shore sediment discharge can be attributed to the beginning of the growth phase of the second harmonic as well as to its small values, due to the backward transfer of energy to the first harmonic. Such a characteristic change in the sediment discharge during the energy exchange between harmonics leads to the following deformations of the sea bottom: erosion (positive gradient values) occurs when the second non-linear harmonic grows and, in this case, the sand material transfers and accumulates in the part of the bottom profile where the second harmonic decreases, which corresponds to negative gradient values. That is, with non-linear wave transformation during the period of energy exchange between harmonics taking place, the direction of sediment discharge shifts due to a change in the biphase: erosion occurs with an increase in the amplitude of the second harmonic, i.e., the removal of sand material at distances corresponding to its growth to a maximum value, and at distances corresponding to the backward transfer of energy and a decrease in the amplitude of the second harmonic. The sand material accumulation then occurs. The effect of periodic energy exchange on sediment transport is better observed when the waves do not break (
Figure 6c,d).
As the swell attenuated, the wave period decreased, the conditions of wave transformation altered, and the scenario also changed. When the waves became shorter, the spatial period of exchange decreased, because the detuning
δ (Formula (1)) increased. Therefore, it is already possible to observe more than one energy exchange period over the existing underwater bottom profile (
Figure 6a). The biphase changes its sign twice—at 150 m and 50 m. This leads to additional accumulation, occurring at less than 50 m from the coast, due to sand material being transferred from the area at 50–80 m from the coast.
The features which were revealed on the basis of qualitative analysis are confirmed by the experimental data. Differences in depth between the measured profile in the evening of 27 September and averaged profile on 28 September (
Figure 5d and
Figure 6d, thin line) qualitatively correspond to the calculated bottom deformation, taking into account the effect of the undertow.
The undertows calculated by Formula (8), with a significant wave height parameter for two different scenarios of wave transformations, are shown in
Figure 7.
Under the influence of the periodic energy exchange between harmonics, the erosion occurs on the seaward slope of the bar, with its sand material being transferred to the shoreward slope of the bar. The undertow at 100–200 m from the coast is not very large and possibly affects the transfer and accumulation of sand material in the vicinity of the bar top, i.e., the periodic energy exchange can lead to a shift in the symmetry of the bar. Moreover, the influence of the undertow or sand avalanching may affect the erosion observed at 110 m from the coast (
Figure 2). The growth of the second harmonic, as waves propagate closer to the coast, leads to the erosion of the bottom profile and the accumulation of sand material close to the coast. When wave-induced cross-shore sediment, which already has a significant value, interacts with the undertow directed towards the sea, a well-defined underwater bar is formed (sand accumulation at 60 m from the coast,
Figure 2). This confirms the ideas in the literature about the influence of wave non-linearity on the underwater bar formation (for example, [
25,
27]).
The underwater bottom profile averaged over the day of 28 September and the profile of 29 September, formed by a weak wave regime (
Figure 2), show that the underwater bar shifted significantly towards the coast. This happened due to changes in the wave regime and corresponding changes at points where the biphase changed its sign. The resulting depth difference (the deformation of the sea bottom profile) corresponds to the calculated trends of bottom deformation, taking into account the influence of the undertow. Thus, the shoreward slope of the bar is smoothed out even more (130–150 m) due to the transfer of sand material from its seaward slope (160–200), which occurs against the backdrop of the energy exchange between harmonics. The contribution of the undertow in this vicinity is minor (
Figure 7). The erosion at 70–100 m from the coast is associated with another growth of two harmonics, and the accumulation of sandy material at distances less than 60 m from the coast is associated with the beginning of its decrease and a change in the sign of the biphase. This causes bar movement towards the shore. In this case, the periodic energy exchange is a mechanism of the underwater bar movement. The undertow, being directed towards the sea, weakens the process of accumulation and supports the shape of the bar. However, in cases when the influence of undertow is minor, the cross-shore wave-induced transport and accumulation process may prevail and, subsequently, this will lead to the adjoining of the bar to the shore, the disappearance of the bar as a morphological form and the smoothing of the underwater bottom profile in general.
This analysis shows that when the wave regime changes, the scenario of wave transformation changes as well, i.e., the spatial period of energy exchange between harmonics, the position of the maxima of amplitudes of the second harmonic, the shift in the biphase and the resulting bottom deformations are all subject to alterations. This explains why some wave regimes lead to the erosion of the underwater slope, and others lead to sediment accumulation on it.
Over the gentle bottom slope for “small short waves”, more spatial periods of energy exchange between the first and second non-linear harmonics can be expected and, accordingly, a larger part of the underwater profile will be subject to deformations due to non-linear wave transformation. Sandy material will be redistributed in relatively small spatial scales along the whole underwater slope, and will form, for example, several bars, or will not make significant changes to the underwater profile. With an increase in the period (height) of waves and a decrease in the number of spatial oscillations of amplitudes, for example, if only the initial stage of growth of the second non-linear harmonic is observed, it can be expected that the underwater slope will be subject to storm erosion due to the predominance of the undertow over the wave transport of sediments.
4. Conclusions
On the basis of field data, it has been shown that the underwater bottom relief deformations during the non-linear wave transformations and wave energy exchange between first and second non-linear wave harmonics follow a specific scenario. The maximum of the second harmonic amplitude is the point near which the bottom relief deforms in different directions. The erosion of the underwater bottom occurs when the second non-linear harmonic amplitude increases. The accumulation of sandy sediments occurs when it decreases due to backward energy transfer to the first harmonic.
The main reason for this is the specific change in the biphase during the period of energy exchange between the first and second nonlinear wave harmonics. Considering the influence of the undertow directed to the sea, one can expect that erosion will always occur on the underwater slope, where the second harmonic increases up to its maximum, since, in this case, both wave-induced transport and undertow carry sediments in one direction—off-shore. However, in those places where the second harmonic decreases due to nonlinear interactions, sediment accumulation is possible if the wave-induced transport, directed, in this case, to the shore, prevails over the undertow.
The scenarios of non-linear wave transformations in which there is a backward energy transfer from the second non-linear harmonic to the first near the coast will contribute to the accumulation of the sediment on the coast. These scenarios are more characteristic of “small waves”. The scenario only showing an increase in the second harmonic, which is characteristic of large storm waves and plunging breaking waves, will lead to the erosion of the underwater bottom profile.
It was revealed that the periodic exchange of energy between harmonics during the propagation of waves above an existing underwater bar leads to a change in its symmetry—the transfer of sand material from its seaward slope to its shoreward slope.
It has been experimentally confirmed that non-linear wave transformations can also be a mechanism of underwater bar formation and the movement of these bars towards the shore.
The Bailard’s formula adequately reproduces the influence of the scenarios of non-linear wave transformations on cross-shore sediment transport.
The features found in this study of the influence of the transformation of non-linear waves on cross-shore sediment transport and coastal morphodynamics might be useful in coastal engineering for protecting coasts from wave action.
