Techno-Economic Analysis of a Novel Hydrogen-Based Hybrid Renewable Energy System for Both Grid-Tied and Off-Grid Power Supply in Japan: The Case of Fukushima Prefecture


Abstract
:1. Introduction
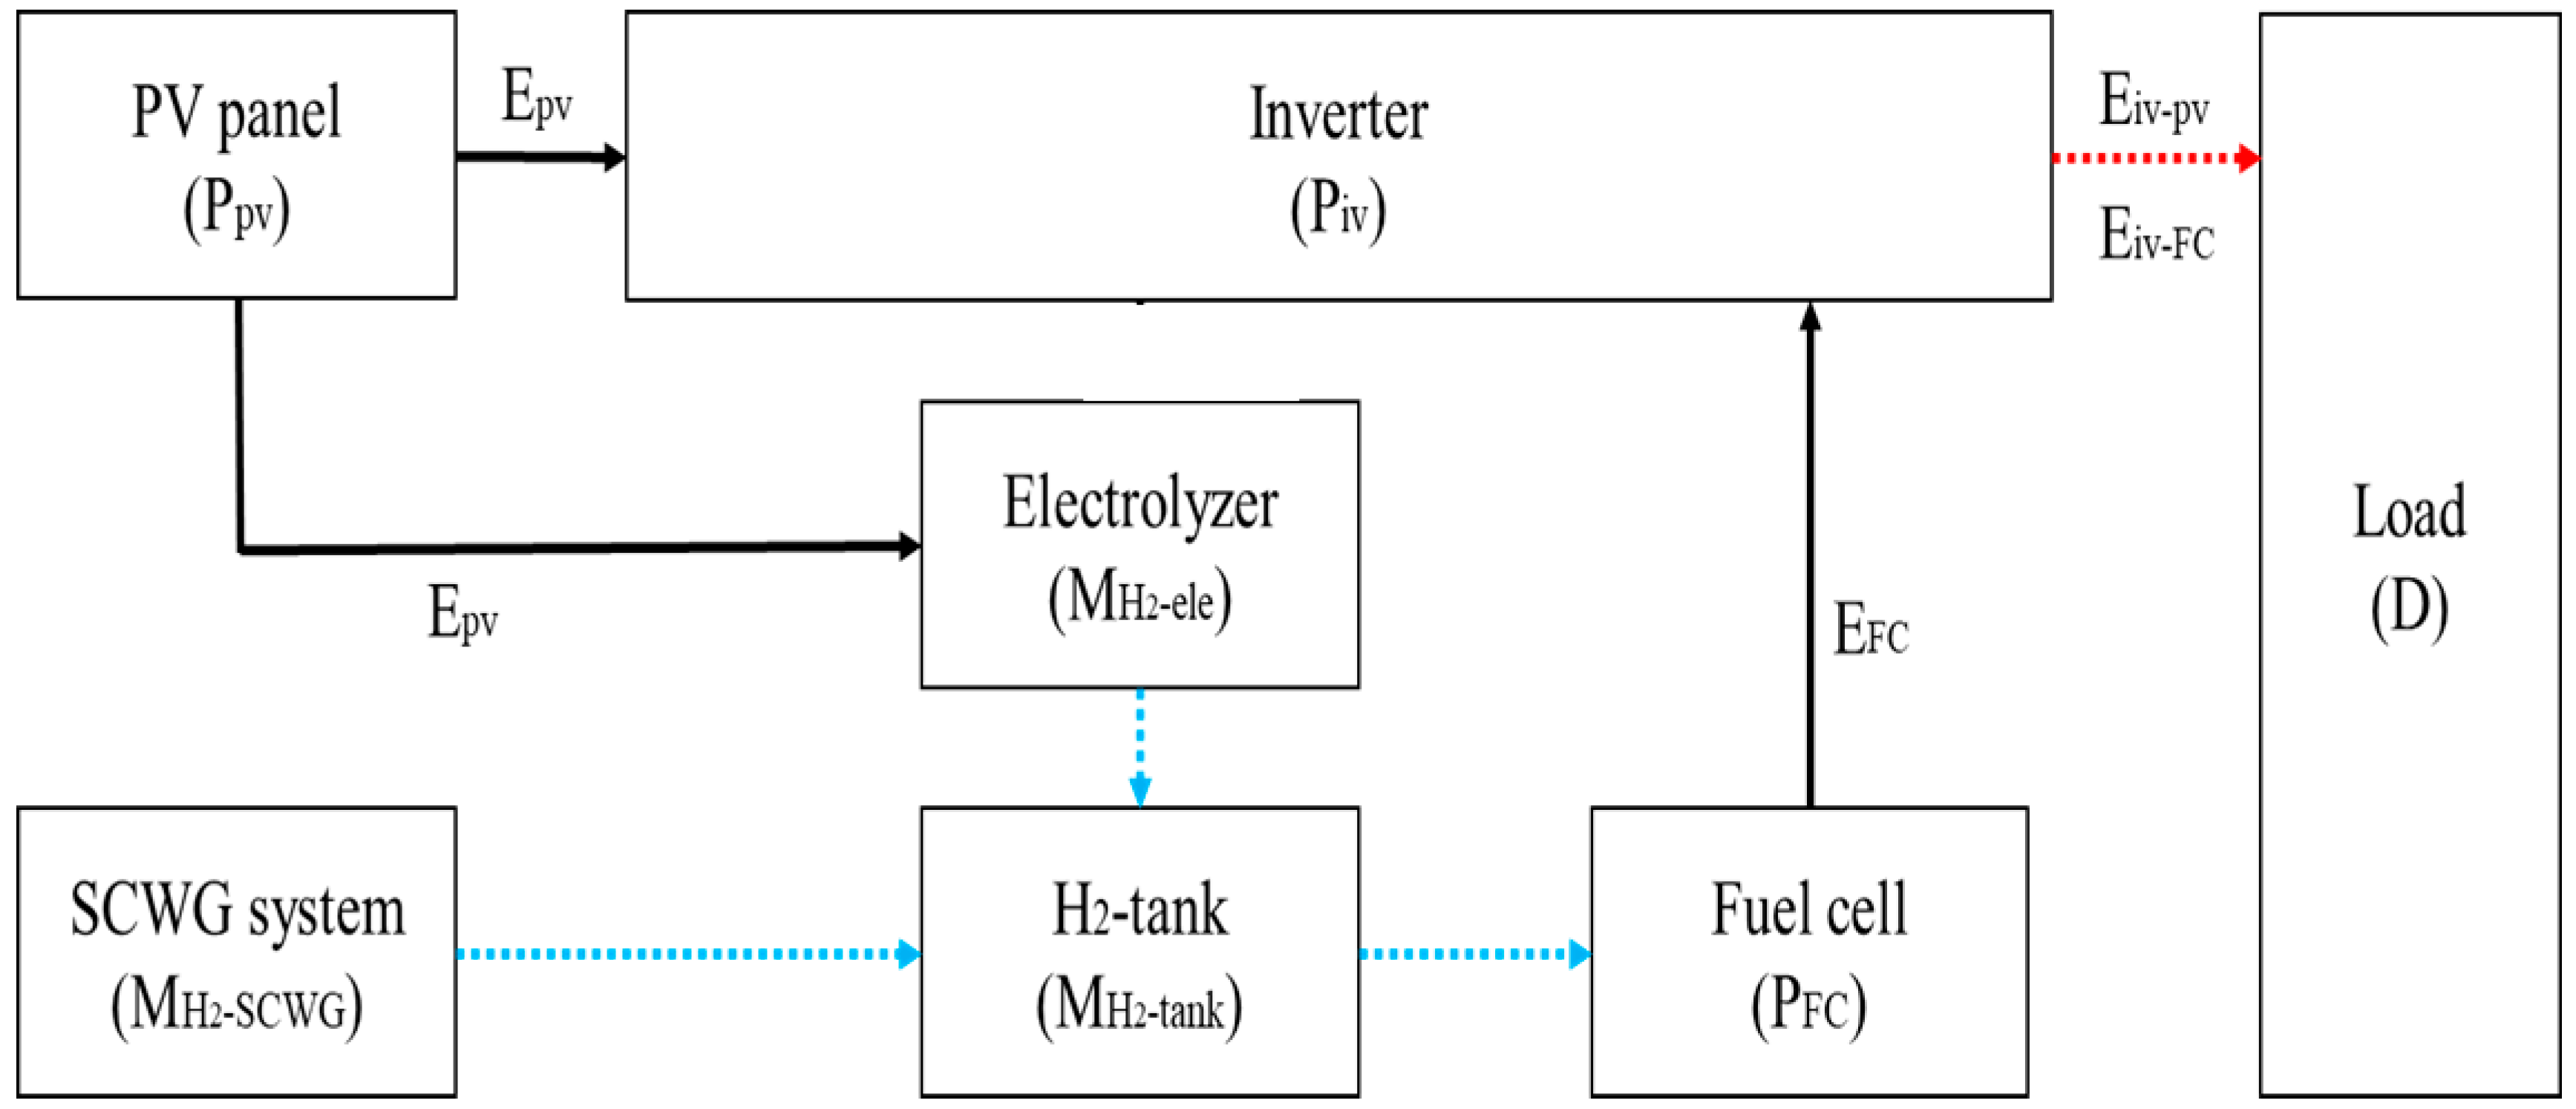
2. Simulation Model
2.1. PV Panel
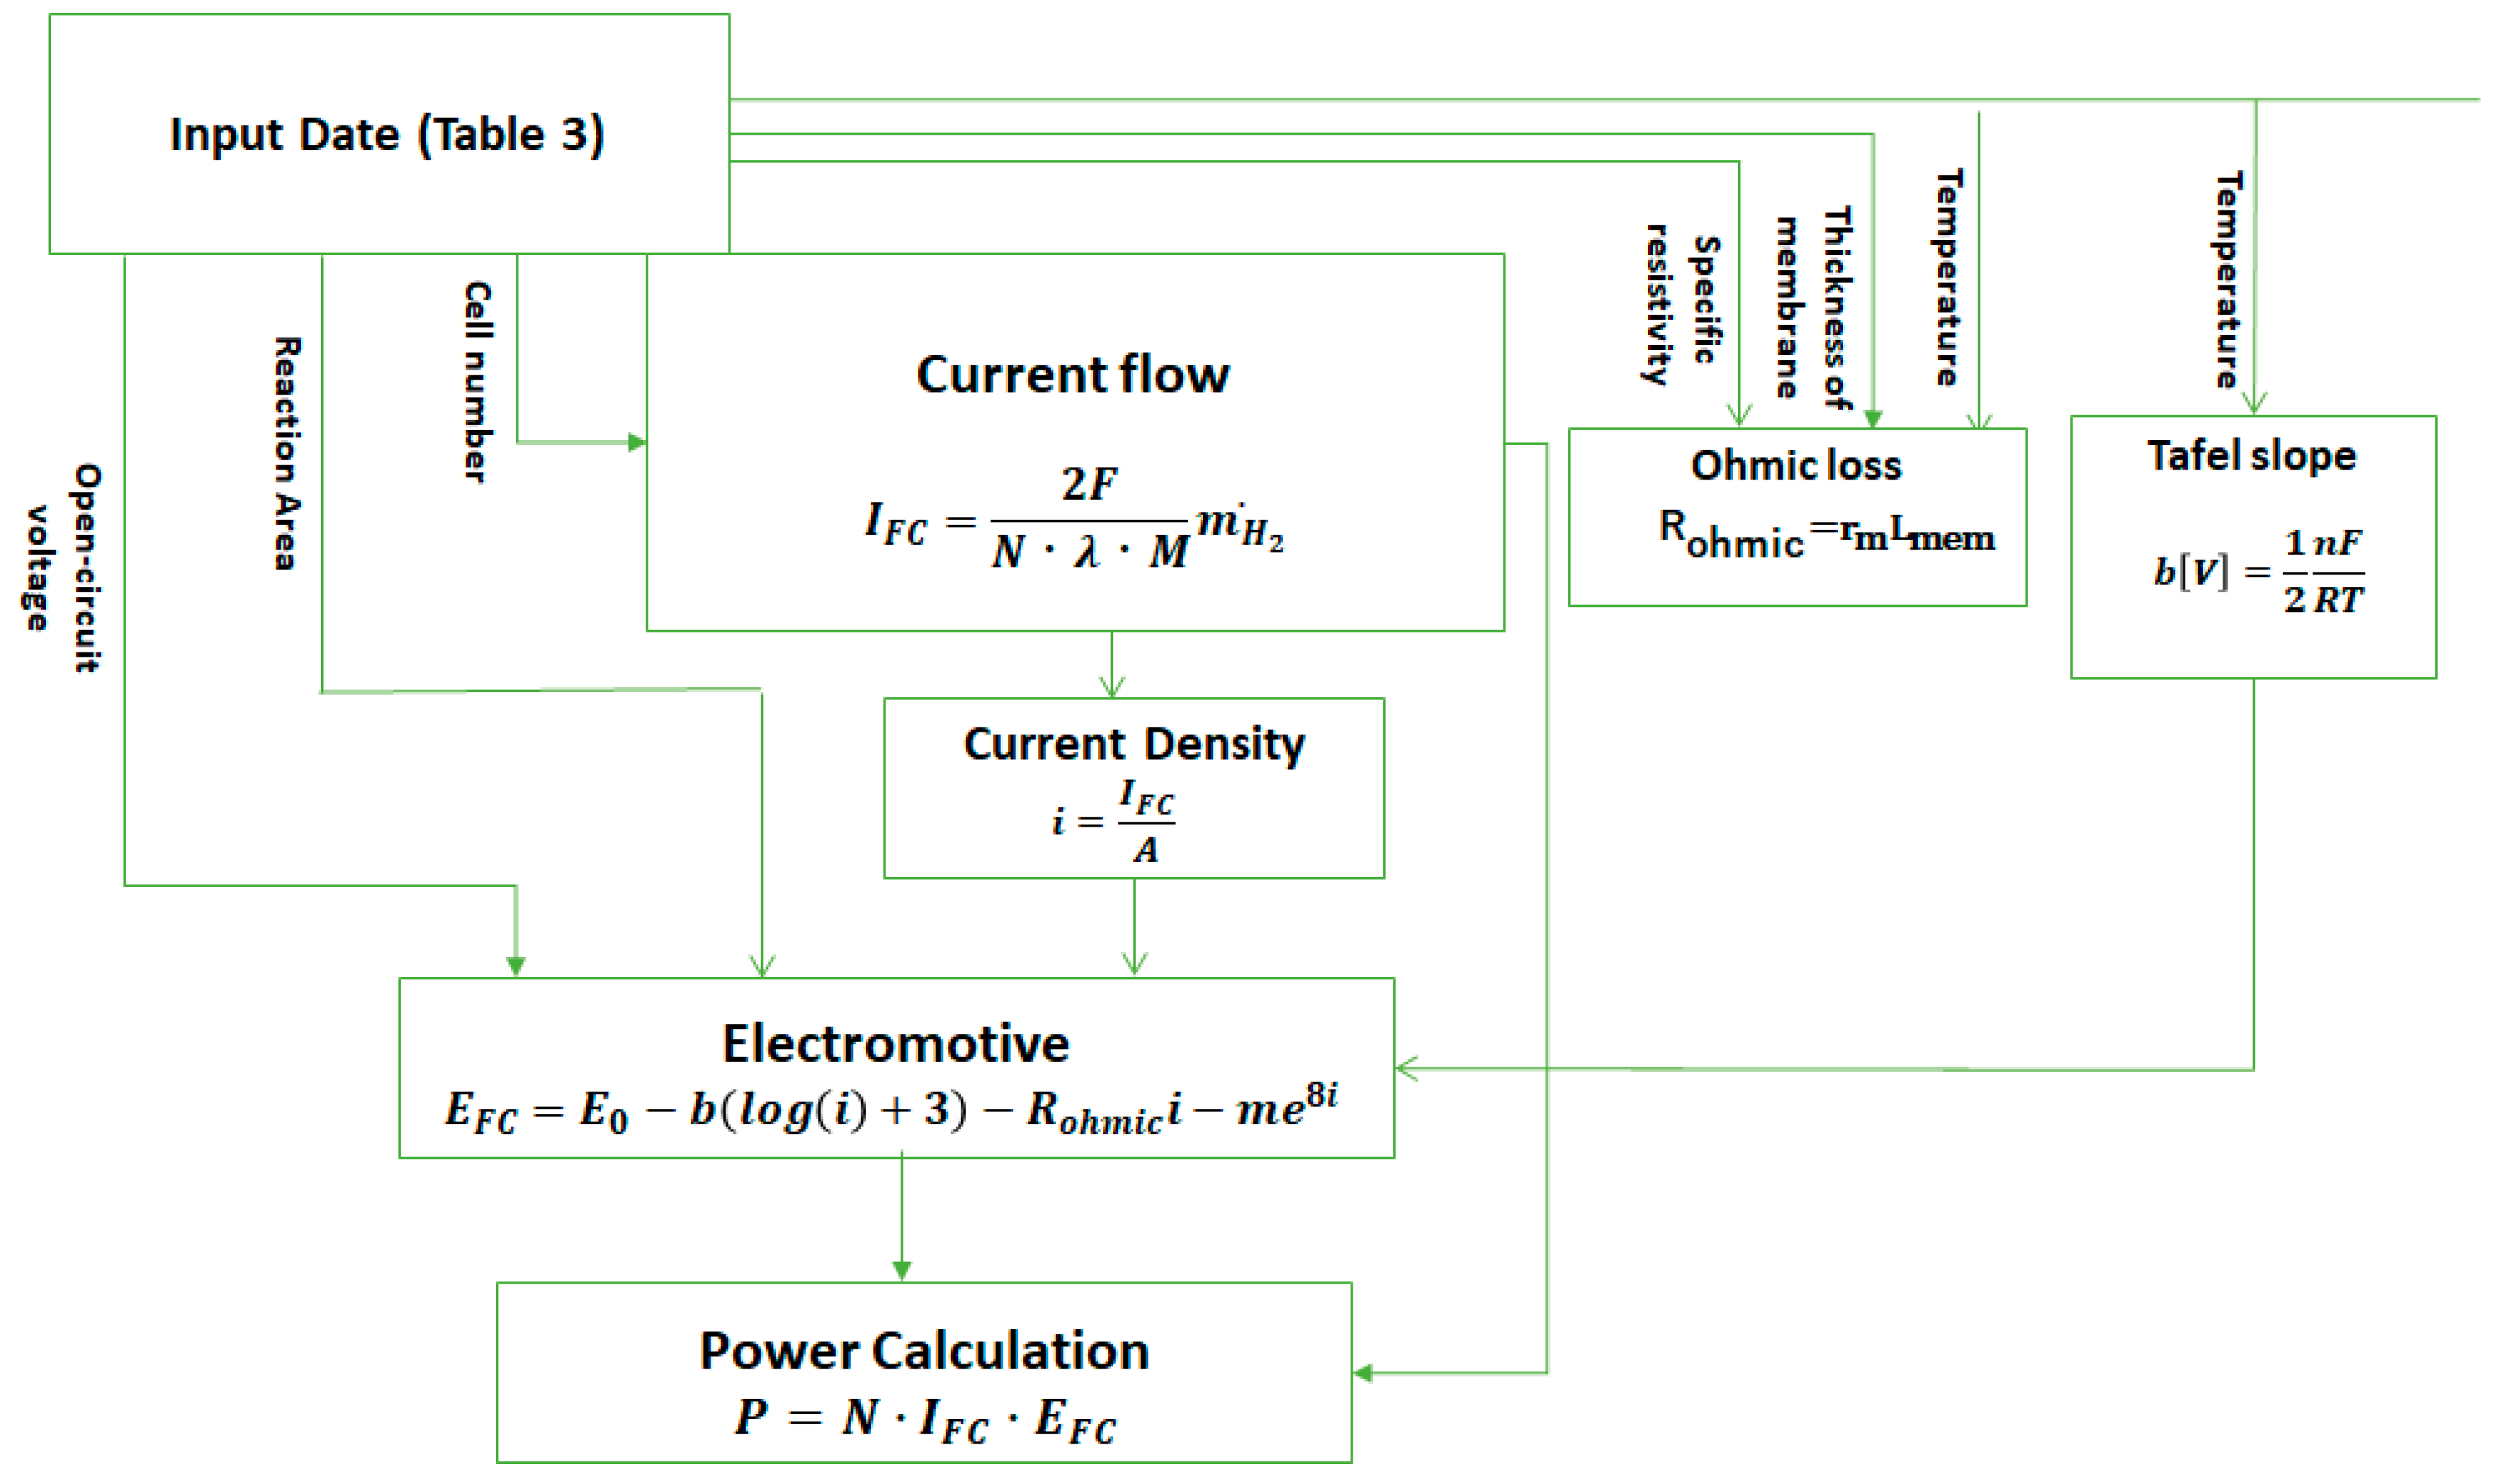
2.2. Fuel Cell
2.3. Electrolyzer
2.4. Hydrogen Tank
2.5. SCWG
3. Design of the Proposed HRES beyond Economic Optimization
3.1. Optimization Problem
3.1.1. Off-Grid Operation Mode
3.1.2. Grid-Tied Operation Mode
3.2. Demand Constraint
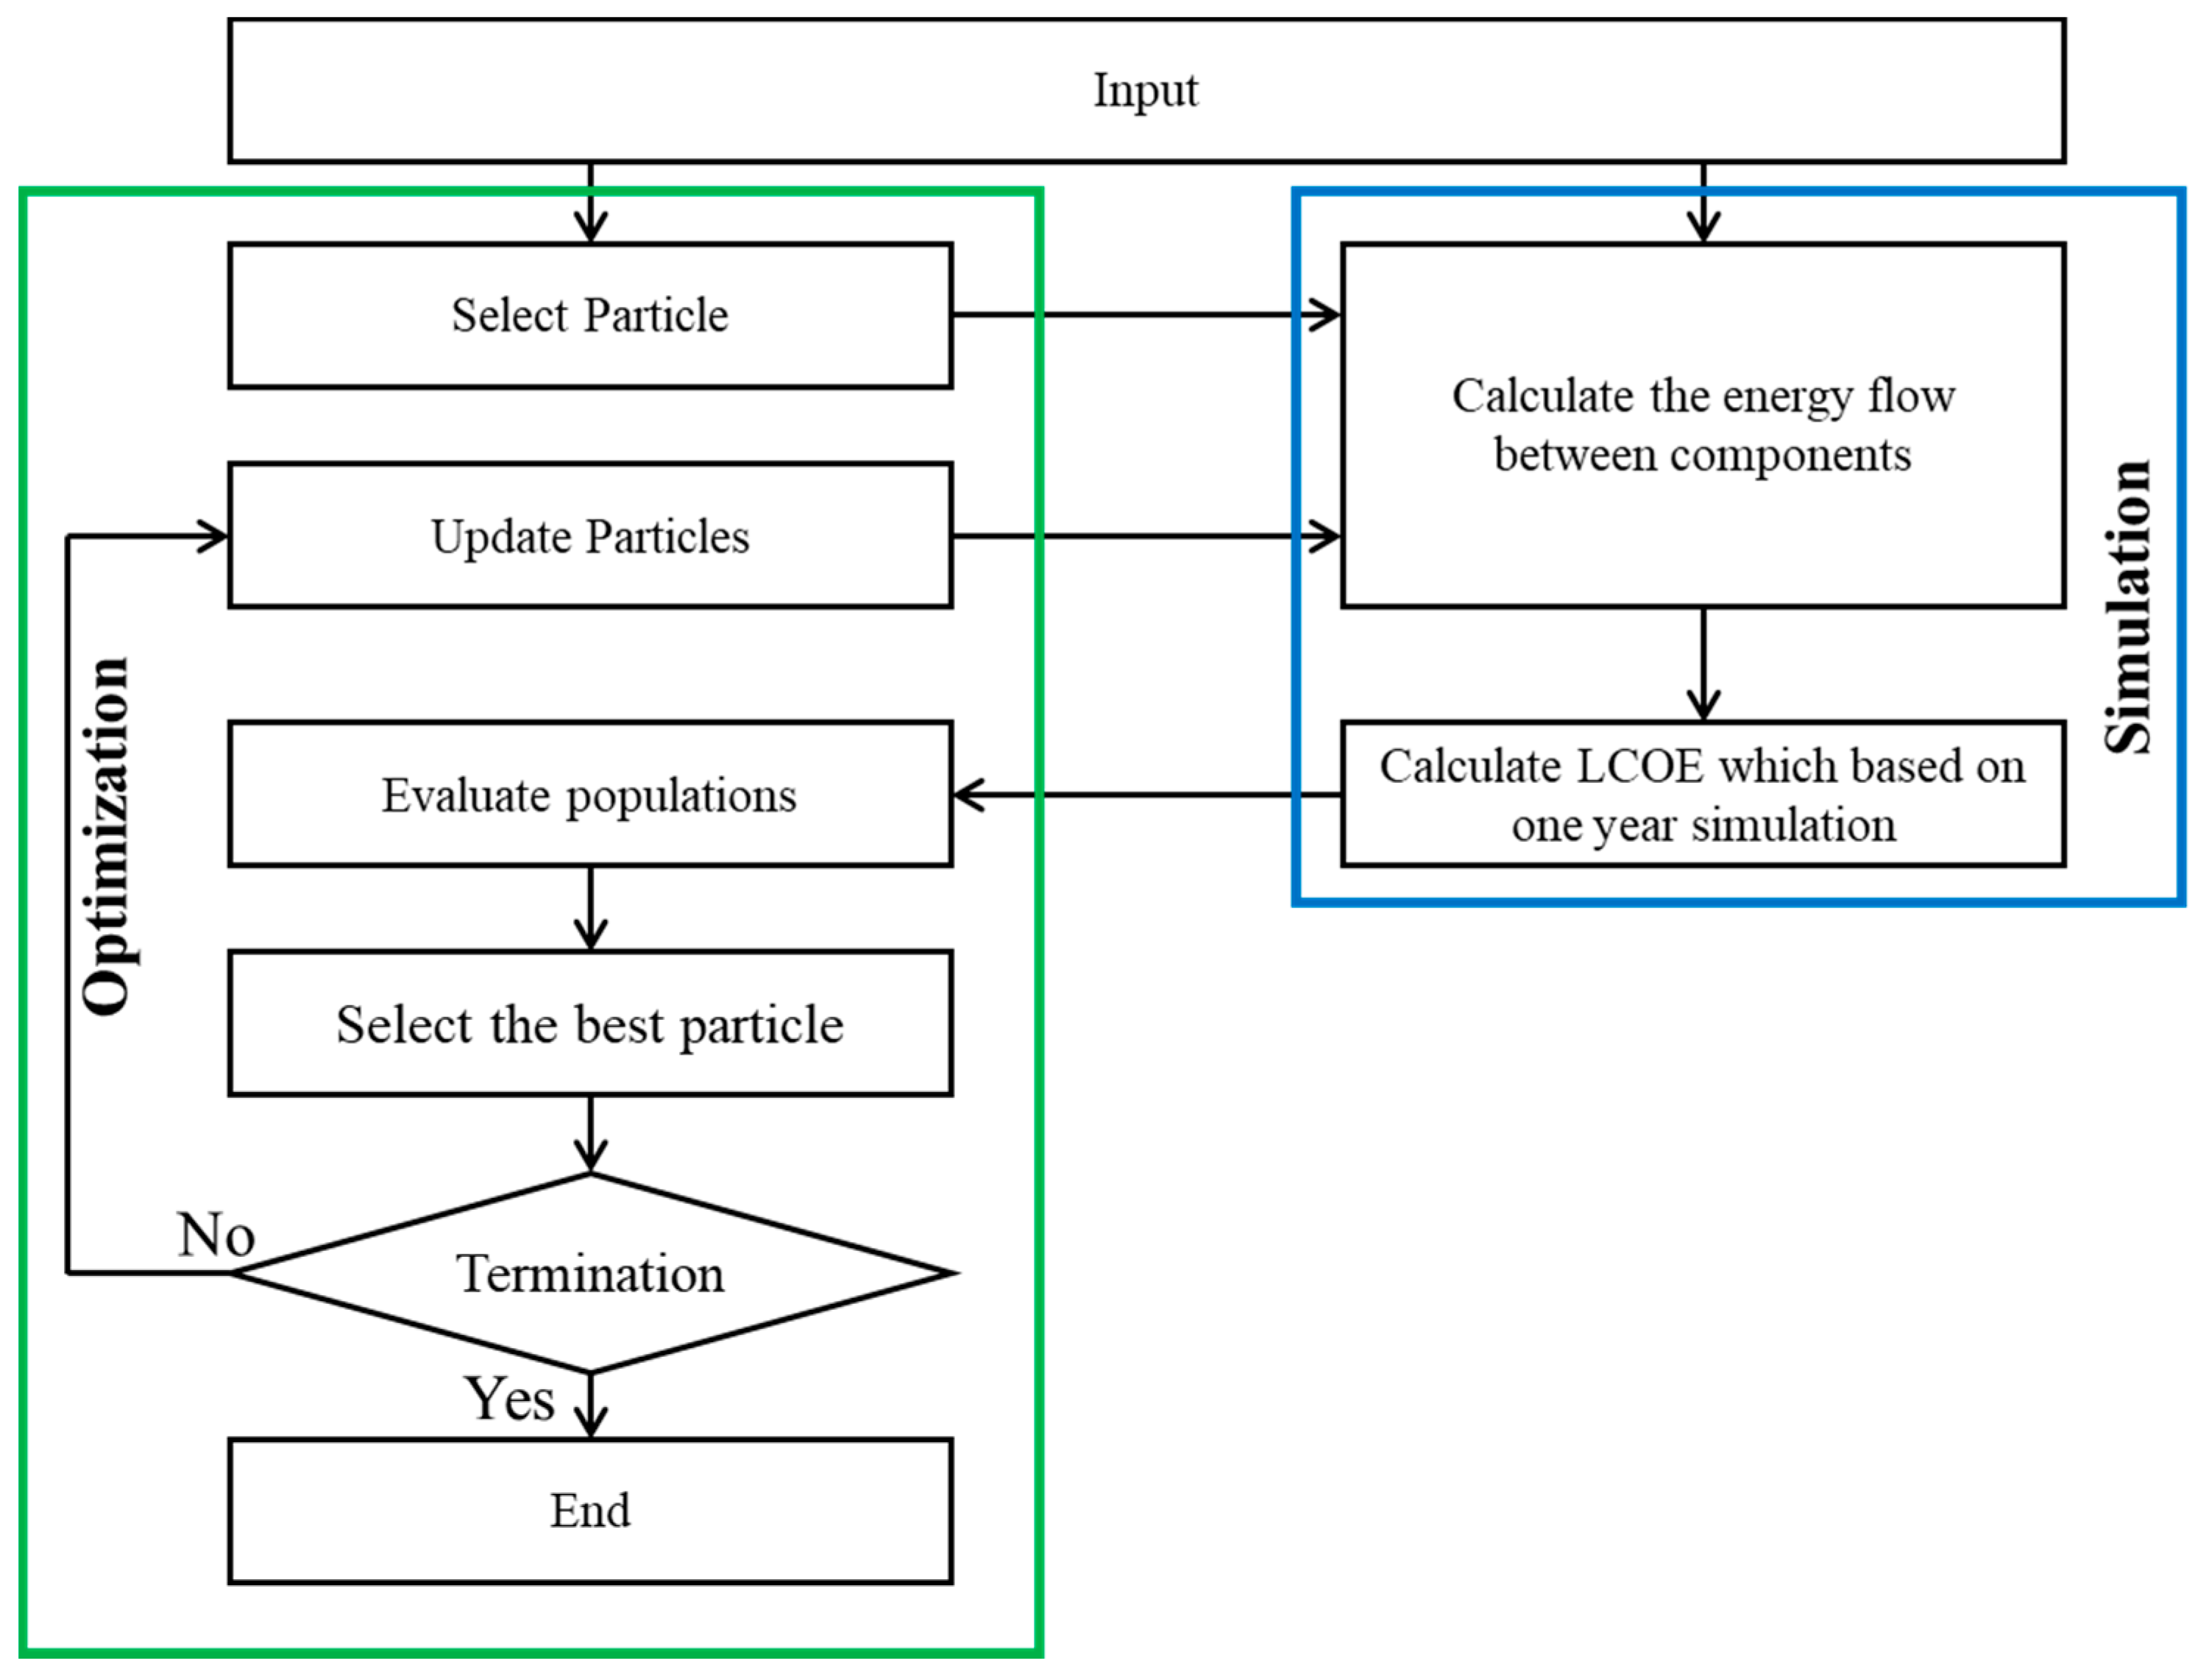
3.3. Solving Method
4. Results and Discussion
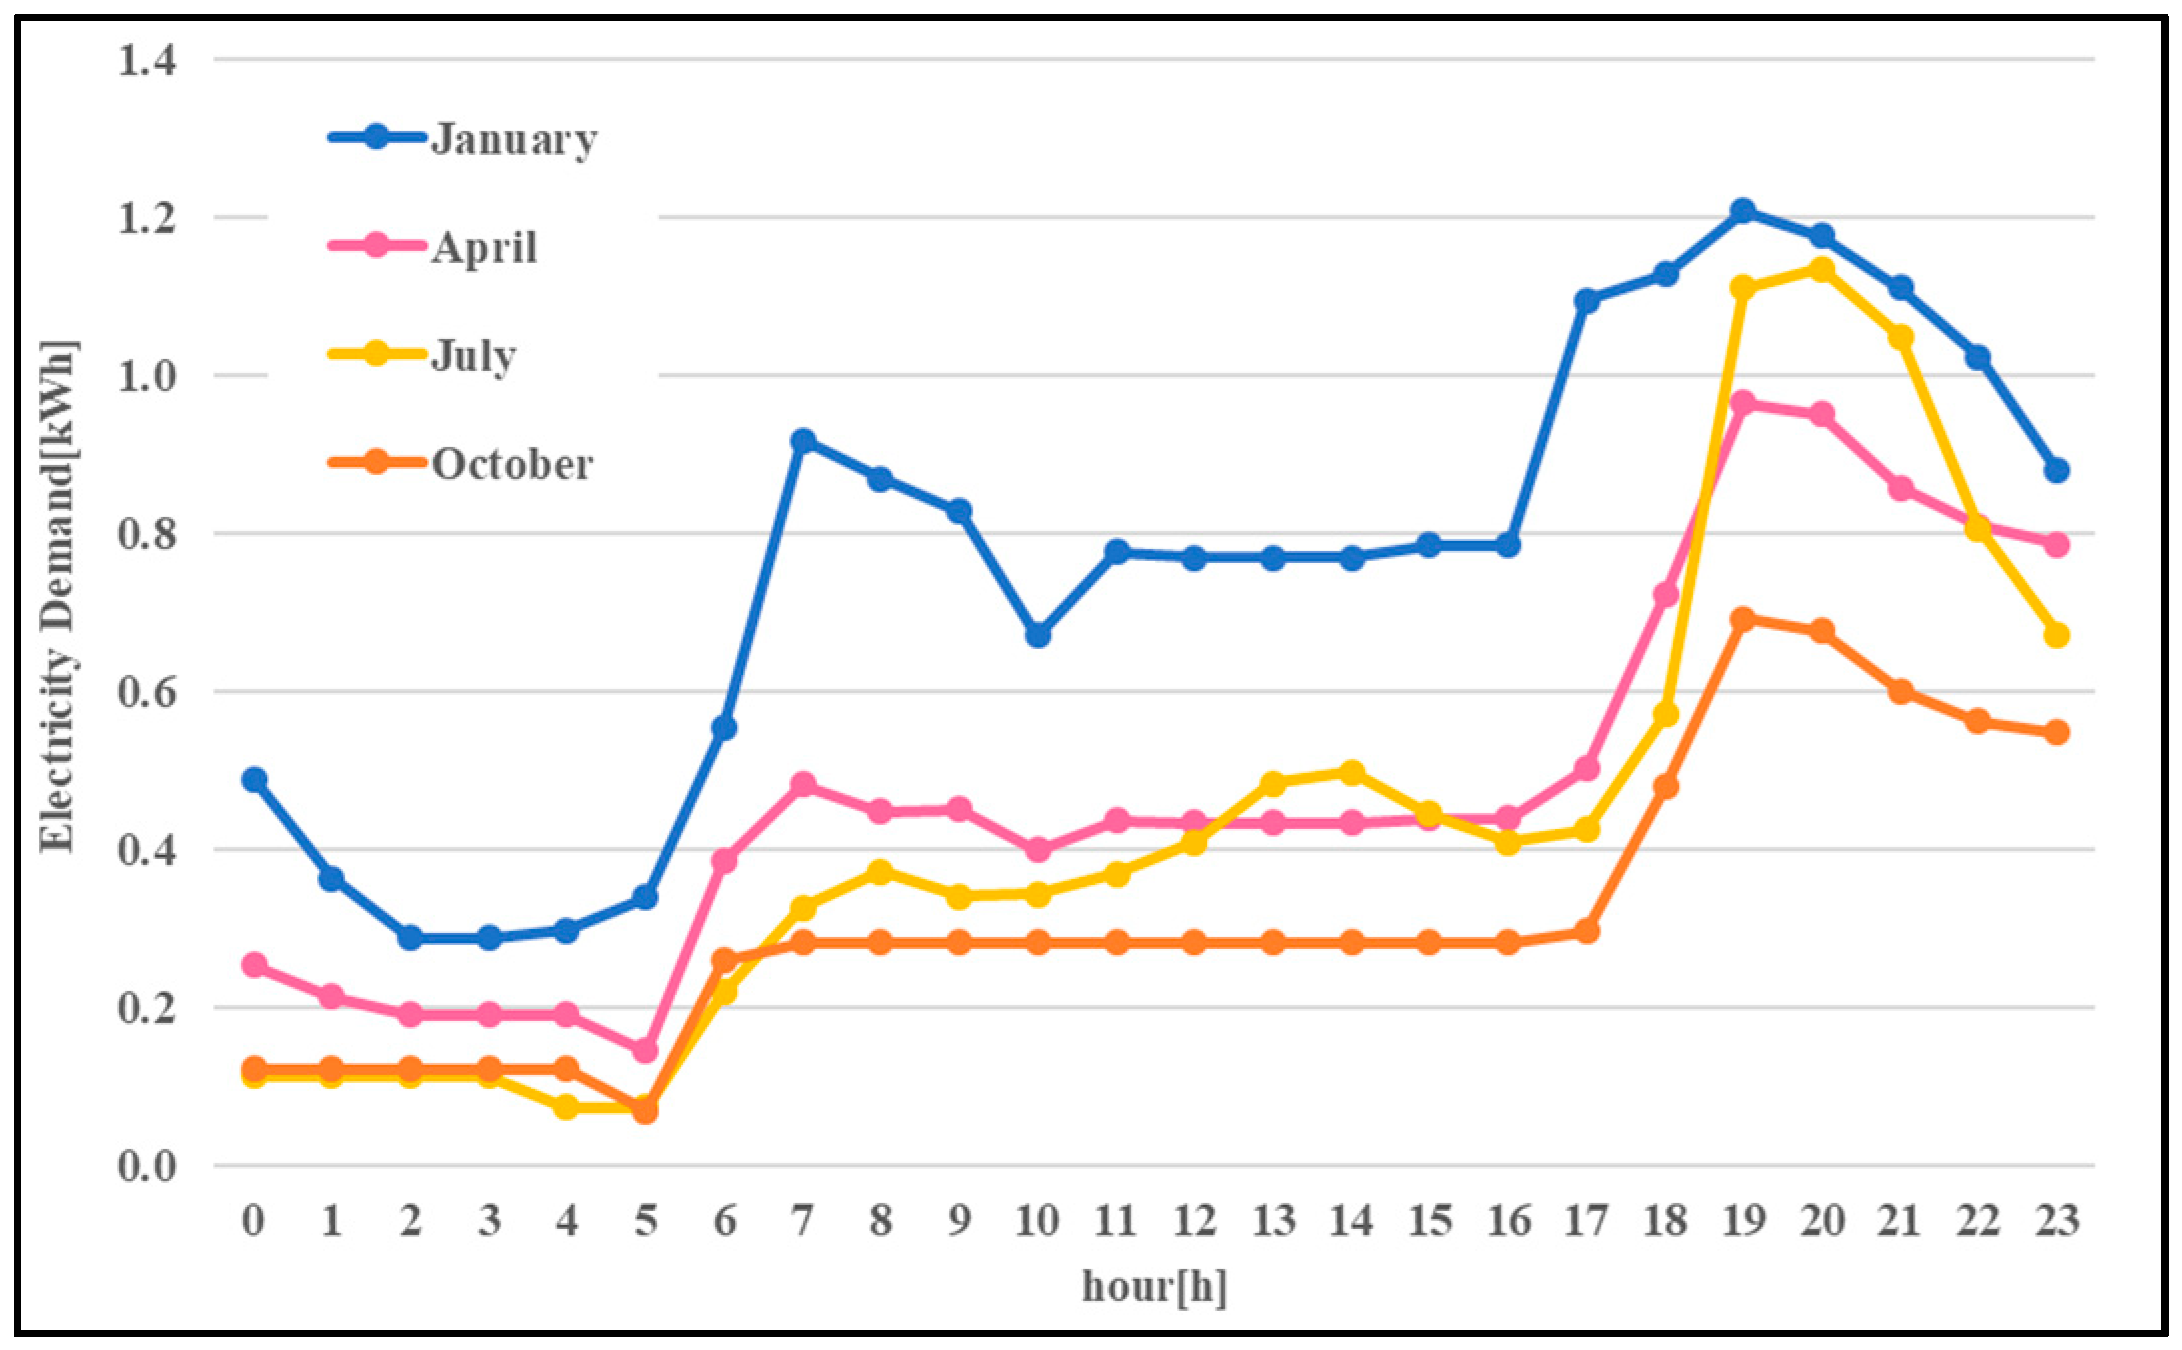
4.1. Case Study
4.2. Cost Analysis of the HRES
4.3. Scenario Analysis
4.3.1. Scenario 1: Off-Grid System with Limited Biomass Feedstock
4.3.2. Scenario 2: Grid-Tied System Considering the FiT Scheme
5. Conclusions
Author Contributions
Funding
Acknowledgments
Conflicts of Interest
References
- McLellan, B.C.; Zhang, Q.; Utama, N.A.; Farzaneh, H.; Ishihara, K.N. Analysis of Japan’s post-Fukushima energy strategy. Energy Strategy Rev. 2013, 2, 190–198. [Google Scholar] [CrossRef] [Green Version]
- Esteban, M.; Portugal-Pereira, J.; Mclellan, B.C.; Bricker, J.; Farzaneh, H.; Djalilova, N.; Ishihara, K.N.; Takagi, H.; Roeber, V. 100% renewable energy system in Japan: Smoothening and ancillary services. Appl. Energy 2018, 224, 698–707. [Google Scholar] [CrossRef] [Green Version]
- Farzaneh, H. Devising a Clean Energy Strategy for Asian Cities; Springer: Berlin/Heidelberg, Germany, 2018. [Google Scholar]
- Elliott, D.C. Catalytic hydrothermal gasification of biomass. Biofuels Bioprod. Biorefining 2008, 2, 254–265. [Google Scholar] [CrossRef]
- Jessop, P.G.; Ikariya, T.; Noyori, R. Homogeneous catalysis in supercritical fluids. Chem. Rev. 1999, 99, 475–494. [Google Scholar] [CrossRef] [PubMed]
- Modell, M. Reforming of glucose and wood at critical conditions of water. Mech. Eng. 1977, 99, 108. [Google Scholar]
- Savage, P.E. A perspective on catalysis in sub- and supercritical water. J. Supercrit. Fluids 2009, 47, 407–414. [Google Scholar] [CrossRef]
- Reddy, S.N.; Nanda, S.; Dalai, A.K.; Kozinski, J.A. Supercritical water gasification of biomass for hydrogen production. Int. J. Hydrogen Energy 2014, 39, 6912–6926. [Google Scholar] [CrossRef]
- Farzaneh, H. Design of a hybrid renewable energy system based on supercritical water gasification of biomass for off-grid power supply in Fukushima. Energies 2019, 12, 2708. [Google Scholar] [CrossRef] [Green Version]
- Chang, P.; Hsu, C.; Hsiung, C.; Lin, C. Constructing an innovative bio-hydrogen integrated renewable energy system. Int. J. Hydrogen Energy 2013, 38, 15660–15669. [Google Scholar] [CrossRef]
- Sharafi, M.; ELMekkawy, T.Y. Multi-objective optimal design of hybrid renewable energy systems using PSO-simulation based approach. Renew. Energy 2014, 68, 67–79. [Google Scholar] [CrossRef]
- Sen, R.; Bhattacharyya, S.C. Off-grid electricity generation with renewable energy technologies in India: An application of HOMER. Renew. Energy 2014, 62, 388–398. [Google Scholar] [CrossRef]
- Mohammed, O.H.; Amirat, Y.; Benbouzid, M. Particle swarm optimization of a hybrid wind/Tidal/PV/Battery energy system. Application to a remote area in bretagne, France. Energy Procedia 2019, 162, 87–96. [Google Scholar] [CrossRef]
- Giannakoudis, G.; Papadopoulos, A.I.; Seferlis, P.; Voutetakis, S. Optimum design and operation under uncertainty of power systems using renewable energy sources and hydrogen storage. Int. J. Hydrogen Energy 2010, 35, 872–891. [Google Scholar] [CrossRef]
- Dufo-López, R.; Bernal-Agustín, J.L. Multi-objective design of PV–wind–diesel–hydrogen–battery systems. Renew. Energy 2008, 33, 2559–2572. [Google Scholar] [CrossRef]
- Abedi, S.; Alimardani, A.; Gharehpetian, G.; Riahy, G.; Hosseinian, S. A comprehensive method for optimal power management and design of hybrid RES-based autonomous energy systems. Renew. Sustain. Energy Rev. 2012, 16, 1577–1587. [Google Scholar] [CrossRef]
- Amer, M.; Namaane, A.; M’Sirdi, N. Optimization of hybrid renewable energy systems (HRES) using PSO for cost reduction. Energy Procedia 2013, 42, 318–327. [Google Scholar] [CrossRef] [Green Version]
- Sawle, Y.; Gupta, S.; Bohre, A.K. Optimal sizing of standalone PV/wind/biomass hybrid energy system using GA and PSO optimization technique. Energy Procedia 2017, 117, 690–698. [Google Scholar] [CrossRef]
- Ozgoli, H.A.; Ghadamian, H.; Farzaneh, H. Energy efficiency improvement analysis considering environmental aspects in regard to biomass gasification PSOFC/GT power generation system. Procedia Environ. Sci. 2013, 17, 831–841. [Google Scholar]
- Ghadamian, H.; Hamidi, A.A.; Farzaneh, H.; Ozgoli, H.A. Thermo-economic analysis of absorption air cooling system for pressurized solid oxide fuel cell/gas turbine cycle. J. Renew. Sustain. Energy 2012, 4, 043115. [Google Scholar] [CrossRef]
- Rokni, M. Biomass gasification integrated with a solid oxide fuel cell and stirling engine. Energy 2014, 77, 6–18. [Google Scholar] [CrossRef]
- Doherty, W.; Reynolds, A.; Kennedy, D. Computer simulation of a biomass gasification-solid oxide fuel cell power system using aspen plus. Energy 2010, 35, 4545–4555. [Google Scholar] [CrossRef] [Green Version]
- Toonssen, R.; Aravind, P.V.; Smit, G.; Woudstra, N.; Verkooijen, A.H. System study on hydrothermal gasification combined with a hybrid solid oxide fuel cell gas turbine. Fuel Cells 2010, 10, 643–653. [Google Scholar] [CrossRef] [Green Version]
- Farzaneh, H.; Ghalee, I.; Dashti, M. Simulation of a multi-functional energy system for Cogeneration of steam, power and hydrogen in a coke making plant. Procedia Environ. Sci. 2013, 17, 711–718. [Google Scholar] [CrossRef] [Green Version]
- Moghadasi, M.; Ghadamian, H.; Farzaneh, H.; Moghadasi, M.; Ozgoli, H.A. CO2 capture technical analysis for gas turbine flue gases with complementary cycle assistance including nonlinear mathematical modeling. Procedia Environ. Sci. 2013, 17, 648–657. [Google Scholar] [CrossRef] [Green Version]
- Rosa, A.V. Fundamentals of Renewable Energy Processes; Academic Press: Cambridge, MA, USA, 2009. [Google Scholar]
- Panasonic Panasonic Photovoltaic Module HITVBHN245SJ25VBHN240SJ25. Available online: https://panasonic.net/lifesolutions/solar/download/pdf/VBHN245_240SJ25_ol_190226.pdf (accessed on 14 January 2020).
- Das, B.K.; Hoque, N.; Mandal, S.; Pal, T.K.; Raihan, M.A. A techno-economic feasibility of a stand-alone hybrid power generation for remote area application in Bangladesh. Energy 2017, 134, 775–788. [Google Scholar] [CrossRef]
- Al-Waeli, A.H.A.; Kazem, H.A.; Chaichan, M.T.; Sopian, K. Photovoltaic/Thermal (PV/T) Systems; Springer–International Publisher Science, Technology, Medicine: Cham, Switzerland, 2019. [Google Scholar]
- O’Hayre, R.; Cha, S.; Colella, W.; Prinz, F.B. Fuel Cell Fundamentals; John Wiley & Sons: Hoboken, NJ, USA, 2016. [Google Scholar]
- Laoun, B.; Naceur, M.W.; Khellaf, A.; Kannan, A.M. Global sensitivity analysis of proton exchange membrane fuel cell model. Int. J. Hydrogen Energy 2016, 41, 9521–9528. [Google Scholar] [CrossRef]
- Kashefi Kaviani, A.; Riahy, G.; Kouhsari, S. Optimal design of a reliable hydrogen-based stand-alone wind/PV generating system, considering component outages. Renew. Energy 2009, 34, 2380–2390. [Google Scholar] [CrossRef]
- Castello, D.; Fiori, L. Supercritical water gasification of biomass: A stoichiometric thermodynamic model. Int. J. Hydrogen Energy 2015, 40, 6771–6781. [Google Scholar] [CrossRef]
- The Electric Power Industry in Japan. (2020). Retrieved from Japan Electric Power Information Center Website. Available online: https://www.jepic.or.jp/pub/pdf/epijJepic2020.pdf (accessed on 14 January 2020).
- Farzaneh, H. Energy Systems Modeling: Principles and Applications; Springer: Berlin/Heidelberg, Germany, 2019. [Google Scholar]
- Farzaneh, H.; McLellan, B.; Ishihara, K.N. Toward a CO2zero emissions energy system in the Middle East region. Int. J. Green Energy 2014, 13, 682–694. [Google Scholar] [CrossRef]
- Farzaneh, H.; Doll, C.N.; Puppim de Oliveira, J.A. An integrated supply-demand model for the optimization of energy flow in the urban system. J. Clean. Prod. 2016, 114, 269–285. [Google Scholar] [CrossRef]
- Parsopoulos, K.; Vrahatis, M. Particle swarm optimization method for constrained optimization problem. In Intelligent Technologies—Theory and Applications: New Trends in Intelligent Technologies; IOS Press (Frontiers in Artificial Intelligence and Applications): Fairfax, VA, USA, 2002; Volume 76, pp. 214–220. [Google Scholar]
- Zhang, W.J.; Xie, X.F.; Bi, D.C. Handling boundary constraints for numerical optimization by particle swarm flying in periodic search space. In Proceedings of the 2004 Congress on Evolutionary Computation, Portland, OR, USA, 19–23 June 2004; Volume 2, pp. 2307–2311. [Google Scholar]
- Yoshida, Y.; Farzaneh, H. Optimal design of a stand-alone residential hybrid Microgrid system for enhancing renewable energy deployment in Japan. Energies 2020, 13, 1737. [Google Scholar] [CrossRef] [Green Version]
- Japan Agency for National Resource and Energy. Available online: https://www.enecho.meti.go.jp/index.html (accessed on 14 December 2019).
- Japan Meteorological Agency. Available online: https://www.data.jma.go.jp/obd/stats/etrn/view/monthly_s3_en.php?block_no=47401&view=11 (accessed on 14 December 2019).
- Panasonic, Panasonic Residential Catalog. Available online: https://sumai.panasonic.jp/catalog/solarsystem.html (accessed on 10 December 2018).
- Mohd, A.M.R.; Nasrudin, A.R.; Che, H.S.; Ohgaki, H.; Farzaneh, H.; Wallace, S.H.W.; Lai, C.H. Optimal solar powered system for long houses in sarawak by using HOMER tool. Asean Eng. J. 2019, 9, 2586–9159. [Google Scholar]
- Hydrogen and Fuel Cellsin Japan. (2019). Retrieved from EU-Japan Centre for Industrial Cooperation Website. Available online: https://www.eu-japan.eu/sites/default/files/publications/docs/hydrogen_and_fuel_cells_in_japan.pdf (accessed on 14 January 2020).
- Lu, Y.; Zhao, L.; Guo, L. Technical and economic evaluation of solar hydrogen production by supercritical water gasification of biomass in China. Int. J. Hydrogen Energy 2011, 36, 14349–14359. [Google Scholar] [CrossRef]
- Hydrogen Production Tech Team Roadmap. (2017). Department of Energy. Available online: https://www.energy.gov/sites/prod/files/2017/11/f46/HPTT%20Roadmap%20FY17%20Final_Nov%202017.pdf (accessed on 14 January 2020).
- Japan Costumer Affairs Agency. (5 April 2020). Policy Planning. Available online: https://www.caa.go.jp/en/policy/consumer_policy (accessed on 14 January 2020).


| System Components | Objective Function | Method | ||||||||
|---|---|---|---|---|---|---|---|---|---|---|
| WT | PV | FC | Biomass | Battery | H2 Tank | Electrolyzer | Diesel Other | Ref | ||
| ✔ | ✔ | ✔ | ✔ | ✔ | ✔ | ✔ | Total Cost/CO2 Emission/unmet load | PSO 1 | [12] | |
| ✔ | ✔ | ✔ | ✔ | ✔ | ✔ | ✔ | total cost | SA 2 | [13] | |
| ✔ | ✔ | ✔ | ✔ | ✔ | ✔ | ✔ | Total cost/CO2 Emission/unmet load | GA 3 | [14] | |
| ✔ | ✔ | ✔ | ✔ | ✔ | ✔ | Total cost/CO2 Emissions/unmet load | FL 4 | [15] | ||
| ✔ | ✔ | ✔ | ✔ | ✔ | LCOE | LP 5 | [16] | |||
| ✔ | ✔ | ✔ | ✔ | ✔ | ✔ | Annualized cost | GA | [17] | ||
| ✔ | ✔ | ✔ | ✔ | ✔ | ✔ | ✔ | Total cost | GA | [18] | |
| Parameter | Symbol | Value |
|---|---|---|
| Temperature coefficient (%/deg) | −0.258 | |
| Maximum efficiency | 0.217 | |
| Rated power (W) | 325 | |
| Nominal operation cell temperature (℃) | 44 | |
| Nominal operation ambient temperature (℃) | 20 | |
| Incident radiation under test condition (W/m2) | 1000 | |
| Derating factor | 0.9 | |
| Cell temperature under test condition (℃) | 25 |
| Parameter | Symbol | Value |
|---|---|---|
| Working temperature (°C) | T | 80 |
| Faraday’s constant | F | 96,485 |
| Reaction area (cm2) | A | 1000 |
| Number of cells | n | 82 |
| Thickness of the polymer membrane (µm) | 125 | |
| Specific resistivity | 0.1 | |
| Stoichiometry of the reaction | 1 | |
| Open-circuit voltage (V) | 1.17 | |
| Molecular mass of hydrogen | 2 |
| PV Panel (kW) | FC (kW) | Electrolyzer (kW) | Hydrogen Tank (kg) | SCWG (kg/h) |
|---|---|---|---|---|
| 8 | 1.5 | 1.5 | 5 | 1 |
| PV Panel (kW) | FC (kW) | Electrolyzer (kW) | Hydrogen Tank (kg) | SCWG (kg/h) |
|---|---|---|---|---|
| 10 | 1.5 | 1.5 | 5 | 1 |
| Scenarios | Power Mix (%) | Annual Hydrogen Production Mix (%) | Annual Biomass Consumption (kg) | Total Cost (JPY/year) | LCOE (JPY/kWh) | LCOE, Including the Annual Profit (JPY/year) | ||
|---|---|---|---|---|---|---|---|---|
| PV | FC | PV | SCWG | |||||
| Scenario 1 | 78 | 22 | 90 | 10 | 264.3 | ¥244,550 | ¥55.92 | - |
| Scenario 2 | 81 | 19 | 90 | 10 | 264.3 | ¥262,100 | ¥59.93 | ¥56.47 |
© 2020 by the authors. Licensee MDPI, Basel, Switzerland. This article is an open access article distributed under the terms and conditions of the Creative Commons Attribution (CC BY) license (http://creativecommons.org/licenses/by/4.0/).
Share and Cite
Takatsu, N.; Farzaneh, H. Techno-Economic Analysis of a Novel Hydrogen-Based Hybrid Renewable Energy System for Both Grid-Tied and Off-Grid Power Supply in Japan: The Case of Fukushima Prefecture. Appl. Sci. 2020, 10, 4061. https://doi.org/10.3390/app10124061
Takatsu N, Farzaneh H. Techno-Economic Analysis of a Novel Hydrogen-Based Hybrid Renewable Energy System for Both Grid-Tied and Off-Grid Power Supply in Japan: The Case of Fukushima Prefecture. Applied Sciences. 2020; 10(12):4061. https://doi.org/10.3390/app10124061
Chicago/Turabian StyleTakatsu, Naoto, and Hooman Farzaneh. 2020. "Techno-Economic Analysis of a Novel Hydrogen-Based Hybrid Renewable Energy System for Both Grid-Tied and Off-Grid Power Supply in Japan: The Case of Fukushima Prefecture" Applied Sciences 10, no. 12: 4061. https://doi.org/10.3390/app10124061
APA StyleTakatsu, N., & Farzaneh, H. (2020). Techno-Economic Analysis of a Novel Hydrogen-Based Hybrid Renewable Energy System for Both Grid-Tied and Off-Grid Power Supply in Japan: The Case of Fukushima Prefecture. Applied Sciences, 10(12), 4061. https://doi.org/10.3390/app10124061