Assessment of Mechanical Properties of Corroded Prestressing Strands

Abstract
1. Introduction
2. Investigation of Corrosion in External Tendons
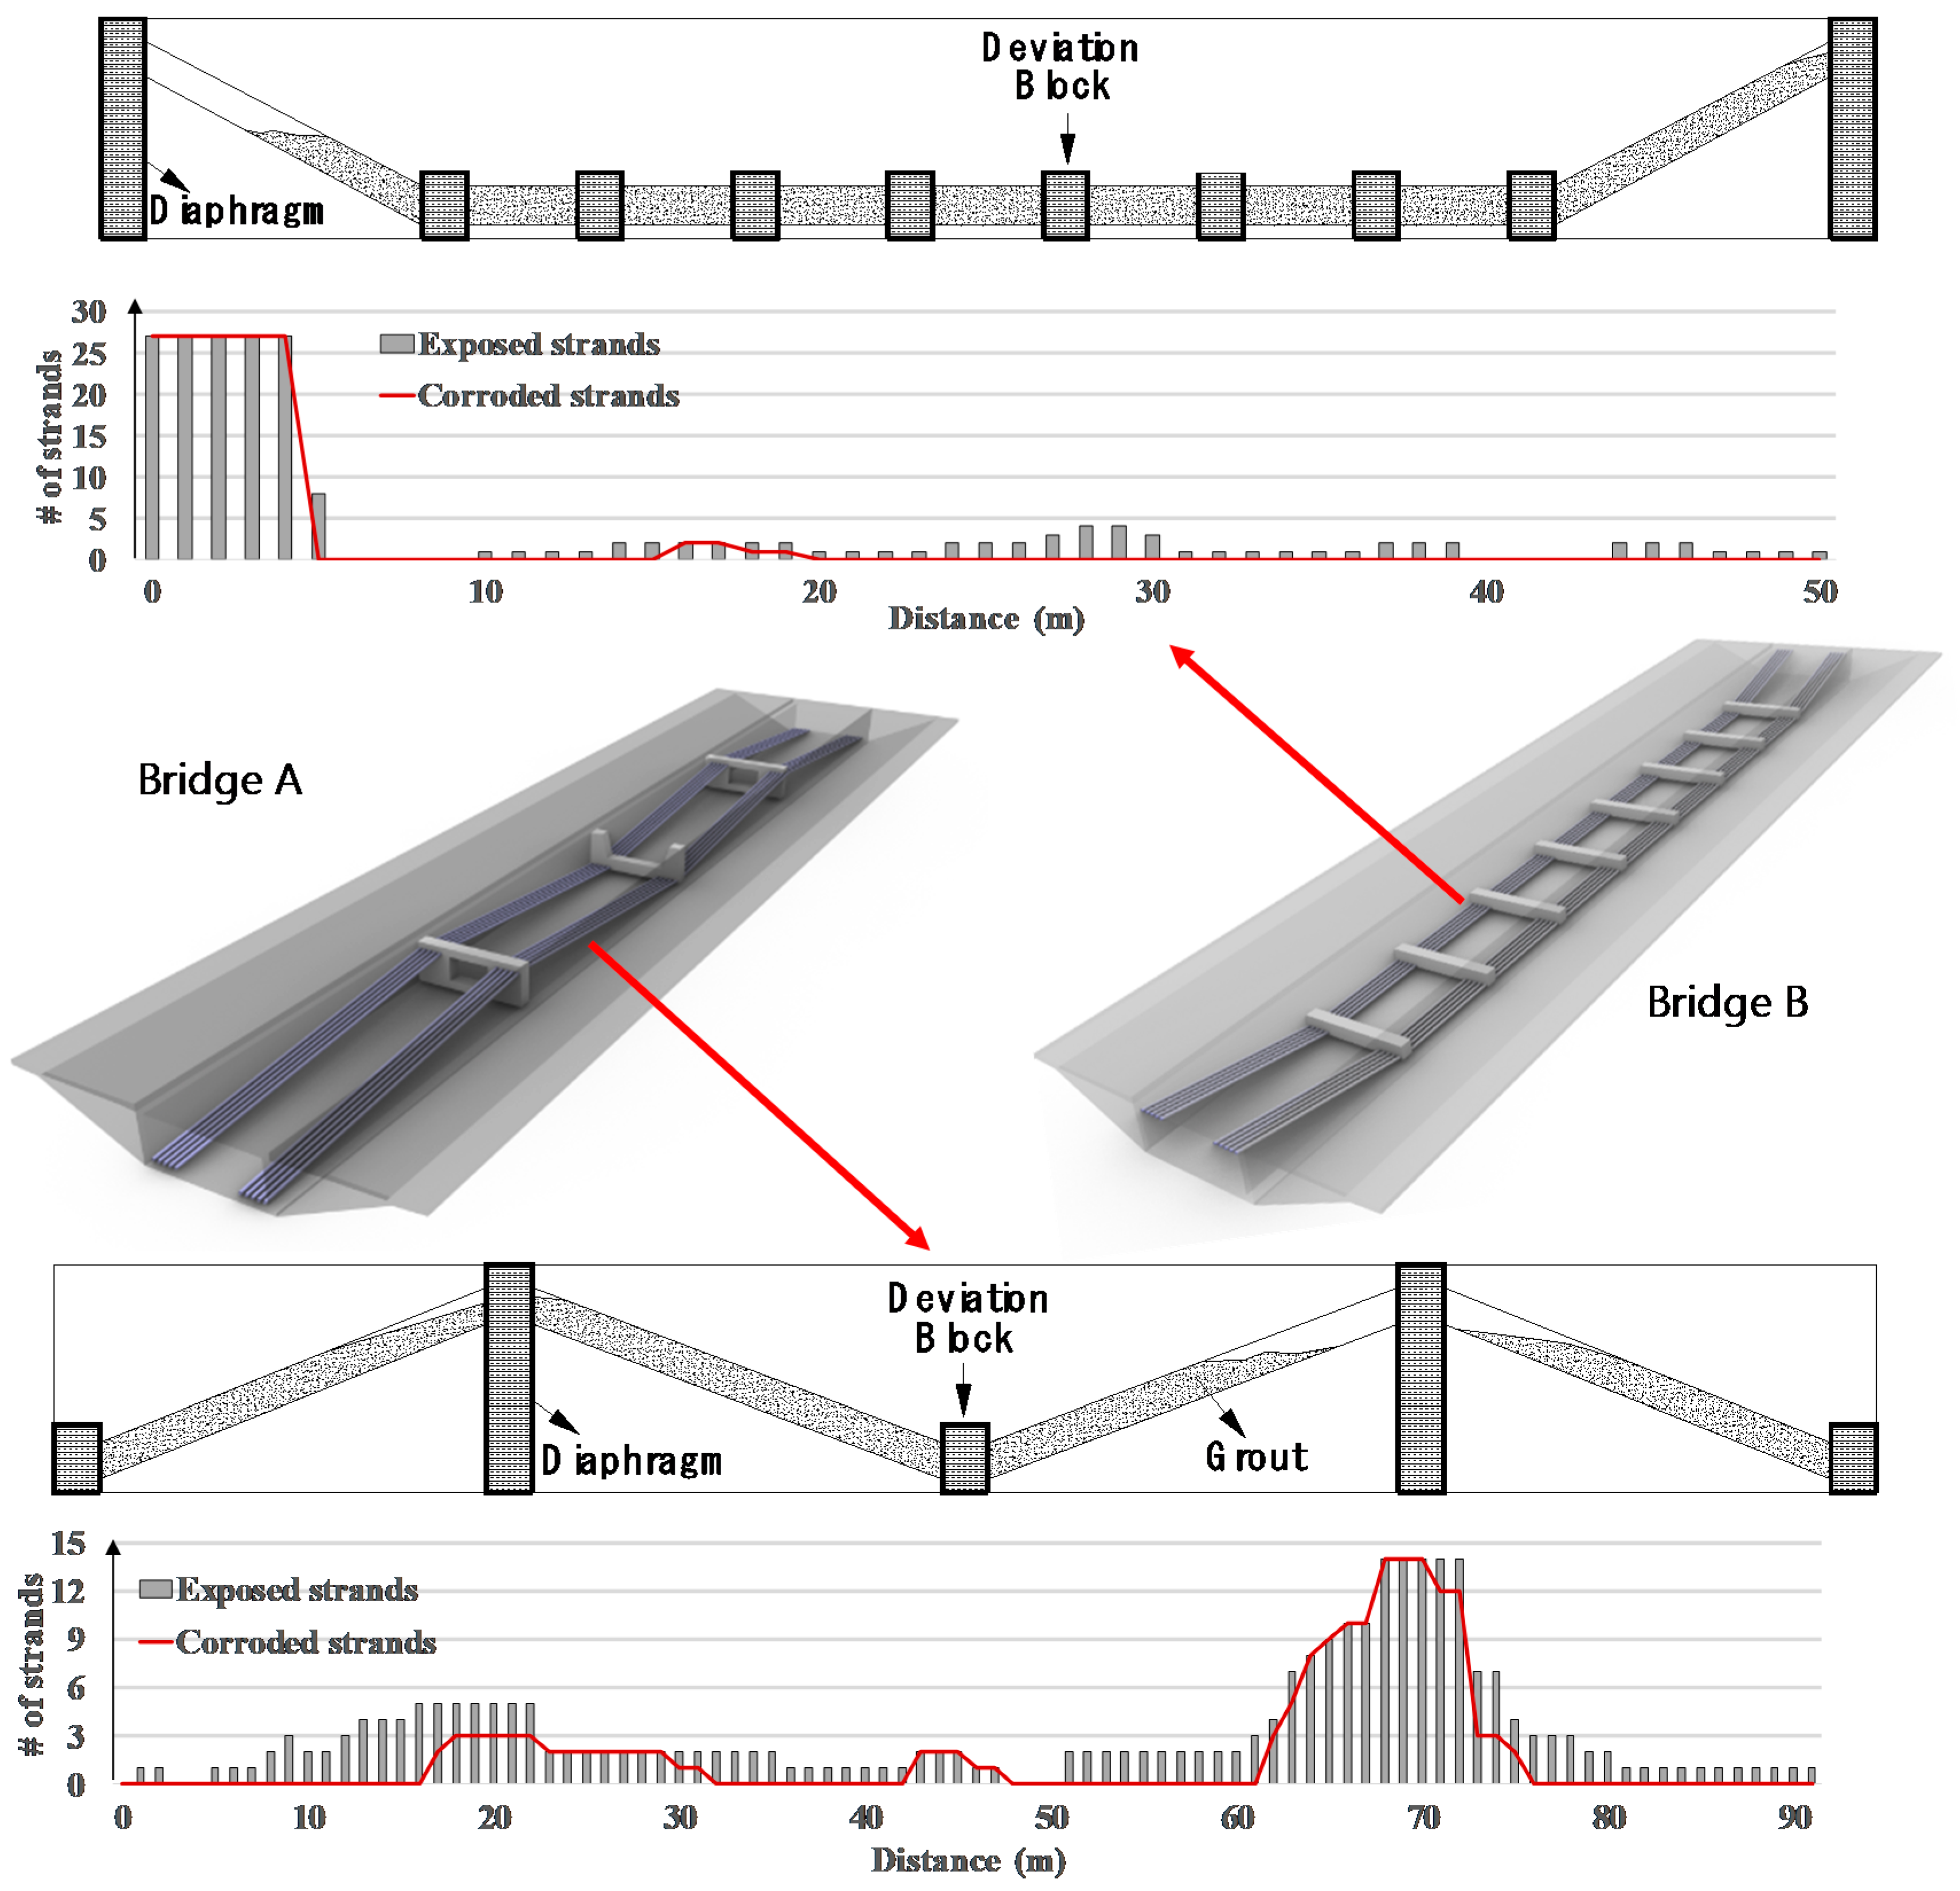
2.1. Bridge Description
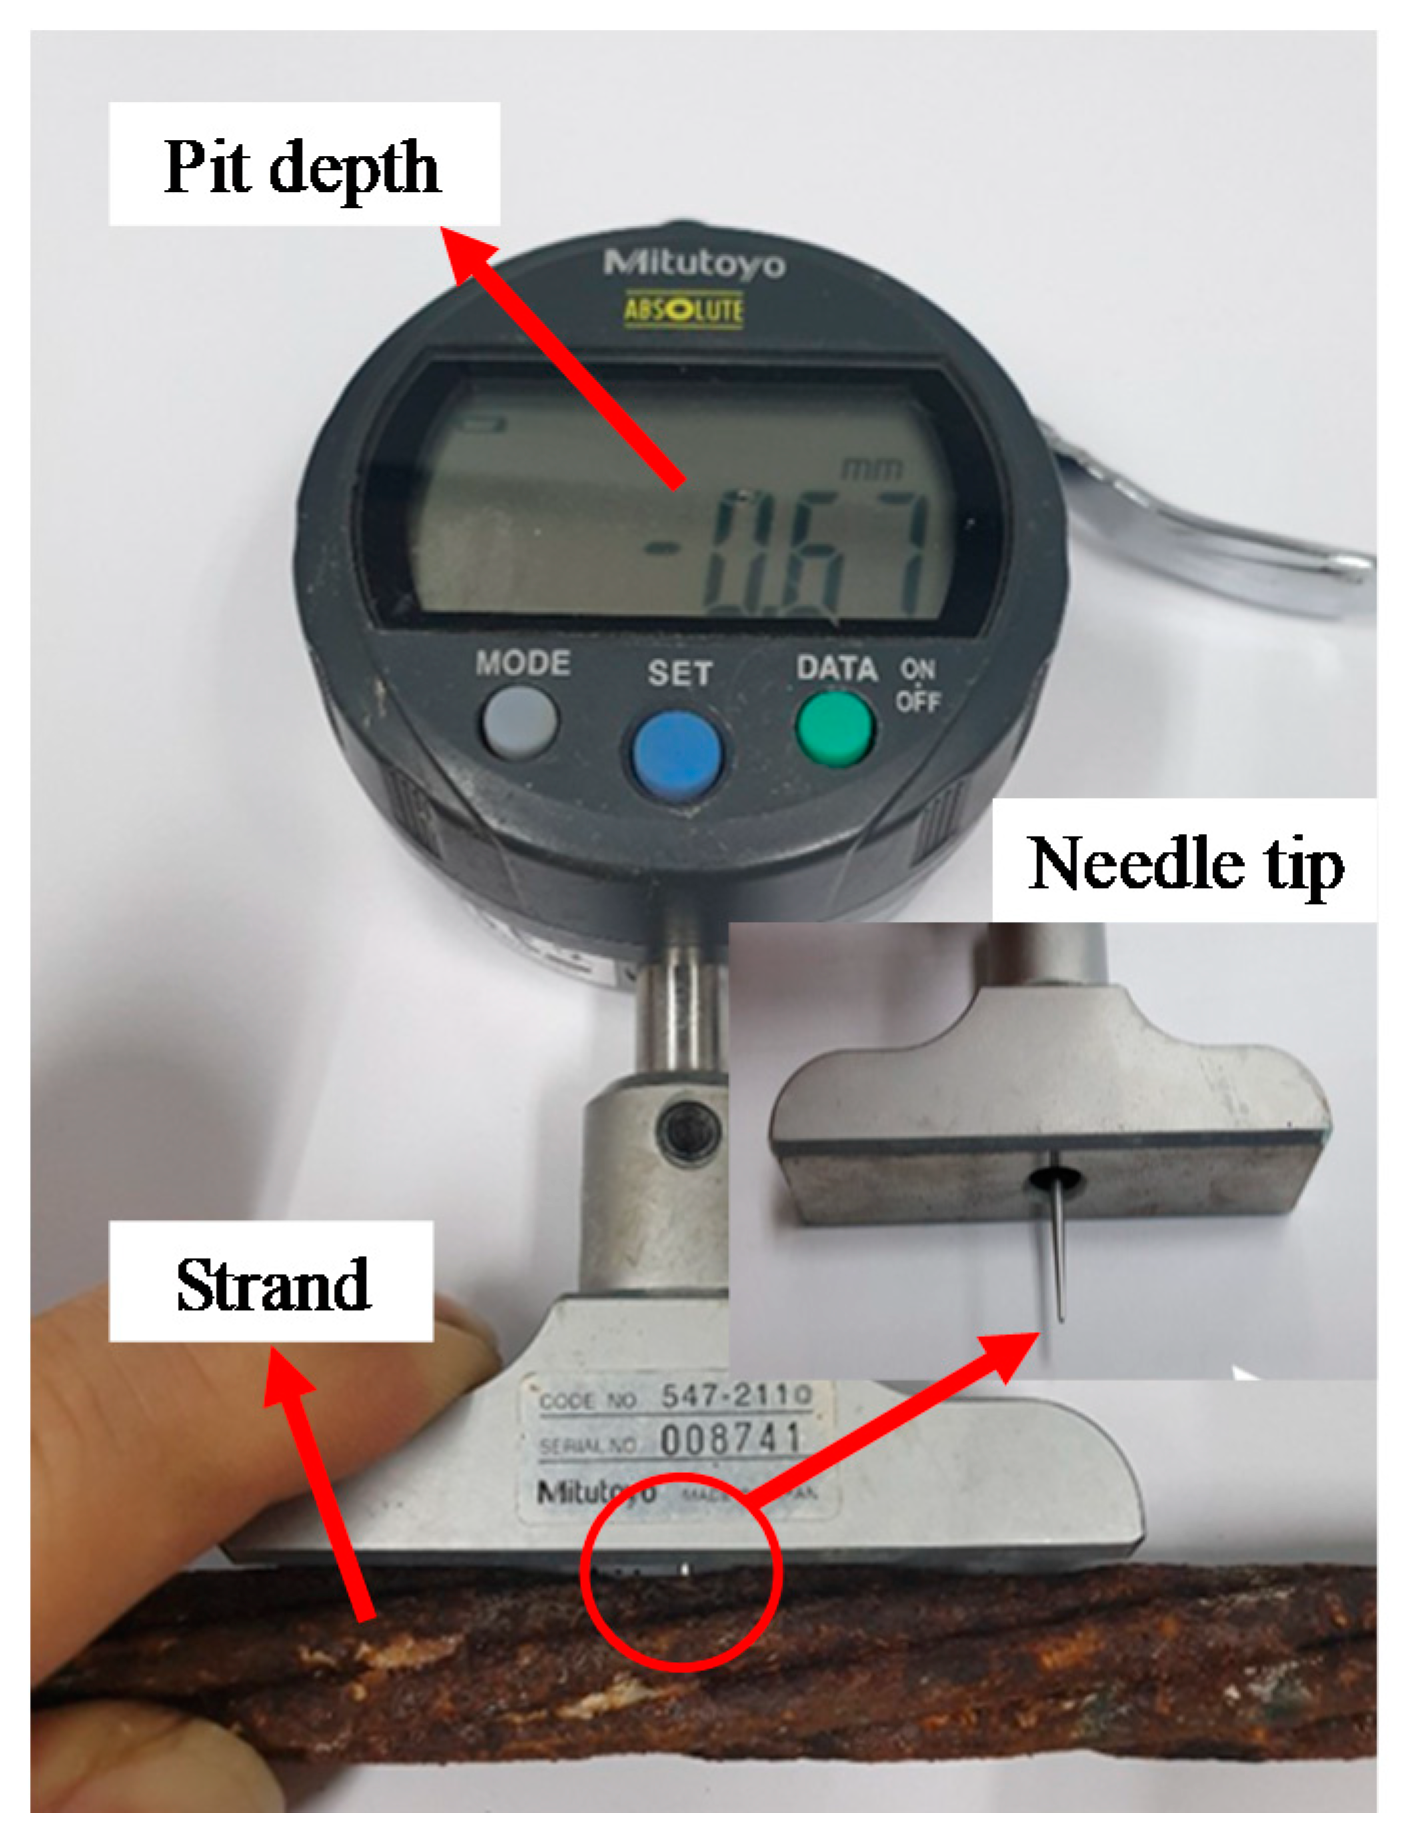
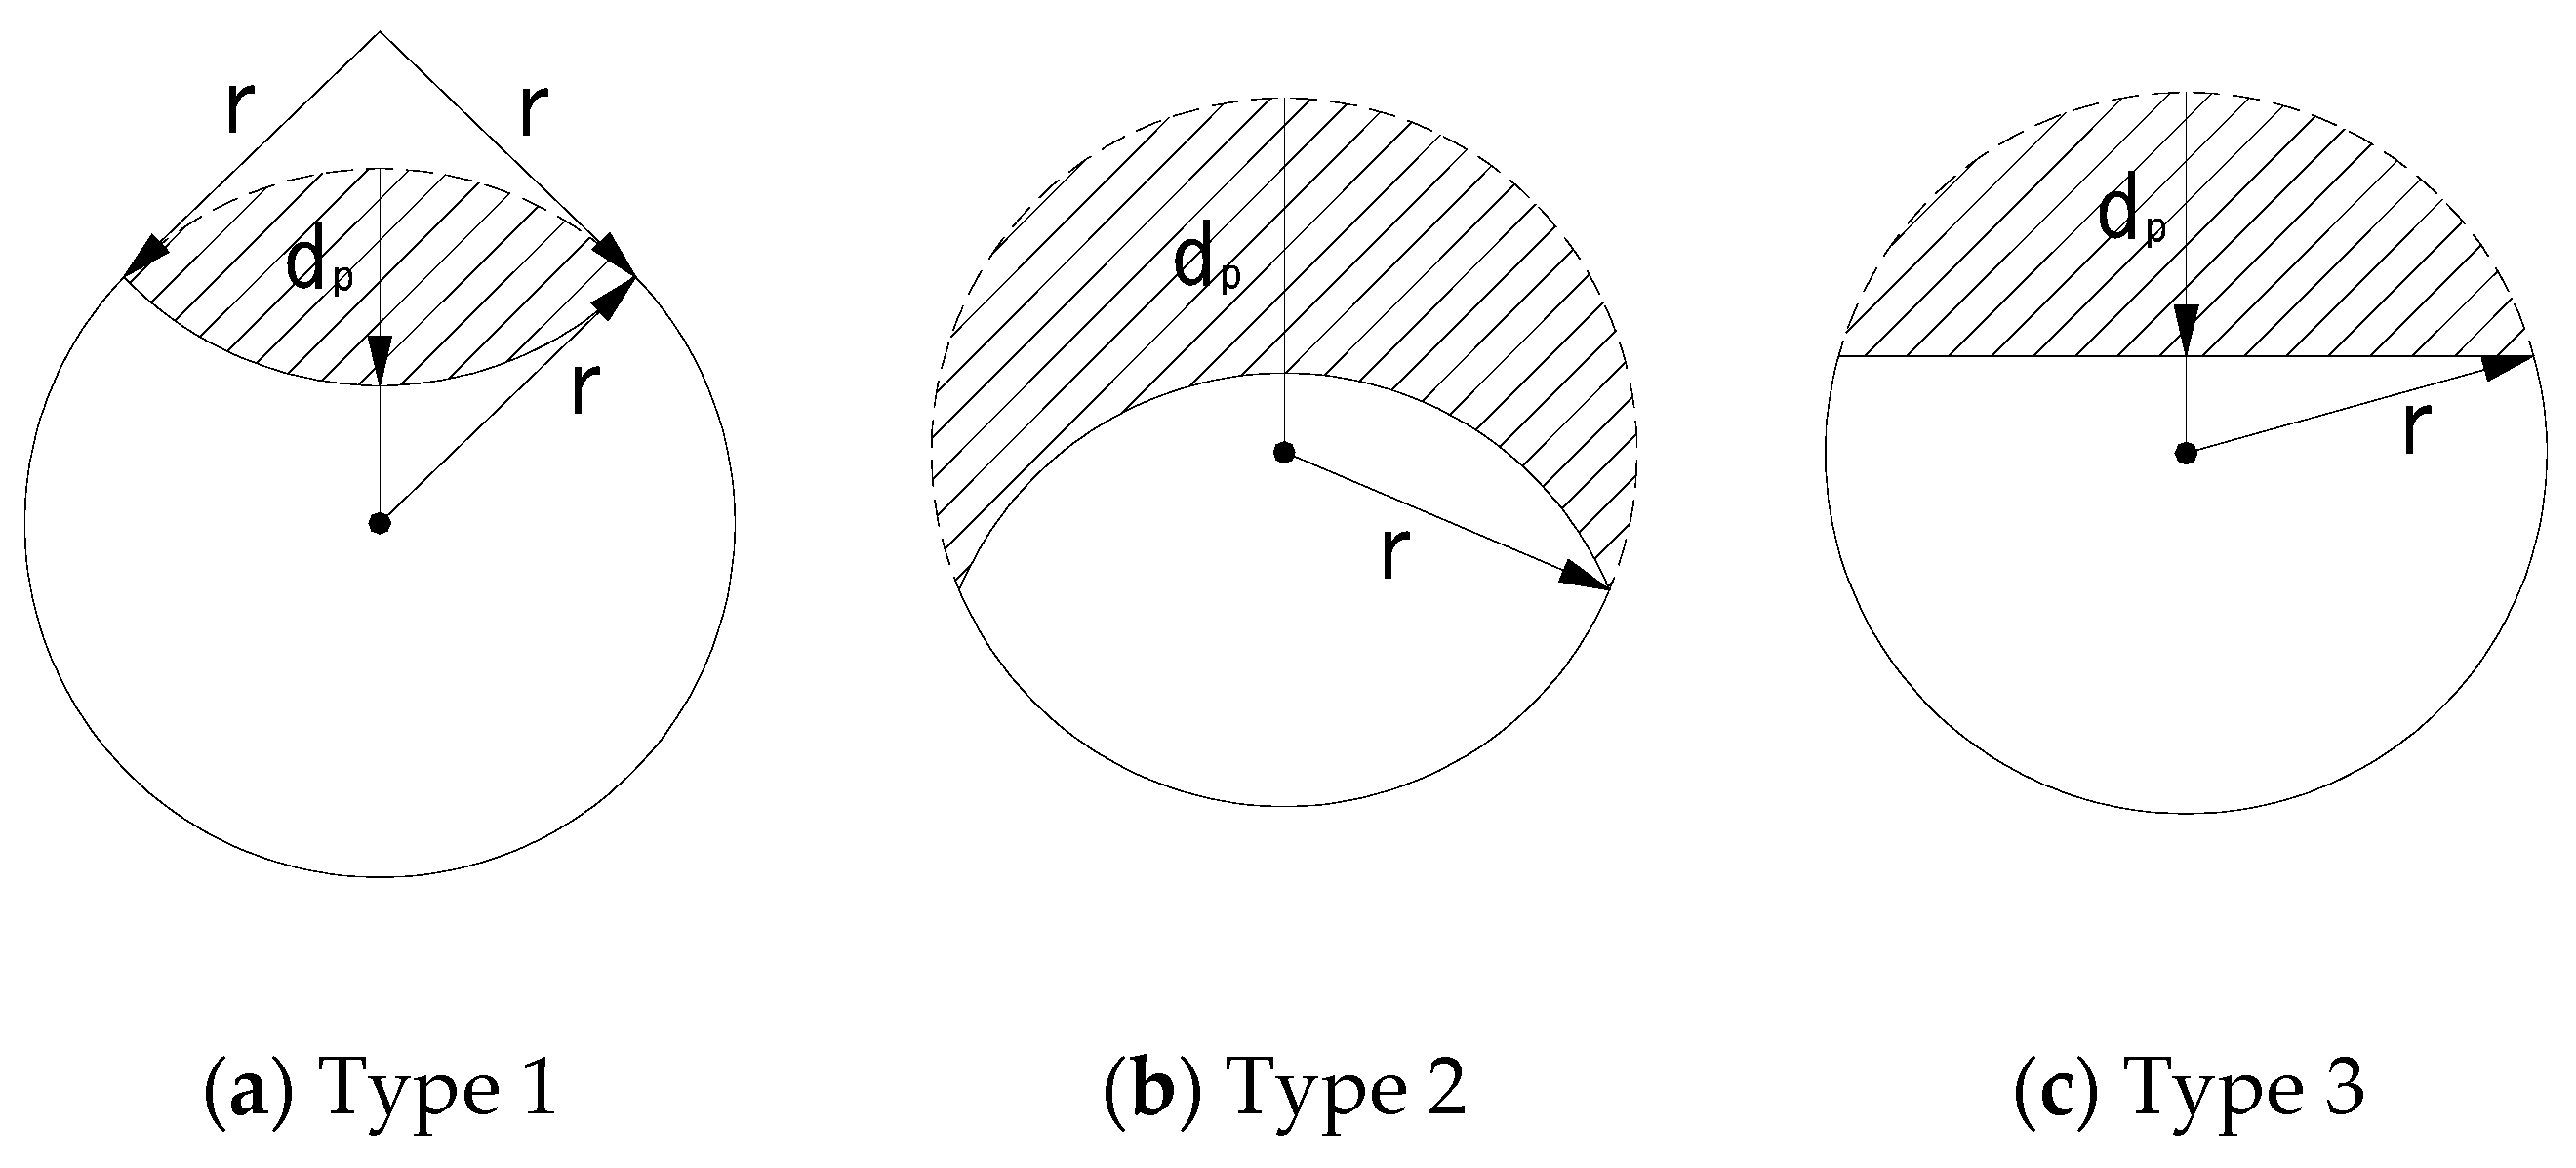
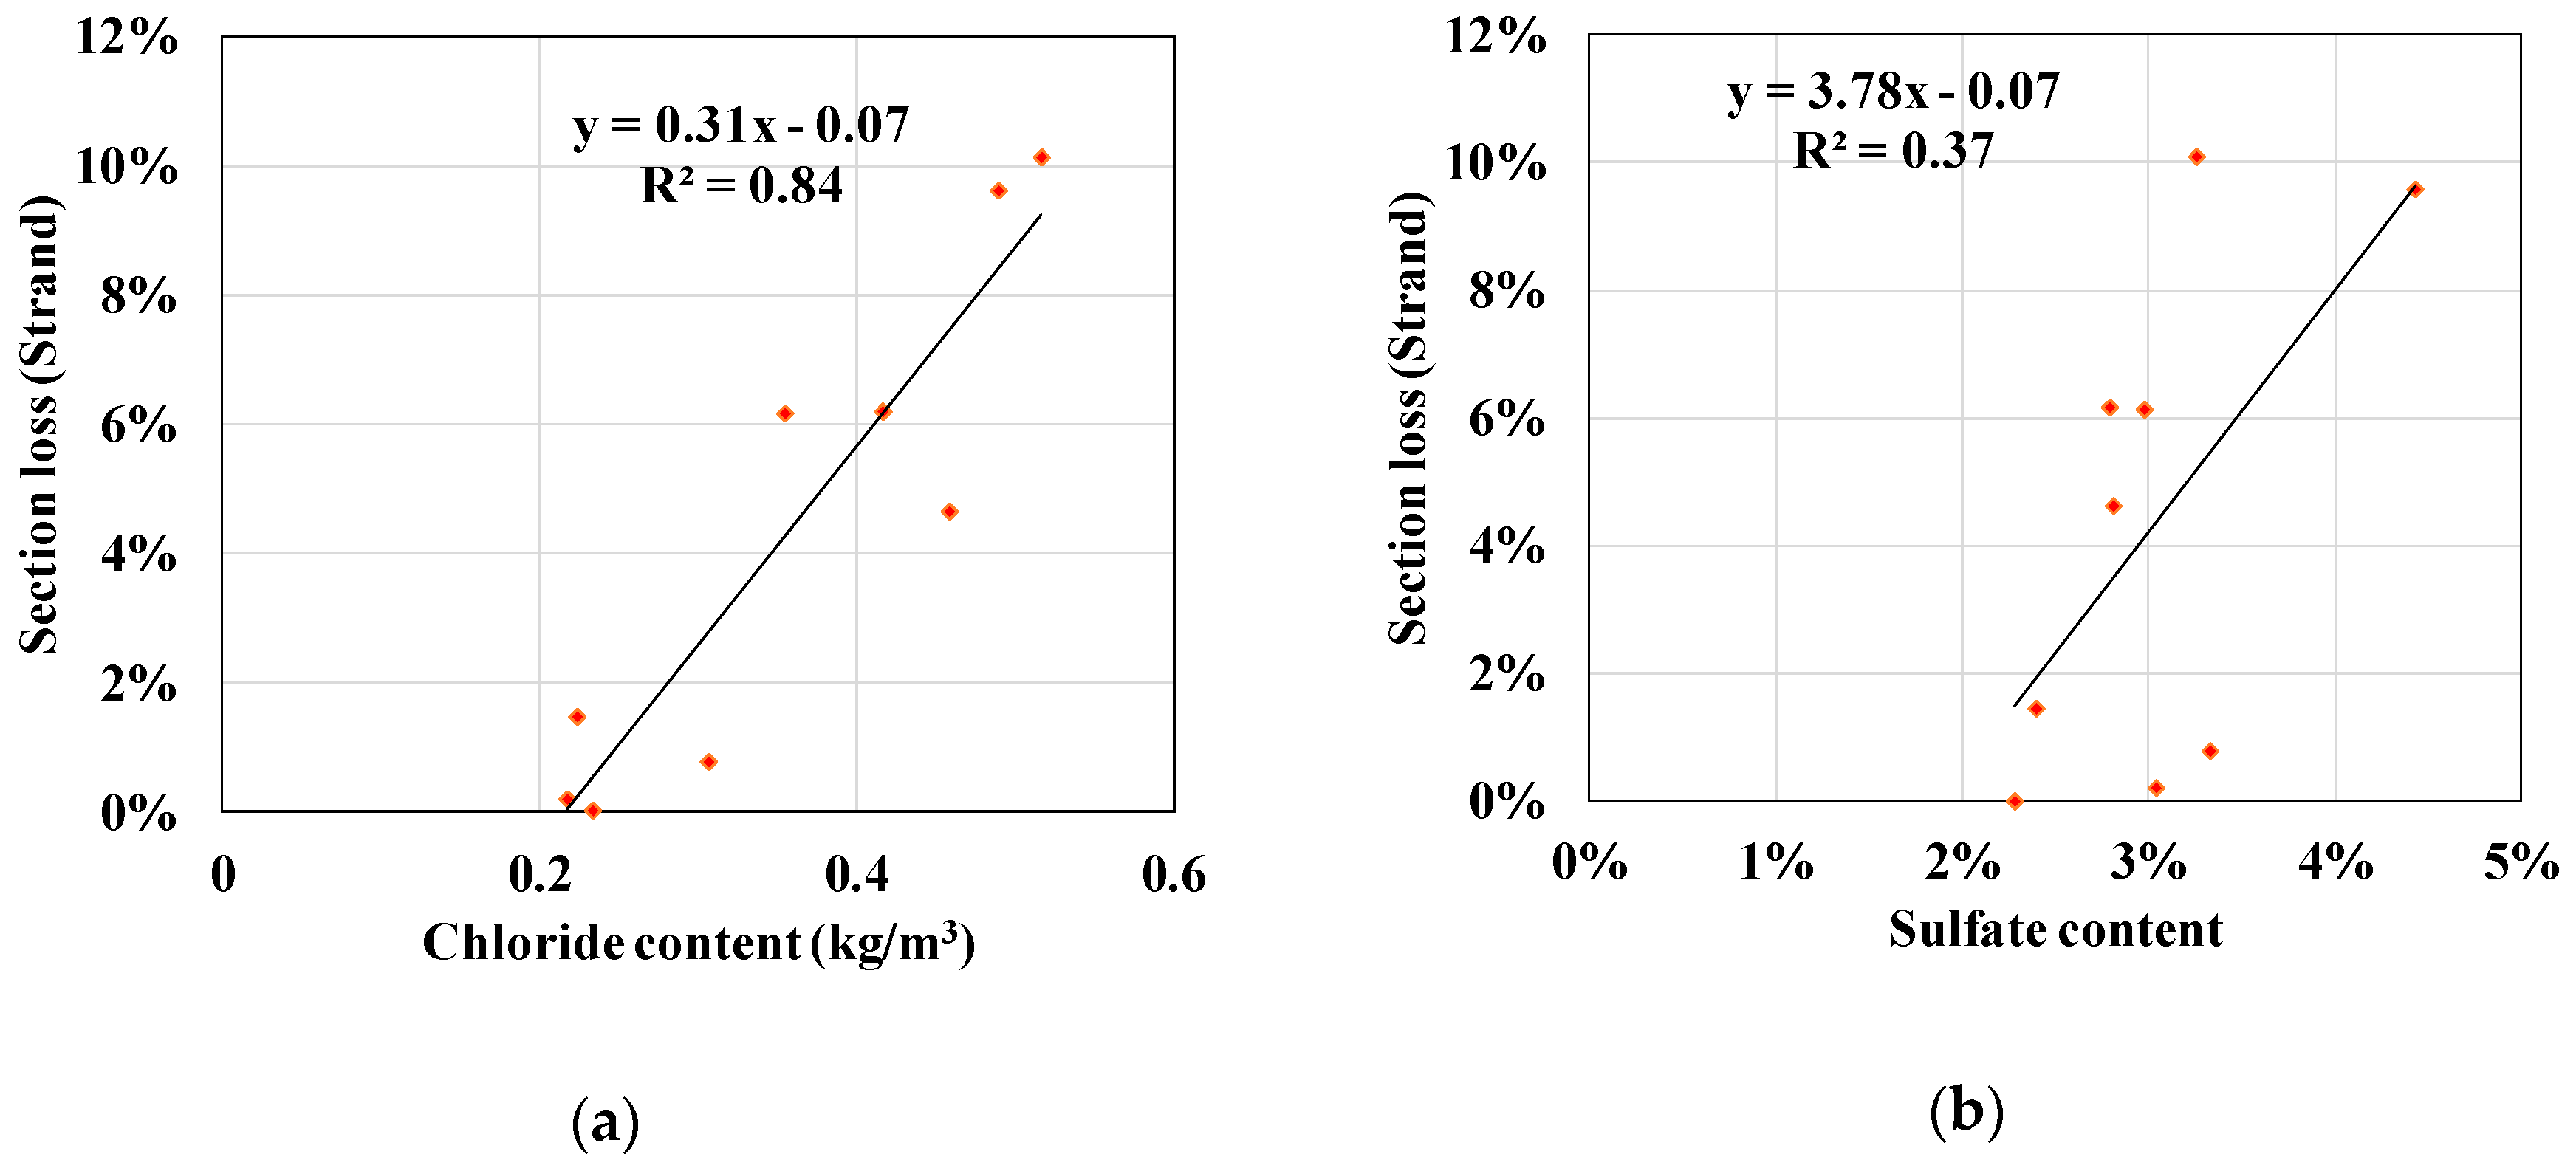
2.2. Corrosion Inspection
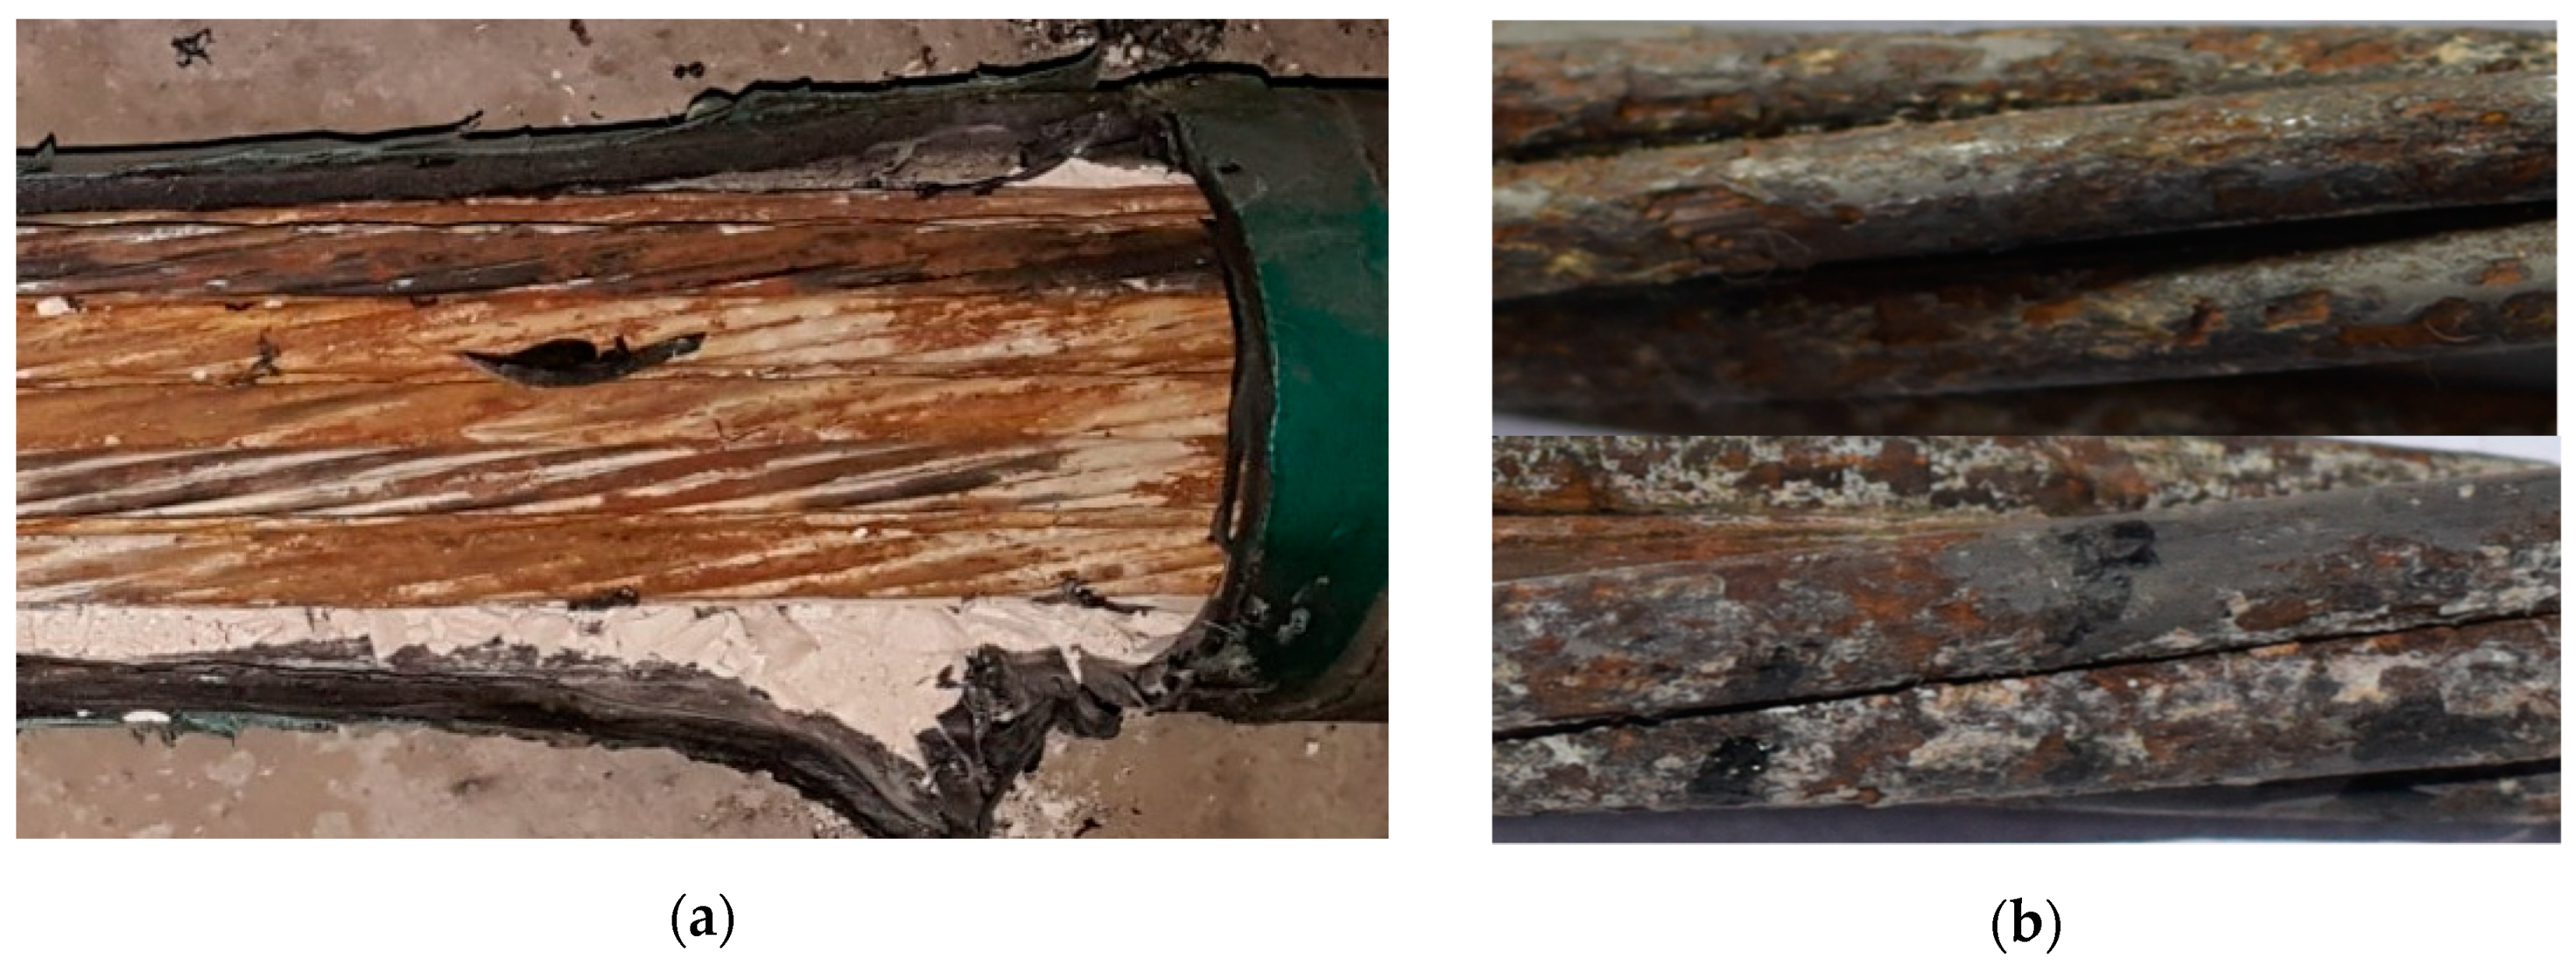
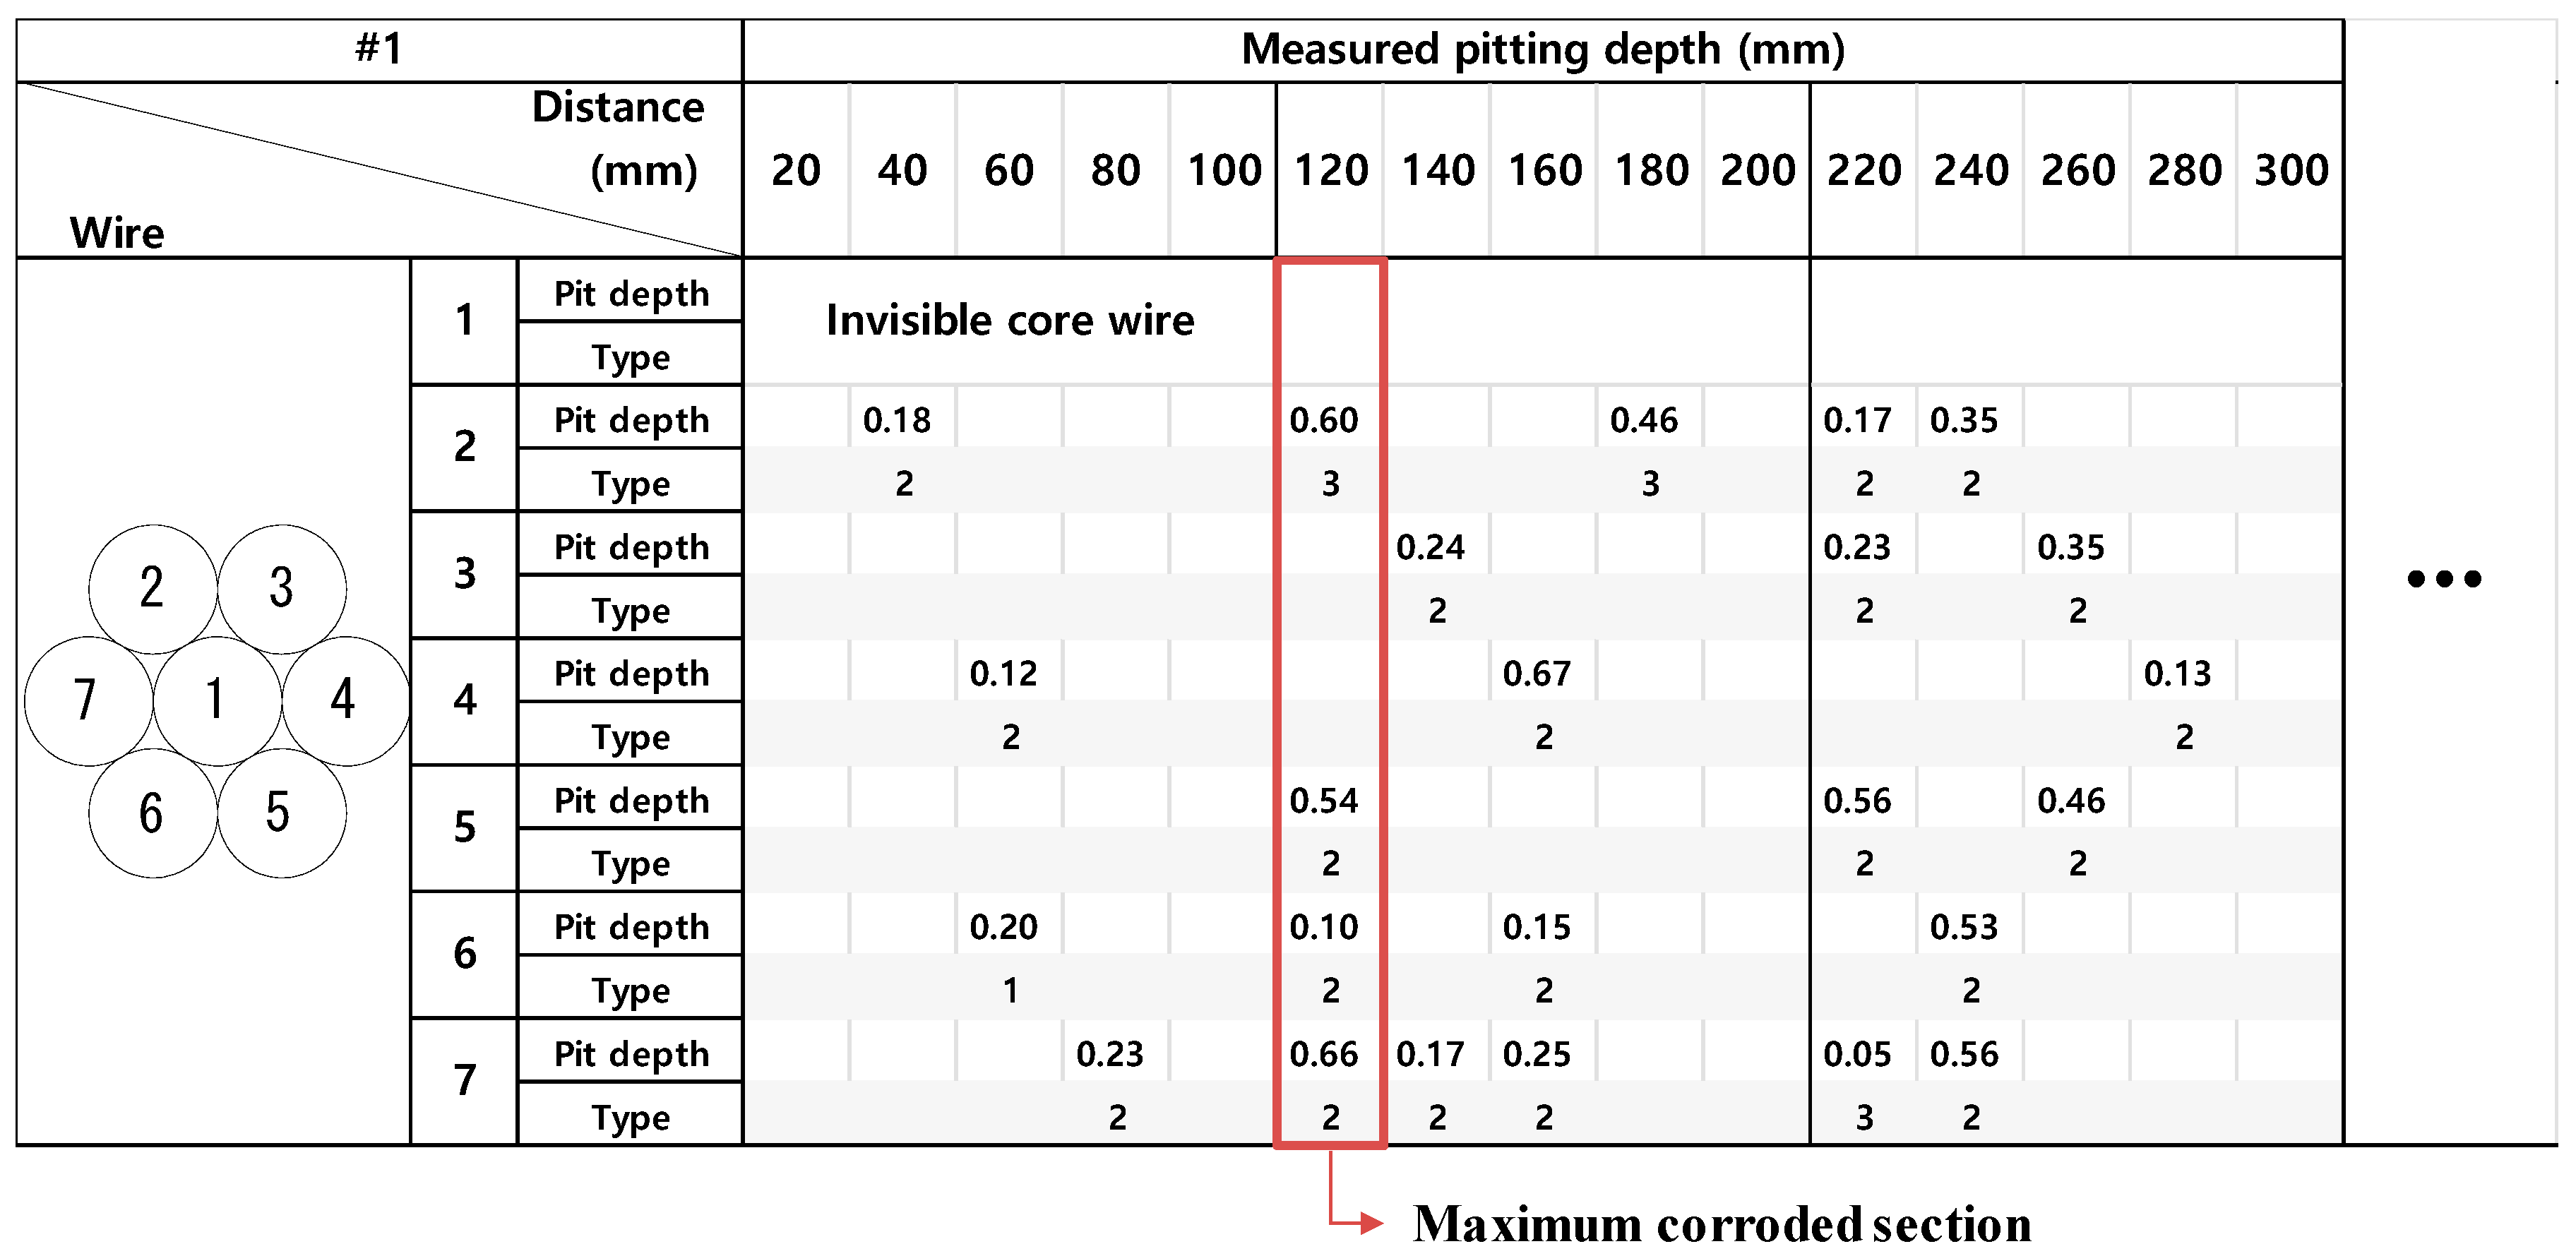
2.3. Corrosion Phenomena in the External Tendon
3. Tensile Test of Corroded Strands
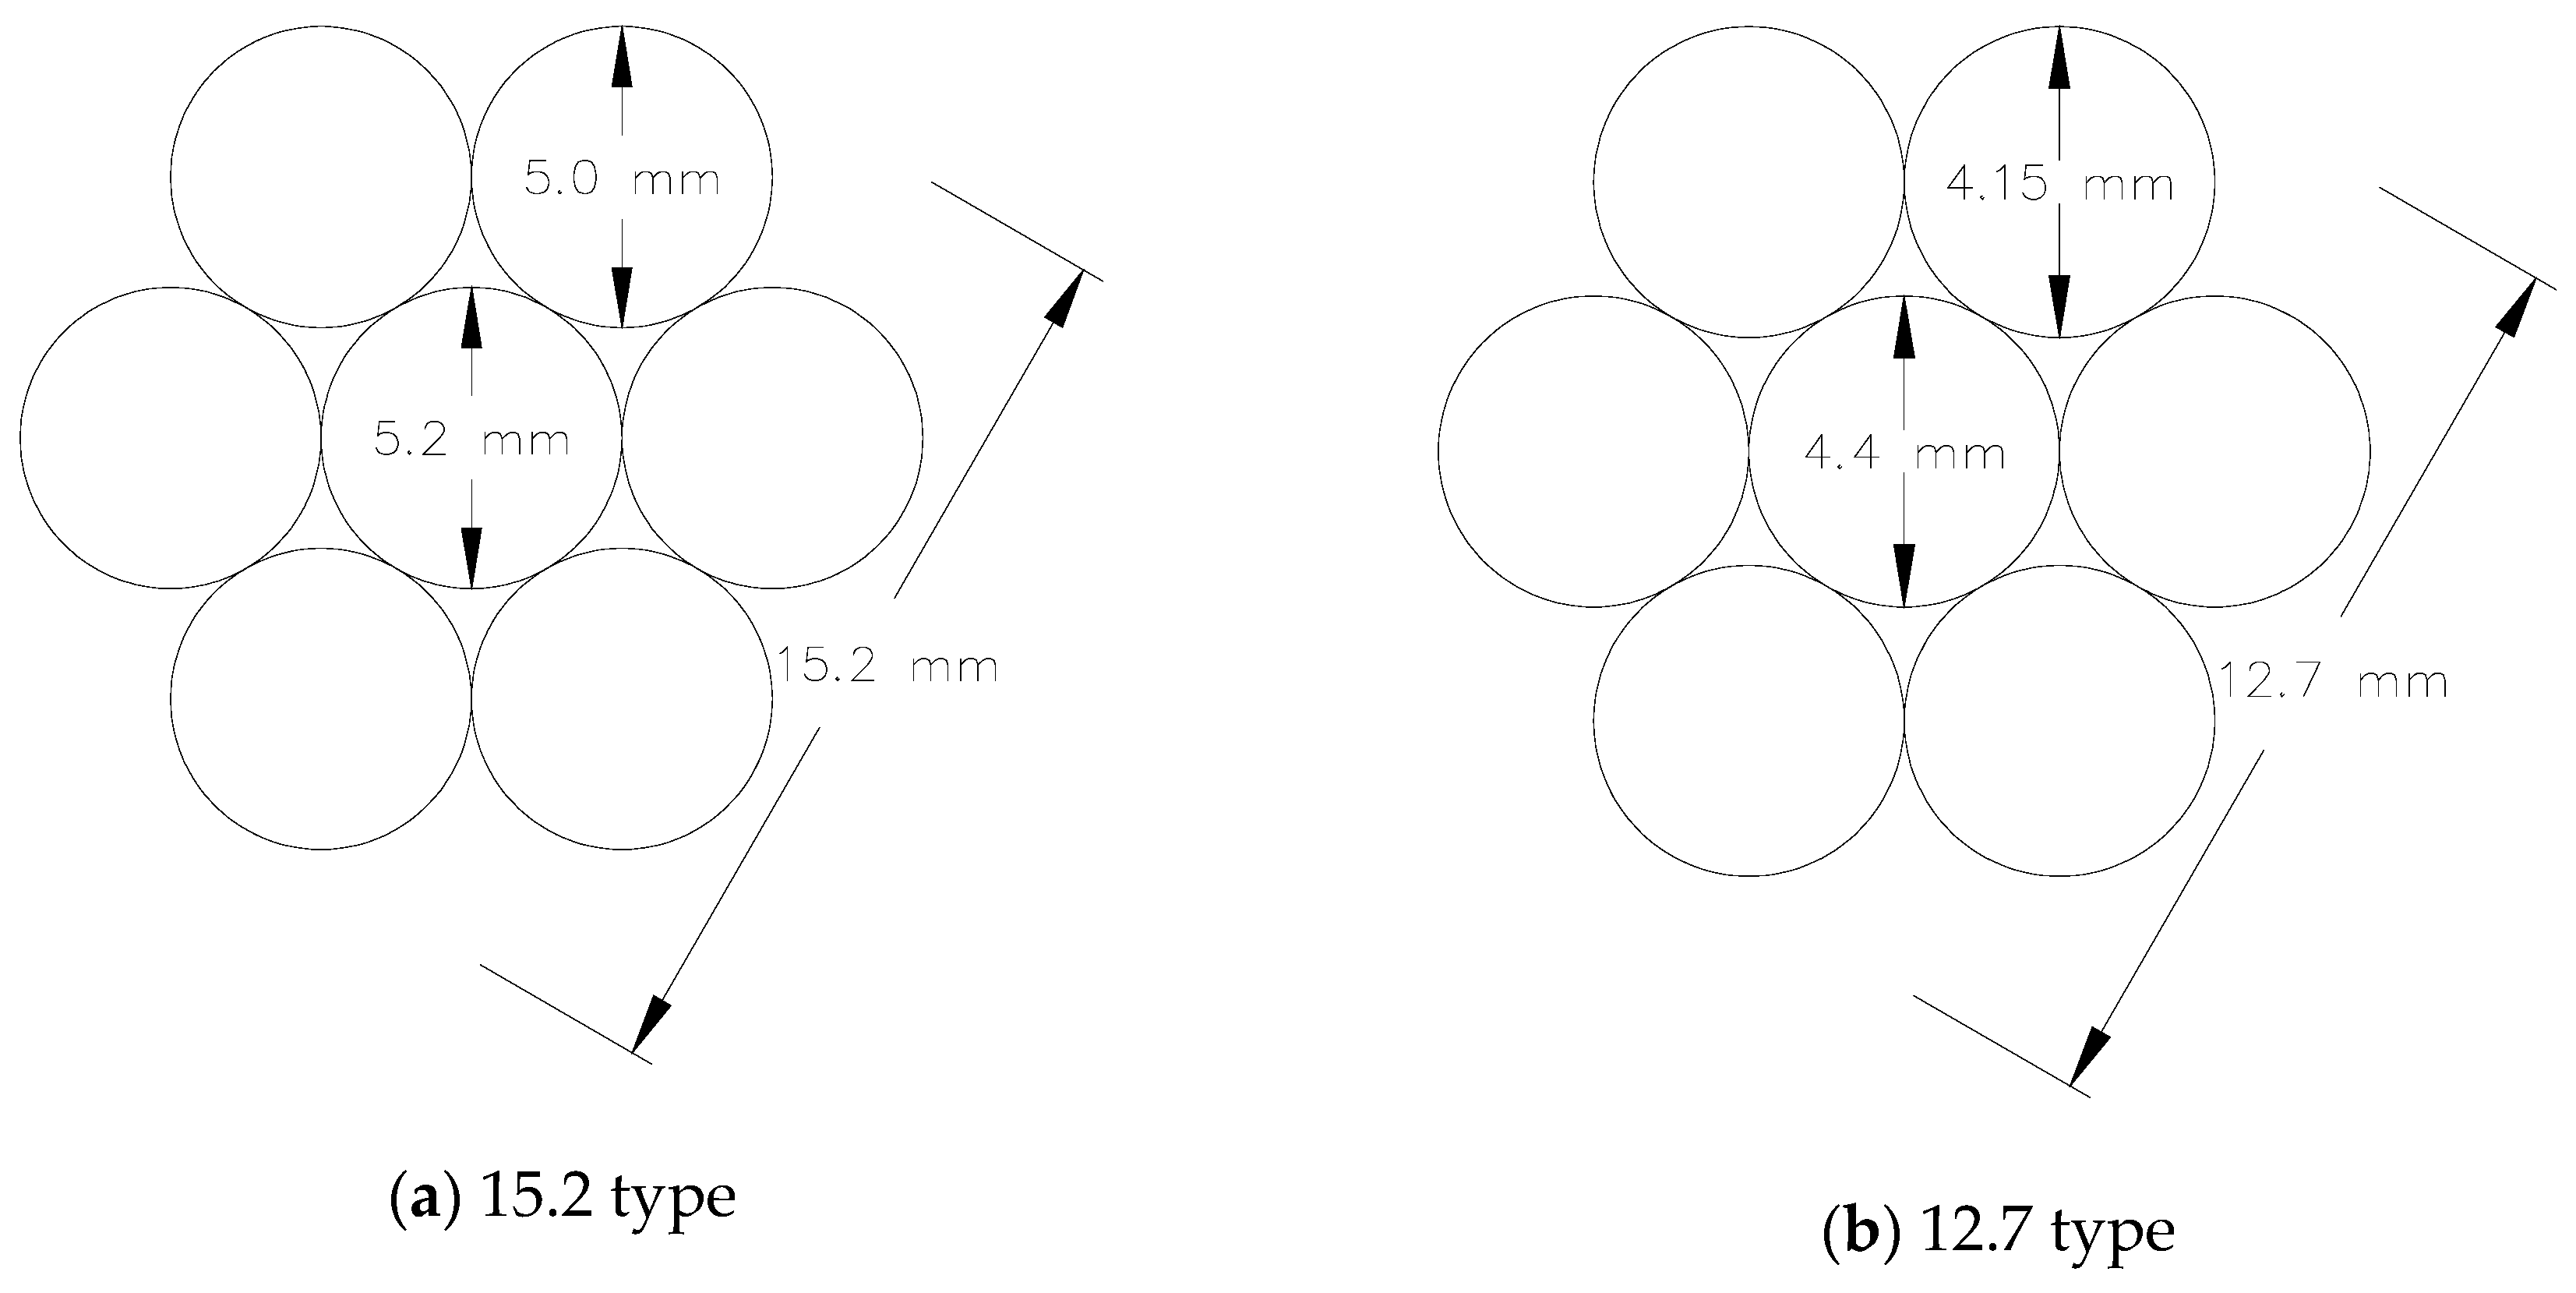
3.1. Test Specimens
3.2. Tensile Test of Corroded Strands
3.3. Residual Mechanical Properties from Test Result
4. Prestressed Concrete Beams with Corroded Strands
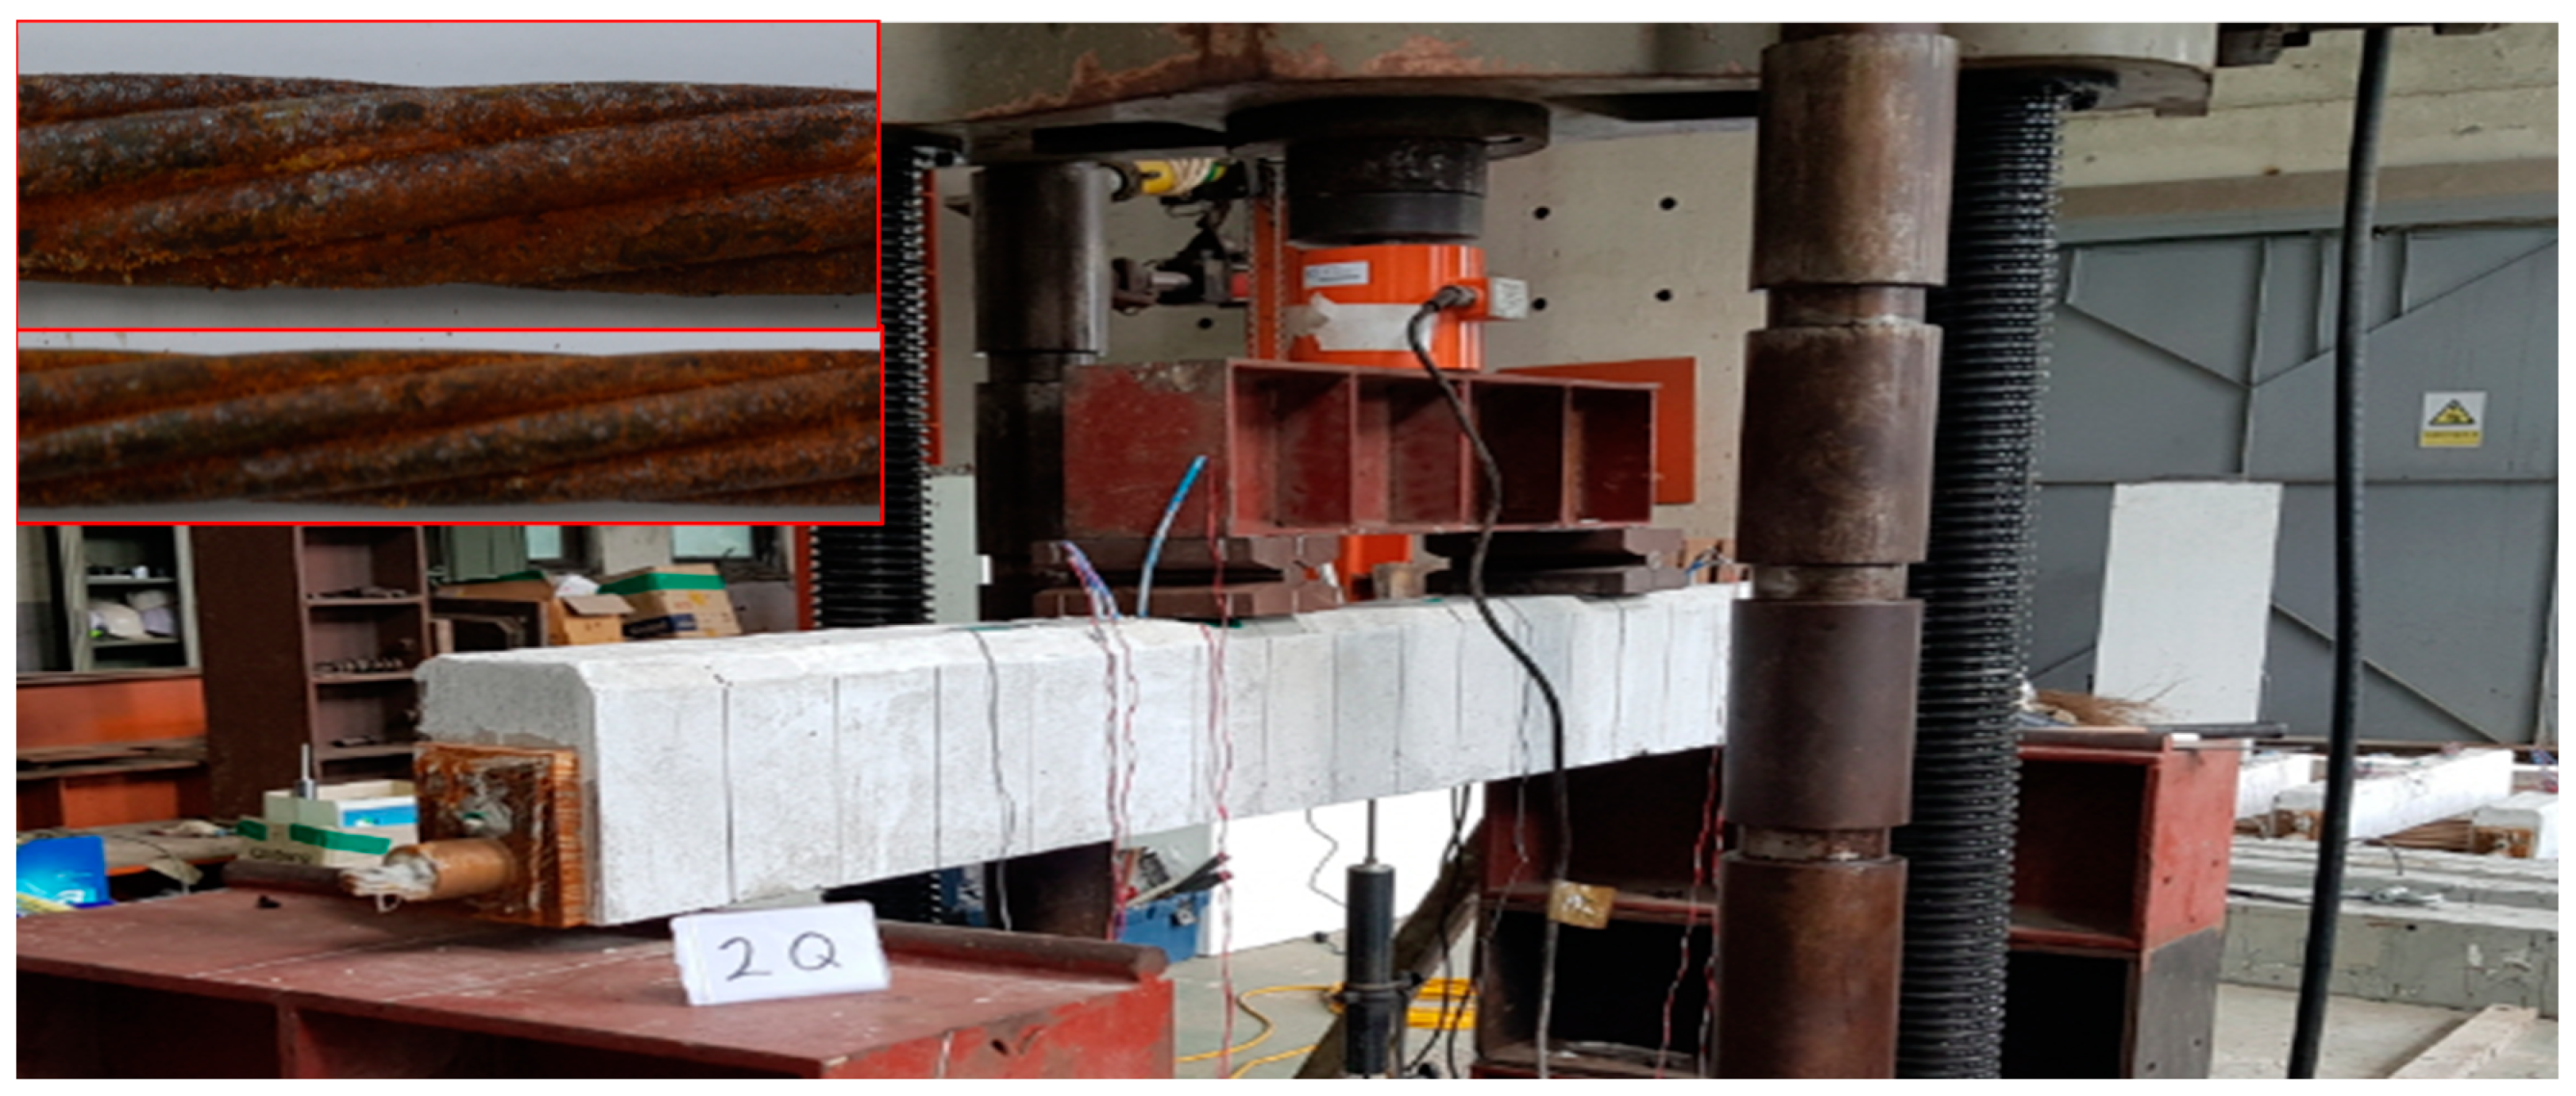
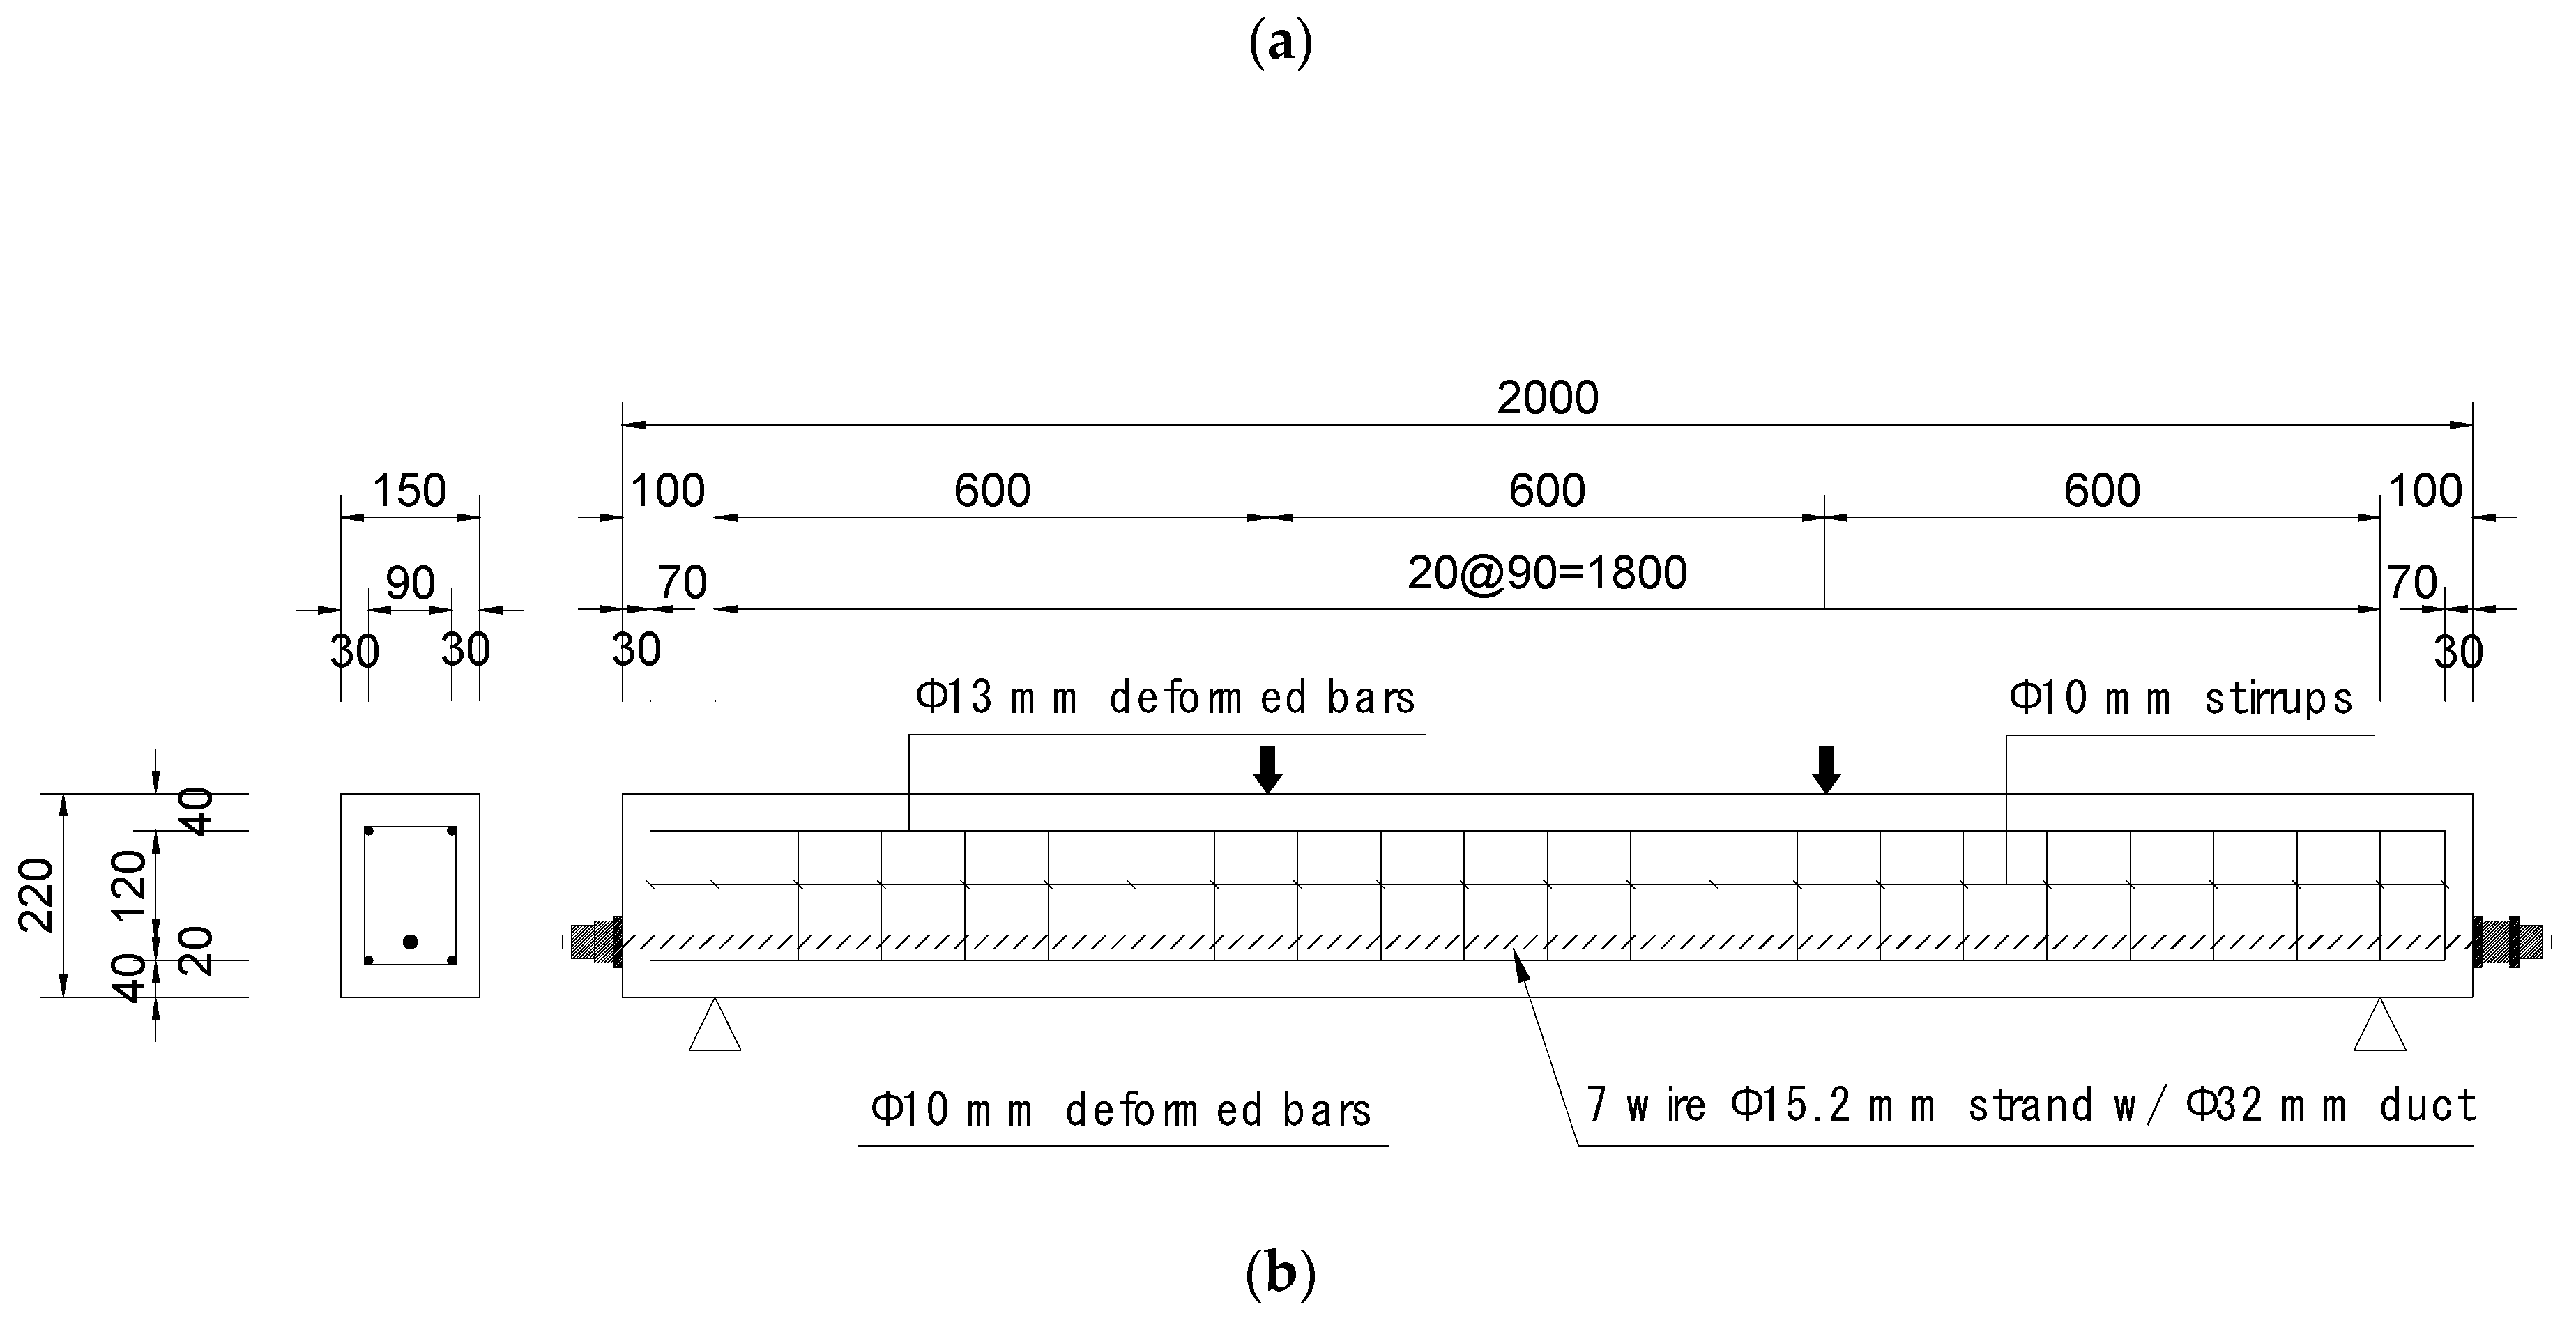
4.1. Test Specimen
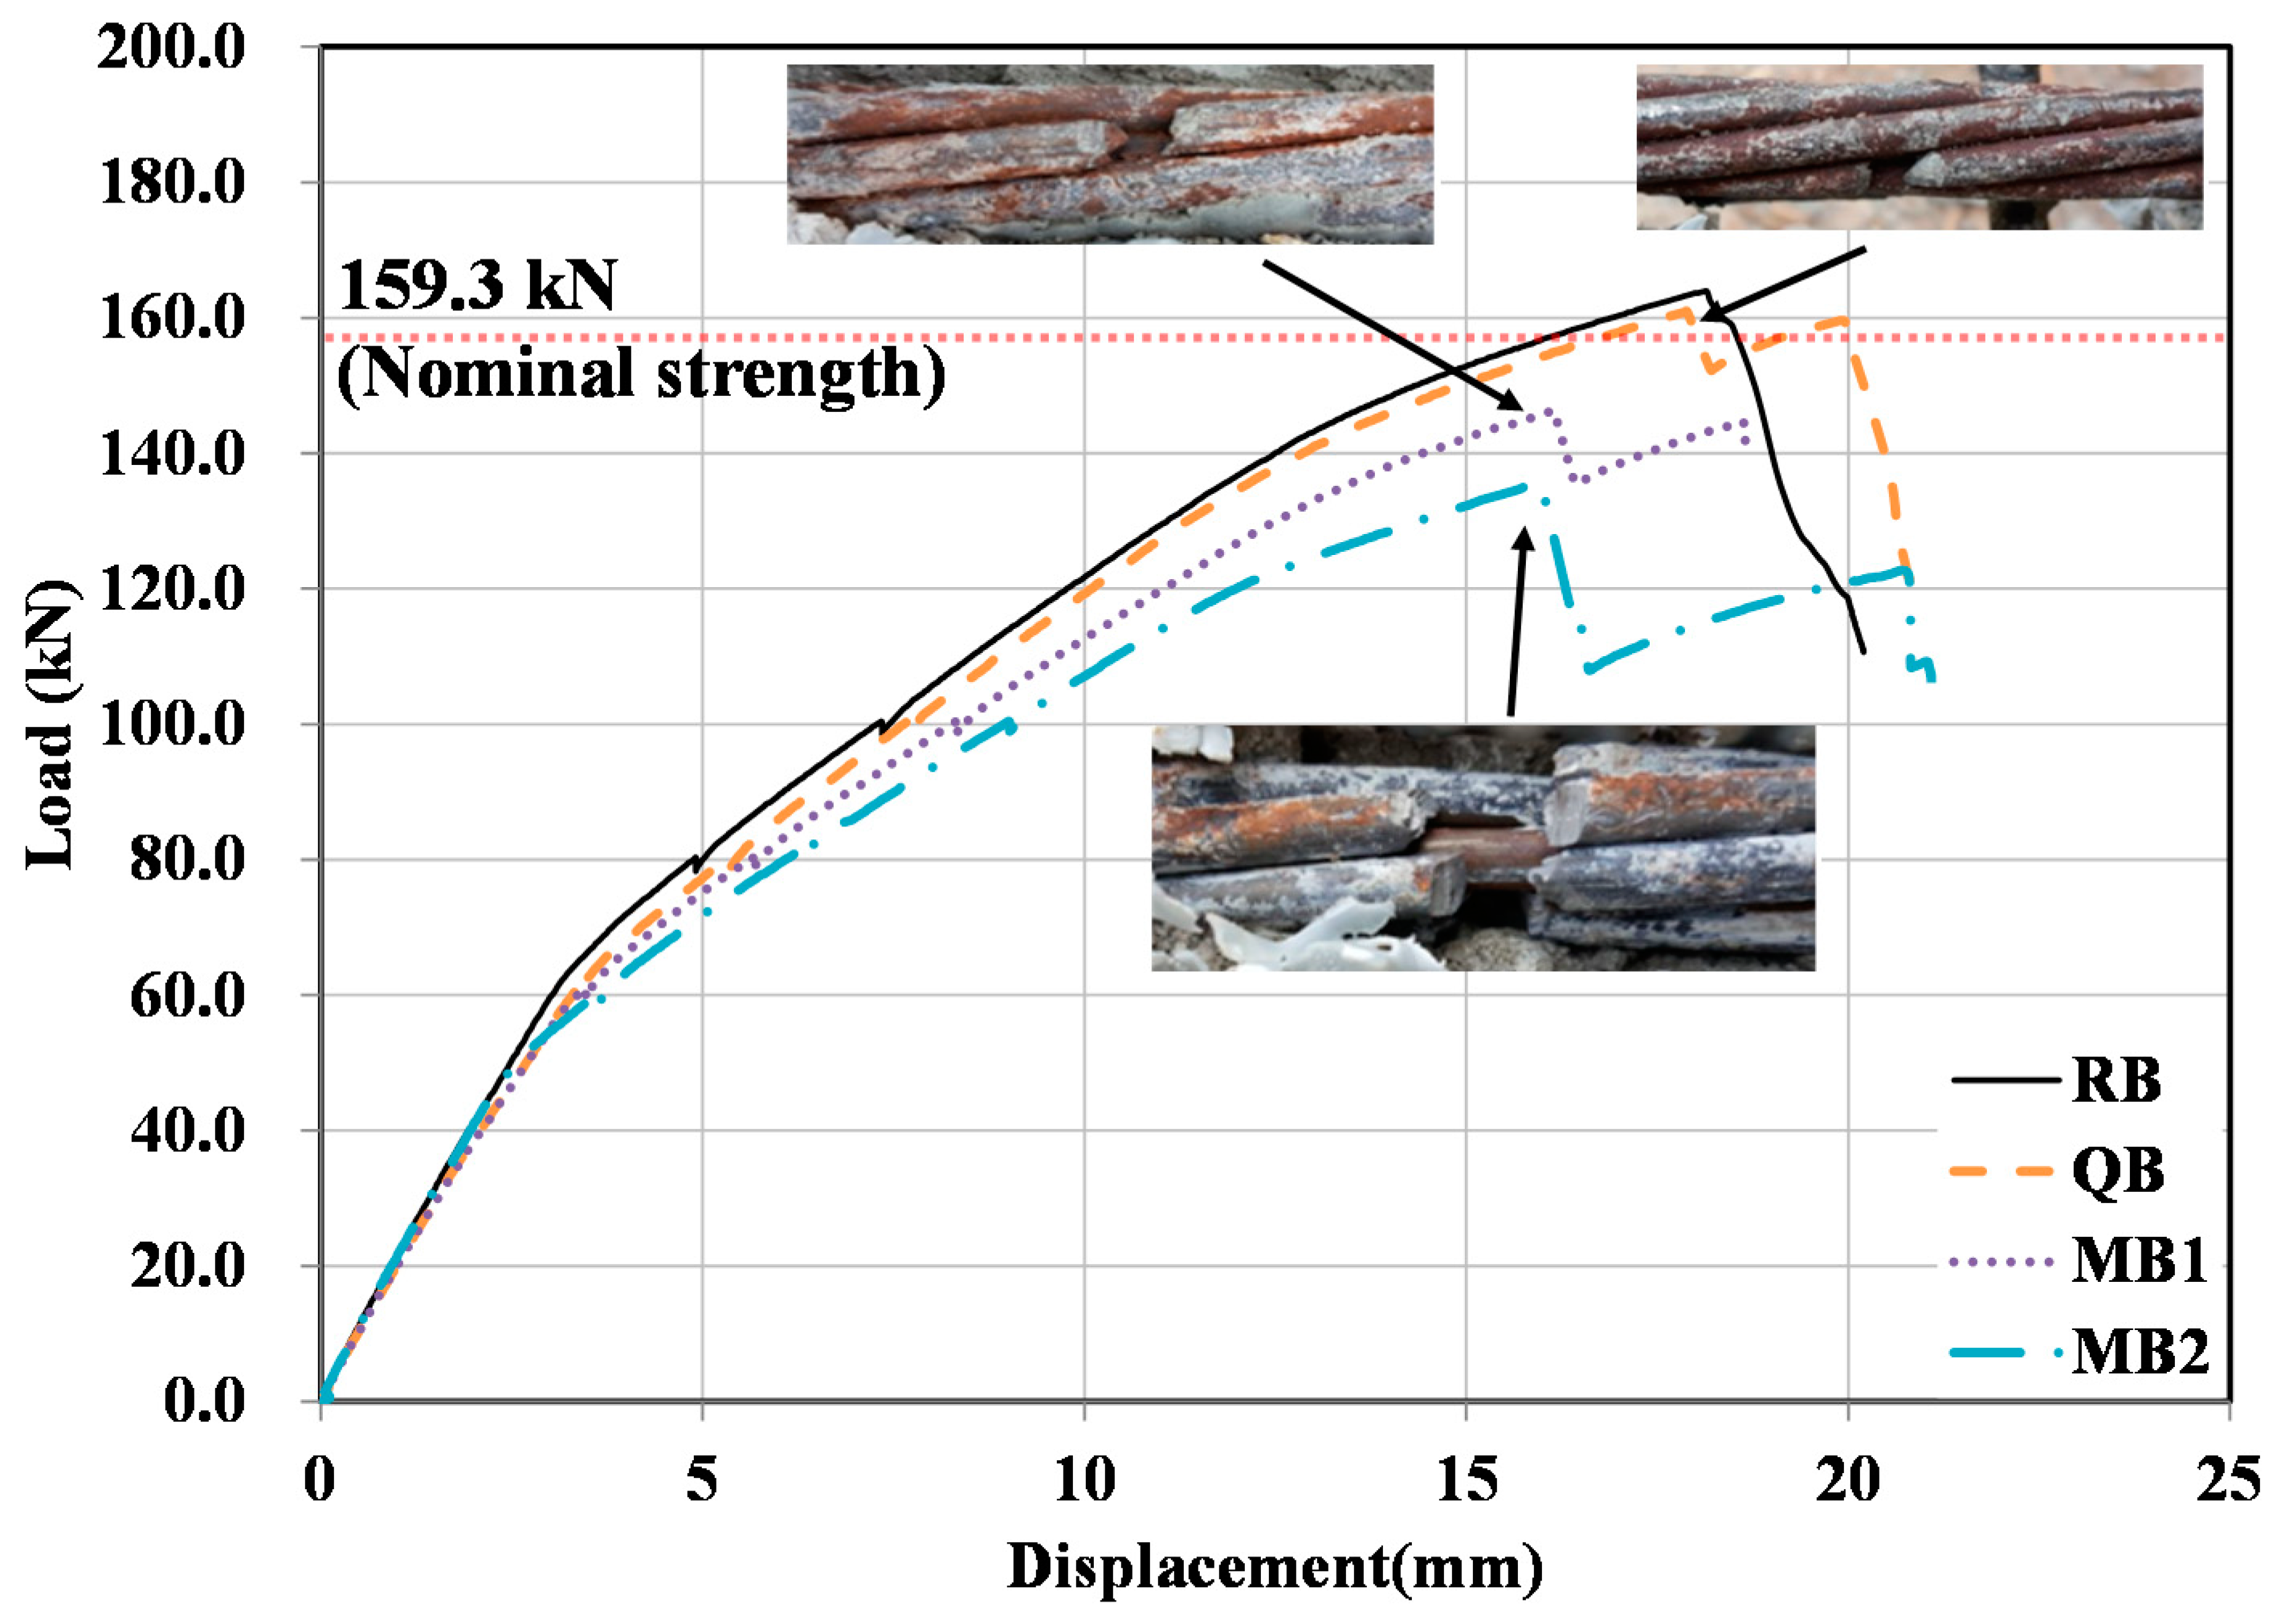
4.2. Test Result
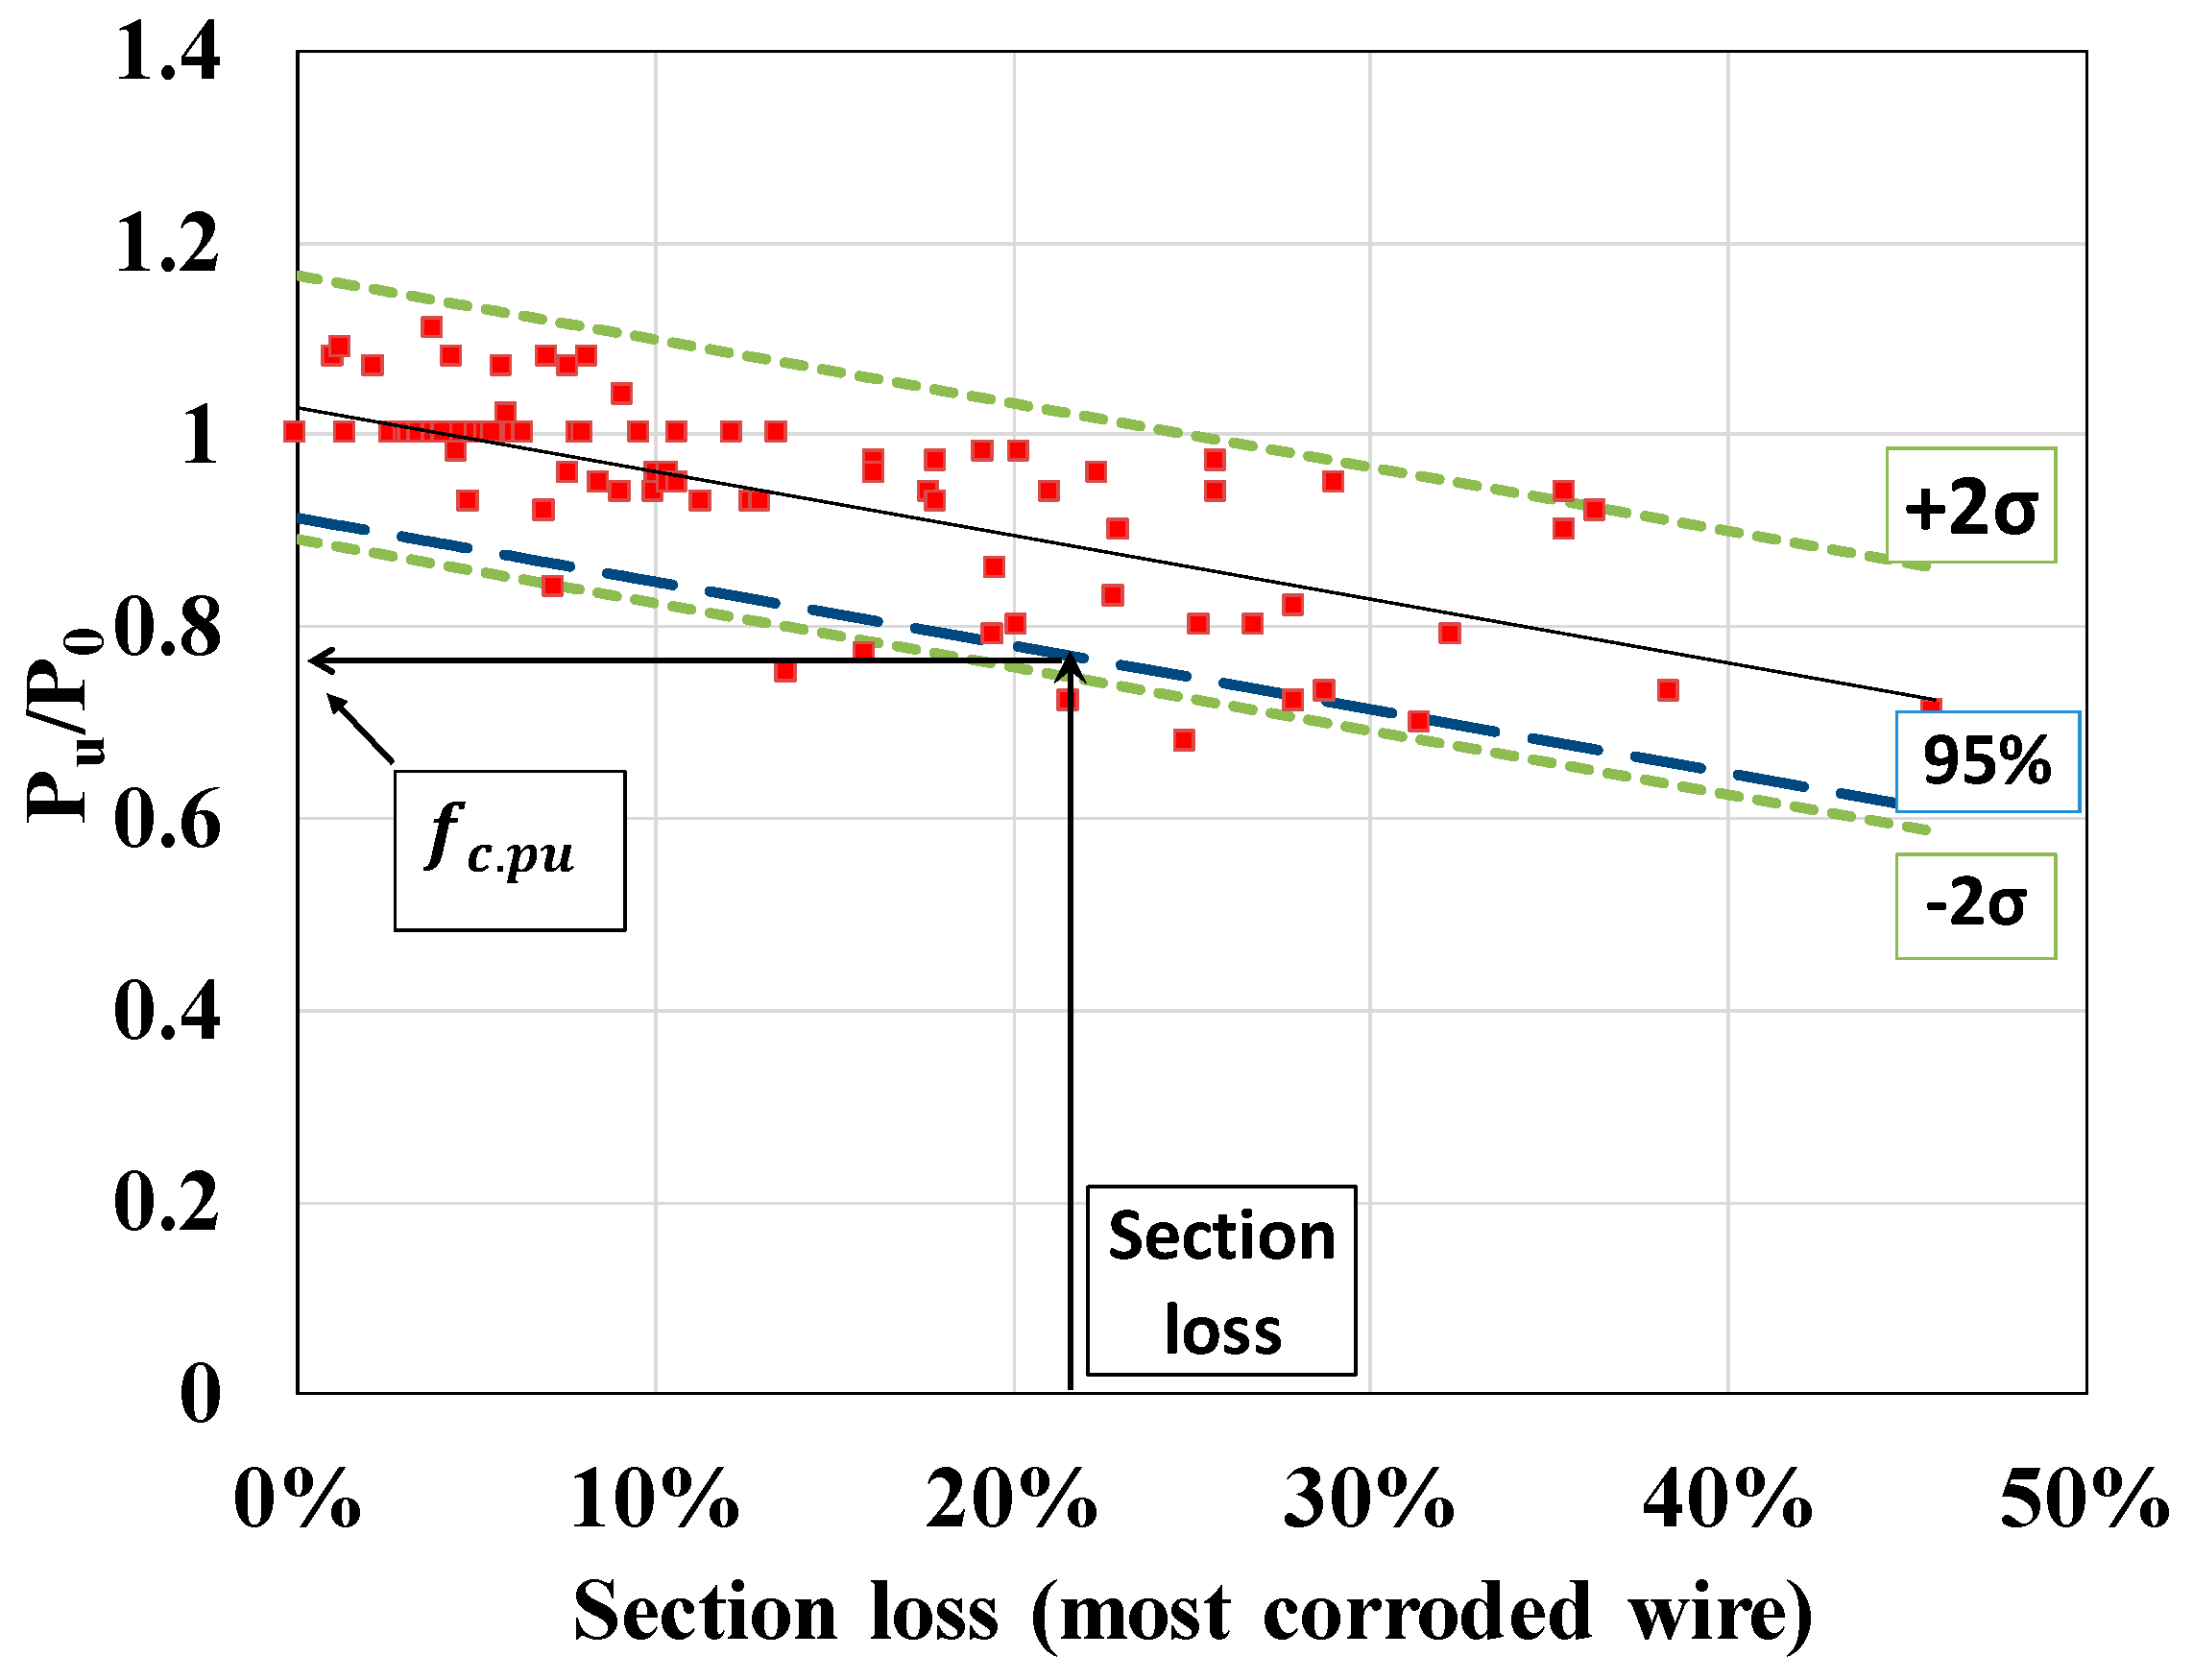
4.3. Determination of the Flexural Strength of a Corroded PSC Beam
5. Conclusions
- (1)
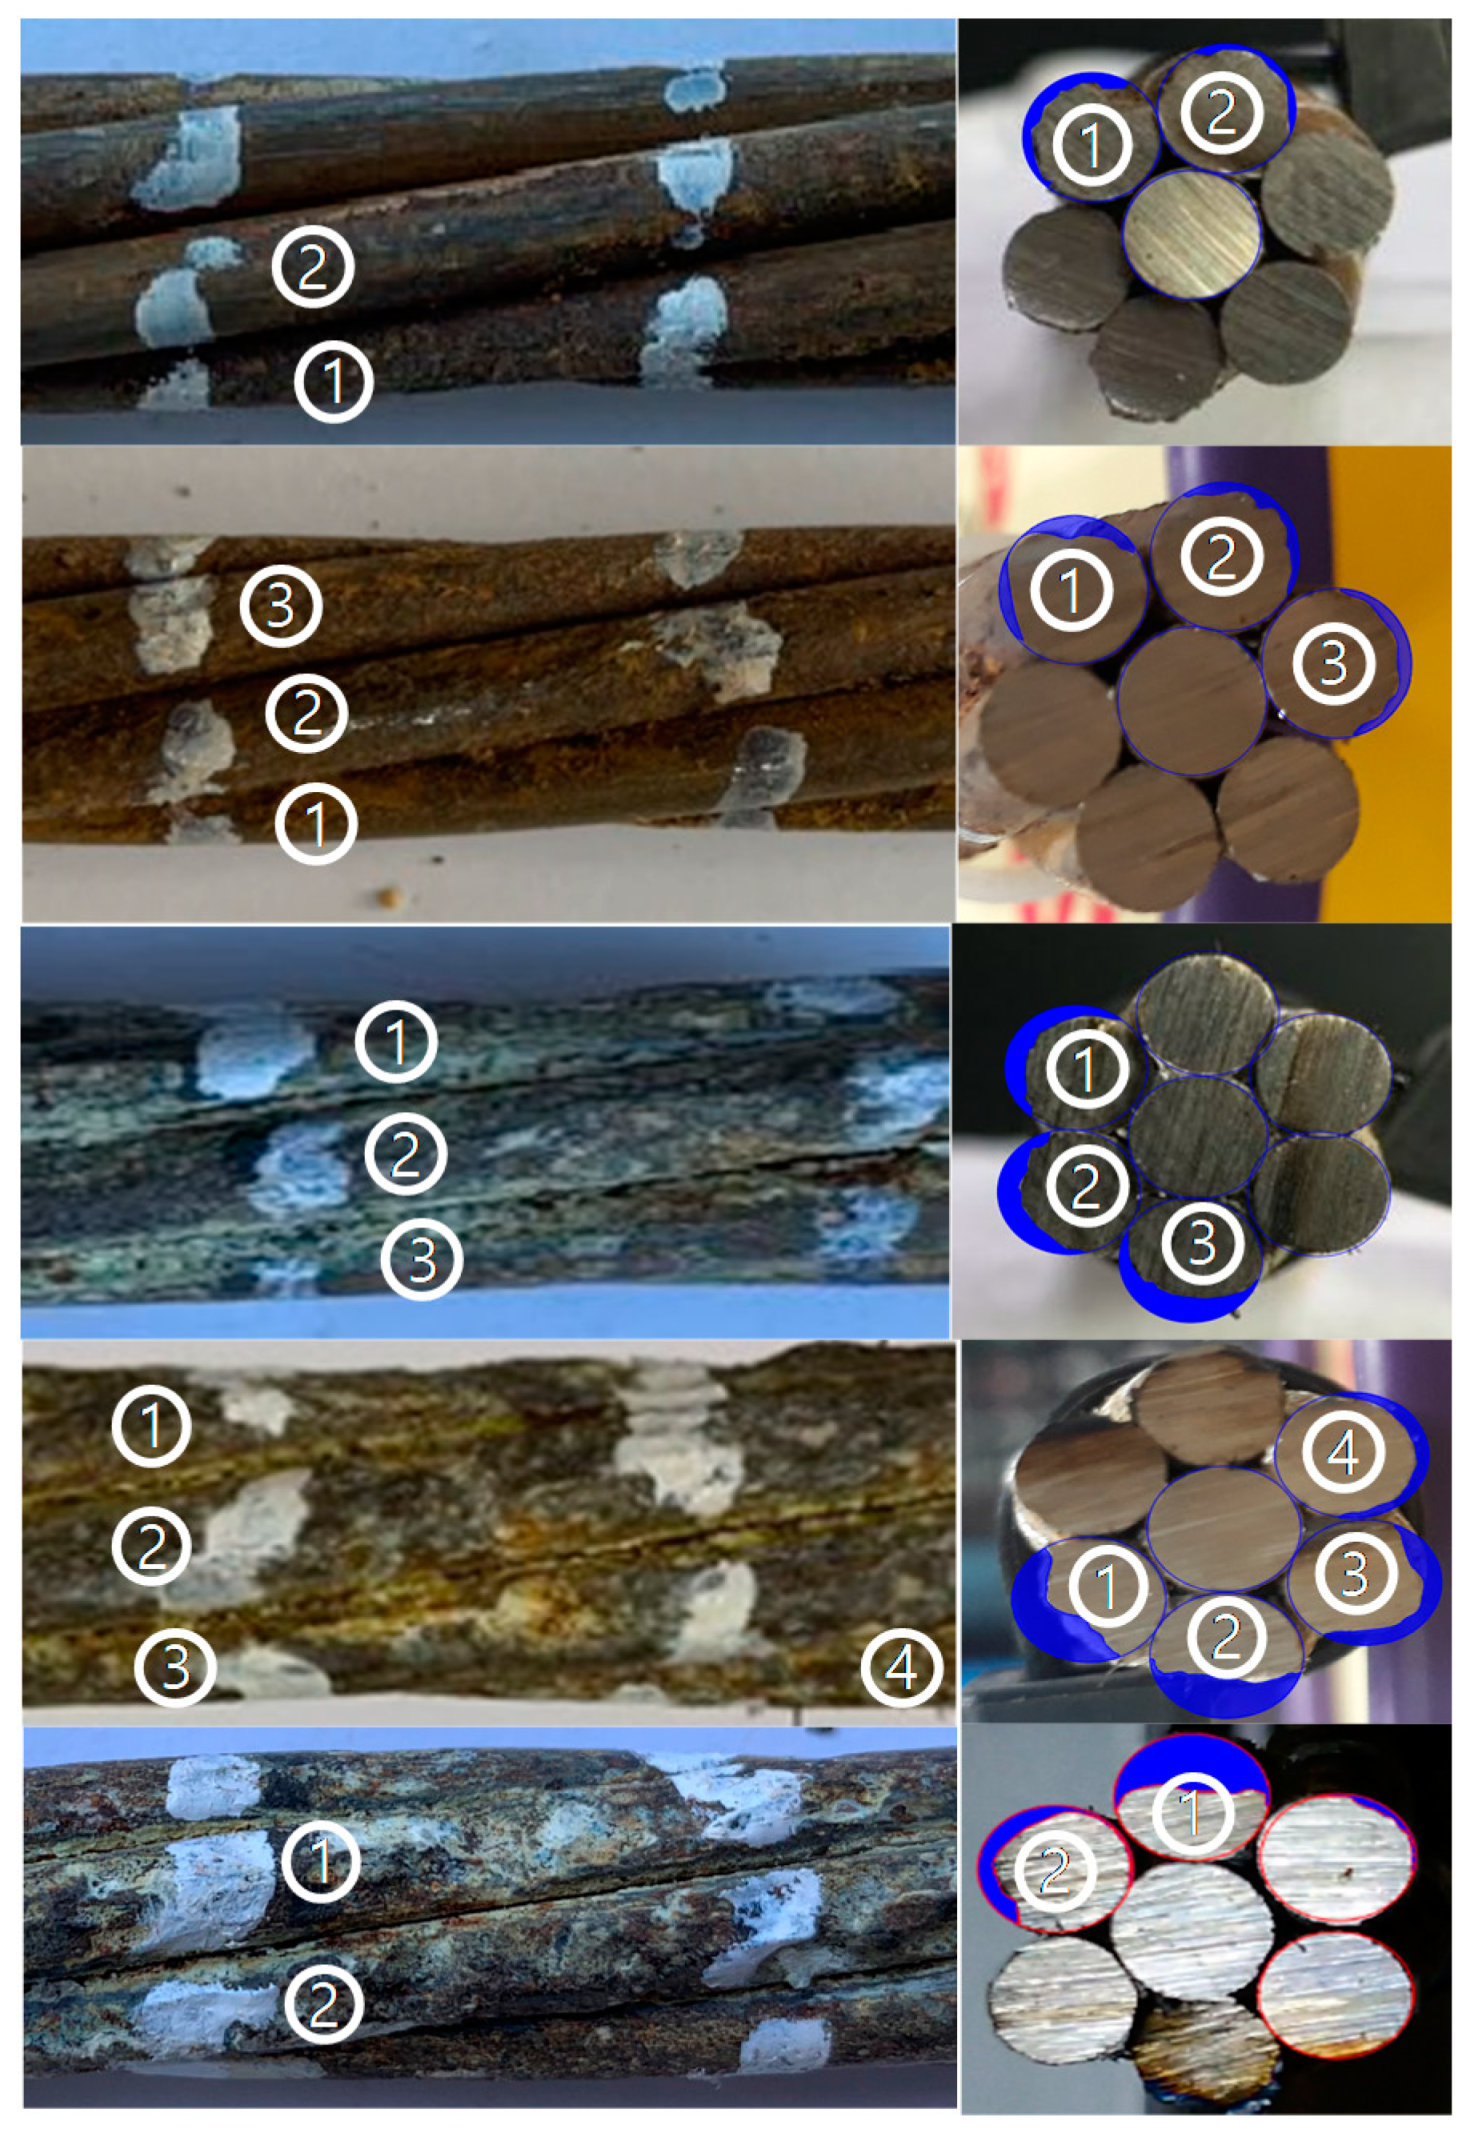
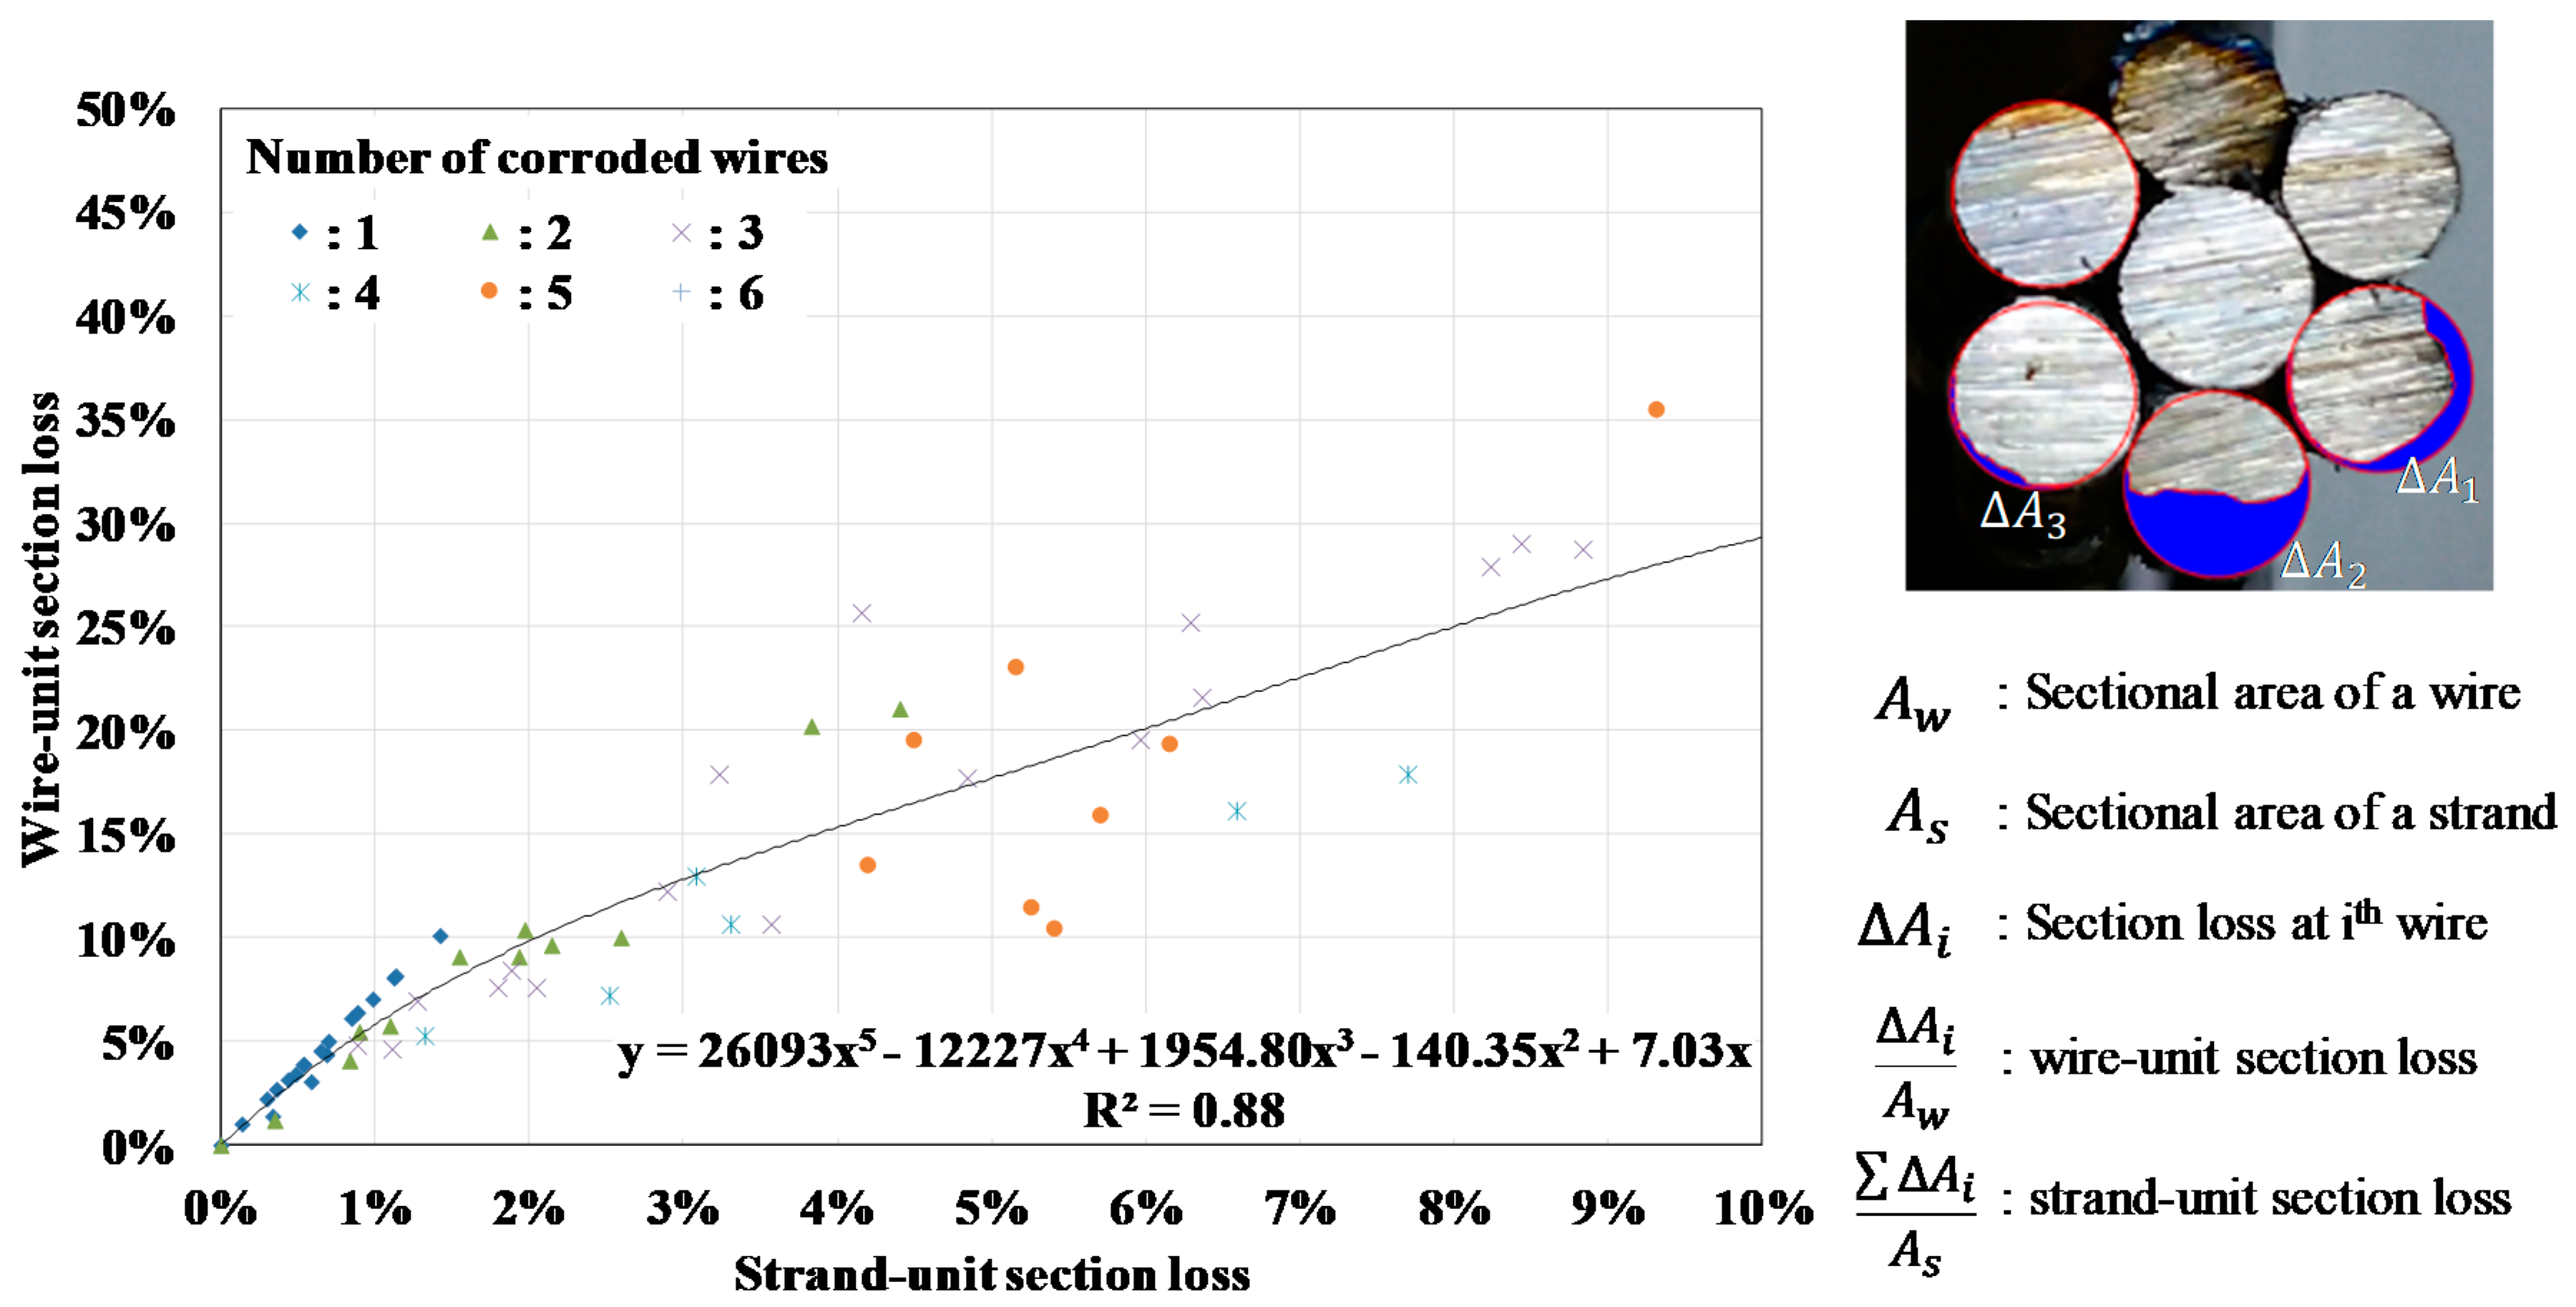
- A higher number of corroded wires in one strand tends to be associated with a higher level of corrosion (section loss) in the wire. This indicates that the corrosion reactions continue to occur in some wires, and once a certain level of corrosion occurs, other wires also begin to corrode. Because a plurality of strands is bundled together in one tendon due to tension, the inner wires are protected from corrosive conditions as compared to the outermost wires; therefore, inner wires corrode sequentially after the outer wires are sufficiently corroded.
- (2)
- The maximum wire-unit corrosion in a strand can be very different between corroded strands, even though they have the same level of strand-unit corrosion. If the strand fracture is defined as the moment at which a single wire fractures, it is necessary to consider the cross-sectional loss in the wire, after at least a 2% section loss of a strand.
- (3)
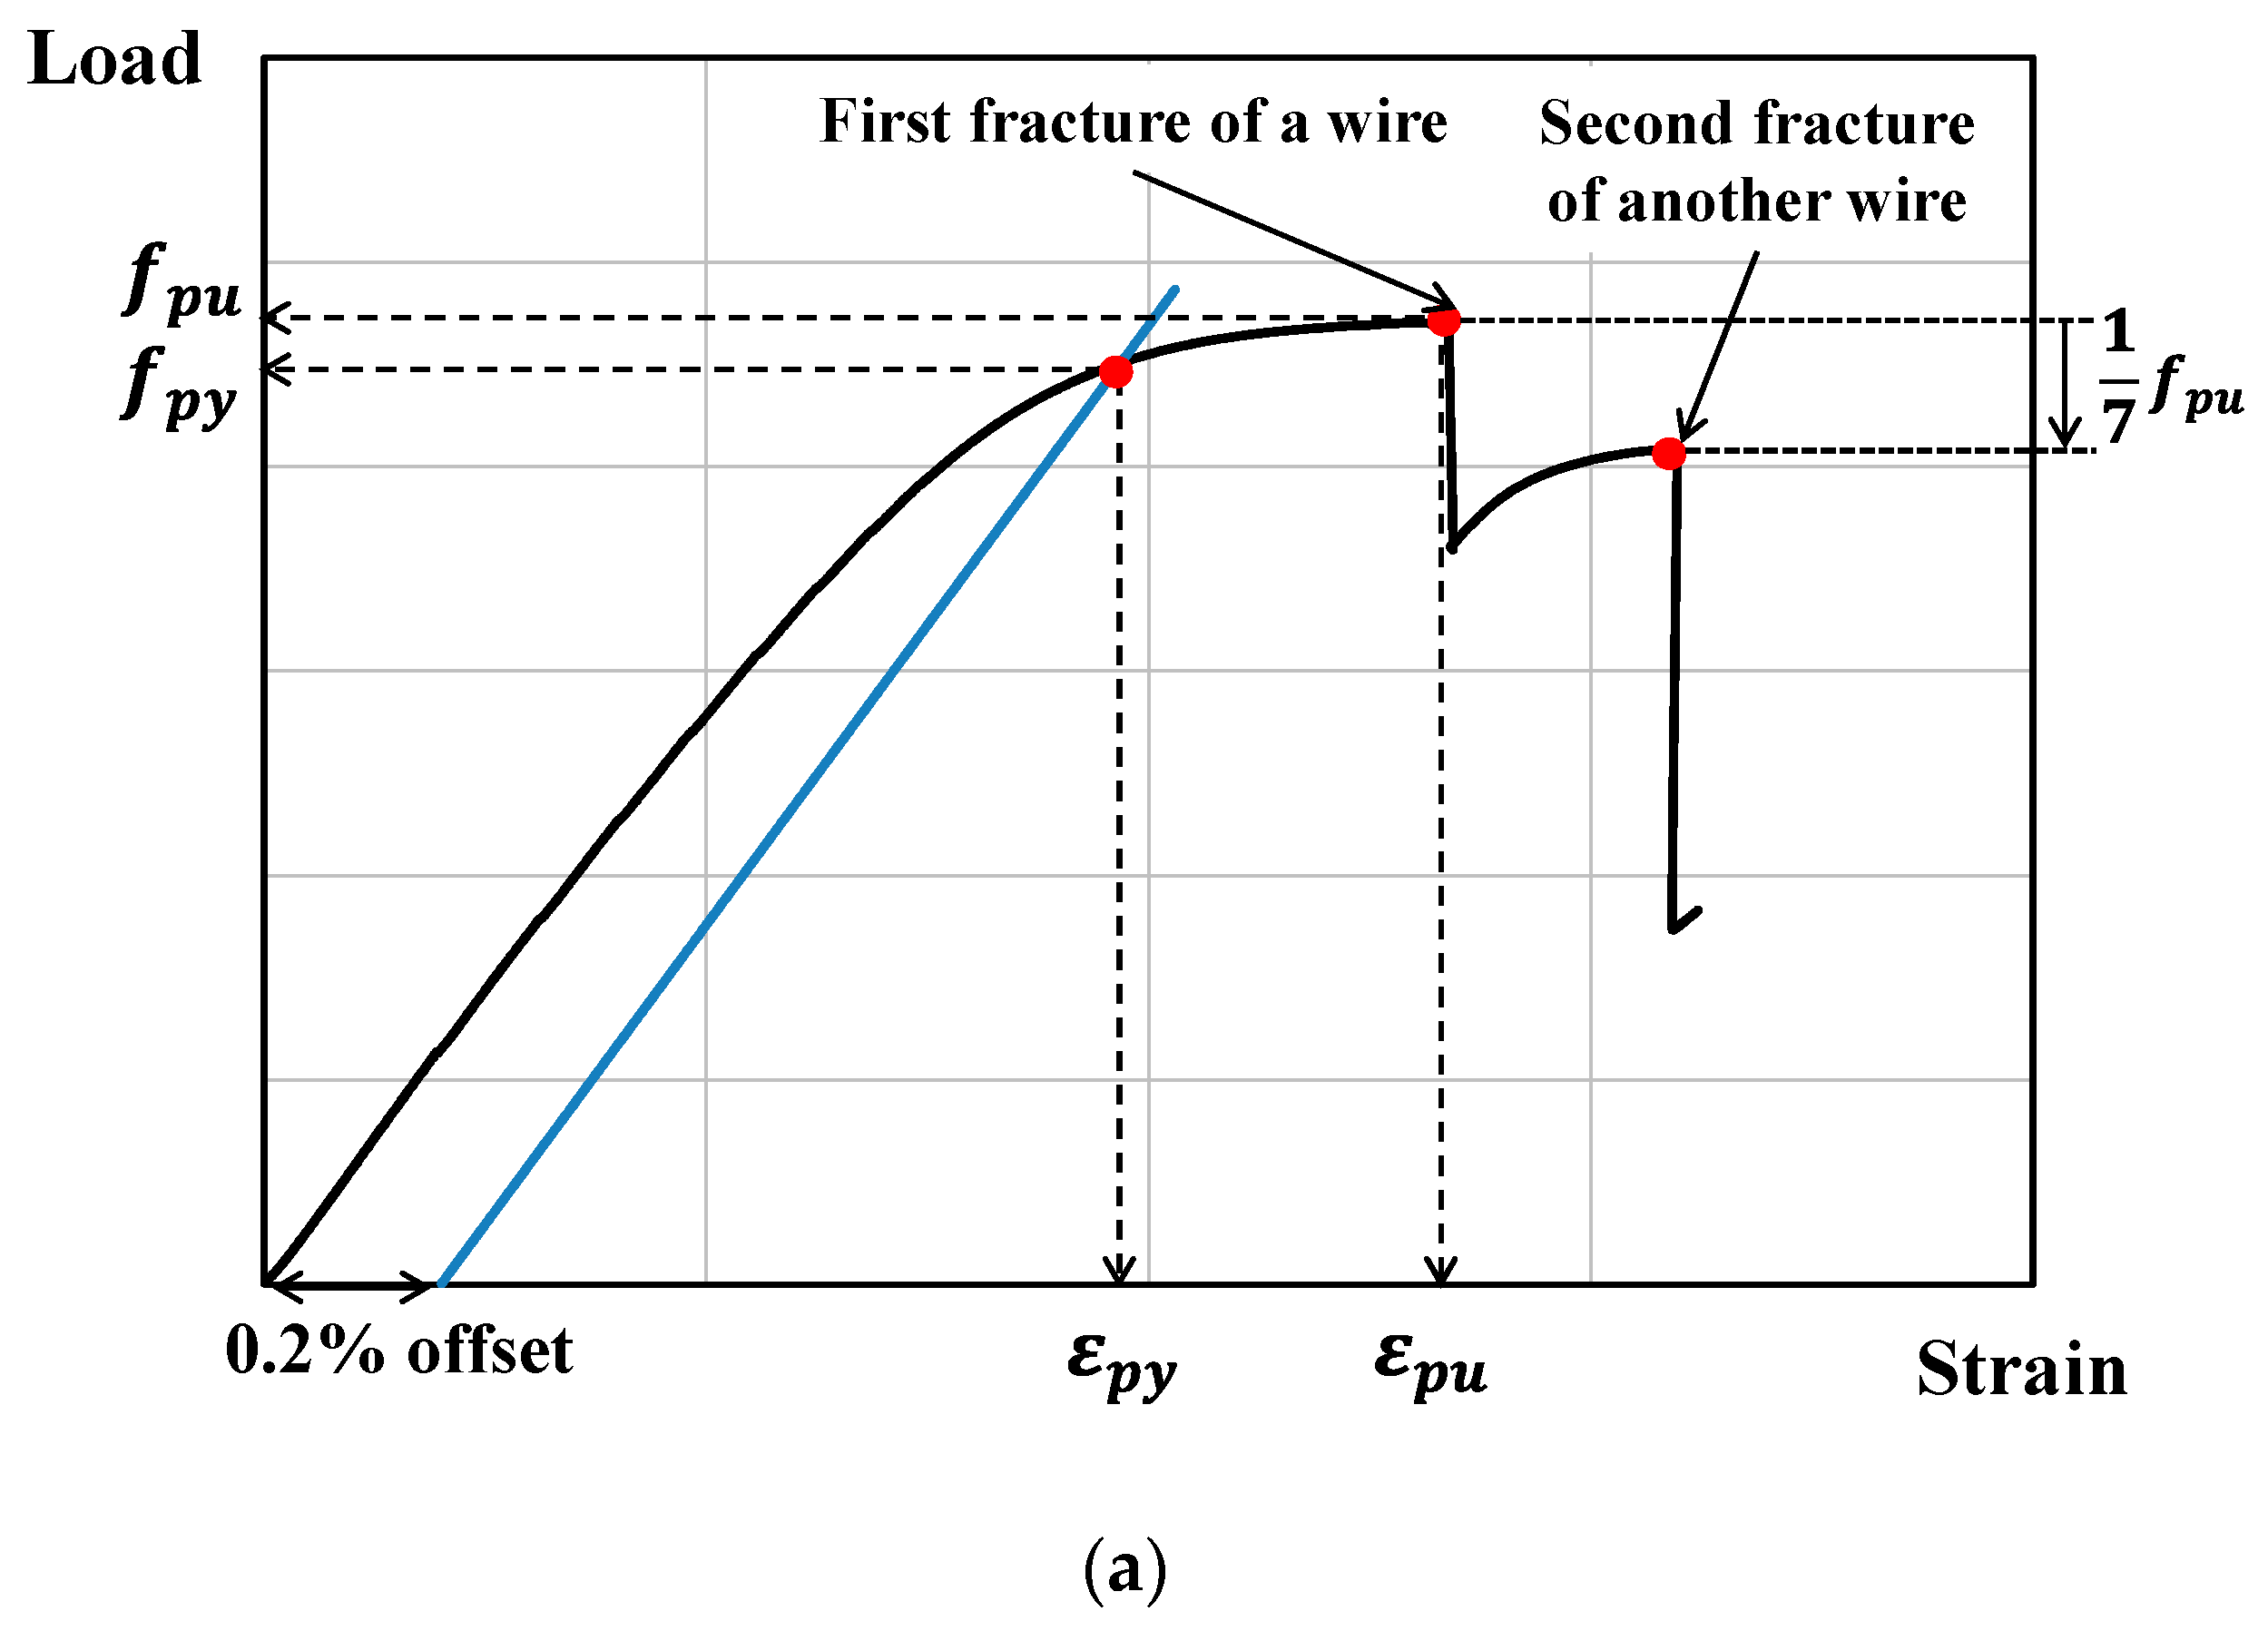
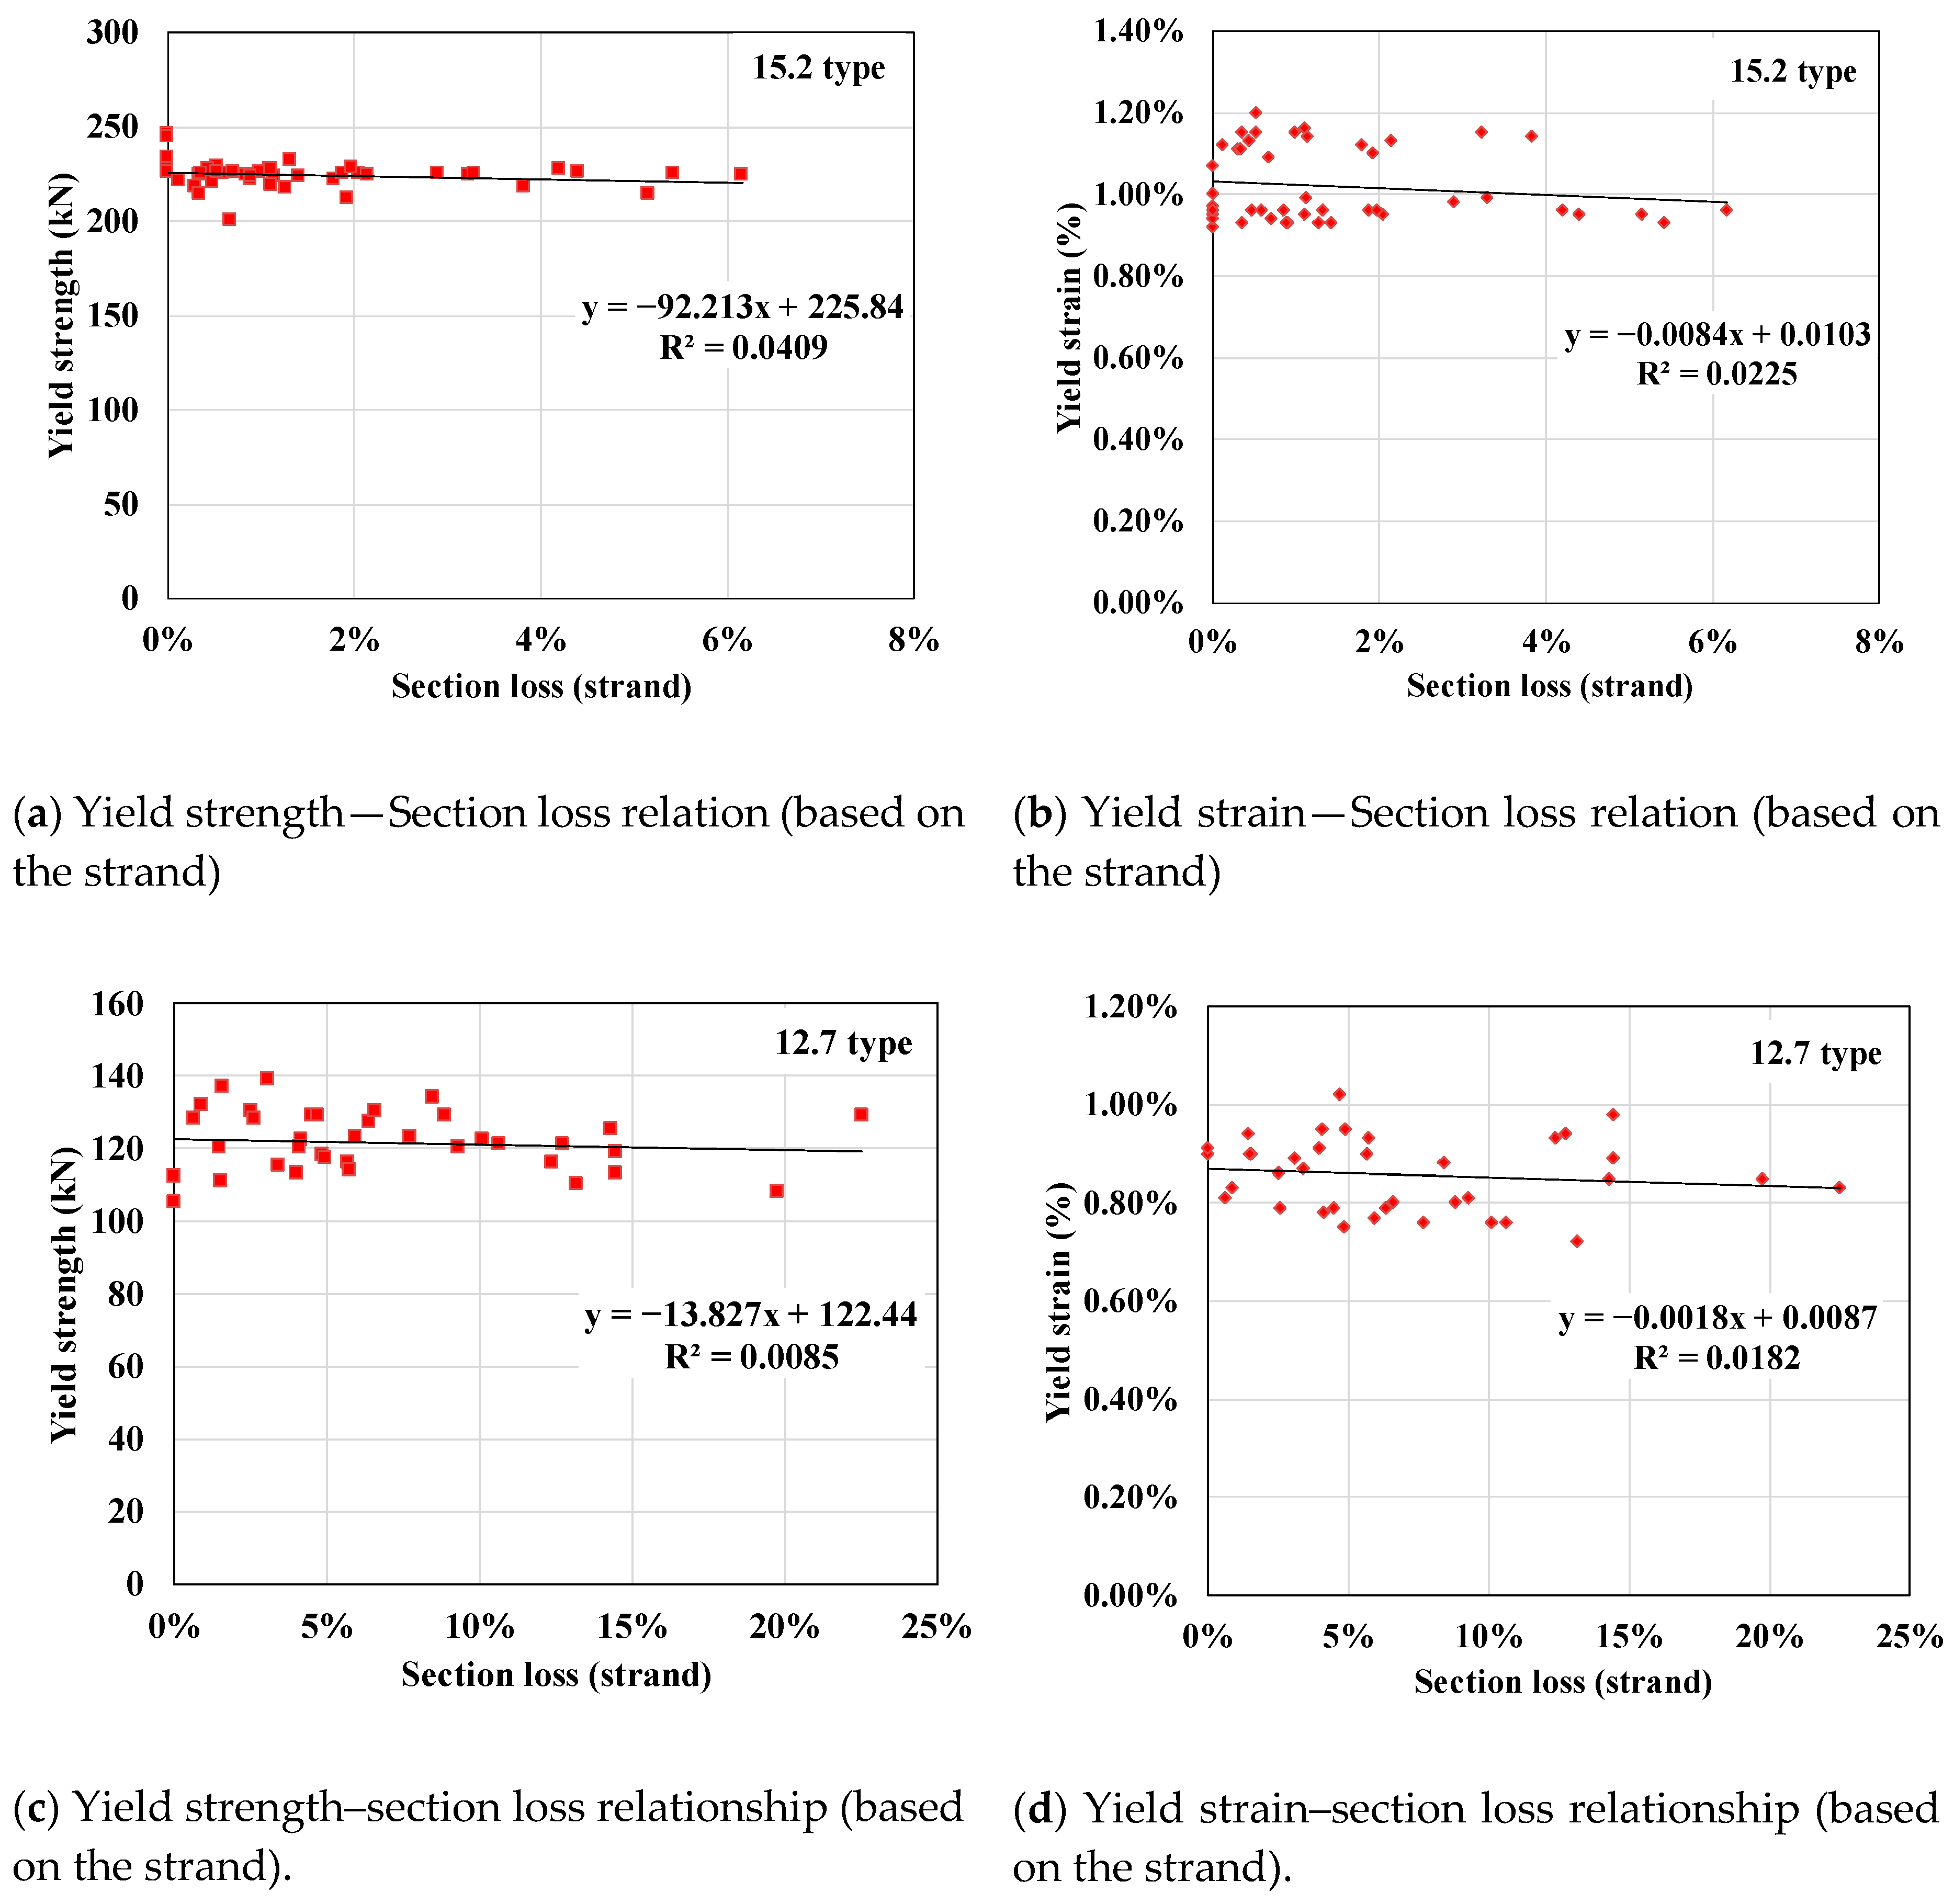
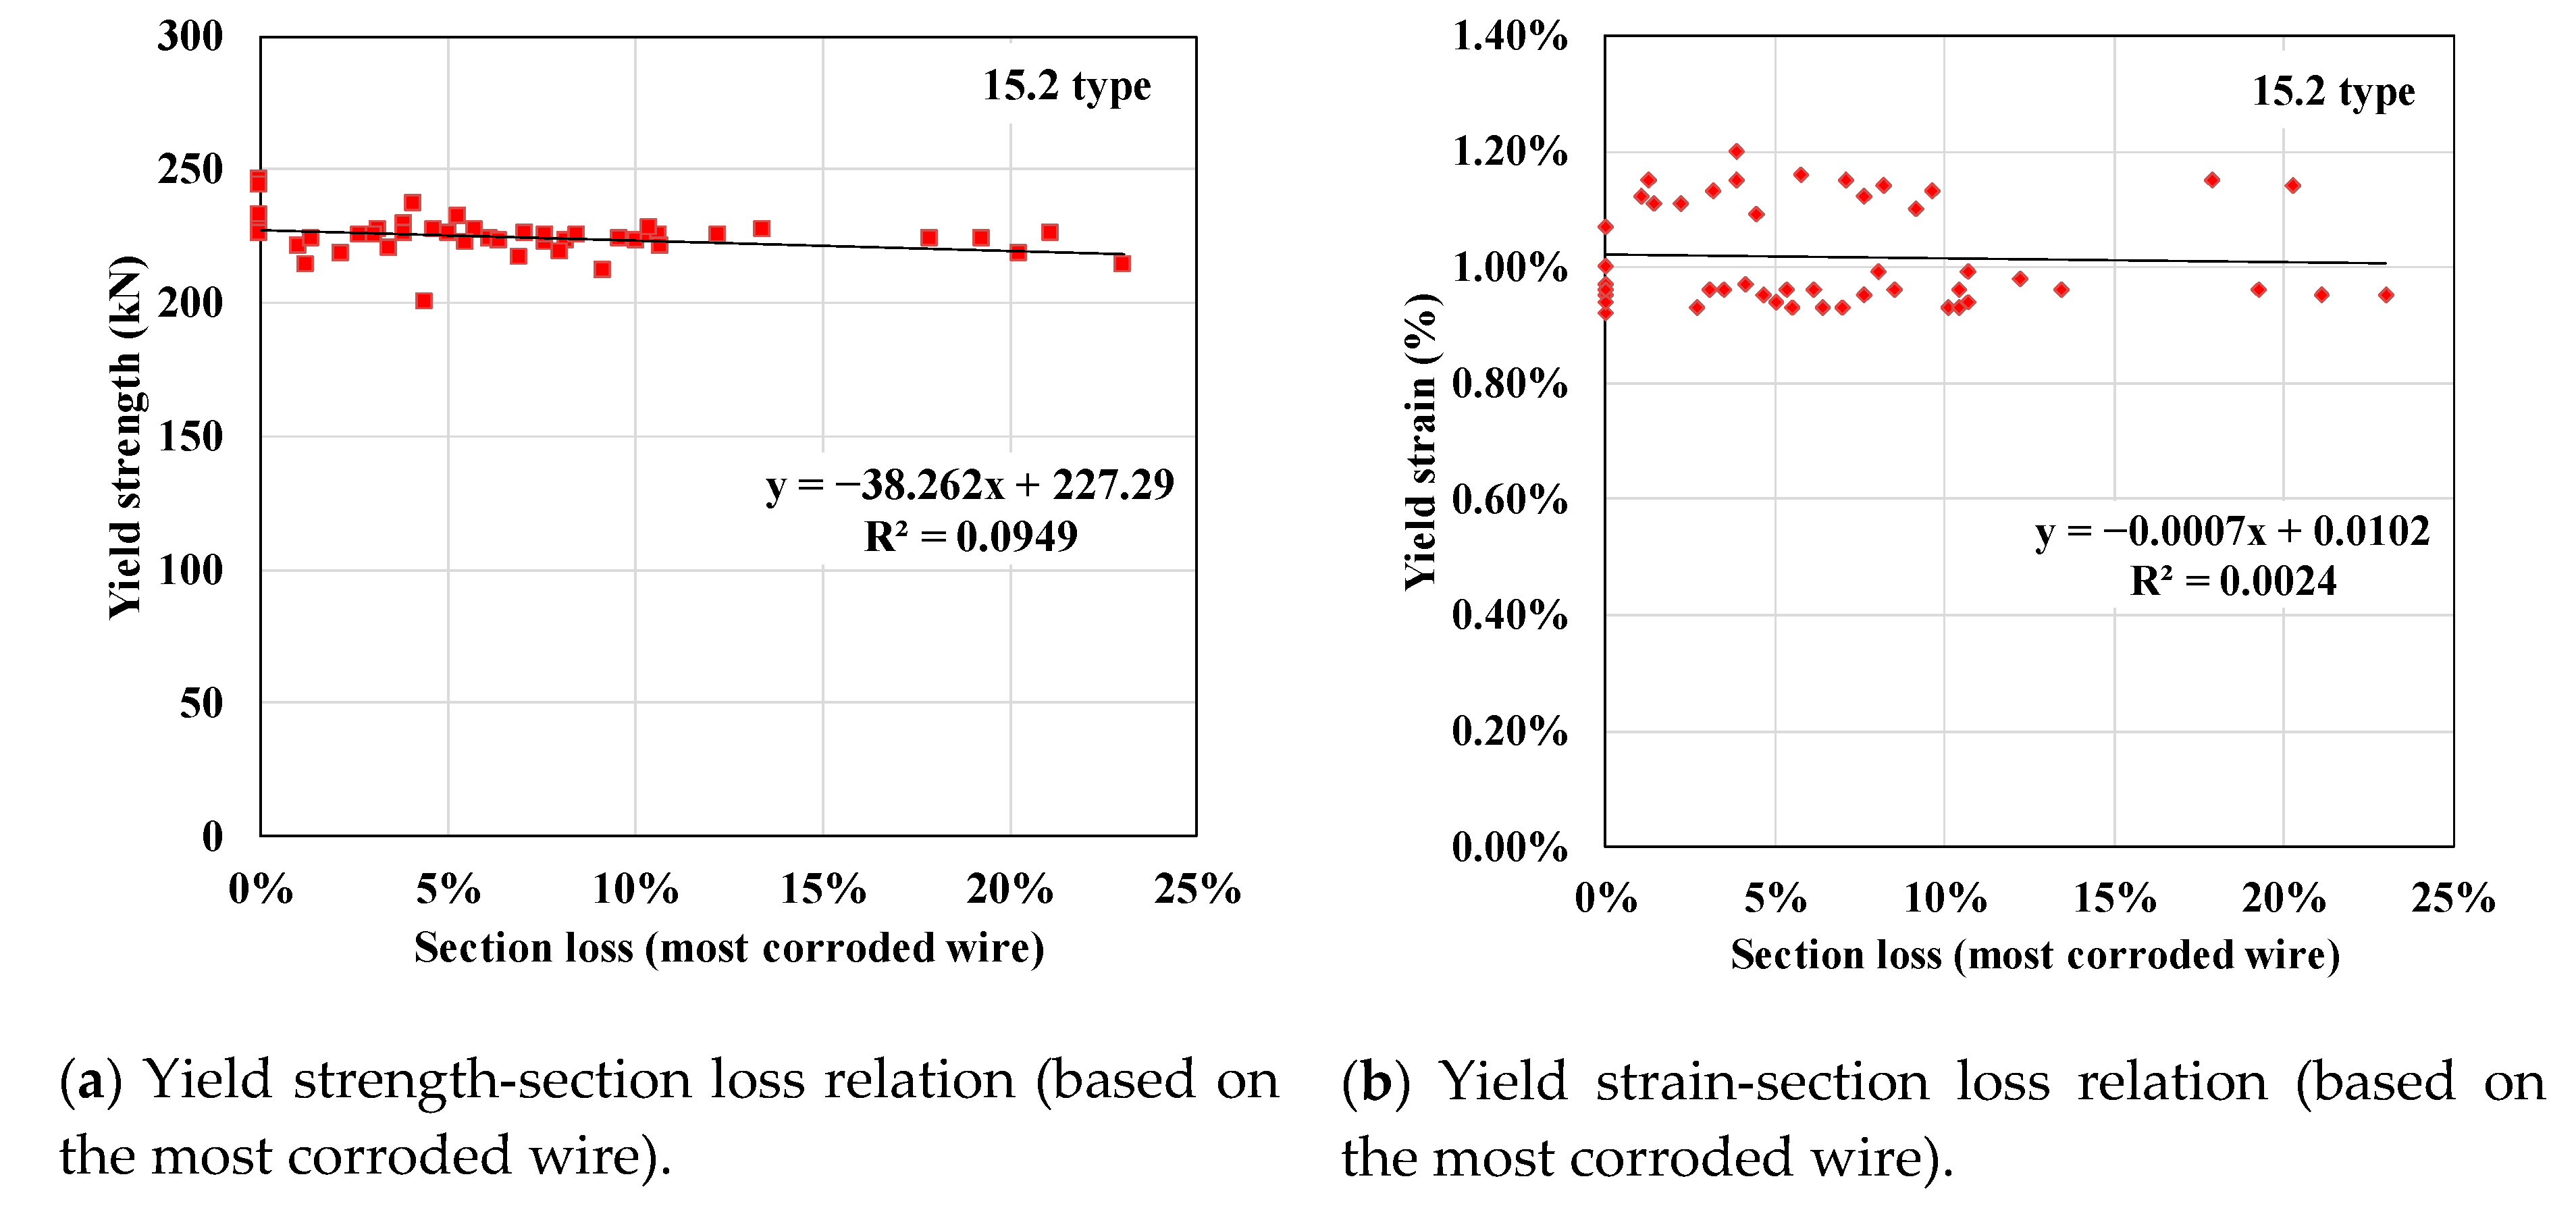
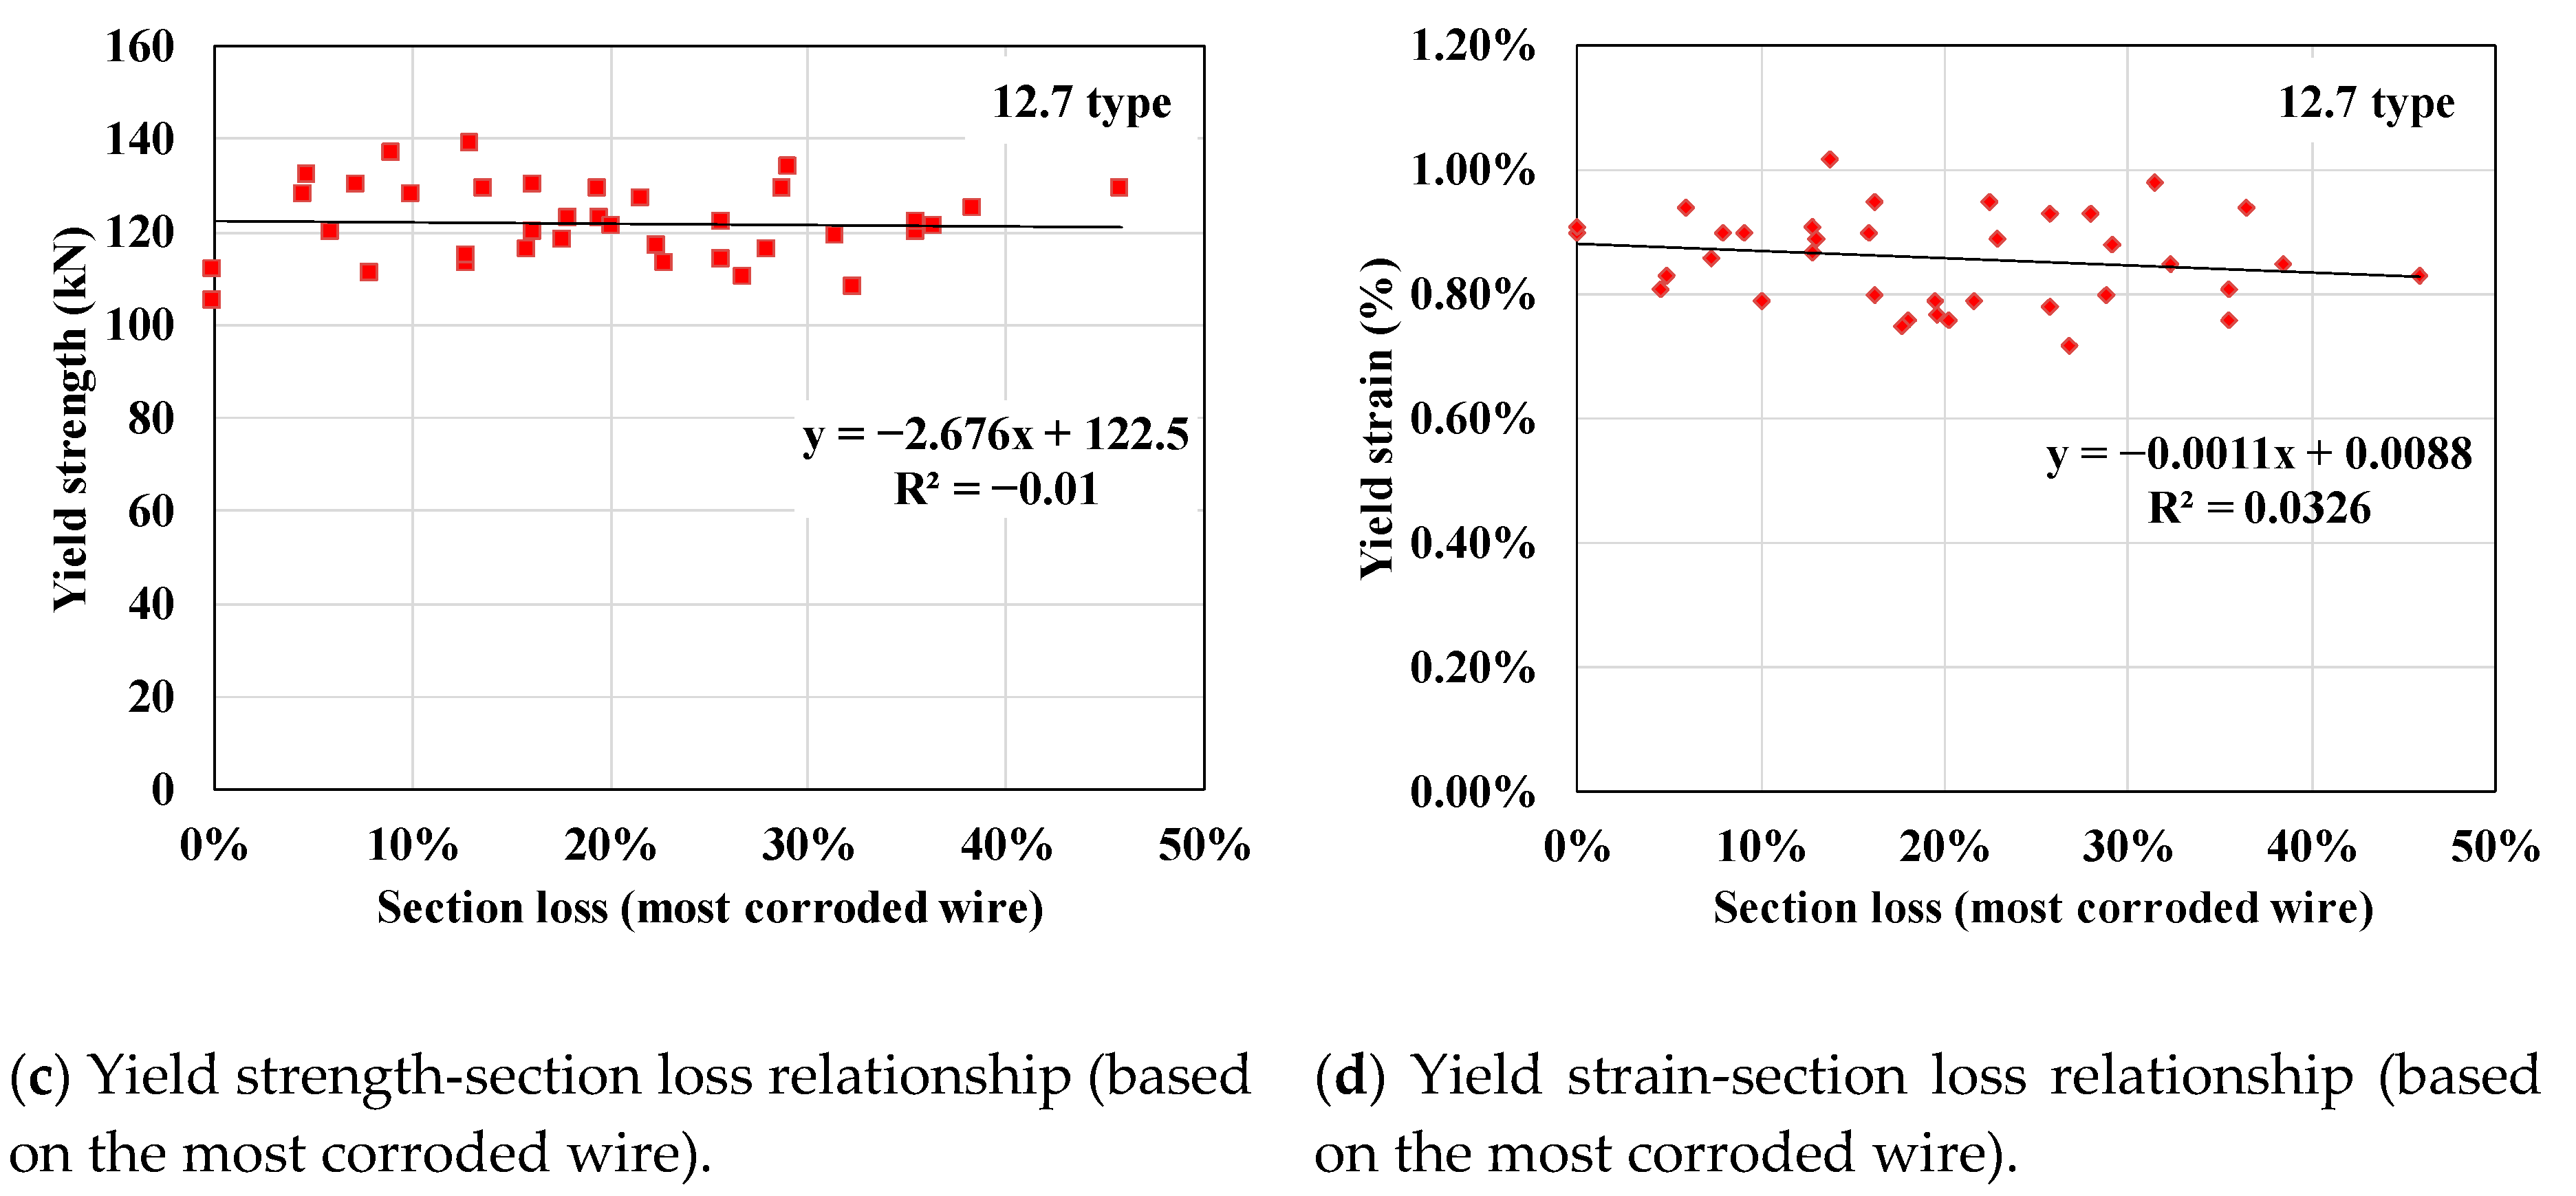
- Within the wire-unit section loss of 45.79% and the strand-unit section loss of 22.52% (the most corroded specimen among the 86 specimens), the yield strength and strain showed no significant gap even under the increase of section loss, because even if one wire reaches a yield first due to cross-sectional loss, the remaining wires can carry the load until they yield. However, the yield strength is likely to decrease if the number of corroded wires and the corrosion level are high.
- (4)
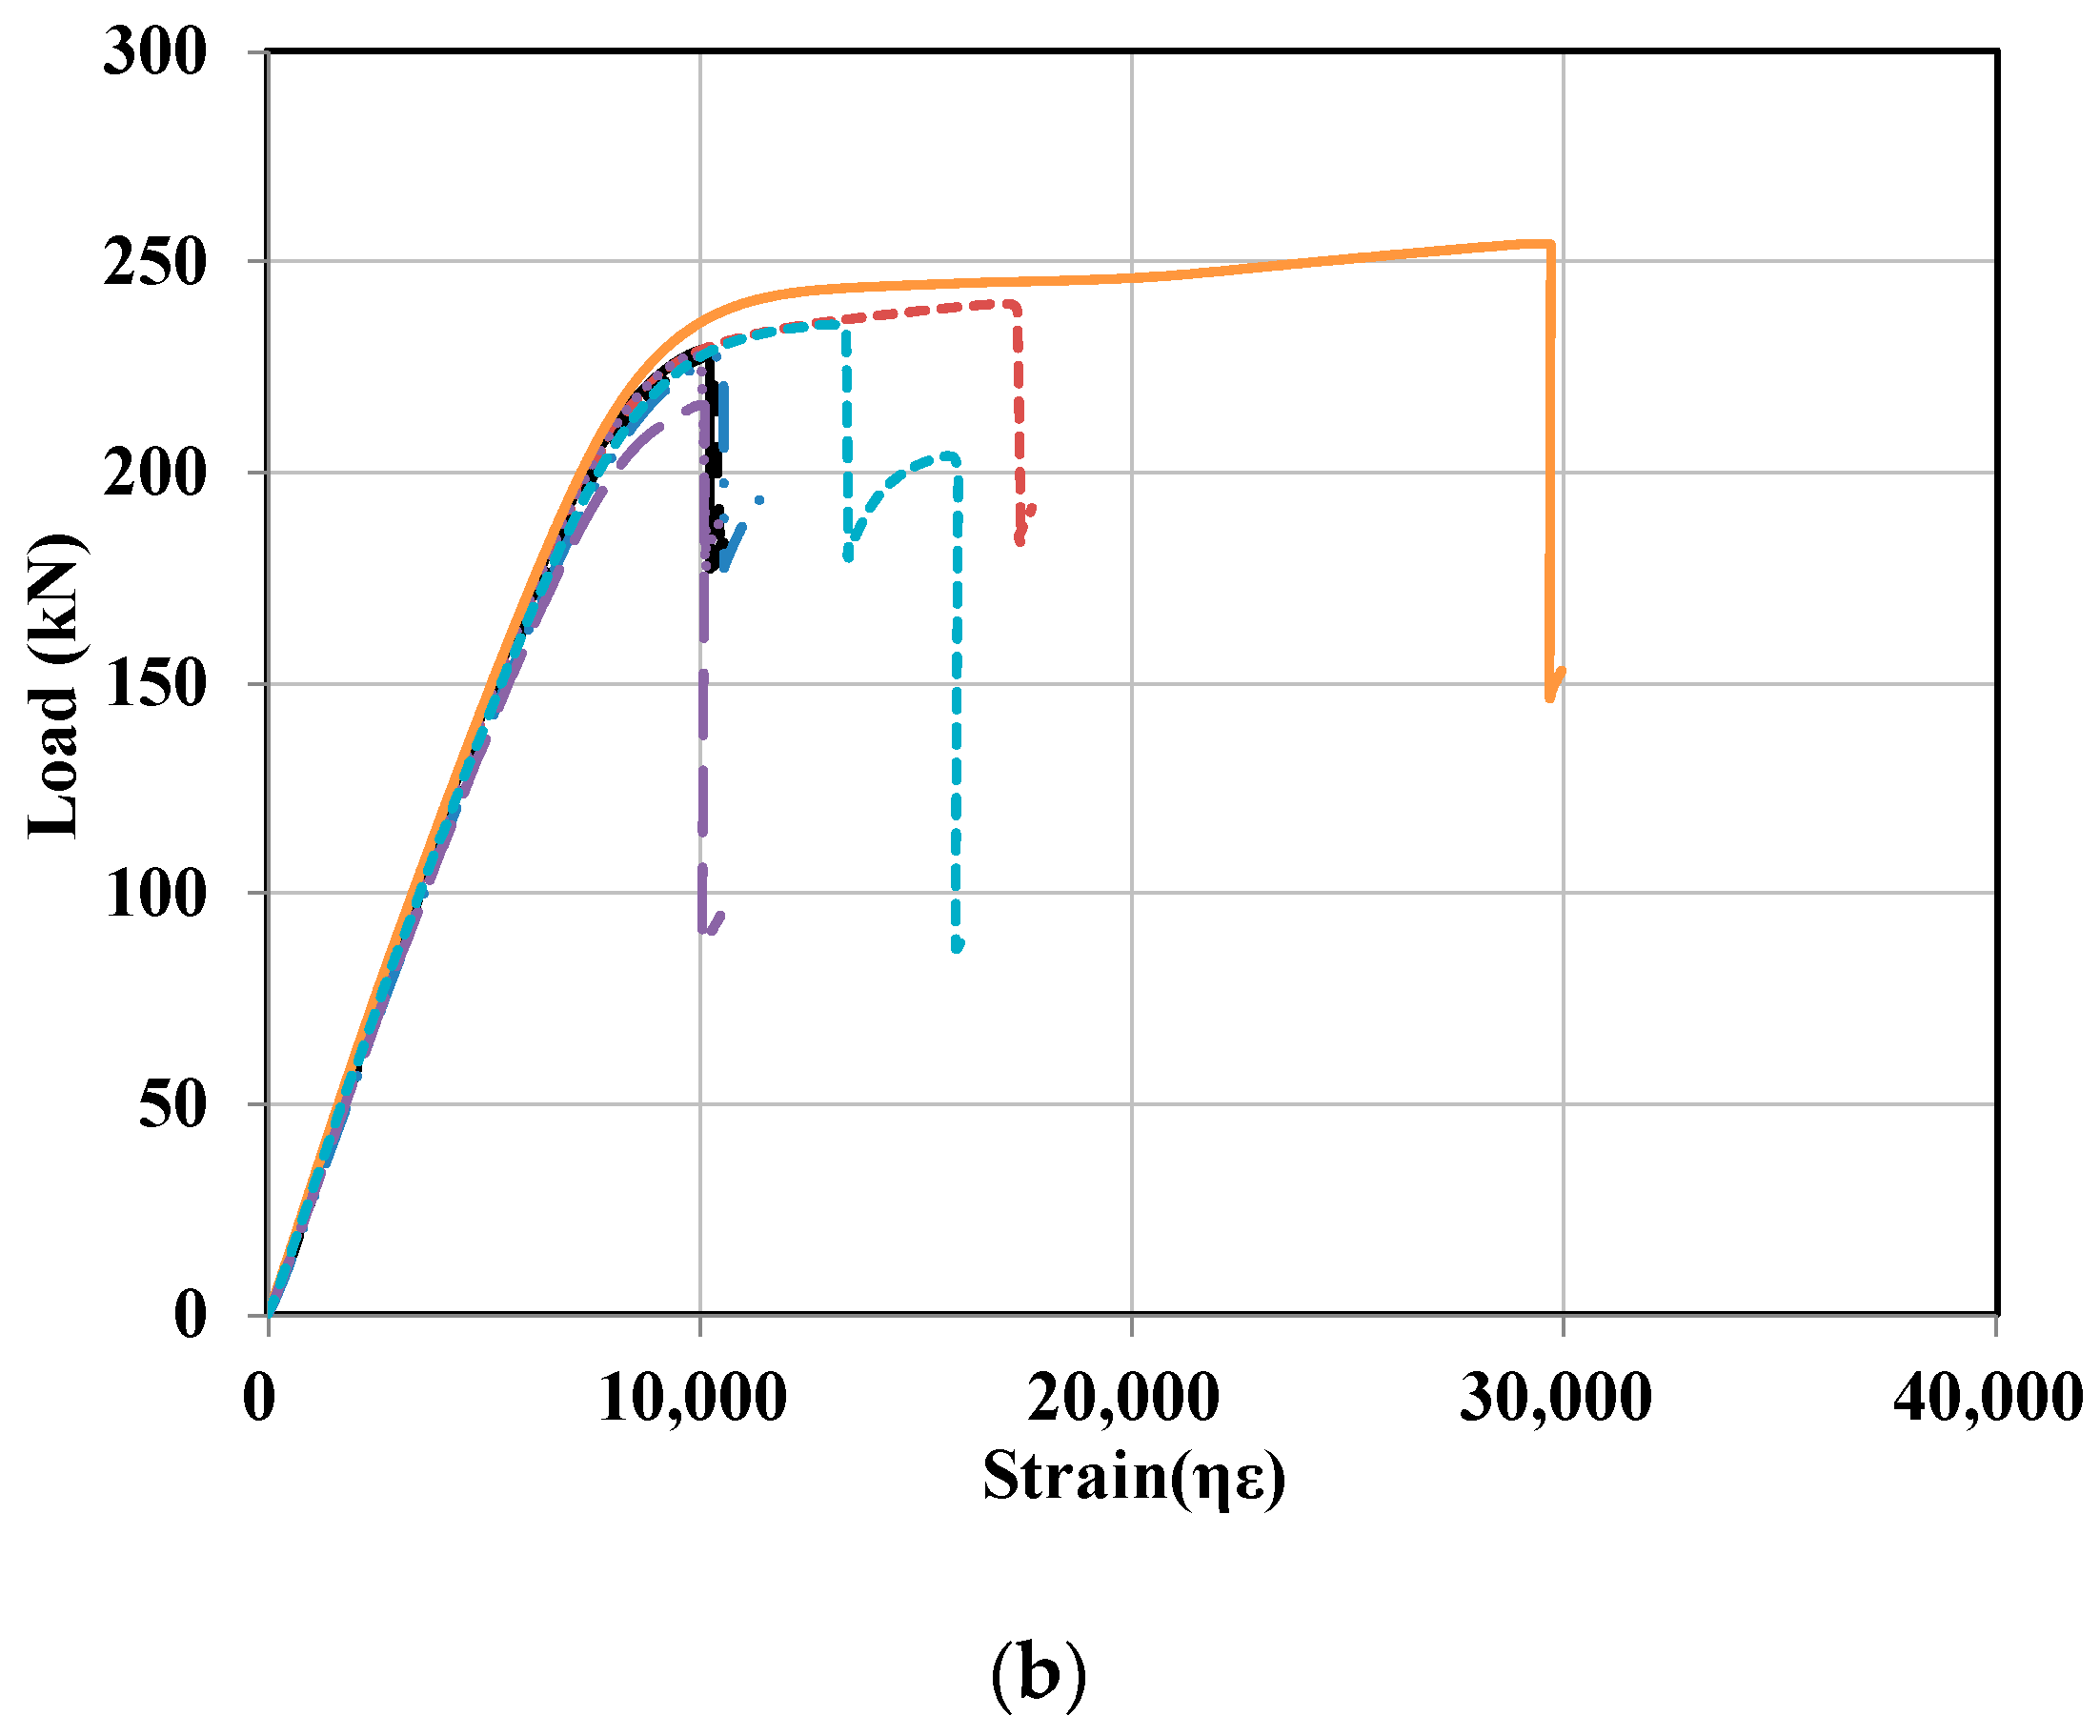
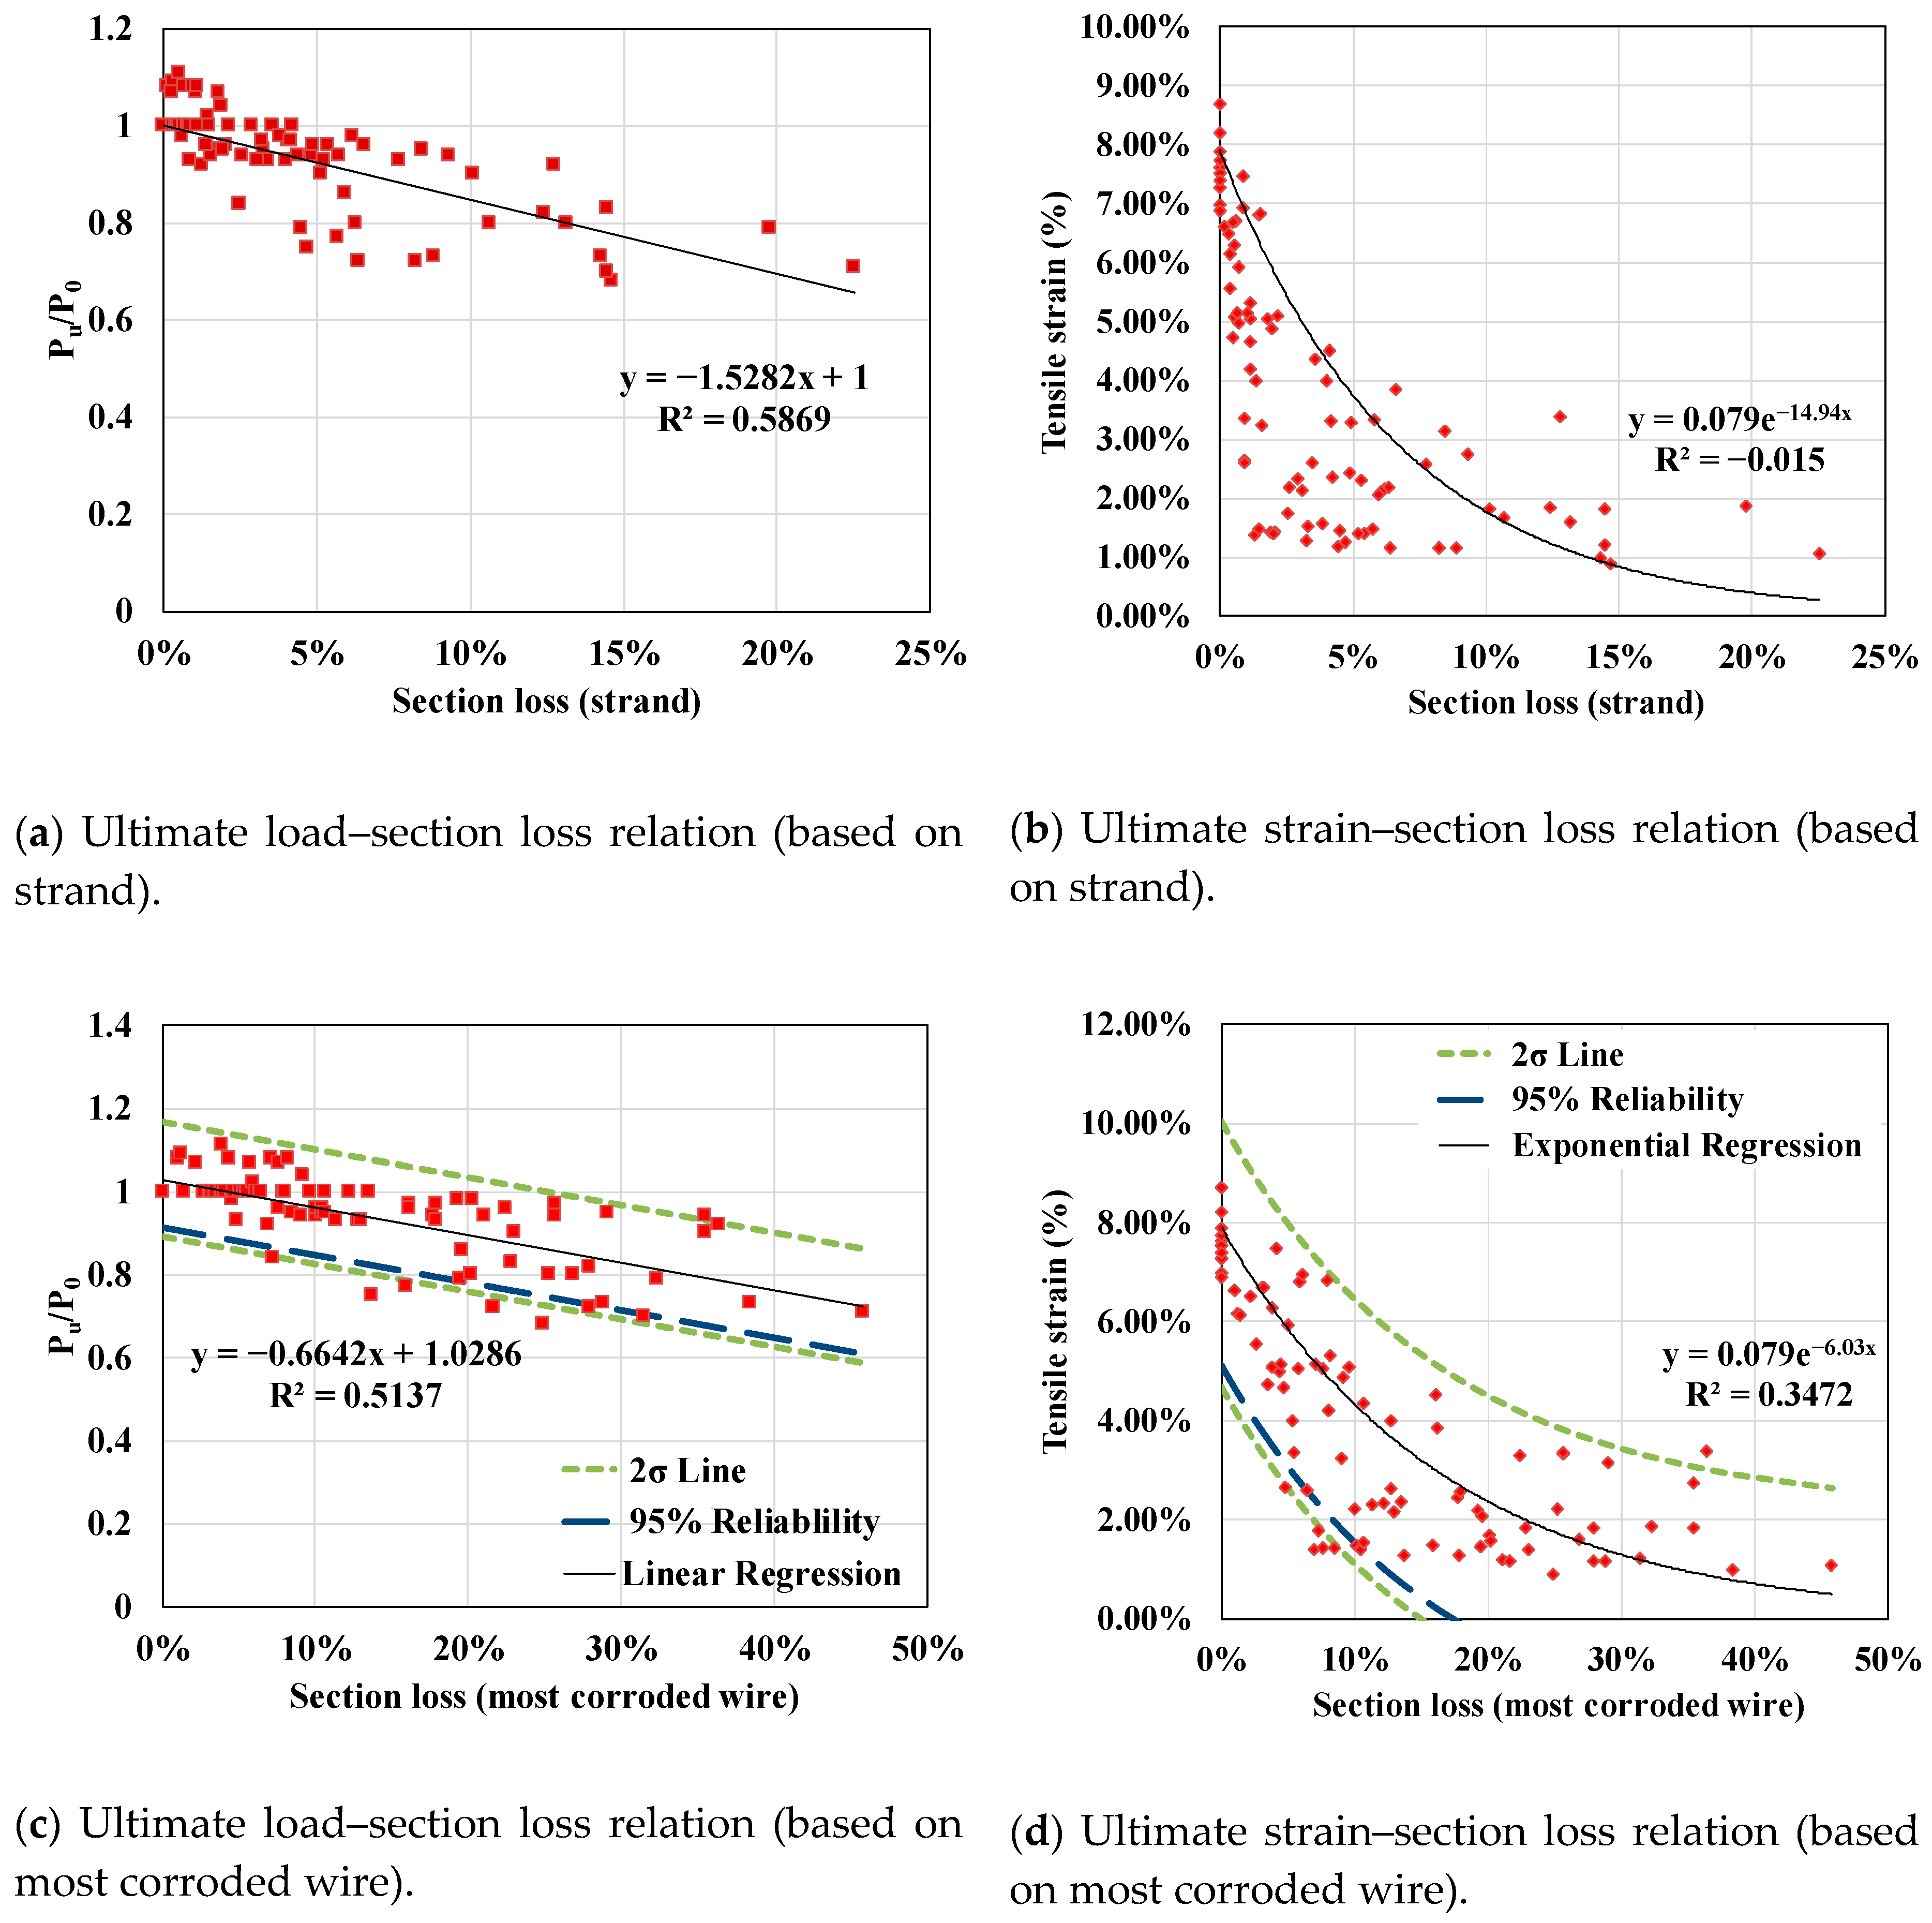
- The ultimate strength and strain for the corroded strand were introduced by the lower limit curve of 95% reliability from the tensile test result. The ultimate strength proportionally decreased; the ultimate strength was reduced by 39.11% if the wire-unit section loss was 45.79% based on the lower limit curve of 95% reliability. The ultimate strain of the corroded strand could not meet the requirement of minimum tensile strain (3.5%) from KS D 7002 [21] if the wire-unit section loss exceeded approximately 4%. Formulas for the lower limit curve of 95% reliability were also introduced.
- (5)
- Based on the test results of the PSC beam specimens with a single corroded strand, a method to evaluate the flexural strength using was suggested. The proposed method showed an approximate estimate of flexural strength with a difference of 4.72% on average; however, it is limited to considering the rapid reduction of the ultimate strain of corroded strands.
Author Contributions
Funding
Acknowledgments
Conflicts of Interest
References
- VDOT. Evaluation of Grout and Strands at 13 Tendon Locations and Selected Vertical Pt Bars at Fixed Piers: Maintenance and Repair Using Corrosion Mitigation Systems (Final Report); Virginia Department of Transportation: Richmond, VA, USA, 2013. [Google Scholar]
- Trejo, D.; Hueste, M.B.D.; Gardoni, P.; Pillai, R.G.; Reinschmidt, K.; Im, S.B.; Kataria, S.; Hurlebaus, S.; Gamble, M.; Ngo, T.T. Effect of Voids in Grouted Post-Tesioned Concrete Bridge Construction: Electrochemical testing and Reliability Assessment; Texas Transportation Institute: Austin, TX, USA, 2009. [Google Scholar]
- Carsana, M.; Bertolini, L. Corrosion failure of post-tensioning tendons in alkaline and chloride-free segregated grout: A case study. Struct. Infrastruct. Eng. 2015, 11, 402–411. [Google Scholar] [CrossRef]
- Suguru, K.; Yasushi, T.; Takayuki, Y.; Takumi, S. Evaluation of mechanical properties of corroded PC strand and residual strength of pre-tensioned PC beam. Proc. Symp. Dev. Prestress. Concr. 2012, 21, 211–216. (In Japanese) [Google Scholar]
- Wu, X.; Li, H. Effect of Strain Level on Corrosion of Prestressing Steel Strands; International Association for Bridge and Structural Engineering: Zurich, Switzerland, 2016; pp. 292–299. [Google Scholar]
- Rinaldi, Z.; Imperatore, S.; Valente, C. Experimental evaluation of the flexural behavior of corroded P/C beams. Constr. Build. Mater. 2010, 24, 2267–2278. [Google Scholar] [CrossRef]
- ASTM G1-03. Standard Practice for Preparing, Cleaning, and Evaluating Corrosion Test Specimens; ASTM International: West Conshohocken, PA, USA, 2017. [Google Scholar]
- ASTM G49-94. Standard Guide for Examination and Evaluation of Pitting Corrosion1; ASTM International: West Conshohocken, PA, USA, 2005. [Google Scholar]
- Reis, R.A. Corrosion Evaluation and Tensile Results of Selected Post-Tensioning Strands at the SFOBB Skyway Seismic Replacement Project; California Department of Transportation: Sacramento, CA, USA, 2007.
- Lu, Z.H.; Li, F.; Zhao, Y.G. An Investigation of Degradation of Mechanical Behaviour of Prestressing Strands Subjected to Chloride Attacking. In Proceedings of the International Conference on Durability of Concrete Structures, Shenzhen, China, 30 June–1 July 2016. [Google Scholar]
- Val, D.V.; Melchers, R.E. Reliability of Deteriorating RC Slab Bridges. J. Struct. Eng. ASCE 1997, 123, 1638–1644. [Google Scholar] [CrossRef]
- Stewart, M.G. Mechanical behaviour of pitting corrosion of flexural and shear reinforcement and its effect on structural reliability of corroding RC beams. Struct. Saf. 2009, 31, 19–30. [Google Scholar] [CrossRef]
- Hartt, W.H.; Lee, S.K. Projecting Corrosion-Induced Bridge Tendon Failure Resulting from Deficient Grout: Part I–Model Development and Example Results. Corrosion 2016, 72, 991–998. [Google Scholar] [CrossRef]
- Yoo, C.H.; Park, Y.C.; Kim, H.K. Modeling Corrosion Progress of Steel Wires in External Tendons. J. Bridge Eng. 2018, 23, 04018098. [Google Scholar] [CrossRef]
- Jeon, C.H.; Lon, S.; Shim, C.S. Equivalent material model of corroded prestressing steel strand. J. Mater. Res. Technol. 2019, 8, 2450–2460. [Google Scholar] [CrossRef]
- Lee, J.B.; Lee, Y.J.; Shim, C.S. Probabilistic prediction of mechanical characteristics of corroded strands. Eng. Struct. 2020, 203, 109882. [Google Scholar] [CrossRef]
- KS F 2713. Testing Method for Analysis of Chloride in Concrete and Concrete Materials; Korean Agency for Technology and Standards: Eumseong-gun, Korean, 2017. (In Korean) [Google Scholar]
- KS L 5120. Testing Method for Chemical Analysis of Portland Concrete; Korean Agency for Technology and Standards: Eumseong-gun, Korean, 2004. (In Korean) [Google Scholar]
- ASTM A416/A416M-18. Standard Specification for Low-Relaxation, Seven-Wire Steel Strand for Prestressed Concrete; ASTM International: West Conshohocken, PA, USA, 2018. [Google Scholar]
- British Standards Institution. Eurocode 2: Design of Concrete Structures; British Standards Institution (BSI): London, UK, 2008. [Google Scholar]
- Korean Agency for Technology and Standards. Uncoated Stress-Relieved Steel Wires and Strands for Prestressed Concrete (KS D 7002); Korean Agency for Technology and Standards: Eumseong-gun, Korean, 2011. (In Korean) [Google Scholar]
- Jones, D.A. Principles and Prevention of Corrosion; Macmillan Publishing Company: New York, NY, USA, 1992. [Google Scholar]
- Pape, T.M.; Melchers, R.E. Performance of 45-year-old corroded prestressed concrete beams. Proc. Inst. Civ. Eng. Struct. Build. 2013, 166, 547–559. [Google Scholar] [CrossRef]
- ACI Committee 318. Building Code Requirements for Structural Concrete (ACI 318-14); ACI Committee: Farmington Hills, MI, USA, 2015. [Google Scholar]


| Strand | Nominal Sectional Area (mm2) | 0.2% Proof Stress, fpy (MPa) | Strain Corresponding to 0.2% Proof Stress, εpy | Ultimate Strength, fpu (MPa) | Ultimate Strain, εpu |
|---|---|---|---|---|---|
| 15.2 type | 138.7 | 1726 | 0.0099 | 1865 | 0.075 |
| 12.7 type | 98.71 | 1135 | 0.0090 | 1867 | 0.083 |
| ID | Location of Corrosion | Section Loss (Strand) | Section Loss (Most Corroded Wire) | Effective Prestressing Force | Material Properties |
|---|---|---|---|---|---|
| RB | - | 0% | 0% | 160 kN | Concrete: 44.07 MPa Yield strength (rebar): 400 MPa Tensile strength (rebar): 560 MPa Yield strength (strand): 1630 MPa Tensile strength (strand): 1865 MPa Elastic modulus of strand: 194.5 GPa |
| QB | 1/4 | 4.82% | 21.56%. | ||
| MB1 | 1/2 | 6.67% | 22.24% | ||
| MB2 | 1/2 | 7.51% | 18.89% |
| ID | Maximum Load (kN) | Load Reduction Ratio to RB | Maximum Disp. (mm) | Disp. Reduction Ratio to RB | Failure Mode |
|---|---|---|---|---|---|
| RB | 163.9 | - | 18.40 | - | Compressive concrete crush |
| QB | 161.0 | 1.77% | 17.89 | 2.77% | Compressive concrete crush after one wire fracture |
| MB1 | 146.4 | 10.68% | 16.14 | 12.28% | Compressive concrete crush after two wire fractures |
| MB2 | 135.6 | 17.27% | 15.98 | 13.15% | Compressive concrete crush after two wire fractures |
| ID | Ultimate Strength of Corroded Strand Based on 95% Lower Reliability Limit | from Equation (7) | Maximum Load (Test) | Maximum Load Considering Equation (7) | Difference |
|---|---|---|---|---|---|
| RB | 1860 MPa | 1614 MPa | 163.9 kN | 154.47 kN | −5.75% |
| QB | 1432 MPa | 1293 MPa | 161.0 kN | 154.47 (211.73 *) kN | −4.06% |
| MB1 | 1423 MPa | 1289 MPa | 146.4 kN | 138.53 kN | −5.38% |
| MB2 | 1469 MPa | 1327 MPa | 135.6 kN | 140.6 kN | 3.69% |
© 2020 by the authors. Licensee MDPI, Basel, Switzerland. This article is an open access article distributed under the terms and conditions of the Creative Commons Attribution (CC BY) license (http://creativecommons.org/licenses/by/4.0/).
Share and Cite
Jeon, C.-H.; Nguyen, C.D.; Shim, C.-S. Assessment of Mechanical Properties of Corroded Prestressing Strands. Appl. Sci. 2020, 10, 4055. https://doi.org/10.3390/app10124055
Jeon C-H, Nguyen CD, Shim C-S. Assessment of Mechanical Properties of Corroded Prestressing Strands. Applied Sciences. 2020; 10(12):4055. https://doi.org/10.3390/app10124055
Chicago/Turabian StyleJeon, Chi-Ho, Cuong Duy Nguyen, and Chang-Su Shim. 2020. "Assessment of Mechanical Properties of Corroded Prestressing Strands" Applied Sciences 10, no. 12: 4055. https://doi.org/10.3390/app10124055
APA StyleJeon, C.-H., Nguyen, C. D., & Shim, C.-S. (2020). Assessment of Mechanical Properties of Corroded Prestressing Strands. Applied Sciences, 10(12), 4055. https://doi.org/10.3390/app10124055