An Impedance Sensor in Detection of Immunoglobulin G with Interdigitated Electrodes on Flexible Substrate
Abstract
1. Introduction
2. Experimental Section
2.1. Materials
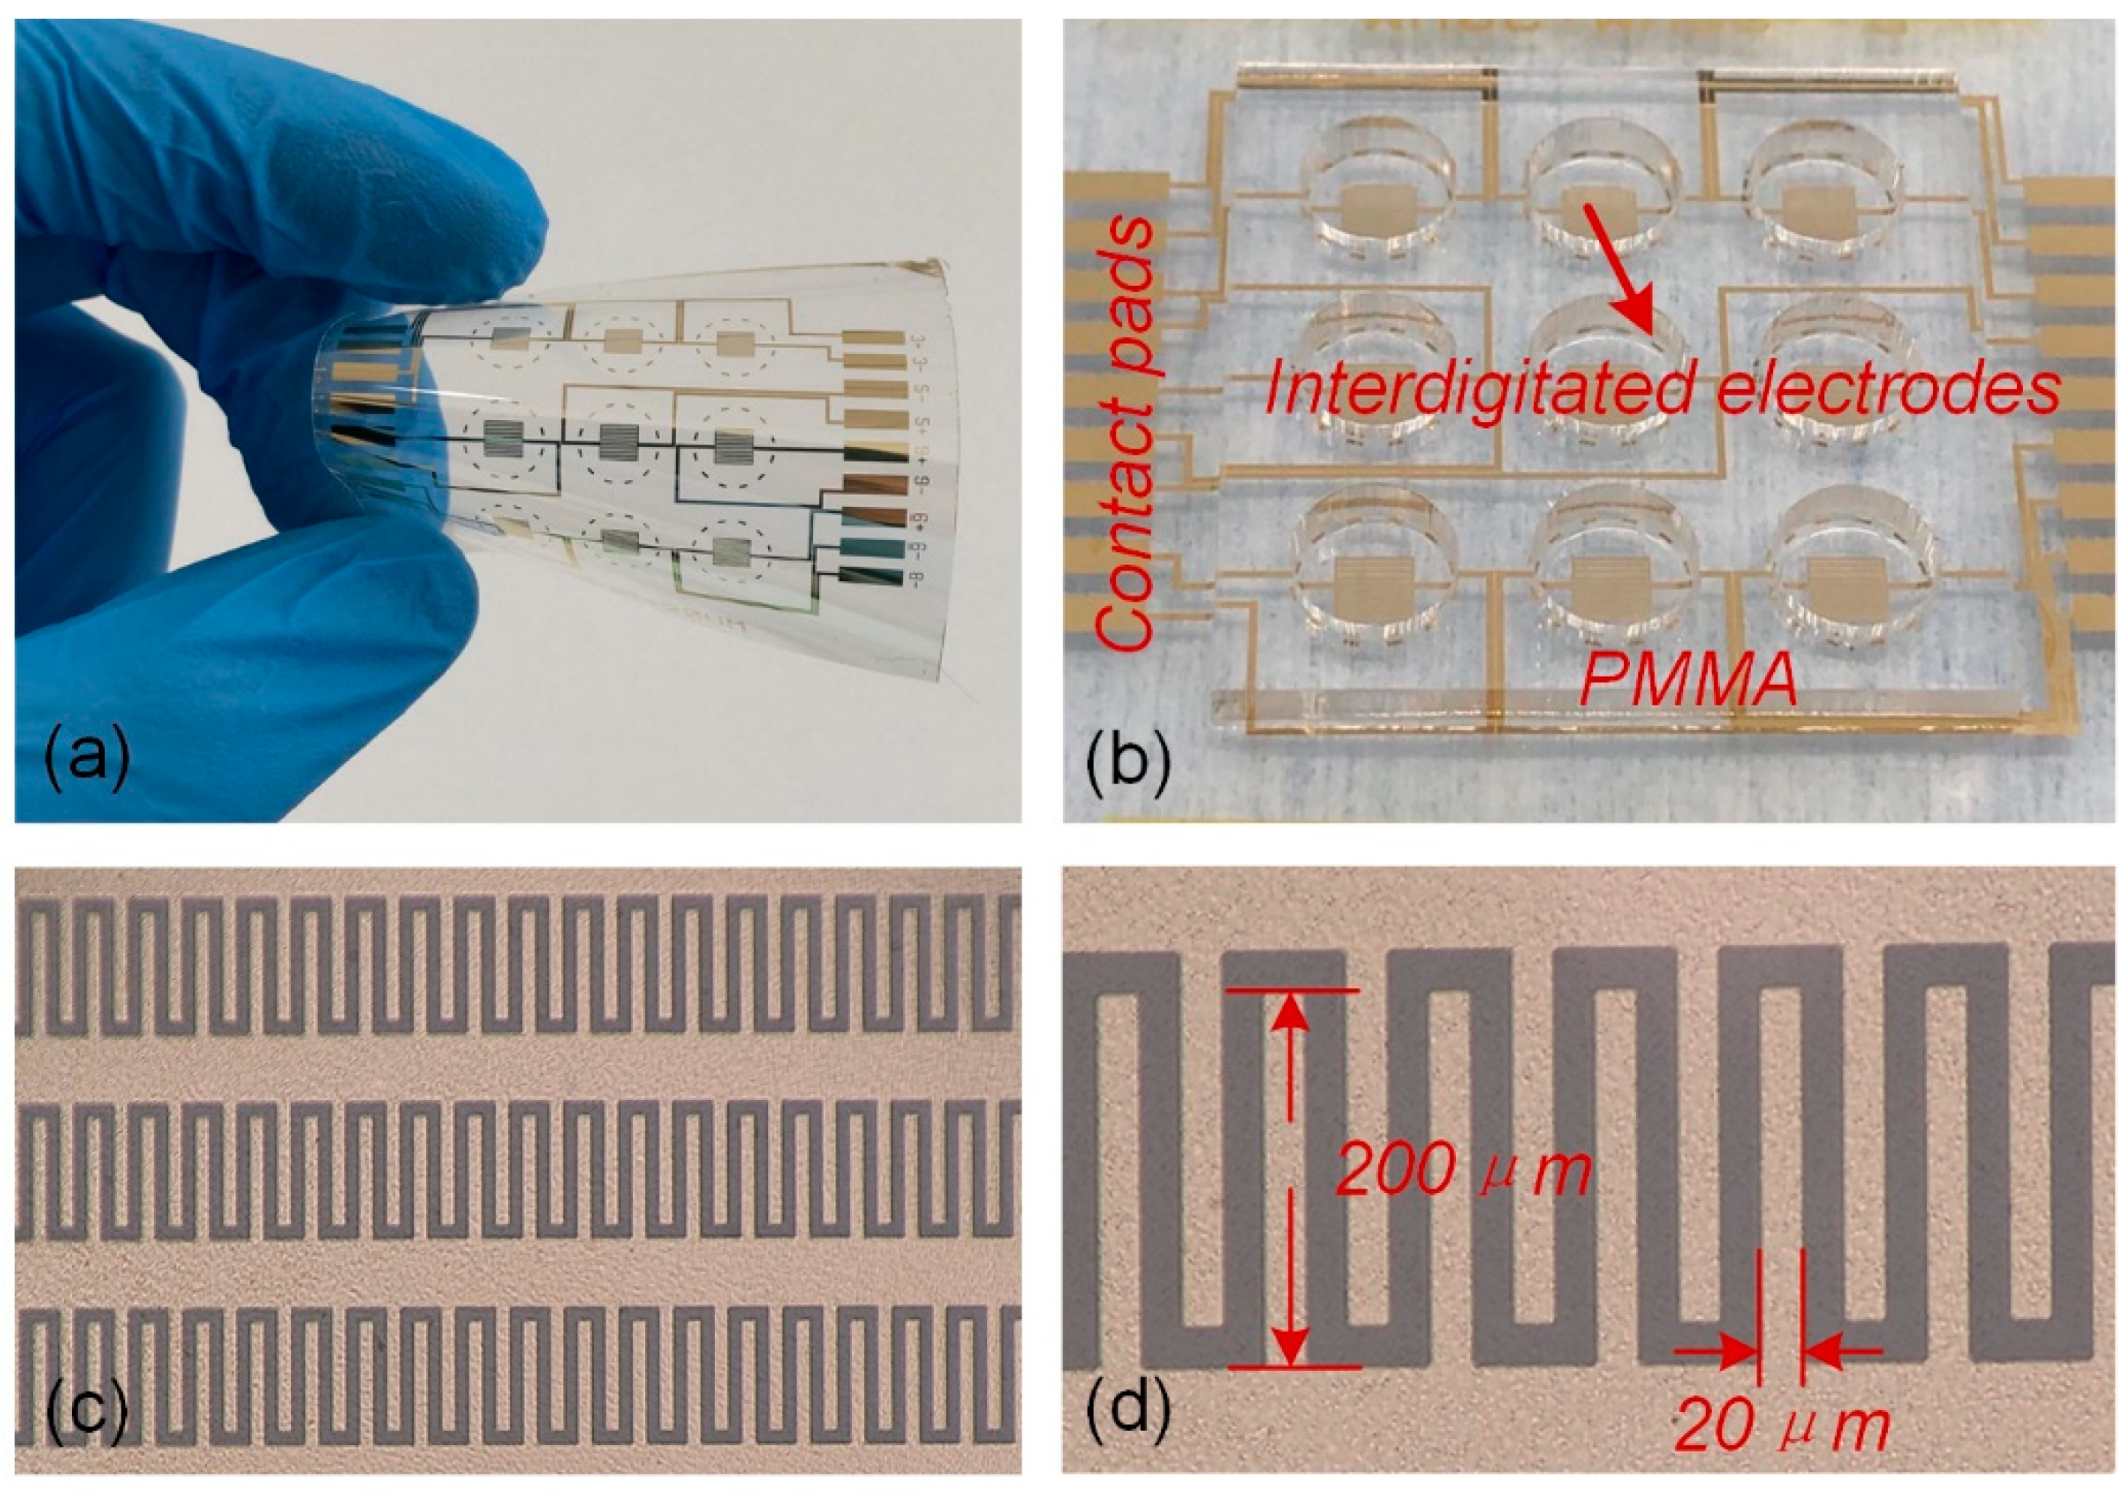
2.2. Design and Processing Test Electrodes
2.3. Verification Test of Electrode Detection Function
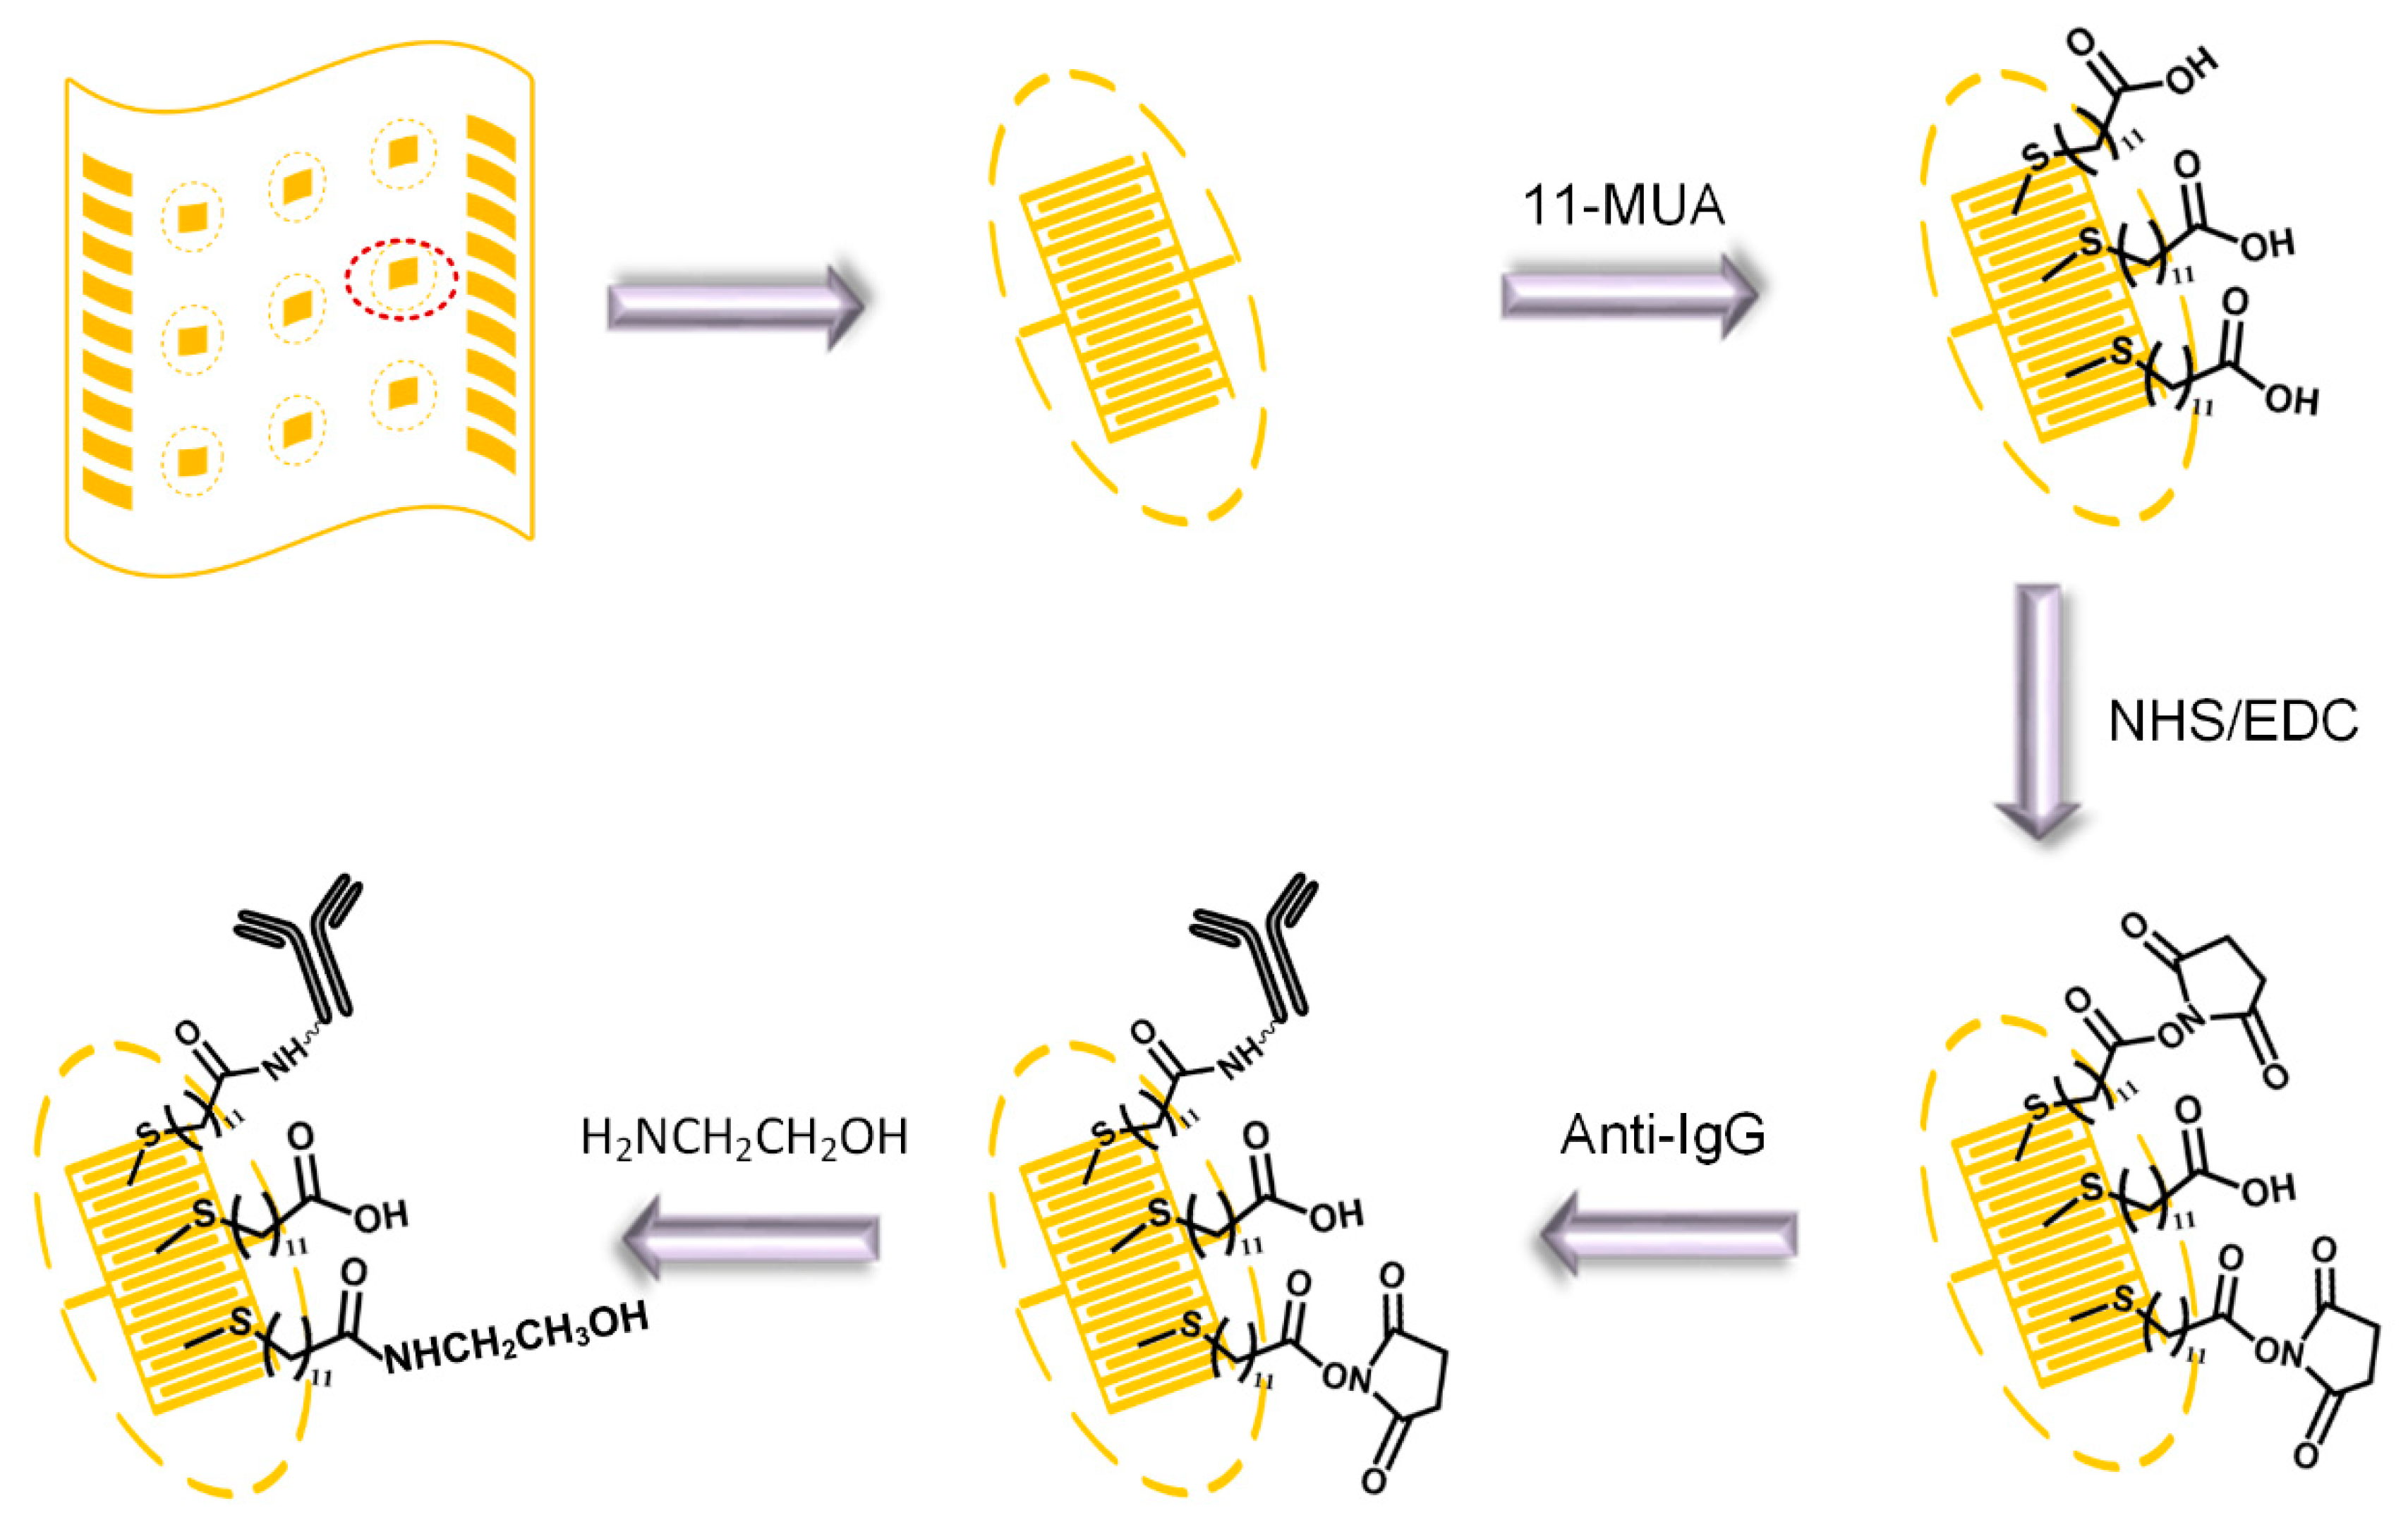
2.4. Fabrication Process of Immunosensor
2.5. Measurement and Apparatus
3. Results and Discussion
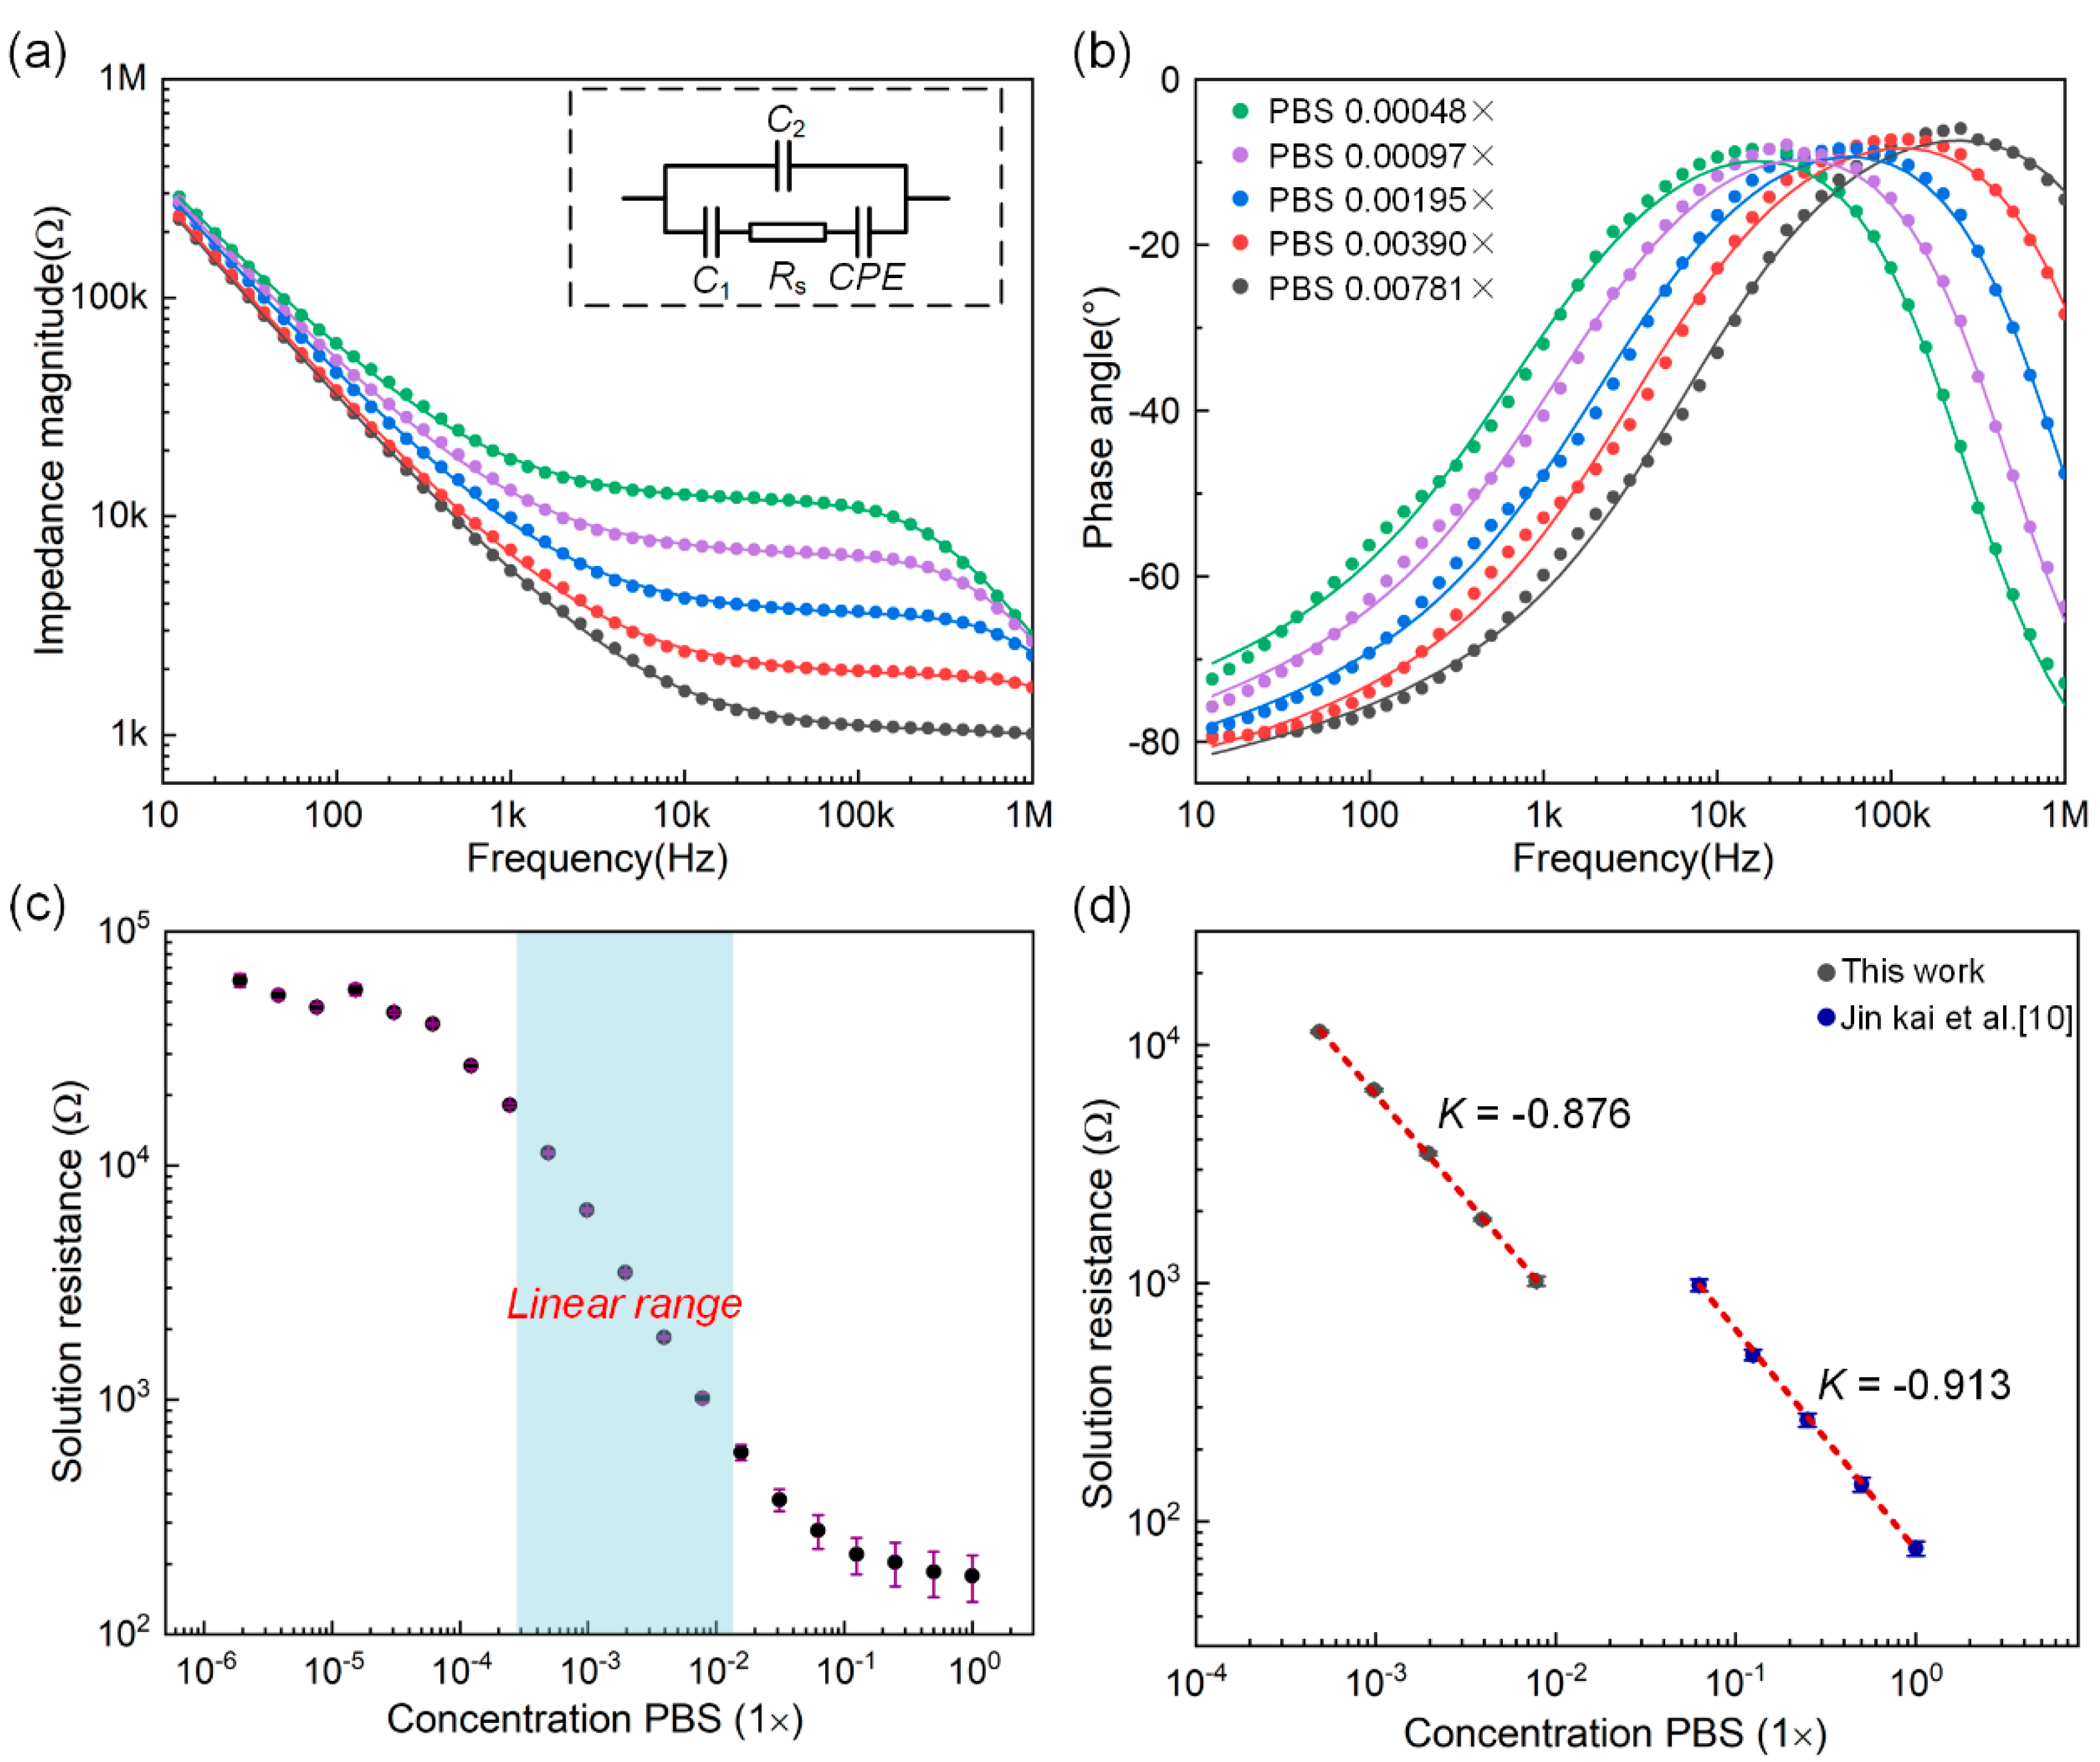
3.1. System Verification Experiment
3.2. Gold Electrodes Biofunctionalization and Characterization
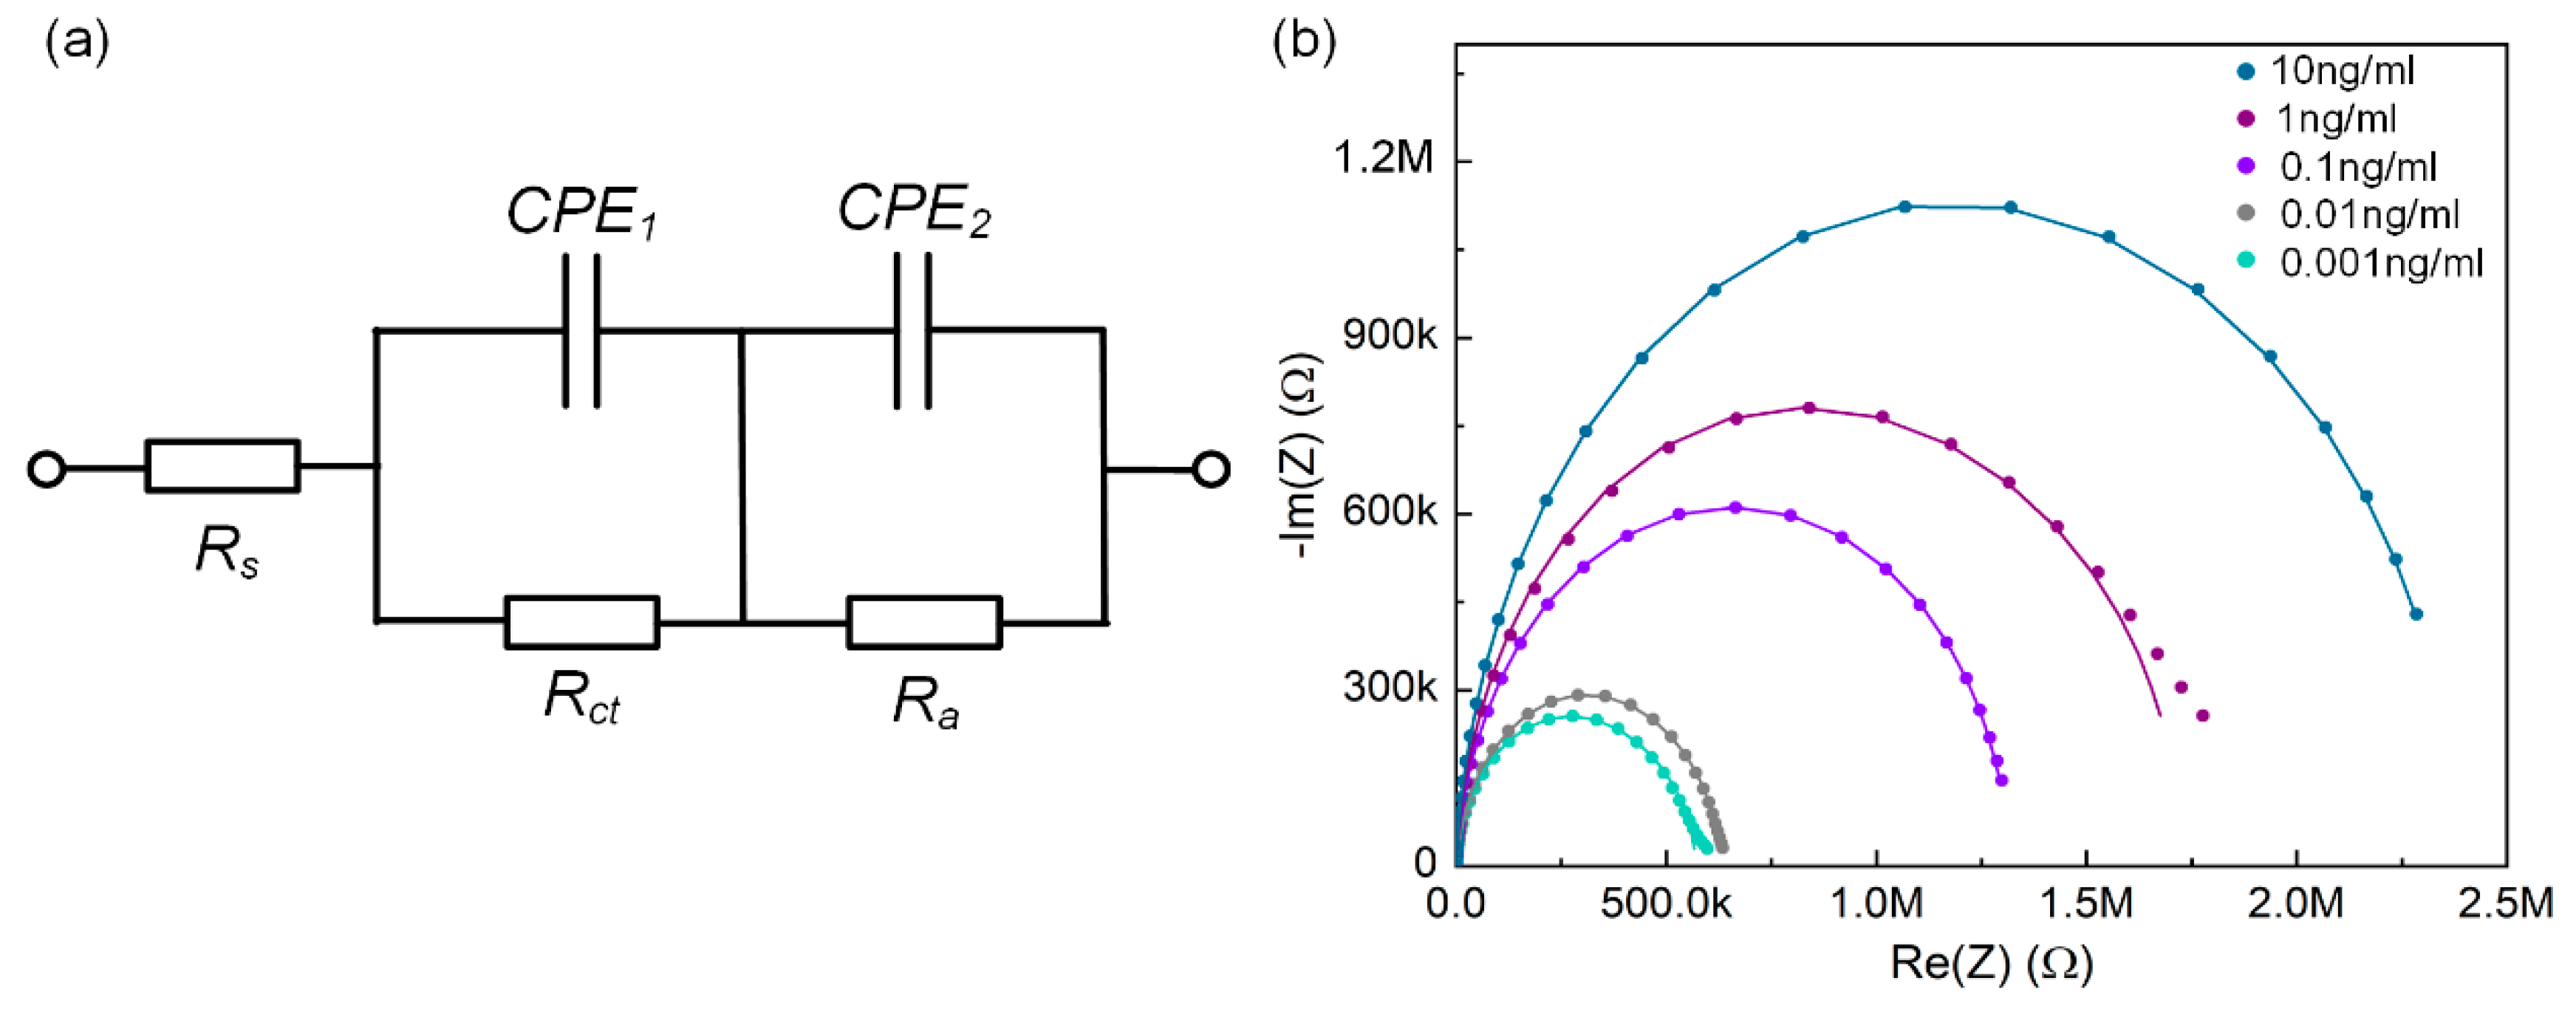
3.3. Analysis of Equivalent Circuit of Immune Sensing
3.4. Impedance-Based Immunoassay
4. Conclusions
Supplementary Materials
Author Contributions
Funding
Acknowledgments
Conflicts of Interest
References
- Pai, M.; Riley, L.W.; Colford, J.M. Interferon-γ assays in the immunodiagnosis of tuberculosis: A systematic review. Lancet Infect. Dis. 2004, 4, 761–776. [Google Scholar] [CrossRef]
- Schachter, J. Immunodiagnosis of sexually transmitted disease. Yale J. Biol. Med. 1985, 58, 443. [Google Scholar] [PubMed]
- Rockstroh, A.; Barzon, L.; Kumbukgolla, W.; Su, H.X.; Lizarazo, E.; Vincenti-Gonzalez, M.F.; Tami, A.; Ornelas, A.M.M.; Aguiar, R.S.; Cadar, D.J. Dengue Virus IgM Serotyping by ELISA with Recombinant Mutant Envelope Proteins. Emerg. Infect. Dis. 2019, 25, 112. [Google Scholar] [CrossRef] [PubMed]
- Ehsani, M.; Chaichi, M.J.; Hosseini, S.N. Comparison of CuO nanoparticle and CuO/MWCNT nanocomposite for amplification of chemiluminescence immunoassay for detection of the hepatitis B surface antigen in biological samples. Sens. Actuators B Chem. 2017, 247, 319–328. [Google Scholar] [CrossRef]
- Liu, R.; Zhang, S.; Wei, C.; Xing, Z.; Zhang, S.; Zhang, X. Metal stable isotope tagging: Renaissance of radioimmunoassay for multiplex and absolute quantification of biomolecules. Acc. Chem. Res. 2016, 49, 775–783. [Google Scholar] [CrossRef] [PubMed]
- Chen, D.; Zhang, Y.; Xu, Y.; Shen, T.; Cheng, G.; Huang, B.; Ruan, X.; Wang, C. Comparison of chemiluminescence immunoassay, enzyme-linked immunosorbent assay and passive agglutination for diagnosis of Mycoplasma pneumoniae infection. Therap. Clin. Risk Manag. 2018, 14, 1091. [Google Scholar] [CrossRef] [PubMed]
- Ricci, F.; Volpe, G.; Micheli, L.; Palleschi, G. A review on novel developments and applications of immunosensors in food analysis. Anal. Chim. Acta 2007, 605, 111–129. [Google Scholar] [CrossRef] [PubMed]
- Shankaran, D.R.; Gobi, K.V.; Miura, N. Recent advancements in surface plasmon resonance immunosensors for detection of small molecules of biomedical, food and environmental interest. Sens. Actuators B Chem. 2007, 121, 158–177. [Google Scholar] [CrossRef]
- Pejcic, B.; De Marco, R. Impedance spectroscopy: Over 35 years of electrochemical sensor optimization. Electrochim. Acta 2006, 51, 6217–6229. [Google Scholar] [CrossRef]
- Jin, K.; Hu, S.; Su, Y.; Yang, C.; Li, J.; Ma, H. Disposable impedance-based immunosensor array with direct-laser writing platform. Anal. Chim. Acta 2019, 1067, 48–55. [Google Scholar] [CrossRef]
- Lisdat, F.; Schäfer, D. The use of electrochemical impedance spectroscopy for biosensing. Anal. Bioanal. Chem. 2008, 391, 1555. [Google Scholar] [CrossRef] [PubMed]
- Chang, B.-Y.; Park, S.-M. Electrochemical impedance spectroscopy. Annu. Rev. Anal. Chem. 2010, 3, 207–229. [Google Scholar] [CrossRef]
- Varshney, M.; Li, Y. Interdigitated array microelectrodes based impedance biosensors for detection of bacterial cells. Biosens. Bioelectron. 2009, 24, 2951–2960. [Google Scholar] [CrossRef] [PubMed]
- Li, X.; Yu, M.; Chen, Z.; Lin, X.; Qi, W. A sensor for detection of carcinoembryonic antigen based on the polyaniline-Au nanoparticles and gap-based interdigitated electrode. Sens. Actuators B Chem. 2017, 239, 874–882. [Google Scholar] [CrossRef]
- Drummond, T.G.; Hill, M.G.; Barton, J.K. Electrochemical DNA sensors. Nat. Biotechnol. 2003, 21, 1192–1199. [Google Scholar] [CrossRef] [PubMed]
- Ma, H.; Su, Y.; Nathan, A. Cell constant studies of bipolar and tetrapolar electrode systems for impedance measurement. Sens. Actuators B Chem. 2015, 221, 1264–1270. [Google Scholar] [CrossRef]
- Sharma, R.; Deacon, S.E.; Nowak, D.; George, S.E.; Wälti, C.J.B. Label-free electrochemical impedance biosensor to detect human interleukin–8 in serum with sub-fg/mL sensitivity. Biosens. Bioelectron. 2016, 80, 607–613. [Google Scholar] [CrossRef] [PubMed]
- Shin, S.R.; Zhang, Y.S.; Kim, D.-J.; Manbohi, A.; Avci, H.; Silvestri, A.; Aleman, J.; Hu, N.; Kilic, T.; Keung, W. Aptamer-based microfluidic electrochemical biosensor for monitoring cell-secreted trace cardiac biomarkers. Anal. Chem. 2016, 88, 10019–10027. [Google Scholar] [CrossRef] [PubMed]
- Gao, W.; Emaminejad, S.; Nyein, H.Y.Y.; Challa, S.; Javey, A. Fully integrated wearable sensor arrays for multiplexed in situ perspiration analysis. Nature 2016, 529, 509–514. [Google Scholar] [CrossRef] [PubMed]
- Chung, S.; Lee, T. Towards flexible CMOS circuits. Nat. Nanotechnol. 2020, 15, 11–12. [Google Scholar] [CrossRef] [PubMed]
- Gong, X.X.; Fei, G.T.; Fu, W.B.; Fang, M.; Gao, X.D.; Zhong, B.N.; De Zhang, L. Flexible strain sensor with high performance based on PANI/PDMS films. Org. Electron. 2017, 47, 51–56. [Google Scholar] [CrossRef]
- Feng, L.; Jiang, C.; Ma, H.; Guo, X.; Nathan, A. All ink-jet printed low-voltage organic field-effect transistors on flexible substrate. Org. Electron. 2016, 38, 186–192. [Google Scholar] [CrossRef]
- Grego, S.; Lewis, J.; Vick, E.; Temple, D. A method to evaluate mechanical performance of thin transparent films for flexible displays. Thin Solid Films 2007, 515, 4745–4752. [Google Scholar] [CrossRef]
- Nelles, G.; Schönherr, H.; Jaschke, M.; Wolf, H.; Schaub, M.; Küther, J.; Tremel, W.; Bamberg, E.; Ringsdorf, H.; Butt, H.-J. Two-Dimensional Structure of Disulfides and Thiols on Gold (111). Langmuir 1998, 14, 808–815. [Google Scholar] [CrossRef]
- Choi, H.-G.; Min, J.; Lee, W.H.; Choi, J.-W. Adsorption behavior and photoelectric response characteristics of bacteriorhodopsin thin films fabricated by self-assembly technique. Colloids Surf. B 2002, 23, 327–337. [Google Scholar] [CrossRef]
- Wan, J.; Ai, J.; Zhang, Y.; Geng, X.; Gao, Q.; Cheng, Z. Signal-off impedimetric immunosensor for the detection of Escherichia coli O157: H7. Sci. Rep. 2016, 6, 19806. [Google Scholar] [CrossRef] [PubMed]
- Fu, Y.; Yuan, R.; Tang, D.; Chai, Y.; Xu, L. Study on the immobilization of anti-IgG on Au-colloid modified gold electrode via potentiometric immunosensor, cyclic voltammetry, and electrochemical impedance techniques. Colloid. Surface. B 2005, 40, 61–66. [Google Scholar] [CrossRef] [PubMed]
- Ohno, R.; Ohnuki, H.; Wang, H.; Yokoyama, T.; Endo, H.; Tsuya, D.; Izumi, M. Electrochemical impedance spectroscopy biosensor with interdigitated electrode for detection of human immunoglobulin A. Biosens. Bioelectron. 2013, 40, 422–426 All authors have read and agreed to the published version of the manuscript. [Google Scholar] [CrossRef] [PubMed]


© 2020 by the authors. Licensee MDPI, Basel, Switzerland. This article is an open access article distributed under the terms and conditions of the Creative Commons Attribution (CC BY) license (http://creativecommons.org/licenses/by/4.0/).
Share and Cite
Jin, K.; Zhao, P.; Fang, W.; Zhai, Y.; Hu, S.; Ma, H.; Li, J. An Impedance Sensor in Detection of Immunoglobulin G with Interdigitated Electrodes on Flexible Substrate. Appl. Sci. 2020, 10, 4012. https://doi.org/10.3390/app10114012
Jin K, Zhao P, Fang W, Zhai Y, Hu S, Ma H, Li J. An Impedance Sensor in Detection of Immunoglobulin G with Interdigitated Electrodes on Flexible Substrate. Applied Sciences. 2020; 10(11):4012. https://doi.org/10.3390/app10114012
Chicago/Turabian StyleJin, Kai, Ping Zhao, Wenhui Fang, Yingjiao Zhai, Siyi Hu, Hanbin Ma, and Jinhua Li. 2020. "An Impedance Sensor in Detection of Immunoglobulin G with Interdigitated Electrodes on Flexible Substrate" Applied Sciences 10, no. 11: 4012. https://doi.org/10.3390/app10114012
APA StyleJin, K., Zhao, P., Fang, W., Zhai, Y., Hu, S., Ma, H., & Li, J. (2020). An Impedance Sensor in Detection of Immunoglobulin G with Interdigitated Electrodes on Flexible Substrate. Applied Sciences, 10(11), 4012. https://doi.org/10.3390/app10114012


