1. Introduction
Implementing environmentally friendly systems and using renewable energy are not luxuries anymore. They are needed to sustain the planet’s limited resources and maintain the environment. Transportation is one of the main sectors that depletes traditional fuel reserves, in addition to damaging the environment.
As per the World Bank Group database and Energy Information Administration (EIA) statistics, overall worldwide energy consumption is continuously increasing. The 2016, the International Energy Outlook predicted that the annual transportation sector energy consumption was increasing at an average rate of 1.4%, from 104 quadrillion British thermal units (Btu) in 2012 to 155 quadrillion Btu in 2040 [
1,
2,
3].
As for the transportation sector, the Energy Information Administration (EIA) has released data showing that the transportation of people and goods accounts for approximately 25 percent of global energy consumption [
2]. Passenger transportation, in particular, using light-duty vehicles, accounts for most of the transportation energy consumption. Therefore, establishing reputable public transportation systems is necessary, and using clean energy instead of fossil fuels within the nominated system is of extreme importance.
Depletion of non-renewable energy sources, such as fossil fuels, is not the only problem associated with using such fuels for transportation. Production of remarkable amounts of dreadful emissions that hurt the environment and inhabitants’ health is a problem of equal significance. Twenty percent of global CO2 emissions are caused by the transportation sector.
Streets occupy a large area of public land, which offers a unique opportunity to implement green technology fundamentals and elements that improve communities, the environment, and health. One such technology is using photovoltaics (PV) to generate the required energy to power the electric buses. PV generated energy is sustainable, as it is harvested directly from the sun. As PV technology installation investment costs have decreased, global deployment has rapidly increased. PV systems may be installed near the load, with no need for a fuel source or transmission lines, in essence promoting sustainable local generation. This is very attractive for public transportation, as the energy is consumed locally at the route. The drawback of PV energy is that it is dependent on environmental factors. Power generation depends on solar radiation and temperature. As these are random in nature, and cannot be controlled, the availability of solar generated energy is not as dependable as traditional fuel sources. In addition, PV systems do not generate electricity at night, and generation levels differ by season. To combat this effect, storage systems and grid integration schemes may be employed [
4].
In this study, a net-metering scheme is assumed. In essence, this scheme uses a bidirectional energy meter. All energy generated by the PV system that is not consumed by the local load is injected into the grid, and the net consumption is billed at the end of the contract-defined period. Therefore, the PV system may be designed to produce enough energy during the day to cover the complete consumption, storing the night-required energy on the electric grid.
The authors in [
5] discuss electric buses as a city transportation system with the main target of reducing the carbon footprint. However, the paper does not discuss the bus electrical source. While the authors in [
6] focus on the optimization of public transportation electric buses’ employment, targeting the minimum capital cost of the fleet, the charging demand and stations, and solving the scheduling problem of engaged electric buses. Hence, it focuses on optimizing the charging systems, with no analysis of the environmental effects of traditional buses and electric buses.
In [
7], the total cost of ownership (TCO) for different electric buses and diesel buses is studied and outlines some real cases in different cities for using electric buses in public transportation. However, the paper does not discuss the implementation of renewable energy to supply the buses.
Regarding photovoltaic systems, much research discusses the feasibility of deployment for different uses and configurations. The authors of [
8] present computer based design of off-grid solar photovoltaic systems, where the author describes each step in the design procedure that includes electrical load calculations, photovoltaic panel sizing and selection, storage system sizing and selection, inverter sizing, and specification in addition to the selection of the charging controller. The authors in [
9] discuss the design of on grid PV systems. In [
4], the author provides a comprehensive guide to solar photovoltaic systems, starting from the planning stage, design, specifications selection, and control technologies for photovoltaic off-grid system components, and ending with the implementation phase.
The research available in the literature focuses on electrical buses or on PV components and systems, but does not address implementing such systems together, to elevate the environmental and financial burdens of large-scale public transportation systems.
In this work, sustainable solutions are proposed and renewable energy systems are utilized to transform the transportation infrastructure and streets to environmentally friendly systems by utilizing available spaces to generate clean energy, in an innovative solution to reach the concept of the so-called “green streets.” The main transportation project in Jordan, the Bus Rapid Transit Project of Amman, “Amman BRT,” was used as the case study. Photovoltaic systems “PV” are a mature economic technology that uses solar energy to produce electricity. Abundance research, installations, projects, manufacturers, and interested associations around the world helped in making PV dependable and fully reliant technology. Therefore, PV is elevated as a main part of the green street methodology adapted in this manuscript, driven by huge incentives from governmental and financial donor programs. Electric vehicles’ (EVs) proven reliability and has increased in market penetration recently due to the fast and diverse advancements in the field. Utilization of EVs is essential in modern green transportation systems.
2. Materials and Methods
2.1. Amman BRT
The Jordanian Ministry of transportation reports that 46% of energy used in Jordan is for the transportation sector [
10]. As Jordan imports most of its energy needs, this is a major burden on the economy and national security.
In Amman, Jordan, the current public transportation networks consists of private taxis, shared taxis, buses, and mini-buses, which are managed by the public sector and 14,000 small operators. The supply of public transport is insufficient to cope with demographic and urban growth. This situation strongly constrains both inhabitants’ mobility and economic growth, in addition to being harmful to the environment.
Amman Bus Rapid Transit project (Amman BRT) is owned by the Greater Amman Municipality (GAM), and aims to provide a quality, economic, car-competitive mass transit system that will attract the entire spectrum of Amman citizens, including car owners [
11]. With around 25 km total length of networks, and dedicated bus lanes separated from other regular traffic, Amman BRT is expected to reduce the distance travelled using private vehicles by 85 million km per year, and to be used by 142 million passengers each year [
12].
Routes are divided into two lines and will serve major destinations in the city. The first stage of Amman BRT will include 100 buses. Line 1 will employ 60 buses that travel 12 day-tours an hour in addition to 3 night-tours per hour. Line 2 will employ 40 buses that will travel 20 day-tours per hour and 5 night-tours per hour [
13]; routes are shown in the
Figure 1. The current design makes use of traditional diesel buses.
2.2. Transportation Network Energy Demand
Jordan employs a net-metering scheme for connecting PV generation to the grid. This allows one total renewable energy self-consumption, without the need to install any storage systems. All excess energy generated during the day, or during high generation summer months is injected to the grid and credited in kWh. At the end of every billing year, the net generation and consumption are calculated, and only excess energy drawn is billed. In essence, the electric grid is used as a free storage sink, but any excess energy at the end of the billing cycle is forfeit to the grid operator. Therefore, it is very important to correctly size the designed PV system, such that the annual generated energy matches actual annual energy demand. The first step in designing the PV system for AMMAN BRT is to determine the annual energy needs. Generated electricity shall be used to cover required energy for charging the electric buses, for charging LED streets lights, and for the service buildings’ electricity.
To properly characterize the load demand, the electric buses that will be deployed must be selected, and transportation network routes, distance, and operation must be well defined. For proper comparison between business as usual and the proposed upgrade, buses of the same size and passenger capacity are selected. The 18-m BYD K11 electric bus was selected to replace the diesel buses. It is worth mentioning that smaller electric buses (12 m) are widely used in many public transportation projects, but the larger size 18-m electric buses are new to the market. The bus has a 652 kWh battery that requires three and half hours to charge, which is enough to run the bus throughout the day for the distance required by operation plans [
14].
Although the capital expenditure (CAPEX) of the electrical buses is higher than that for diesel buses, the total cost of ownership (TCO) is very different for the two options, since the operational cost for electric buses is much lower due to less energy consumption, less moving parts, no oil change, and longer life span [
15,
16]. The total demand of the proposed BRT project along with all services was projected to be 32 GWh, as shown in
Table 1.
2.3. PV System Design
2.3.1. Shading Analysis
For an accurate PV system design, the proposed system is simulated using PVSYST [
17]. Simulation results are only as accurate as the input data. Data related to solar radiation in Amman, including horizontal global irradiation, diffused irradiation, ambient temperature, and global incident radiation, were obtained from the Meteonorm database [
18].
Due to the route being within city limits, mostly in business districts, the crucial input data is the shading information. Shading data wrtr obtained by actual readings using SunEye equipment. This enabled capturing the losses due to shading and high rising objects along the zones.
As the routes cross many different areas with different topography and buildings distribution, shading at each point on the route is not like any other points. This is the main reason for using the zoning system and calculating the shading for each zone as an average. The routes are divided into fifteen zones, as shown in
Figure 2. The start and end of every zone were determined based on direction and length. This determines the studying each zone as a separate project for designing the PV systems.
According to this configuration, line 1 has zones 1 through 11, while line 2 includes zones 12 through 15. Some parts of the corridors were eliminated because of inconvenient conditions, such as intersections, bridges, tunnels, and many existing high buildings.
For each zone along the routes, several points were selected for data measurement, one point representing the worst possible shading in that zone where high buildings or obstacles exist. Another point represents the lowest possible shading in that zone. The remaining points cover the normal or average shading in the zone. The average shading for all points will be considered as the shading factor of this zone. Selection of highest and lowest shading points took place based on actual site visits.
Zone 2 was chosen to validate this approach, as it has the highest shading due to many existing commercial buildings in that zone. The shading analysis first started using 5 points (highest shade, lowest shade and 3 average points). Then, a new session for shading analysis started using 19 points; the difference in overall average annual solar access was 2%. This percentage is acceptable, especially knowing that zone 2 has the highest shading in comparison with the other zones, which means this difference will be lower over other zones.
Figure 3 shows the location of data sampling in Zone 2.
Readings for shading and solar access were at 1.5–1.7 m elevation. This formulates an extra indirect safety factor, since the installation of PV panels will be much higher than this elevation. Thus, PV panels’ access to solar radiation will be higher than what is used in the calculations. Therefore, results and outcomes of this study regarding electric generation from photovoltaic system will include a safety factor that affirms, in reality, the ability to produce more electricity than proposed.
2.3.2. Electrical Design
The geolocation specifications, electrical components, and designed tilt angle are depicted in
Table 2.
The PV system was designed for each zone, taking into consideration length, shading, and mutual shading along the route. PVSYST was used to simulate the PV system and determine system capacity in each zone. The designed PV system comprises elevated PV modules along the path of the route with a tilt angle of 10° and an azimuth angle that corresponds to the route path. The azimuth angle of different PV sections is not optimum; however, it matches the route direction to take the overall scenery into consideration and to generate shading over the routes and pedestrian paths.
Table 3 summarizes the resulting PV system design for each zone, where
is the nominal power for PV system in the specific zone (in kw peak).
As can be seen from
Table 3, if the whole route is covered by PV systems, the generation greatly exceeds the system energy requirements. Some of the zones’ yields are less than others due to shading, or direction, leading to zone-specific payback periods. Therefore, which zone to use must be carefully evaluated.
2.3.3. Economic Analysis
The payback period and net present value are the main aspects of the feasibility study in this research. Payback period is the time required to earn back the amount invested in an asset from its net cash flows. It is a direct method to evaluate the risk associated with a proposed project. An investment with a shorter payback period is considered to be better, since the investor’s initial outlay is at risk for a shorter period of time. The payback period is expressed in years and fractions of years [
19].
To make this method more accurate, one should convert all values to the present values, getting the net present values before applying the payback formulas. Furthermore, all capital costs and running costs shall be taken into consideration within the calculations. Total cost of ownership (TCO) will be highlighted as an indicator.
By identifying the number of years needed to payback the incremental investment in this transition, this research will highlight the economic feasibility of implementing the renewable system upgrade for the Amman BRT project. Therefore, the aim is to calculate the increase of capital cost, and the savings in the operational cost in order to calculate the payback period.
In order to calculate the net present value (NPV) for capital and operational amounts, the discount rate should be defined. The discount rate or real interest rate is dependent on the interest percentage and inflation factor. Fisher equation is used to calculate the discount rate.
2.3.4. Environmental Analysis
The approach to calculate CO
2 emissions is by multiplying estimated fuel volume by a default CO
2 emission factor.
Table 4 shows road transportation default CO
2 emission factors for different fuel types [
20].
For the indirect emissions, the most significant source is electricity generation using fossil fuels in upstream processes, such as extraction, transport, refinery, and generation. However, here, as solar PV is proposed to produce the required energy for the system, the indirect emissions will only be taken into consideration for the baseline case. According to United Nations Framework Convention on Climate Change (UNFCCC), the default emission factor for upstream emissions (well-to-tank) is 16.7 (t CO
2e/TJ). For electricity generation emissions, according to the US Environmental Protection Agency (EPA), the US annual non-base load CO
2 output emission rate that is considered as an accurate “emission factor” for electrical consumption can be calculated using the rate (7.03 × 10
-4 metric tons CO
2/kWh) [
20]. Therefore, CO
2 emissions will be increased around 22.5–23% via indirect upstream emissions [
21].
This research considers both direct and indirect (WTT, TTW) emissions caused by using the baseline buses in the business-as-usual scenario and electricity from the grid, focusing on CO
2 as a major pollutant. Then, it provides the difference in emissions upon implementing the proposed upgrade.
Table 5 shows the emissions produced in the business-as-usual scenario.
3. Results
3.1. Overall System Design
As stated in the previous section, it is very important to properly select the zones that will be used for the PV systems. Several factors must be used in determining the optimal combination of zones. The zone score should reflect the priority of implementation. The main parameter to focus on is the required energy (ER), where the optimum value is that the generated energy exactly matches the projected load demand. Higher or lower energy generation will be penalized equally, since the system is not paid back for any additional energy generated as per the net metering regulations. Minimizing the losses (L) is very important to optimizing the infrastructure utilization. Specific yield (SC) quantifies the ratio of the energy generated to the installed capacity, and it is affected by various design parameters, such as the height of the installation, inclination angle, and projected dust accumulation. But it is confined with the constraints of the site nature, and thus lower weight is assigned but is considered valuable in the score equation. System capacity (SC) is considered as the lowest weighted factor as it influences the initial investment only. Changing the factors might change the priorities of implementation and changing the weights might influence the zone score as well, but that would not change the order of zones significantly. Regardless of the order, it is a guide for the designer to focus on certain zones to meet the projected load demand. A factor-weighted equation is used to score the different combinations in Equation (1).
SC: system capacity factor, the value will be 1 if it meets or exceeds the required capacity.
RE: required energy, the value will be 1 if it exactly meets the required Energy, while it will be less for scenarios which provide more or less energy than the required energy.
OL: overall average loses due to shading and direction. The value will be 1 for the lowest losses scenario, while it will be less for scenarios with higher losses.
SY: specific yield which is the energy to power ratio. The value will be 1 for the highest ratio scenario, while it will be less for scenarios with smaller ratio values.
The weights for the different factors represent site and project specific priorities. The weight may be changed based on the priorities that best serve implementation.
As quite a large number of combinations may be used, six scenarios are defined as summarized in
Table 6. The scenarios follow two main themes: utilizing the lowest shading-induced losses zones or utilizing main areas close to the major load demand. The first scenario considers all zones along the routes. Hence, it is a very big area and possibly able to contain large PV systems with more energy generation capacity than needed. Although a huge amount of energy can be generated in this scenario, losses due to direction and shading are tremendous. In scenario two, efficiency is increased by eliminating PV systems in zones with shading losses higher than 20%. In defining scenarios, shading losses were more important than losses due to the direction of the installed PV system. It is noticed that in this scenario, zones 2, 5, 6, 8, and 12 were excluded from the calculation. Therefore, the energy produced overall is less than in scenario one, but still covers more than the required energy for the project. In the third scenario, only zones that have 10% shading losses or lower are considered. In this case, zones 1, 3, 4, 9, 11, 14, and 15 are still within the group. As a result, the efficiency will be higher due to removing zones with higher losses. Zones such as 2, 5, 6, 7, 8, 10, 12, and 13 were not included in the calculation in this scenario. Less energy is generated in the third scenario (34,696.00 MWH/Year), but it still covers the needs of the proposed systems. Scenario 4 is tackling the highest efficiency by incorporating the lowest losses zones. This includes zones 4, 9, 11, and 14. Despite the efficiency being at higher limits in this scenario, it excludes most of the zones from the calculations. The result is a lower amount of energy that could be insufficient to cover the project needs. Scenario five is selecting zones which are close to parking areas. These areas are large and close to the energy consuming systems. In scenario 6, zones next to Mahatta parking only are considered. That is because Mahatta parking is a potential area for BRT buses to park overnight. Therefore, most of the consumption is expected to be there. It can be seen that energy produced is less than what the green streets model requires. The score for each scenario is depicted in
Figure 4 by utilizing Equation (1), and the results of each zone’s specifications in
Table 3.
Based on these results, scenario 3 has the highest score of (93.3/100), making this scenario the best candidate. Scenario 3 meets capacity requirements; has lower losses than scenarios 1, 2, 5, and 6; and has a high specific yield. Scenario 3 suggests installing PV panels with an overall capacity of 20,017.00 kWp in order to generate 34,696,000.00 kWh per year. This energy is slightly above the required energy needed to run the green street model (32,000,000.00 kWh/Year); therefore, this scenario covers and exceeds energy demand with a slight indirect safety factor.
Table 7 lists the details of scenario 3 design.
3.2. Environmental Analysis
One of the main targets of this research is to reduce green house gas (GHG) emissions from transportation. This is based on overall CO
2 emissions. Transportation equipment produces direct greenhouse gas emissions of carbon dioxide (CO2), methane (CH4), and nitrous oxide (N2O) from the combustion of various fuel types, and several other pollutants, such as carbon monoxide (CO), non-methane volatile organic compounds (NMVOCs), sulfur dioxide (SO
2), particulate matter (PM), and oxides of nitrate (NOx), which cause or contribute to local or regional air pollution. However, UNFCCC advises that N2O emissions from transportation are very limited, and CH4 is a major component in case of gas engines. Hence, this study included only CO
2 emissions [
20].
Table 8 summarizes the environmental impact of electrical consumption in the bassline scenario.
Table 9 summarizes the overall environmental impact of the traditional baseline without the proposed upgrade. On the other hand, the proposed approach offers a reduction of emissions, by using electric buses instead of diesel buses and using PVs to produce electricity from solar energy to cover the required electric demand. As long as the scenario that is chosen for implementation provides all the required energy, all GHG emission from the baseline will be eliminated.
Deploying the PV-supplied electric buses for the Amman BRT project will result in eliminating the release of 27,204 metric tons a year and 408,060 metric tons of CO2 during the 15-year lifetime of the project, which has a tremendous influence on the project’s carbon footprint.
The social cost of carbon is a measure of the economic harm from those impacts, expressed as the dollar value of the total damages from emitting one ton of carbon dioxide into the atmosphere. The current estimate of the social cost of carbon is roughly
$40 per ton [
22].
3.3. Economic Analysis
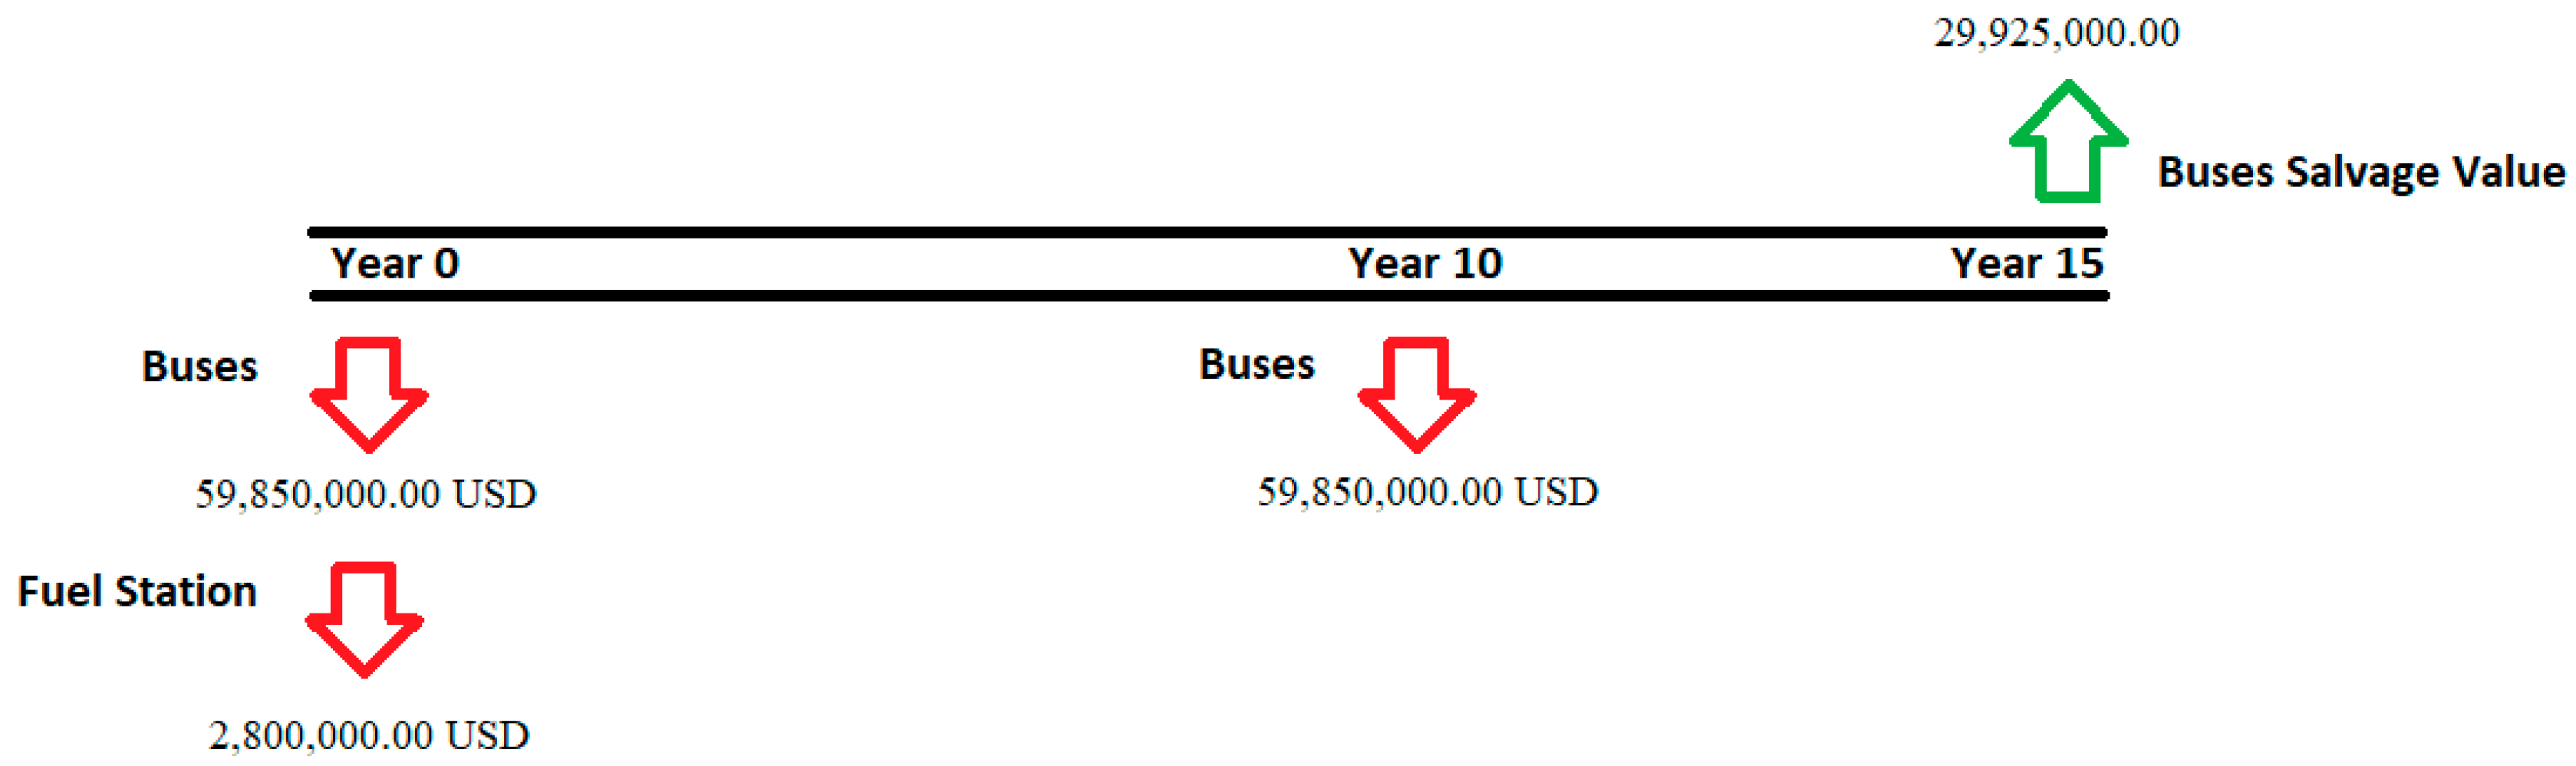
All amounts will be rounded to present worth for proper comparison. The capital expenditure (CAPEX) for the baseline buses over 15 years lifespan is summarized in the following investment timeline in
Figure 5:
CAPEX for the renewable energy model is higher than the baseline case. This is due to the more expensive electric buses and the installation of photovoltaic systems. The salvage values of all components within the alternative system are taken into consideration.
The following investment timeline depicted in
Figure 6 shows the capital expenditure (CAPEX) of the PV supplied electric bus upgrade over 15 years:
PV system inverters have an expected lifetime of 8–10 years. Therefore, for this study, inverters are replaced after 9 years of operation. In general, inverters share 20% of the PV system’s capital cost.
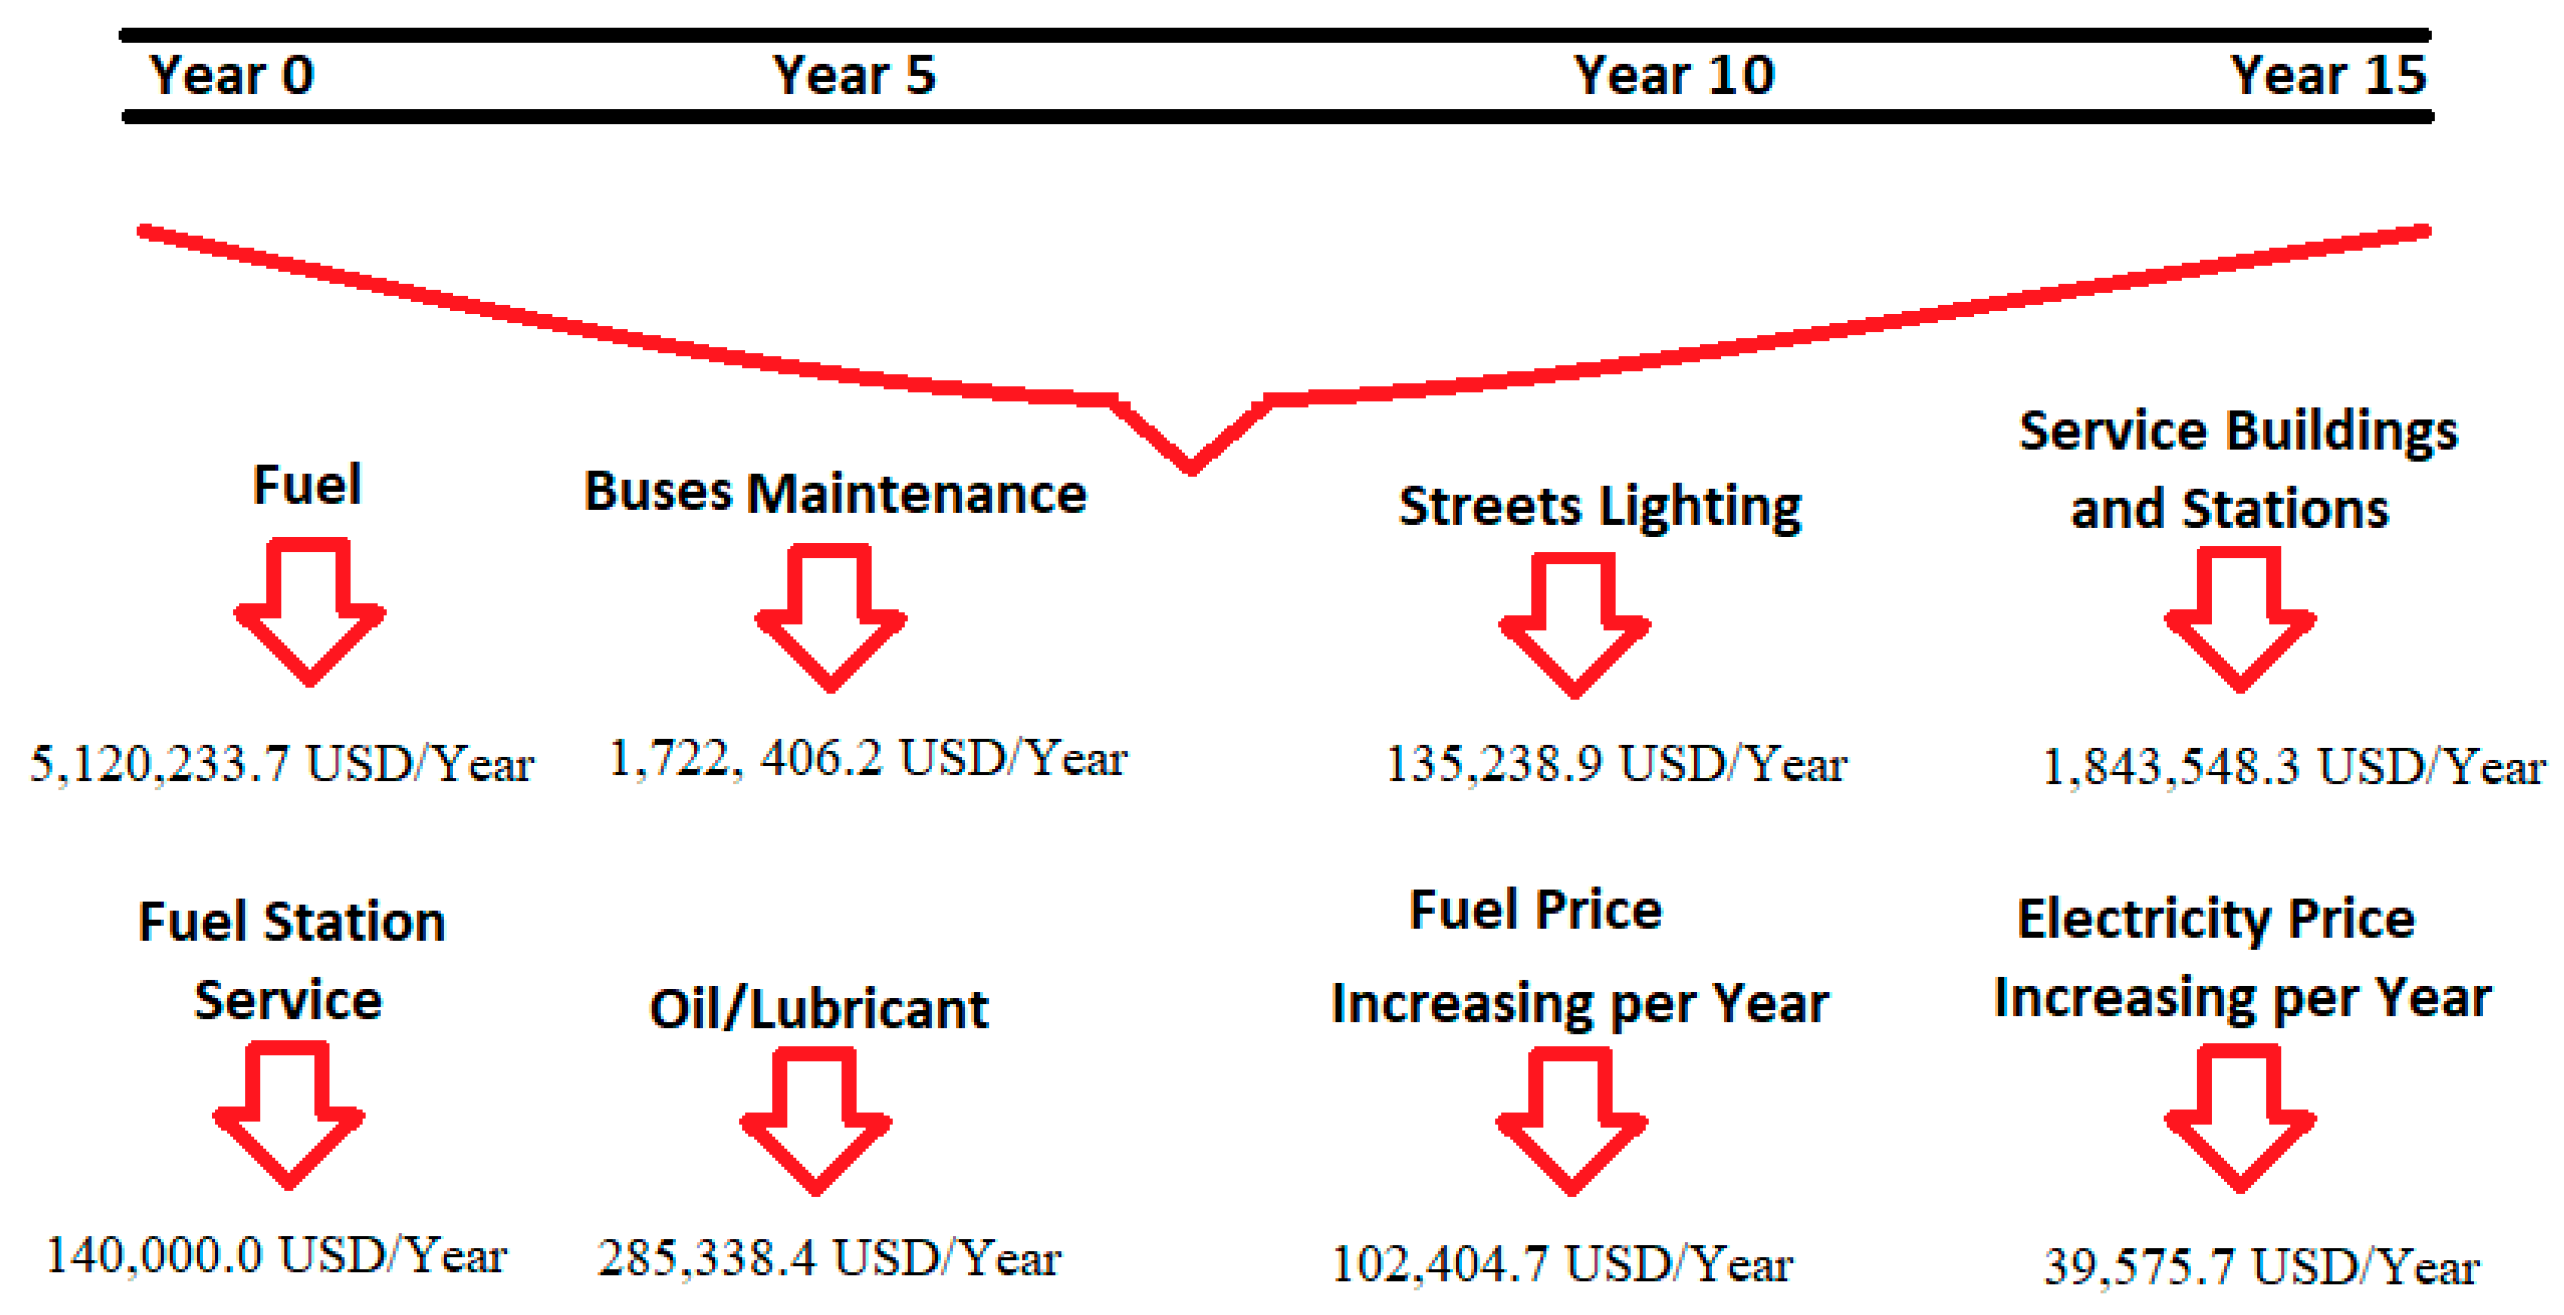
The operating expenses (OPEX) for the baseline case include fuel, maintenance, lubricants, fuel station maintenance, electricity for streets lighting, and electricity for service buildings and stations, in addition to the expected increment in diesel and grid electricity prices. These factors are summarized in
Figure 7.
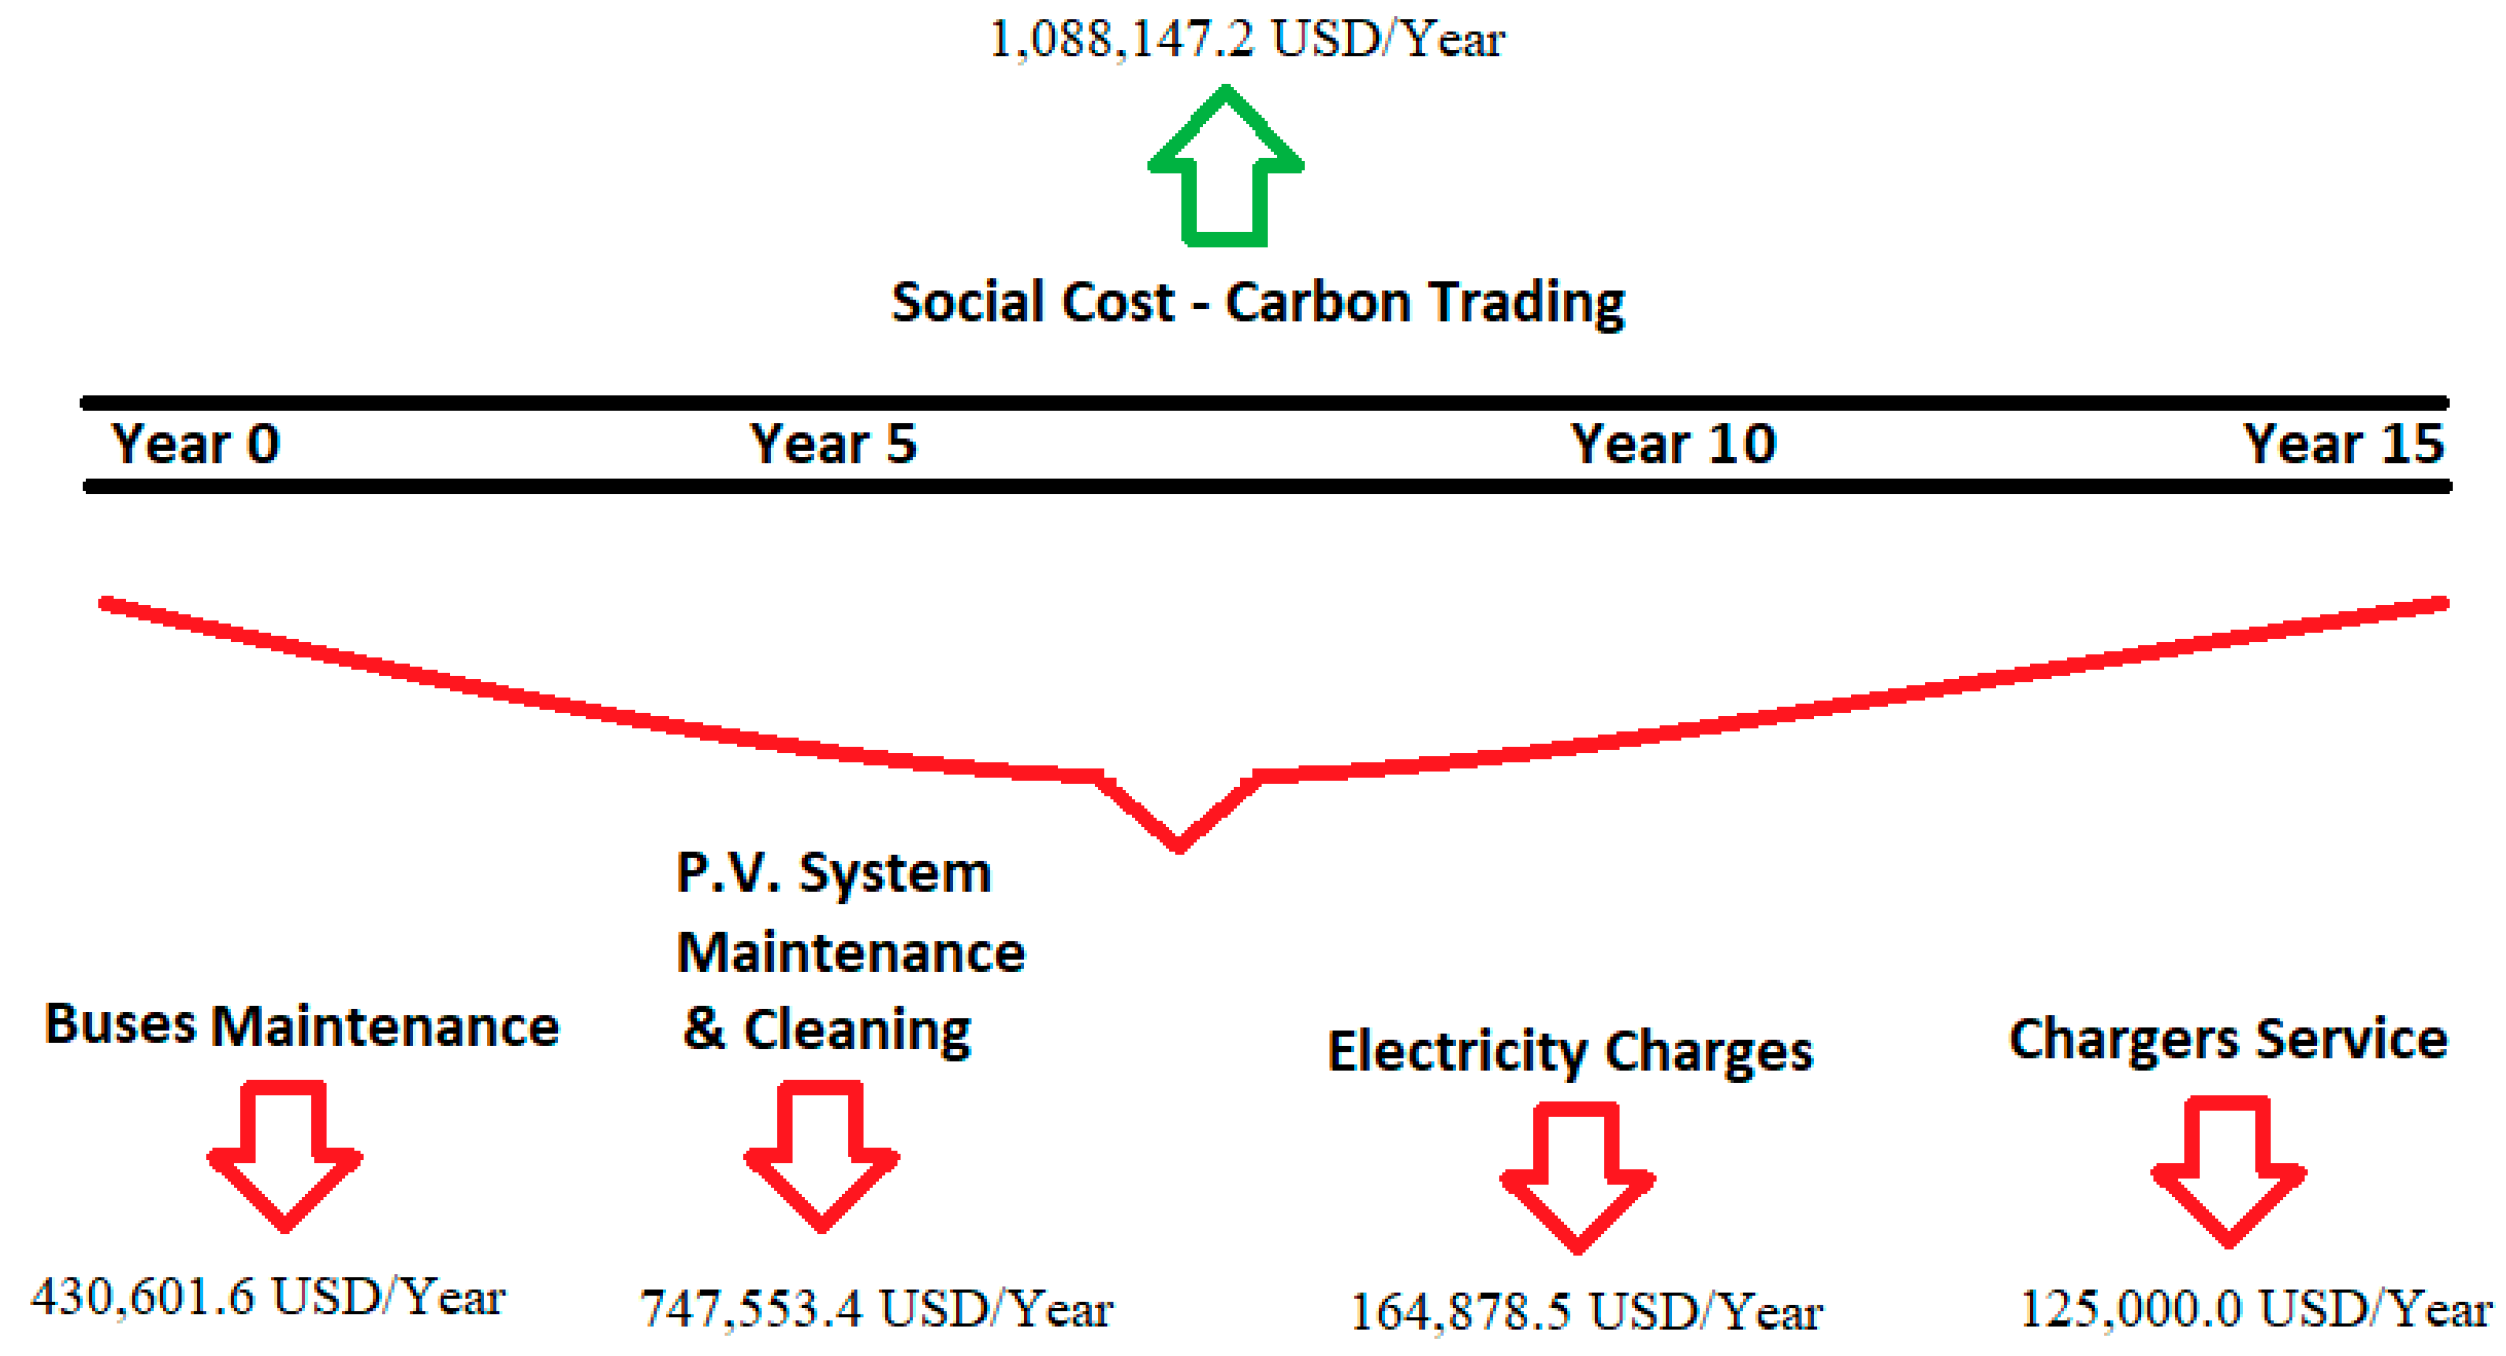
On the other hand, OPEX for the PV electric bus model is much lower due to use of electric buses and electricity generated from the PV system. Savings from social cost and carbon trade of emissions are included. Servicing of a PV system is included as 3% of the capital cost per year for general maintenance, and 400 USD/MWp per month for panel cleaning.
Figure 8 shows the OPEX of the PV electric bus model.
The nominal interest rate of 7% is used in the calculations; 3.1% is the average inflation rate in Jordan. Assigning these rates in the net present value formulas and applying the same on the CAPEX and OPEX of both baseline and PV electric bus model results in the following NPV values in
Table 10.
4. Discussion
To be able to properly design a PV system to meet the energy needs of transforming the traditional system to a more sustainable system, several scenarios were proposed for the PV system design. The scenarios were based on what areas to use, and analyzed based on energy yield, using actual shading data that were acquired from the physical location. A grading system was proposed, based on these results. The equation proposed uses weights that represent project priorities. In this case study, it was important to produce the required energy, with minimal losses, and a small overhead to make use of the connecting net metering scheme. If a project has different priorities, such as limitless energy injection profit, then the priorities and weight can be changed to reflect that specific scenario. The goal is to use this type of information to provide the designer or decision maker with additional information for better design decisions.
Scenario 3 has the highest score and meets capacity requirements, with lower losses and a higher specific yield than scenarios 1, 2, 5, and 6. This scenario proposes installing PV panels with an overall capacity of 20,017.00 kWp in order to generate 34,696,000.00 kWh per year. As the generated energy is slightly above the requirement, it provides a safety margin. This is important, as the design is based on a simulation; and as the system will be connected using a net-metering scheme, excess energy is forfeit and energy deficit is billed.
Deploying this sustainable upgrade will result in eliminating the release of 27,204 metric tons of CO2 a year. As the project has an expected lifetime of 15 years; this results in 408,060 metric tons of CO2 emission reduction. Regardless of what scenario is chosen, as long as all energy required from the upgrade is supplied through a renewable energy sources, then all emissions are eliminated.
After converting the capital investments for the baseline buses and PV-supplied electric buses to net present value (NPV), and using the same approach for OPEX, it was found that the NPV for the incremental investment is 55,127,343 USD, while savings in operational costs are 101,579,427 USD over 15 years. With those results, the payback period is around seven years. For such an important project and the huge impact on the environment and society, seven years for returning the initial investment is very good, bearing in mind the calculations were based on a 15 year project lifetime. Much of the installed equipment will last for much longer.
The total cost of ownership (TCO) for the baseline buses and proposed model is another valid comparison. It was found that the TCO for the business-as-usual scenario is much higher than the TCO of the PV electric bus model by about 32%. TCO for business-as-usual scenario in NPV is 192,628,125 USD over 15 years, while TCO for PV electric bus model in NPV is 146,176,041 USD over the same time period.
5. Conclusions
The use of sustainable and renewable energy concepts for mass public transportation was proposed and analyzed in this paper. Electric buses are used instead of diesel buses, and elevating the photovoltaic system above the bus routes is used to charge the buses’ batteries. The concept was applied to the Amman BRT project as a case study under investigation.
Converting conventional transportation systems into clean and green systems requires careful design and projecting multiple scenarios that vary by nature and impact. PV system yield along the whole route was studied and zoned, and several design scenarios were proposed. The most feasible and practical scenario for PV system implementation is the one that excludes zones with high shading losses, due to high raised objects, and generates energy that covers the load demand with an acceptable cap over. Elevated PV panels are available on the market, easy to install, with high efficiency and low cost, easy to maintain, and give the opportunity to benefit horizon above buses and routes. Moreover, they provide attractive shading that does eliminate direct sunrays but not the light from reaching buses cabins and then reduce AC loads.
The PV-supplied electric bus upgrade is a better alternative, with about 46,452,084 USD NPV savings over 15 years compared to the baseline case. The payback period for the proposed scenario was found to be 7.1 years. Payback period calculations included the incremental cost by calculating CAPEX and OPEX for the two cases.
The negative environmental effects of using diesel as a fuel for the buses were eliminated. The overall result is eliminating the release of 27,204 metric tons of CO2 per year, the equivalent of 408,060 metric tons in the 15 year lifetime of the project. In conclusion, the proposed upgrade is economically feasible and environmentally viable.
The green streets fundamentals and models are economically feasible and environmentally viable. With the negative effects of emissions on the planet and life, converting to green streets is substantial and not optional anymore. Implementing green streets solutions in cities will reduce emissions and pollution, enhance the quality of life, save money, and attain awareness for people towards sustainable transportation means and renewable energy systems.


