1. Introduction
The paddy moisture content is the main technical and economic indicator to evaluate the paddy quality in grain harvest, storage and transportation [
1]. A high moisture content will cause vigorous microbial life in the paddy, which results in mold in the paddy [
2,
3]. The weight of the paddy will decrease with the reduction in moisture content, which seriously affects the economic benefit of paddy cultivation [
4]. With the rapid development of agricultural mechanization, a large amount of high-moisture paddy is harvested in a short time, which generates a large drying requirement. In order to ensure drying efficiency, control precision and improve the quality of dried paddy, an accurate and stable online paddy moisture sensor is essential.
A paddy moisture measurement consists of direct measurements and indirect measurements [
5,
6,
7,
8]. The direct measurement involves calculating the paddy moisture content directly by quality difference before and after drying. The indirect measurement involves measuring the paddy moisture content by correlation between the moisture content of the paddy and the resistance or capacitance of the paddy. The direct measurement is accurate but time-consuming, which does not meet the needs of a rapid online paddy moisture sensing. Therefore, the indirect measurement is mainly used at present. As indirect measurement method for paddy moisture, a capacitance method, a resistance method, a near infrared method, a microwave method, a high-frequency impedance method, an acoustic method, a neutron method, and a nuclear magnetic resonance method have been widely studied by researchers. Because of economy and fast detection, capacitance and resistance moisture measurement methods have received great attention from researchers [
9,
10,
11,
12,
13,
14,
15].
The capacitance method has the advantages of simple structure, high moisture sensitivity, good dynamic characteristic, and high reliability, which meet the current needs of grain moisture detection [
3,
5,
6]. The different moisture contents of paddy have different dielectric properties, for the relative dielectric constant of free water is about 80 while the relative dielectric constant of dry paddy is less than 3 [
16,
17,
18]. This provides a theoretical basis for capacitive grain moisture detection. However, in addition to the moisture content, the grain variety, excitation frequency, bulk density, and temperature will affect the detection results of a capacitive grain moisture sensor [
7,
9]. So, the accuracy and stability of detection results cannot be guaranteed [
19,
20,
21,
22,
23,
24]. In order to improve the detection accuracy of different grain varieties, researchers study their dielectric properties in different excitation frequencies, moisture contents, temperature, and densities [
25,
26,
27,
28,
29,
30,
31].
The intelligent control of the paddy drying process is an necessary development trend to reduce energy consumption and improve paddy quality. Further, the accurate detection of the paddy moisture content is the basis for the intelligent control of the paddy drying process. Firstly, in order to ensure the drying efficiency, most of the grain dryers are hot-air driers with high temperatures of 40~80 °C, but the detection temperature range of the most commonly used paddy moisture detection sensors are 0~50 °C, such as the capacitive quick grain moisture tester PM-8188-A. So, it is necessary to design experiments to study the electrical characteristics of paddy under high temperatures of 40~80 °C. Secondly, the electrical properties of the paddy are decided by the paddy moisture and the composition of the paddy. The paddy composition will change in storage. In order to ensure that the paddy samples used in the experiment are as similar as possible to the paddy in the actual drying process, the paddy samples were harvested in the field during the harvest season, cleaned manually, and dried directly to simulate the actual drying process. Thirdly, in the process of grain moisture measurement, the bulk density of the paddy samples will change continuously without becoming settled and compacted before the measurement. So, it is difficult to accurately control the bulk density of the paddy during the detection process. This study mainly explores how to improve the detection accuracy of paddy moisture under high temperature conditions. Therefore, the paddy samples used in the sensors will be settled and compacted to eliminate the influence of bulk density.
The aim of this study is to design a reliable capacitive paddy moisture sensor. Currently, the main used impedance measurement chips have an excitation frequency range of Hz to MHz, such as AD5933. Therefore, it is necessary to use impedance analysis technology, which is dedicated to studying the dielectric spectrum of the materials on 101~107 Hz, to study the impedance characteristics of paddy for the selection of the excitation frequency.
This study strictly controlled the temperature and humidity environment of the paddy dielectric properties detected in paddy drying process. It studied the electrical impedance spectroscopy of paddy in different moisture content and different temperature 40~80 °C by an impedance analyzer, and then established a paddy moisture detection model. Based on the experimental results and established model, a paddy moisture sensor was designed.
2. Materials and Methods
Wu Yu Jing 3 (Oryza sativa L.) was selected as the research paddy variety. The paddy samples were obtained from the field of thousand Li village, Gu Yang Town, Dantu District, Zhenjiang City, Jiangsu province, China at harvest time. The initial moisture content of Wu Yu Jing 3 was approximately 29.46% (w.b.). The paddy moisture content in the following were in wet base. The paddy samples were sieved to remove foreign matter, and immature and broken seeds. The paddy samples were sealed in polyethylene bags and stored in a refrigerator at approximately 4 °C before the experiments.
This study adopted the method of sampling while drying. Paddy samples with different moisture content were obtained by sampling directly from the paddy samples during the drying. This made sure that the paddy samples with different moisture contents were in accordance with the actual paddy grain conditions during actual drying. Because of the possible natural drying of the samples during the paddy impedance electrical measurements, the paddy moisture content was determined immediately after the electrical measurements.
The paddy dielectric properties were determined by the impedance measurement system which was mainly composed of Solartron impedance analyzer 1260A + 1294, computer testing software SMaRT, a constant temperature and humidity chamber, and a coaxial cylindrical capacitor, as shown in
Figure 1.
Before conducting the experiments, the Solartron impedance analyzer needed to be preheated for 1 h to ensure detection stability and measurement accuracy. The impedance analyzer was programmed to measure the paddy dielectric properties at 61 frequencies ranging from 100 Hz to 1 MHz in the logarithmic scanning mode. The measurement results contained impedance magnitude, impedance phase degree, admittance magnitude, and capacitance magnitude. In a constant temperature, the paddy sample was dried, and its dielectric properties were detected until the moisture content of the paddy sample was 14% or below. The temperature ranged from 40 °C to 80 °C with 5 °C intervals. The ranges of research parameters are shown in
Table 1.
Taking a temperature of 50 °C as an example, the experimental steps were as follows. Firstly, a 200 g (error ≤ 0.1 g) paddy sample was selected evenly and distributed in a stainless steel disc uniformly with a layer thickness of 10 mm. The paddy sample was dried in a drying chamber (with accuracy of ±0.5 °C) with drying temperature of 50 °C. Secondly, the paddy sample was taken out of the drying chamber every 30~60 min, the coaxial cylindrical capacitor was filled with the paddy sample, and the paddy sample was settled with increasing intensities. Then, manually pressing into the coaxial cylindrical capacitor was performed in to obtain higher densities and the uniform volume. Thirdly, the coaxial cylindrical capacitor which was filled with paddy sample was placed into constant temperature and humidity chamber with a temperature of 50 °C and a humidity of 70%. After the temperature and humidity became stable, the test software SMaRT was used to measure and collect the impedance spectrum of the paddy sample. Fourthly, after the measurement of paddy impedance spectrum, the quality of all paddy samples was measured, the current moisture content of the paddy sample was calculated and recorded. Fifth, the second, third and fourth steps were repeated until the paddy moisture content reached below its safe moisture value of 14%.
3. Results and Discussion
3.1. Determination of Frequency
Figure 2 shows the paddy capacitance in moisture ranged from 14% to 29% over the frequency ranged from 100 Hz to 1 MHz with the temperature ranged from 40 °C to 80 °C in a log-log plot. It can be seen clearly that the capacitance of the paddy had a negative relationship with frequency over 100 Hz to 1 MHz, and it decreased with increasing frequency. The variation of the paddy capacitance with frequency at different temperatures have the same trend. Except when the frequency was lower than 1 kHz, the capacitance fluctuated with increasing frequency in low paddy moisture content, especially in low temperature. The effect of frequency on the capacitance was more prominent at a higher paddy moisture.
The dielectric constant is positively correlated with the paddy capacitance, as shown in the following equation:
where
ε0 is the vacuum dielectric constant,
ε is the relative dielectric constant of paddy samples,
L is the high of coaxial cylindrical capacitor,
R1 is the inner cylinder radius of coaxial cylindrical capacitor and
R2 is the outer cylinder radius of coaxial cylindrical capacitor.
It can be seen from
Figure 2 that the paddy sample had a relatively stable relaxation process in the frequency range of 1 kHz to 1 MHz. The negative linear relationship between capacitance and frequency (1 kHz–1 MHz) could be because the relaxation polarization takes a certain time to complete under the action of an electric field. Therefore, when the frequency of an alternating electric field rises gradually from zero, the change of polarization direction cannot keep up with the change of electric field direction, so the relaxation polarization cannot be fully established [
32,
33,
34]. Then the paddy capacitance decreases as the frequency increases and the energy is consumed because of the turning of the dipole moment and phase lag between the electrical fields.
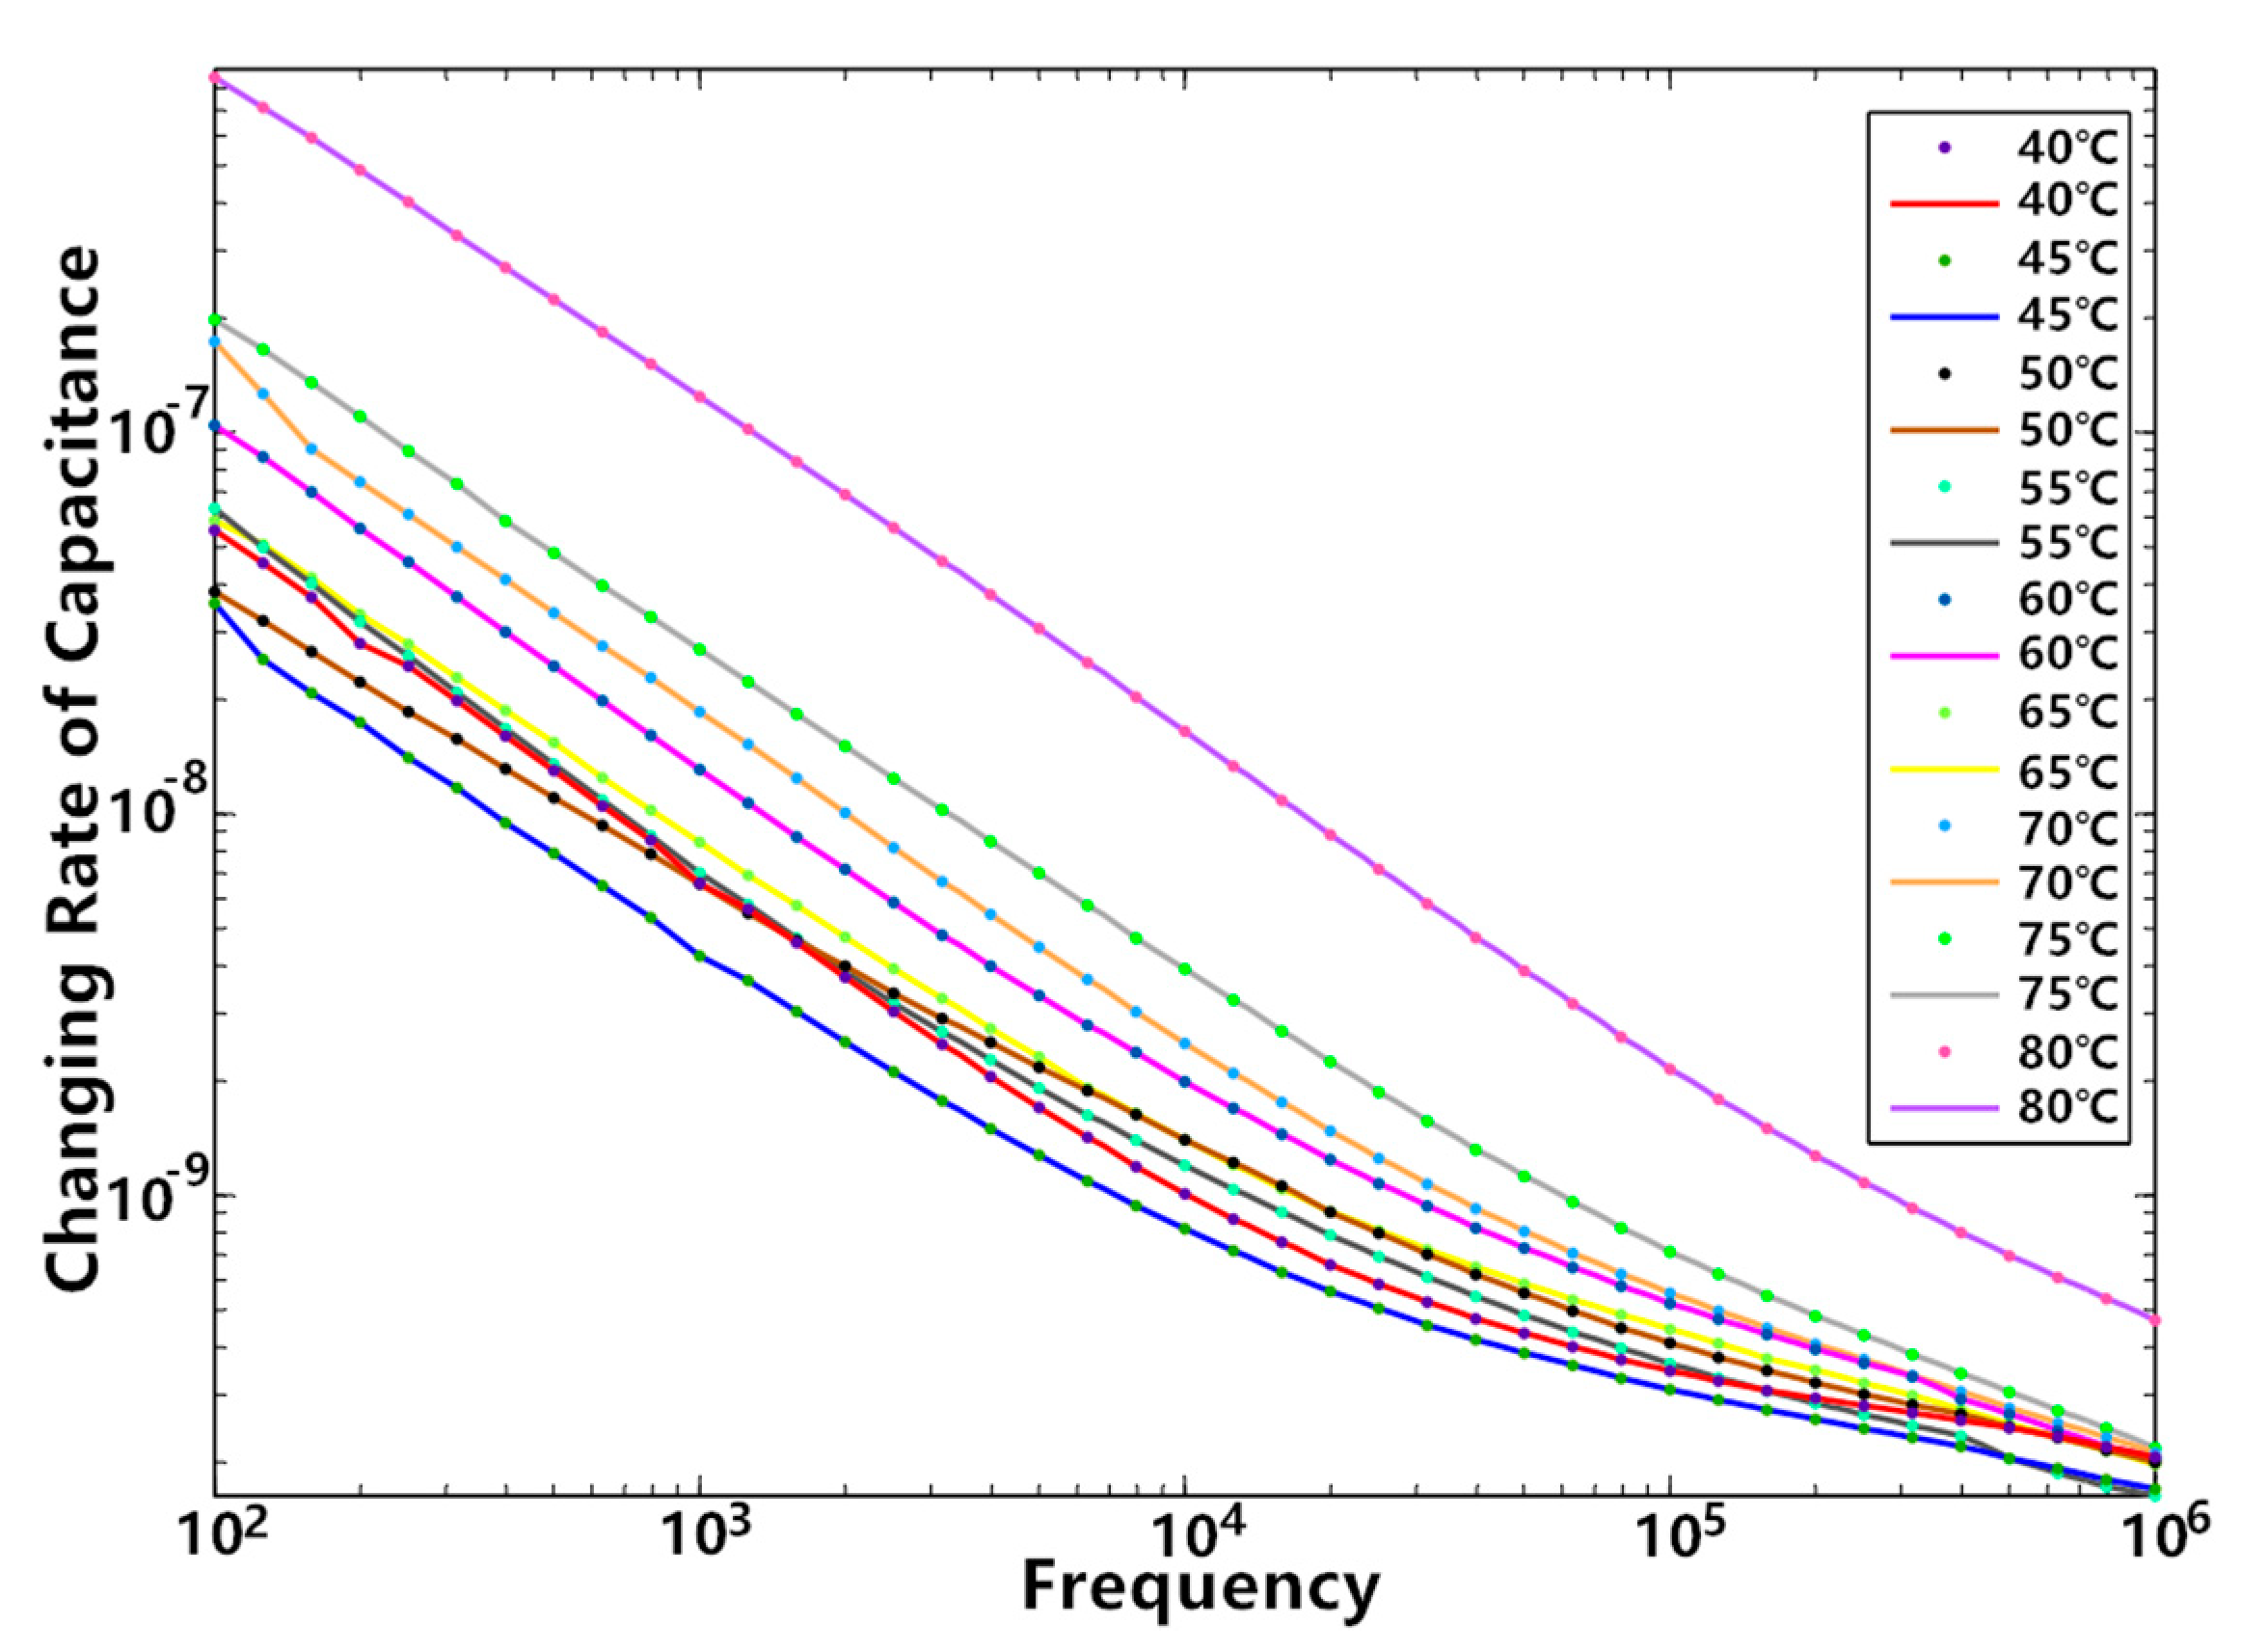
Under the same temperature range of 40 °C to 80 °C and the same frequency range of 100 Hz to 1 MHz, define the difference between the maximum capacitance and the minimum capacitance divided by the moisture interval as the change rate of capacitance as follows:
where
CTFCt and f is the change rate of capacitance,
is the capacitance of the experimental sample with maximum moisture content, and
is the capacitance of the experimental sample with minimum moisture content in temperature
t and frequency
f.
MIt is the difference between the maximum moisture content and the minimum moisture content of experimental samples in temperature
t.
The greater the change rate of capacitance, the greater the change value of capacitance to the change of the paddy moisture content.
Figure 3 shows the changing rate of capacitance over the frequency range from 100 Hz to 1 MHz with temperature range from 40 °C to 80 °C in a log-log plot. It can be clearly seen from the graph that, as the frequency increases, the change rate of capacitance gradually decreases. Paddy capacitance is more sensitive to a change of paddy moisture content at lower frequencies.
It can be seen from the above analysis and
Figure 3 that the lower the frequency, the higher the sensitivity of the capacitance to the change of the moisture. But when the frequencies are lower than 1 kHz at temperature range of 40 °C to 80 °C, the capacitance has obvious fluctuations. When the frequency is slightly greater than 1 kHz, there is still a certain degree of fluctuation at 40 °C and 45 °C. If we set these frequencies as excitation frequencies, it will result in detection errors. In order to ensure the sensitivity, stability, and reliability of the paddy moisture detection model, 2 kHz is selected as the excitation frequency for paddy moisture detection in this study.
3.2. Regression Analysis
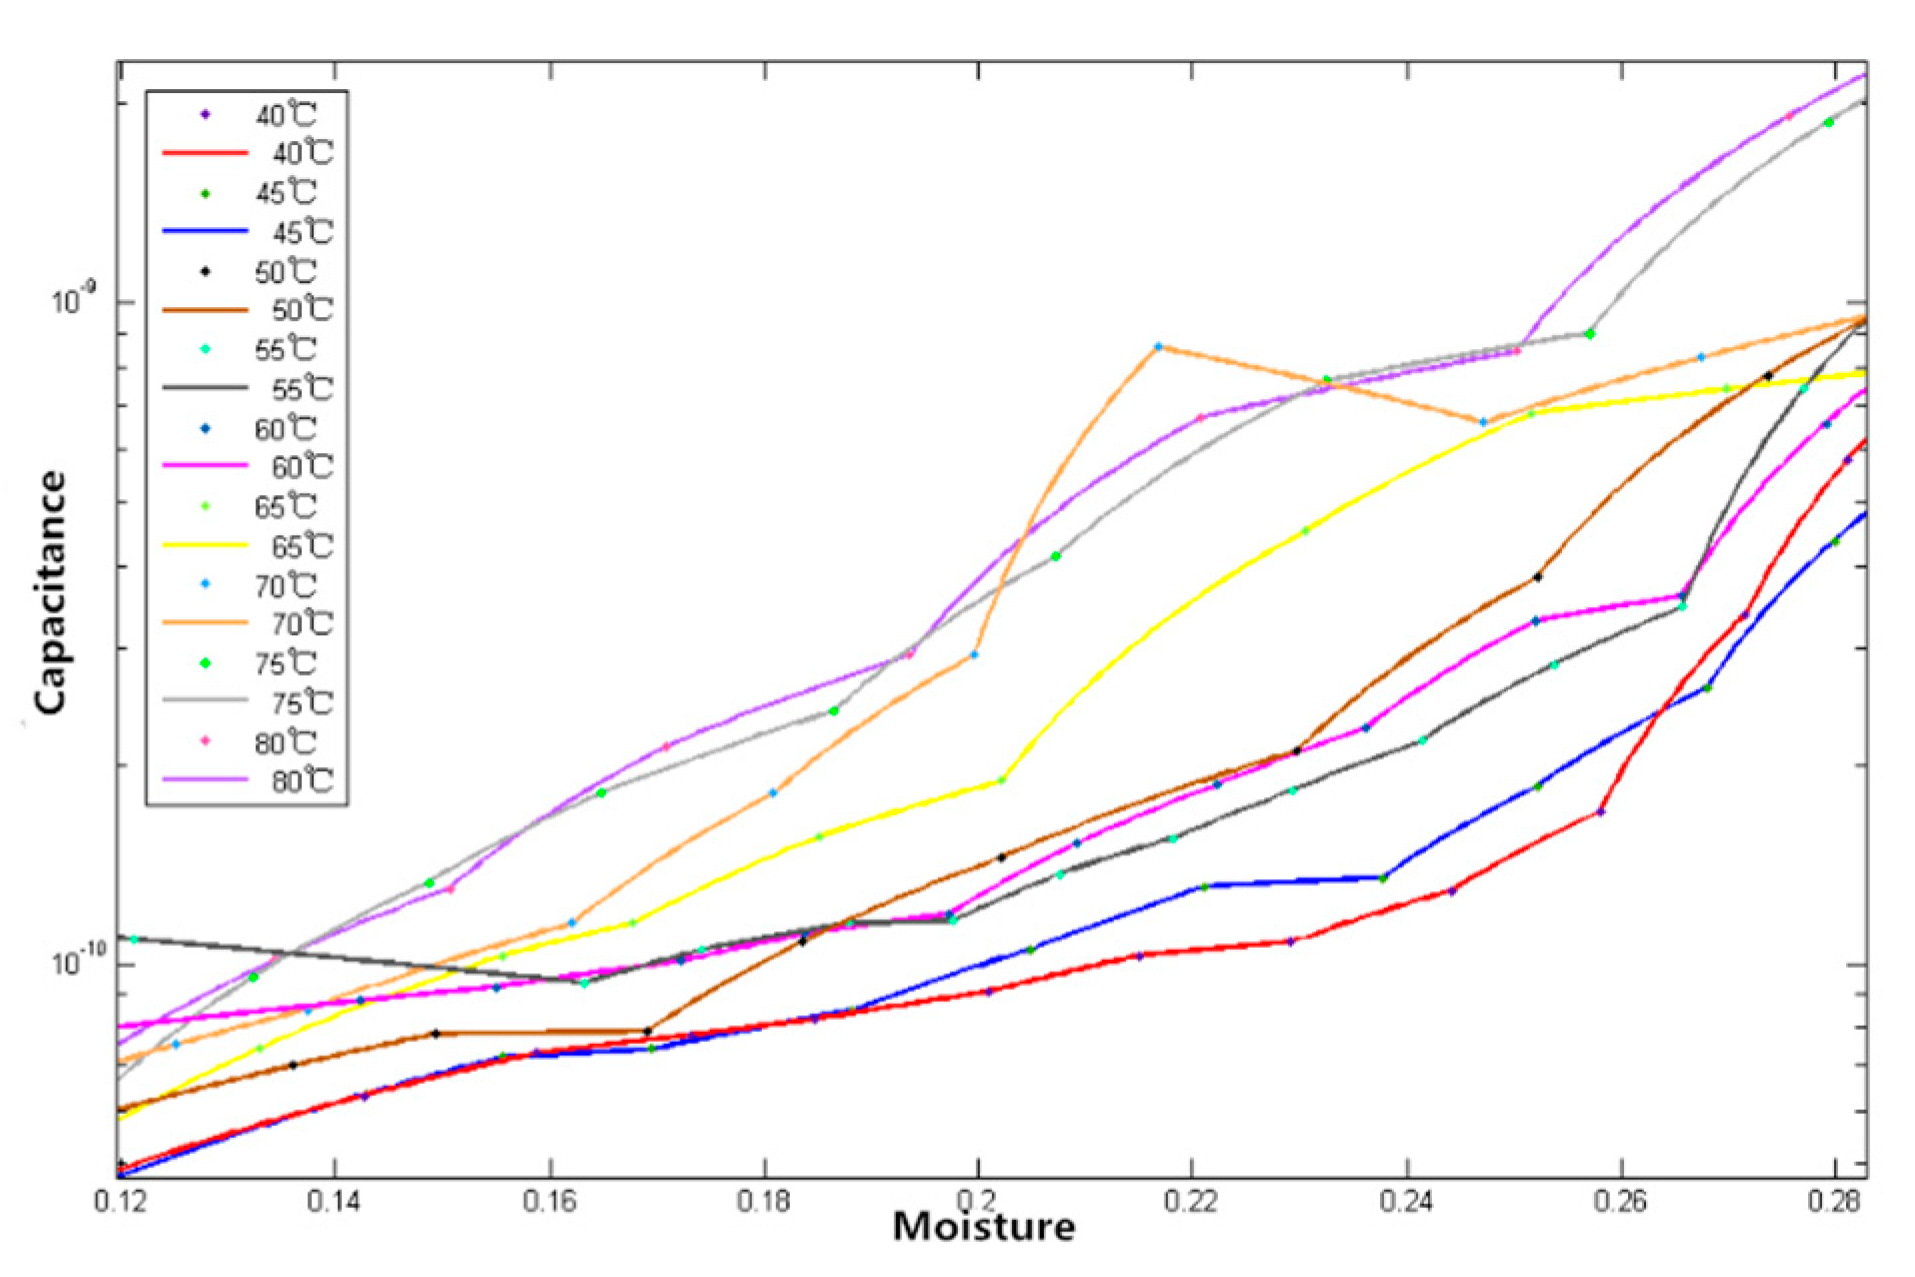
The relationship between capacitance and moisture at 2 kHz with different temperatures is shown in
Figure 4. It can be seen clearly that the capacitance increased with increasing moisture and the paddy capacitance was greater at a high temperature.
When the temperature was low, the relaxation time was very large and the molecular thermal motion was very weak, so the relaxation polarization related to thermal motion was established very slowly, almost in the “frozen” state, which causes that relaxation polarization lags far behind the change of the electric field [
32,
33,
34]. However, with the increase of temperature, the relaxation time shortens and relaxation polarization increases [
32,
33,
34]. Therefore, the paddy capacitance increases with the increase of temperature, as shown in the
Figure 4.
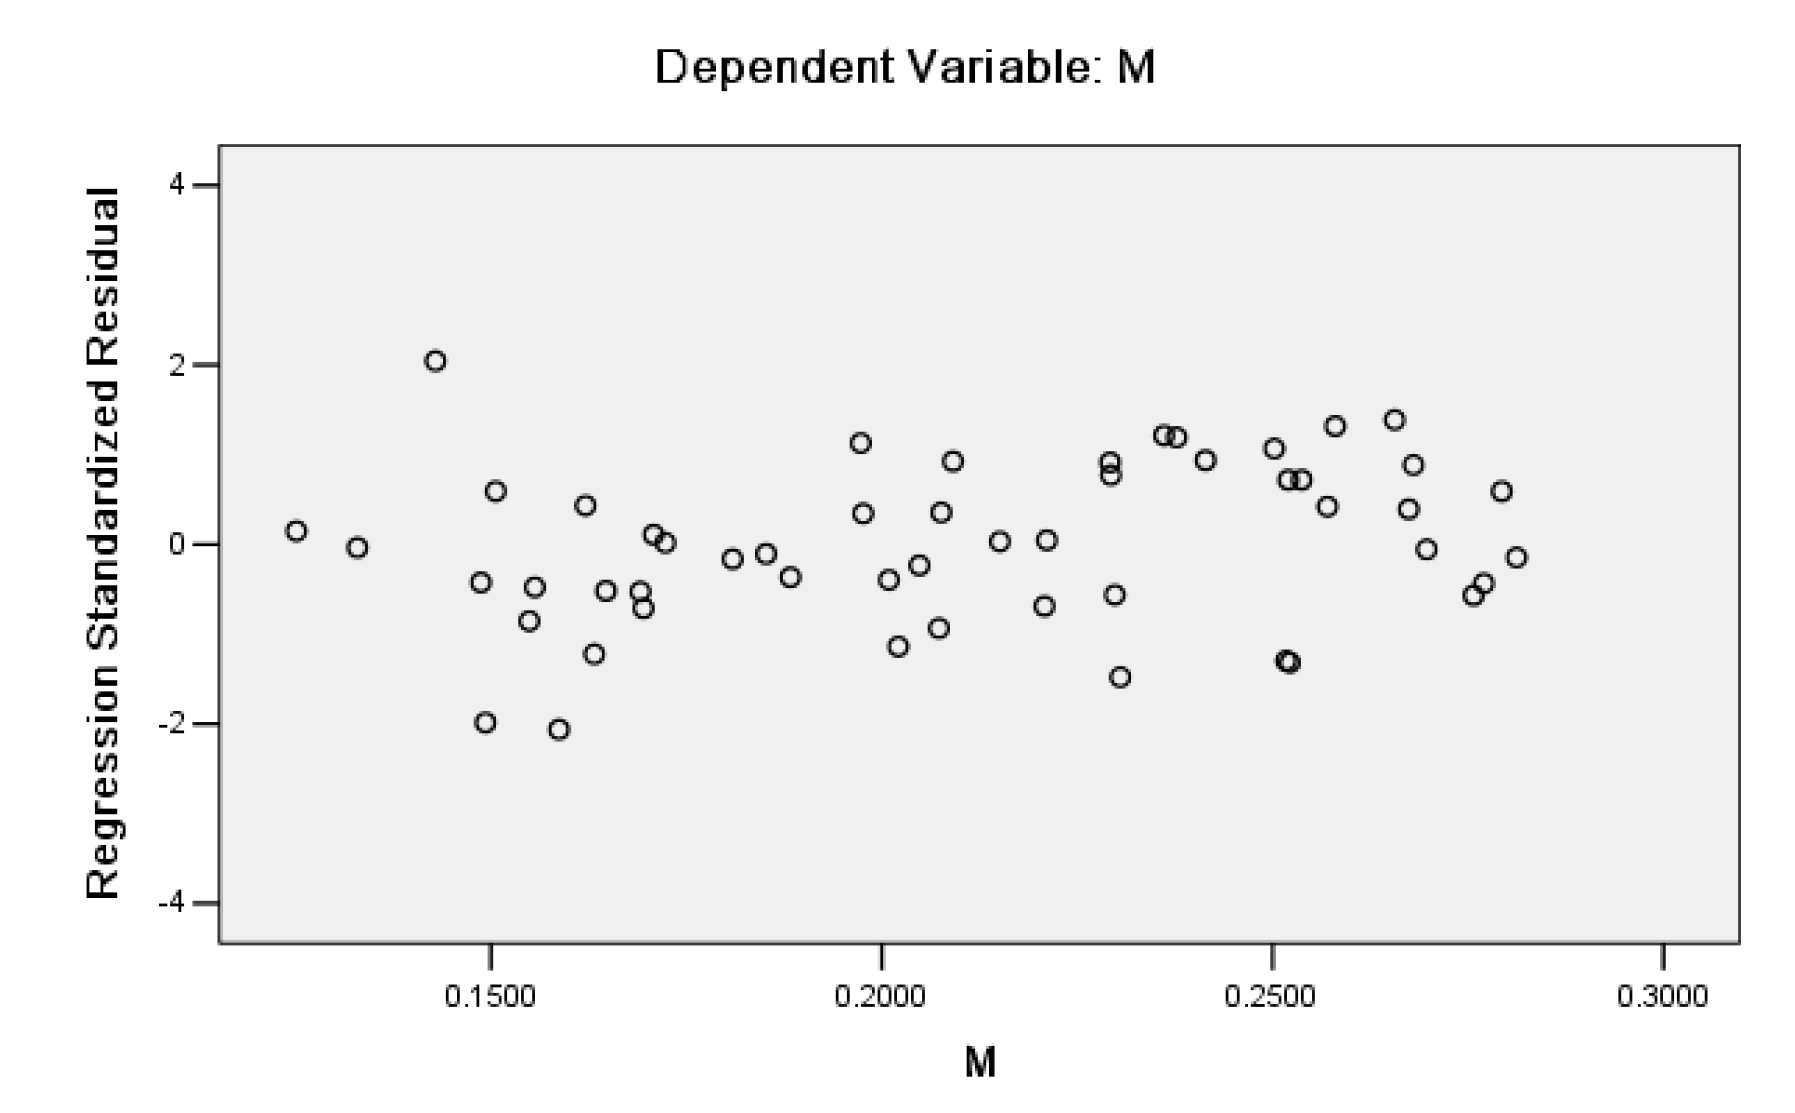
The capacitance and temperature at 2 kHz were normalized and two-thirds of the experimental data points (i.e., 55 experimental points) were selected evenly. Then, these experimental data points were analyzed by multivariate nonlinear regression analysis using SPSS to establish paddy regression models that acquire the paddy moisture content by paddy capacitance and temperature. The remaining third of the experimental data points (i.e., 28 experiments points) were used to evaluate the paddy moisture detection models.
In the process of regression analysis, if the standardized residual of any experimental measurement point falls outside the interval (−2, 2), it will be determined as an abnormal experimental point with a 95% confidence level and will not participate in the fitting of the regression model. Repeated screening and fitting were carried out until there were no abnormal experimental points in the model. After removing the abnormal experimental points, the remaining 51 experimental points were used for fitting. The results observed allow the use of the following regression model to predict paddy moisture by the paddy capacitance and temperature:
where
C is the normalized paddy capacitance and
T is the normalized temperature.
The R
2 of the paddy moisture detection models at 2 kHz is 0.933 and the adjusted R
2 is 0.917. It can be seen clearly that the regression standardized residuals of these models were distributed evenly, as shown in
Figure 5.
The remaining 28 test points were used to evaluate the fit of the model. The standard deviation in the fitting test was 1.14% and the standardized residuals are shown in
Figure 6.
4. The Paddy Moisture Sensor
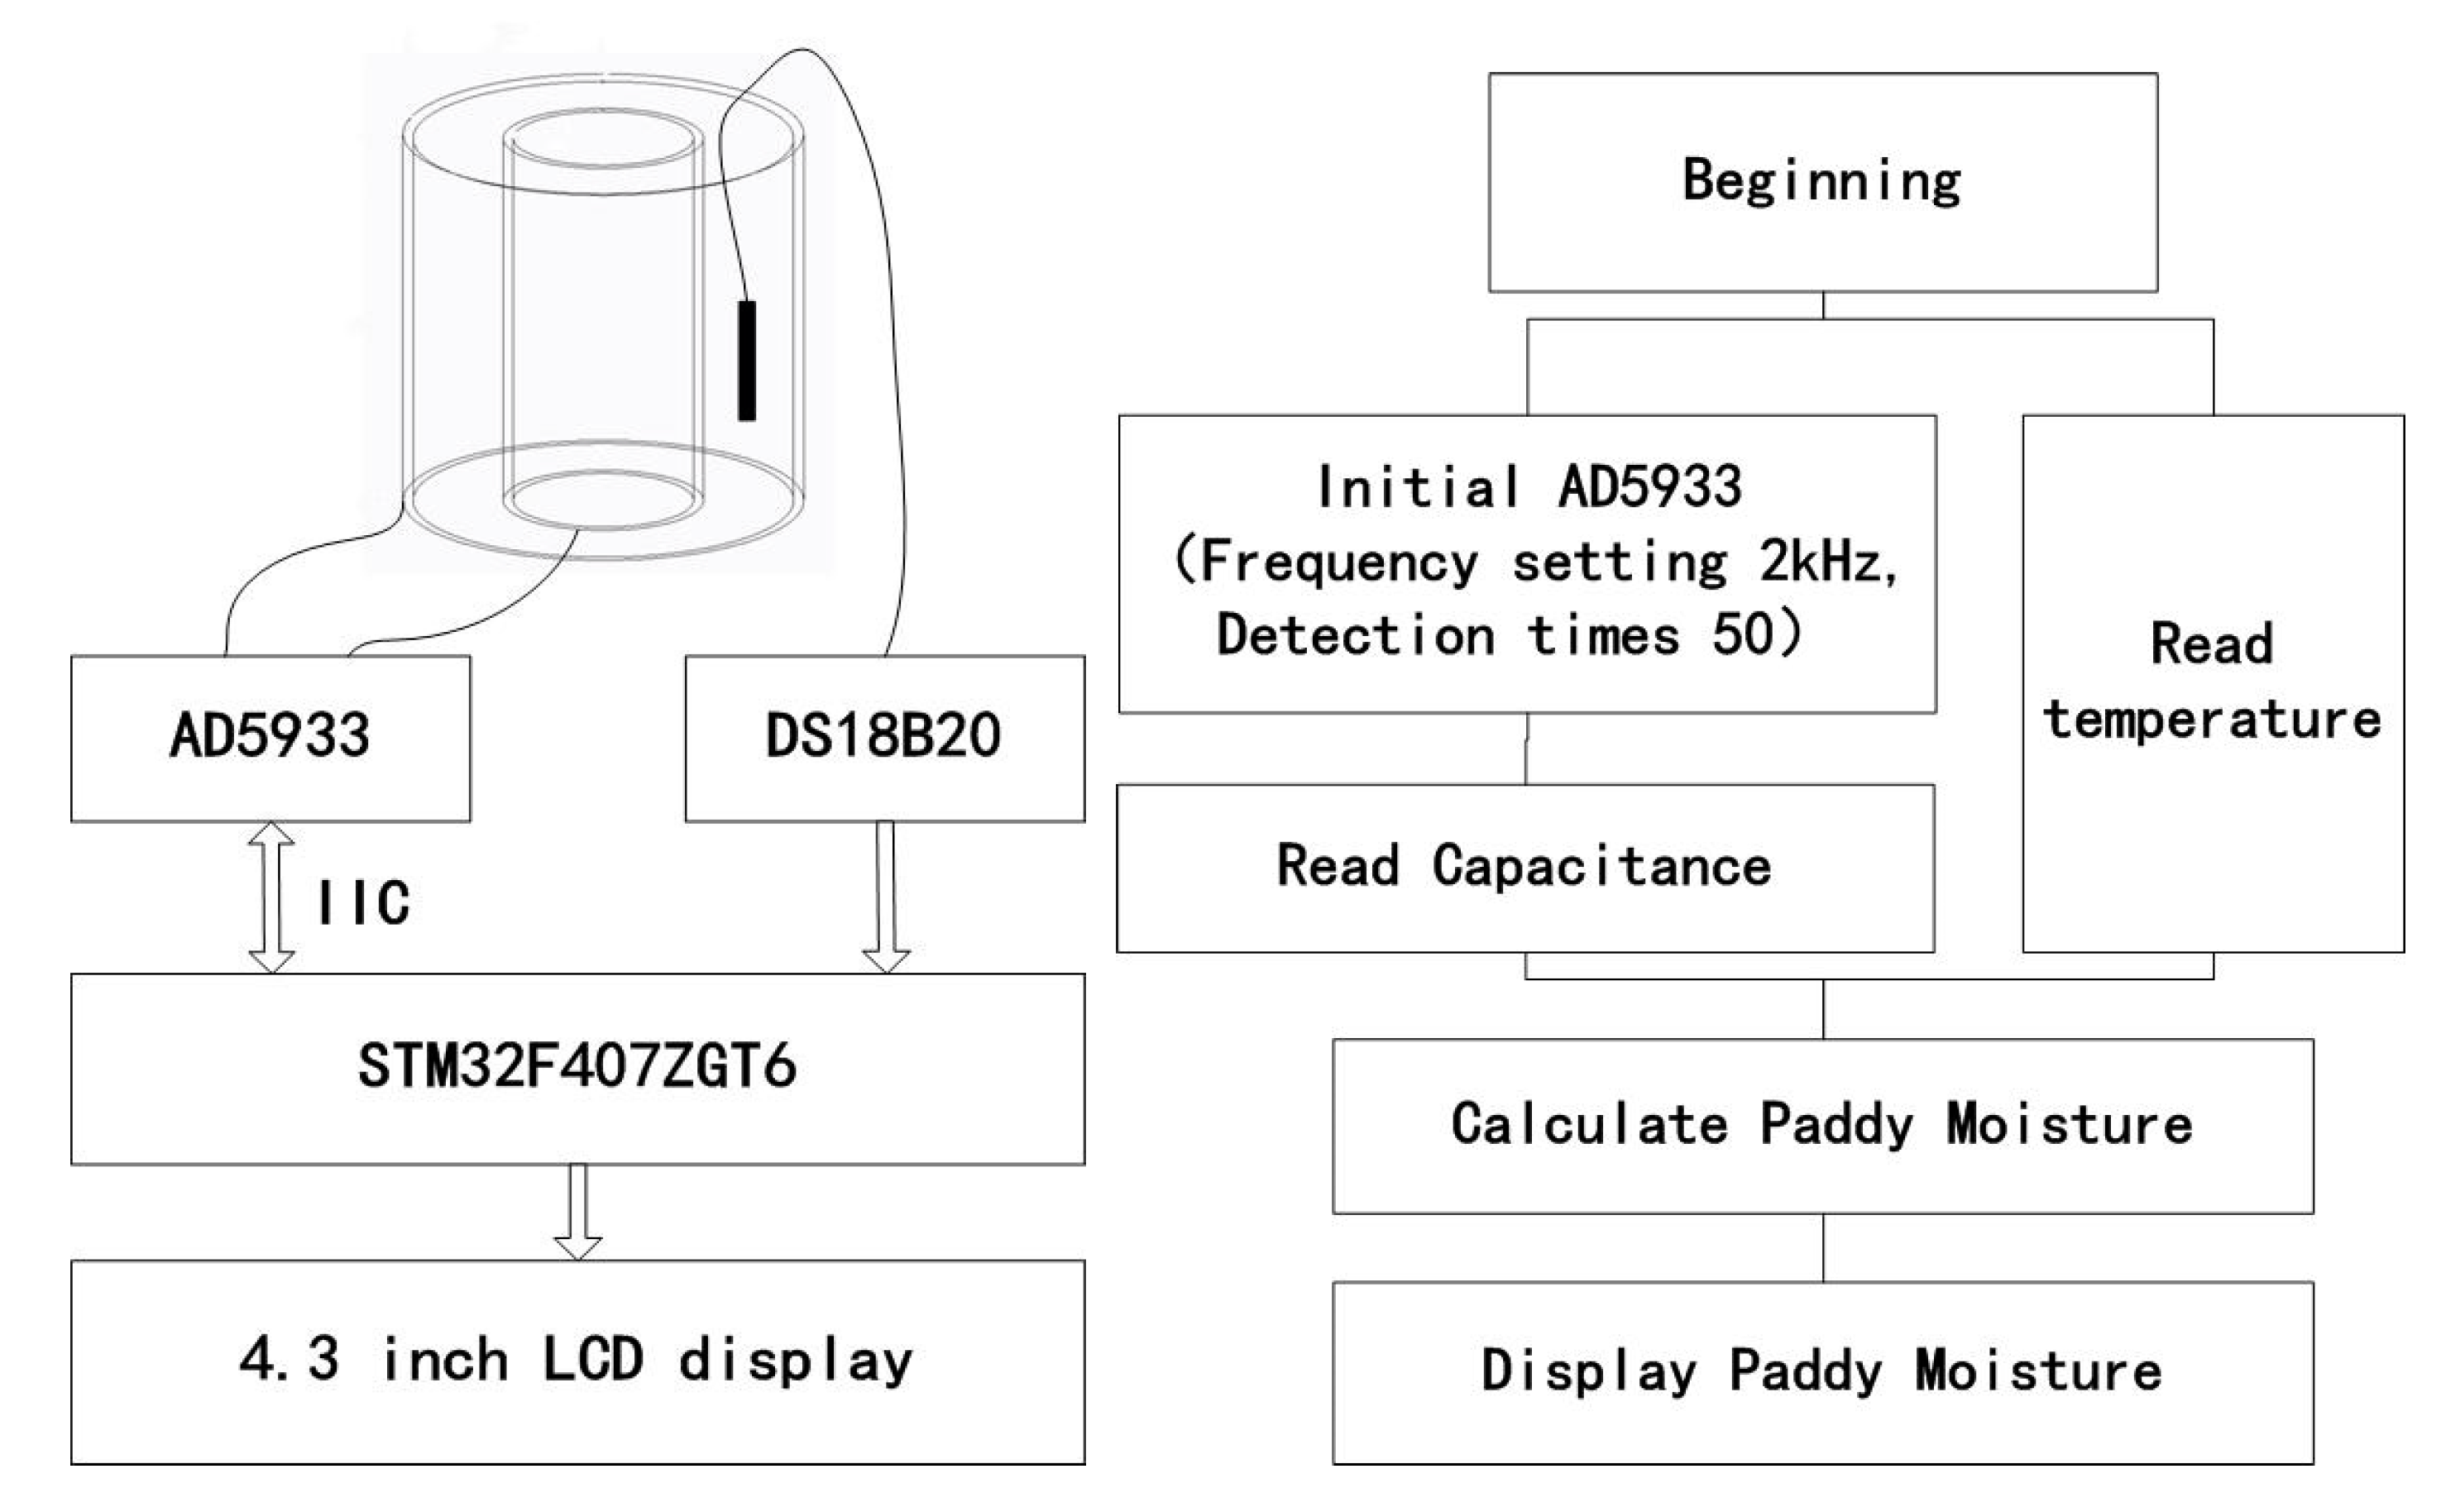
4.1. Hardware and Software of a Paddy Moisture Sensor
The hardware of the paddy moisture sensor mainly comprises a coaxial cylindrical capacitor, a capacitance detection integrated chip AD5933, digital temperature sensors DS18B20, a 4.3-inch LCD display, and a control chip STM32F407ZGT6, as shown in
Figure 7. AD5933 applies the excitation frequency to the coaxial cylindrical capacitor and then detects the capacitance of the coaxial cylindrical capacitor containing the paddy sample and transmits it to the control chip STM32F407ZGT6 via IIC. The probe of DS18B20 is placed inside the capacitive sensor, monitoring the paddy temperature in real time during the detection process. DS18B20 converts the paddy temperature into a digital signal and transmits it to the control chip. The control chip STM32F407ZGT6 substitutes the capacitance value obtained by AD5933 and the temperature value obtained by DS18B20 into Equation (1), and then the current paddy moisture can be calculated and shown on a 4.3-inch LCD display. The control chip STM32F407ZGT6 was programed by Keil uVision5 (MDK5) to communicate with AD5933 (initialize AD5933 and read capacitance), read temperature, and display the paddy moisture. The detection flowchart is shown in
Figure 7. During the initialization of AD5933, the excitation frequency was set to 2 kHz based on the results of paddy electrical impedance spectroscopy analysis and the detection time was set to 50 for detection accuracy and speed.
4.2. Evaluation of Paddy Moisture Sensor
A moisture detection experiment was carried out to evaluate the designed paddy moisture sensor. Paddy variety Nanjing 9108 (
Oryza sativa L.) was obtained from Jiangsu Runguo High Efficiency Ecological Agriculture Base in Yaoqiao Town, Zhenjiang New Area, Zhenjiang City, Jiangsu Province. The initial moisture contents of the three samples were 16.45%, 19.20%, 23.29% (w.b.). After drying operations or re-watering operations, twenty test samples were obtained with moisture contents randomly distributed between 13% and 25%. The paddy samples were sealed in polyethylene bags to avoid the moisture exchange between the samples and the surrounding environment and preheated in drying chamber with temperature range from 40~80 °C. A designed paddy moisture sensor was used to detect the moisture of paddy samples. The coaxial cylindrical capacitor of the paddy moisture sensor was also preheated before every detection. The detection results are shown in
Figure 8. It can be seen from
Figure 8 that the designed paddy moisture sensor can realize the detection of the paddy moisture content, but the detection error is relatively high, especially in the high moisture content. The standard deviation of the detection residual was 1.23%, which is close to the standard deviation in the fitting test. Therefore, the paddy moisture detection model needs to be optimized in the future to improve paddy moisture detection accuracy.
5. Conclusions
Electrical impedance spectroscopy experiments of paddy variety Wu Yu Jing 3 (Oryza sativa L.) were conducted. The paddy moisture detection model was established and the moisture of the paddy variety Nanjing 9108 (Oryza sativa L.) was detected by a designed paddy moisture sensor. The following conclusions can be made from this research.
Paddy capacitance has a negative relationship with frequency. However, when the frequency is lower than 1 kHz, the capacitance fluctuates with increasing frequency in a low paddy moisture content, especially in low temperatures. The changing rate of capacitance to moisture gradually decreases as the frequency increases. In order to ensure the sensitivity, stability, and reliability of the paddy moisture sensor detection value, 2 kHz was selected as the excitation frequency for paddy moisture detection in this study. Two-thirds of the experimental data points (i.e., 55 experiments points) at 2 kHz were modeled by regression analysis and the R2 of the paddy moisture detection model was 0.933. The remaining one-third of the experimental data points (i.e., 28 experiments points) were used to evaluate the paddy moisture detection models, and the standard deviation was 1.14%.
The designed paddy moisture sensor can realize the detection of the paddy moisture content, but the detection error is relatively high, especially in the high moisture content. The standard deviation of detection residual was 1.23%, which is close to the standard deviation of 1.14% in the fitting test. The paddy moisture detection model needs to be optimized in the future to improve the paddy moisture detection accuracy.
Author Contributions
Conceptualization, Q.S., X.W., W.S., Z.L., T.T.; resources, X.W., W.S.; methodology, Q.S.; formal analysis, Q.S.; writing—original draft preparation, Q.S.; writing—review and editing, Q.S.; supervision, X.W..; project administration, X.W.; funding acquisition, X.W. All authors have read and agreed to the published version of the manuscript.
Funding
This work was supported by Synergistic Innovation Center of Jiangsu Modern Agricultural Equipment and Technology (4091600010); and Science and Technology Support (Agriculture) Project of Jiangsu Province (BE2014367).
Acknowledgments
This research was conducted in the Central Laboratory of the College of Agricultural Equipment Engineering. Thanks to my supervisor, Wei, for inspiration and guidance of my ideas and experiments and proof-reading the article.
Conflicts of Interest
The authors declare no conflict of interest.
References
- Nelson, S.O.; Trabelsi, S.; Kraszewski, A.W. Advances in sensing grain moisture content by microwave measurements. Trans. ASAE 1998, 41, 483–487. [Google Scholar] [CrossRef]
- Nelson, S.O.; Kraszewski, A.W.; Trabelsi, S.; Lawrence, K.C. Using Cereal Grain Permittivity for Sensing Moisture Content. IEEE Trans. Instrum. Meas. 2000, 49, 470–475. [Google Scholar] [CrossRef]
- Chari, V.K.; Jaya, S. Nondestructive Measurement of Moisture Content Using a Parallel-Plate Capacitance Sensor for Grain and Nuts. IEEE Sens. J. 2010, 10, 1282–1287. [Google Scholar]
- Fariba, J.; Kaida, K.; Daud, W.M.; Yusoff, W.; Jumiah, H. The analysis and design of multi-layer microstrip moisture sensor for paddy grain. Biosyst. Eng. 2010, 106, 324–331. [Google Scholar]
- Willem, C.H. Application of capacitance techniques in sensor design. J. Phys. E 1986, 19, 897–906. [Google Scholar]
- Shyam, N.J.; Narsaiah, K.; Basediya, A.L.; Rajiv, S. Measurement techniques and application of electrical properties for nondestructive quality evaluation of foods—A review. J. Food Sci. Technol. 2011, 48, 387–411. [Google Scholar]
- Wang, W.C.; Dai, Y.Z. A Grain Moisture Detecting System Based on Capacitive Sensor. Int. J. Digital Content Technol. Appl. 2011, 5, 203–209. [Google Scholar]
- Yude, D. Technical Research for Detector of Grain Moisture Content Based on Error Compensation. J. Northeast Agric. Univ. 2014, 21, 76–83. [Google Scholar]
- Stuart, O.N. Factors Affecting the Dielectric Properties of Grain. Trans. ASAE 1982, 25, 1045–1049. [Google Scholar] [CrossRef]
- Nelson, S.O.; Bartley, P.G., Jr. Measuring Frequency- and Temperature-Dependent Dielectric Properties of Food Materials. Trans. ASAE 2000, 43, 1733–1736. [Google Scholar] [CrossRef]
- Stuart, O.N. Dielectric spectroscopy in agriculture. J. Non Cryst. Solids 2005, 351, 2940–2944. [Google Scholar]
- Long, W.; Yukiharu, O.; Akio, T. Electrical impedance spectroscopy analysis of eggplant pulp and effects of drying and freezing–thawing treatments on its impedance characteristics. J. Food Eng. 2008, 87, 274–280. [Google Scholar]
- Yasumasa, A.; Koichi, M.; Naoto, W. Electrical impedance analysis of potato tissues during drying. J. Food Eng. 2014, 21, 24–31. [Google Scholar]
- Shahab, S.; Nelson, S.O. Dependence of dielectric properties of whole-grain in wheat on bulk density. J. Agric. Eng. Res. 1988, 39, 173–179. [Google Scholar]
- Lawrence, K.C.; Windham, W.R.; Nelson, S.O. Wheat moisture determination by 1- to 110-MHz swept -frequency admittance measurements. Trans. ASAE 1998, 41, 135–142. [Google Scholar] [CrossRef]
- Prasad, A.; Singh, P.N. A New Approach to Predicting the Complex Permittivity of paddy. Trans. ASABE 2007, 50, 573–582. [Google Scholar] [CrossRef]
- Caciano, P.; Noreña, Z.; Lescano-Anadón, C.E. Dielectric Properties of Importance in Operations of Post-harvest of Sorghum. Int. J. Food Eng. 2017, 13, 30–37. [Google Scholar]
- Sang, H.N.; Stuart, O.N. Dielectric Properties of paddy at Frequencies from 50 Hz to 12 GHz. Trans. ASAE 1989, 32, 991–998. [Google Scholar] [CrossRef]
- Stuart, O.N. Electrical Properties of Agricultural Products—A Critical Review. Trans. ASAE 1973, 16, 384–400. [Google Scholar] [CrossRef]
- Guo, W.; Tiwari, G.; Tang, J.; Wang, S. Frequency, moisture and temperature-dependent dielectric properties of chickpea flour. Biosyst. Eng. 2008, 10, 217–224. [Google Scholar] [CrossRef]
- Kamil, S.; Ahmet, C. Determination of dielectric properties of corn seeds from 1 to 100 MHz. Powder Technol. 2010, 202, 365–370. [Google Scholar]
- Murat, S.; McKeown, S.; Trabelsi, E.; William, T.; Stuart, O.N. Dielectric spectroscopy measurements for moisture prediction in Vidalia onions. J. Food Eng. 2012, 111, 505–510. [Google Scholar]
- Berbert, P.A.; Moura, E.E.; Molina1, M.A.B.; Soares, K.J.; Oliveira, M.T.R. Density-independent radiofrequency dielectric models for moisture estimation in grain sorghum. Food Meas. 2017, 11, 204–212. [Google Scholar] [CrossRef]
- Stuart, O.; Trabelsi, S. Principles of grain and seed moisture sensing through radio-frequency and microwave dielectric properties. In Proceedings of the 2017 ASABE annual international meeting. American Society of Agricultural and Biological Engineers, Spokane, DC, USA, 16–19 July 2017. [Google Scholar]
- Wenchuan, G.; Wang, J.; Xinhua, Z. Moisture content prediction of oat seeds based on dielectric property. Trans. CSAE 2012, 28, 272–279. (In Chinese) [Google Scholar]
- Lawrence, K.C.; Nelson, S.O.; Bartley, P.G., Jr. Measuring Dielectric Properties of Hard Red Winter Wheat from 1 to 350 MHz with a Flow-Through Coaxial Sample Holder. Trans. ASAE 1998, 41, 143–150. [Google Scholar] [CrossRef]
- Mizukami, Y.; Sawai, Y.; Yamaguchi, Y. Moisture Content Measurement of Tea Leaves by Electrical Impedance and Capacitance. Biosyst. Eng. 2006, 93, 293–299. [Google Scholar] [CrossRef]
- Moura, E.E.; Berbert, P.A.; Berbert-Molina, M.A.; Oliveira, M.T.R. Performance analysis of RF dielectric models for density-independent estimation of moisture content in sorghum. Powder Technol. 2013, 246, 369–378. [Google Scholar] [CrossRef]
- Namita Bansal, A.S.; Dhaliwal, K.S.M. Dielectric properties of corn flour from 0.2 to 10 GHz. J. Food Eng. 2015, 166, 255–262. [Google Scholar] [CrossRef]
- Bo, L.; Liu, X.; Zhang, L.; Wang, S. Effects of temperature, moisture and metal salt content on dielectric properties of paddy bran associated with radio frequency heating. Sci. Rep. 2018, 8, 1–12. [Google Scholar]
- Nelson, S.O.; Stetson, L.E. Frequency and moisture dependence of the dielectric properties of hard red winter wheat. J. Agric. 1976, 21, 181–192. [Google Scholar] [CrossRef]
- Youqiu, H. Electromagnetism and Electrodynamics, 2nd ed.; Science Press: Beijing, China, 2014. (In Chinese) [Google Scholar]
- Sun, M. Fundamentals of Dielectric Physics; South China University of Technology Press: Guangzhou, China, 2000. (In Chinese) [Google Scholar]
- Yin, Z. Dielectric Physics; Science Press: Beijing, China, 2003. (In Chinese) [Google Scholar]
© 2020 by the authors. Licensee MDPI, Basel, Switzerland. This article is an open access article distributed under the terms and conditions of the Creative Commons Attribution (CC BY) license (http://creativecommons.org/licenses/by/4.0/).


