Article

Comparison of Artificial Intelligence Methods for Fault Classification of the 115-kV Hybrid Transmission System

by
Jittiphong Klomjit
and
Atthapol Ngaopitakkul
*
Department of Electrical Engineering, Faculty of Engineering, King Mongkut’s Institute of Technology Ladkrabang, Bangkok 10520, Thailand
*
Author to whom correspondence should be addressed.
Appl. Sci. 2020, 10(11), 3967; https://doi.org/10.3390/app10113967
Submission received: 21 April 2020 / Revised: 29 May 2020 / Accepted: 2 June 2020 / Published: 7 June 2020
(This article belongs to the Special Issue Intelligent Fault Diagnosis of Power System)

Abstract

:
This research proposes a comparison study on different artificial intelligence (AI) methods for classifying faults in hybrid transmission line systems. The 115-kV hybrid transmission line in the Provincial Electricity Authority (PEA-Thailand) system, which is a single circuit single conductor transmission line, is studied. Fault signals in the transmission line were generated by the EMTP/ATPDraw software. Various factors such as fault location, type, and angle were considered. Then, fault signals were analyzed by coefficient details on the first scale of the discrete wavelet transform. Daubechies mother wavelet from MATLAB software was used to decompose the fault signal. The coefficient value of the mother wavelet behaved depending on the position, inception of fault angle, and fault type. AI methods including probabilistic neural networks (PNNs), back-propagation neural networks (BPNNs), and support vector machine (SVM) were used to identify faults. AI input used the maximum first peak coefficients of phase ABC and zero sequence. The results obtained from the study were found to be satisfactory with all AI methodologies having an average accuracy of more than 98% in the case study. However, the SVM technique can provide more accurate results than the PNN and BPNN techniques with less computation burden. Thus, it is suitable for being applied to actual protection systems.

1. Introduction

Many big cities have undergone economic and infrastructure growth, with a rising population density due to migration from rural to urban areas. This trend has resulted in increasing demand for electricity that requires more transmission lines to connect different parts of a substation to the end-user. In order to improve the landscape in large cities and reduce the stack of overhead lines, underground cables have been employed in distributing power in high density or tourist areas. Thus, the topology of the distribution network is shifting from mainly overhead lines to a combination of overhead lines and underground cables. Currently, Thailand is also installing hybrid transmission lines (a combination of overhead lines and underground cables) in various cities throughout the country. There are significantly different parameters between overhead lines and underground cables, which can cause an error in the conventional protection system and risk reliability issues in the electrical network. Thus, an algorithm that can detect and classify fault types under the hybrid transmission line needs to be developed.
A significant proportion of faults in electrical power systems occur in transmission lines. Fault signal analysis in transmission systems is one of the important fields to ensure that the operator has a method to deal with disturbance correctly and limit the damage on the overall system. There has been a lot of research in the past that performed analysis using various methodologies [1,2]. Wavelet transform is a signal processing method that has gained attention from researchers for the application of fault analysis and has been applied for fault analysis in electrical systems due to properties that make it suitable for analyzing the transient sate of the signal [3,4,5,6,7,8,9,10,11,12,13,14,15,16,17,18,19,20,21,22,23,24,25,26,27,28].
A wavelet transform was applied to detect and classify faults in transmission lines [3,4,5,6,7,8,9]. The maximum wavelet singular value (MWSV) was applied for the detection and classification of faults. Current signals were input for the wavelet transform. This type of fault classification depends on the Euclidean norm of the MWSV, and faults are identified by coefficients and setup values [3]. Herein, detection and classification of faults in transmission lines were performed by introducing a novel method based on power spectral density (PSD) in time and frequency. The PSD index (in time) was applied for fault detection, and the PSD index (in frequency) was used for classification [4]. Thus, faults could be detected in a short time, and classification was completed using the Hellinger distance [4]. The mother wavelet is important because if the appropriate mother wavelet is chosen, effective results can be obtained. Previous studies have highlighted the importance of the mother wavelet [8,16]. In [8], the mother wavelets affected the classification of faults in hybrid transmission lines. Daubechies (db) mother wavelet exhibits better accuracy than any other mother wavelet. Likewise, in [16], Daubechies (db) mother wavelet was found to completely satisfy fault classification.
By combining the wavelet transform method with artificial intelligence (AI) methods, the accuracy of fault classification in electrical systems has been improved [10,11,12,13,14,15,16,17,18,19,20,21,22,23,24,25,26,27,28]. The discrete wavelet transform (DWT) has been applied previously to decompose fault signals [11,13,14,17]. The DWT results were input into artificial neural networks (ANNs) to detect and classify faults in transmission lines. A technique for classification of internal and external faults of protection zones in transmission lines has been proposed, in which fault signals were decomposed by the wavelet transform, and high frequency components and spectral energy were input into a support vector machine (SVM) to detect faults and classify them, respectively. Various AI methods are applied for a multitude of applications. To obtain the best results, the most suitable AI method needs to be identified. AI methods such as ANN, SVM, k-nearest neighbors (k-NN), extreme learning machine (ELM), and support vector regression (SVR) were compared in some previous studies [25,26,27,28,29]. The different methodologies that have been used and tested in previous research are summarized in Table 1.
The literature review showed that most studies used wavelet transform to analyze signals in electrical systems due to its suitability for analyzing the transient state of the power system. However, past research has focused on fault analysis in either overhead transmission lines or underground cables. Fault analysis has not been performed in hybrid transmission lines. Thus, this paper aims to present the performance of different AI methodologies in fault classifying in hybrid transmission lines. In previous studies [7,8,9], wavelet coefficient behavior to hybrid transmission lines was studied [7] and the algorithm for classification of faults using only DWT was designed [8]. In addition, different mother wavelets for classification were compared to identify the optimal mother wavelet using an algorithm [9]. The algorithms developed in previous studies [7,8,9] are applied to AI methodologies to improve their accuracy. Three types of AI methods (probabilistic neural networks (PNN), back-propagation neural networks (BPNN), and SVM) have been used and compared in terms of accuracy of classification results in order to select the suitable AI methodology to implement in protection systems. The overall process of the study is shown in Figure 1. First, the fault signal was simulated by ATPDraw. Next, the fault signals were analyzed using a WT. The maximum coefficient value was input into the AI. Finally, the AI methods were compared in terms of accuracy. The detailed process is explained in the next section.

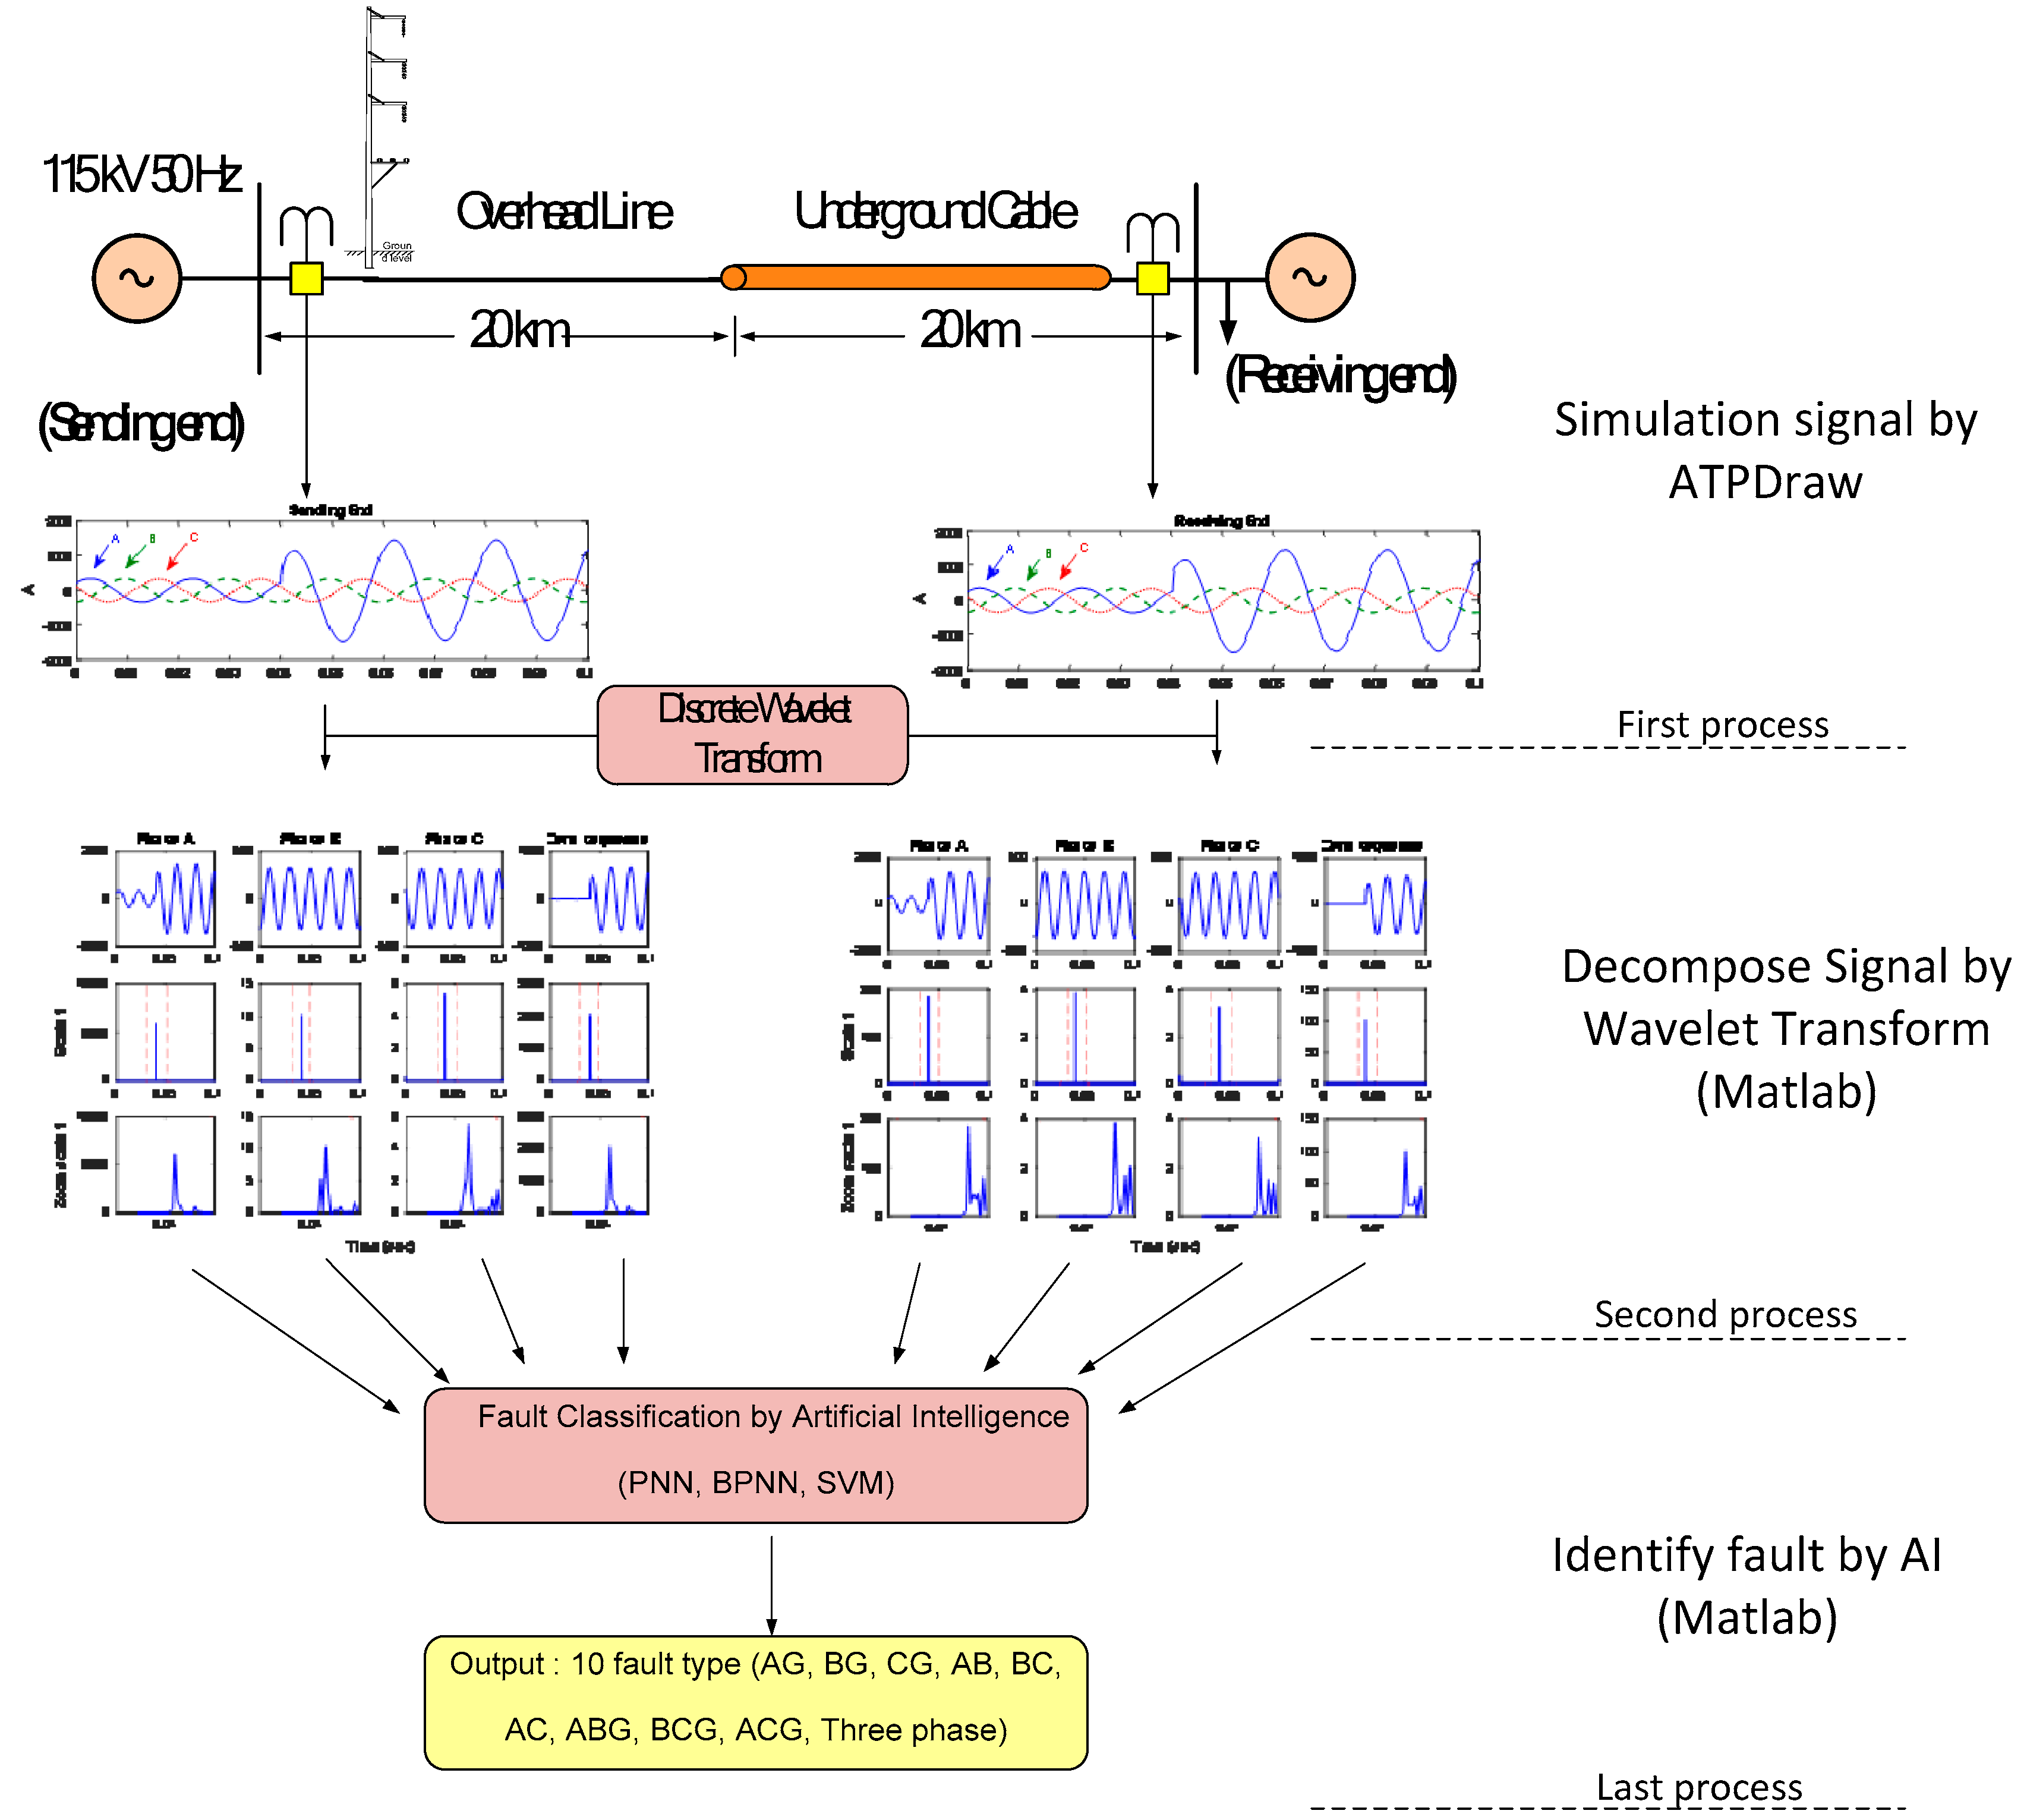
2. Fault Signal and Wavelet Transform
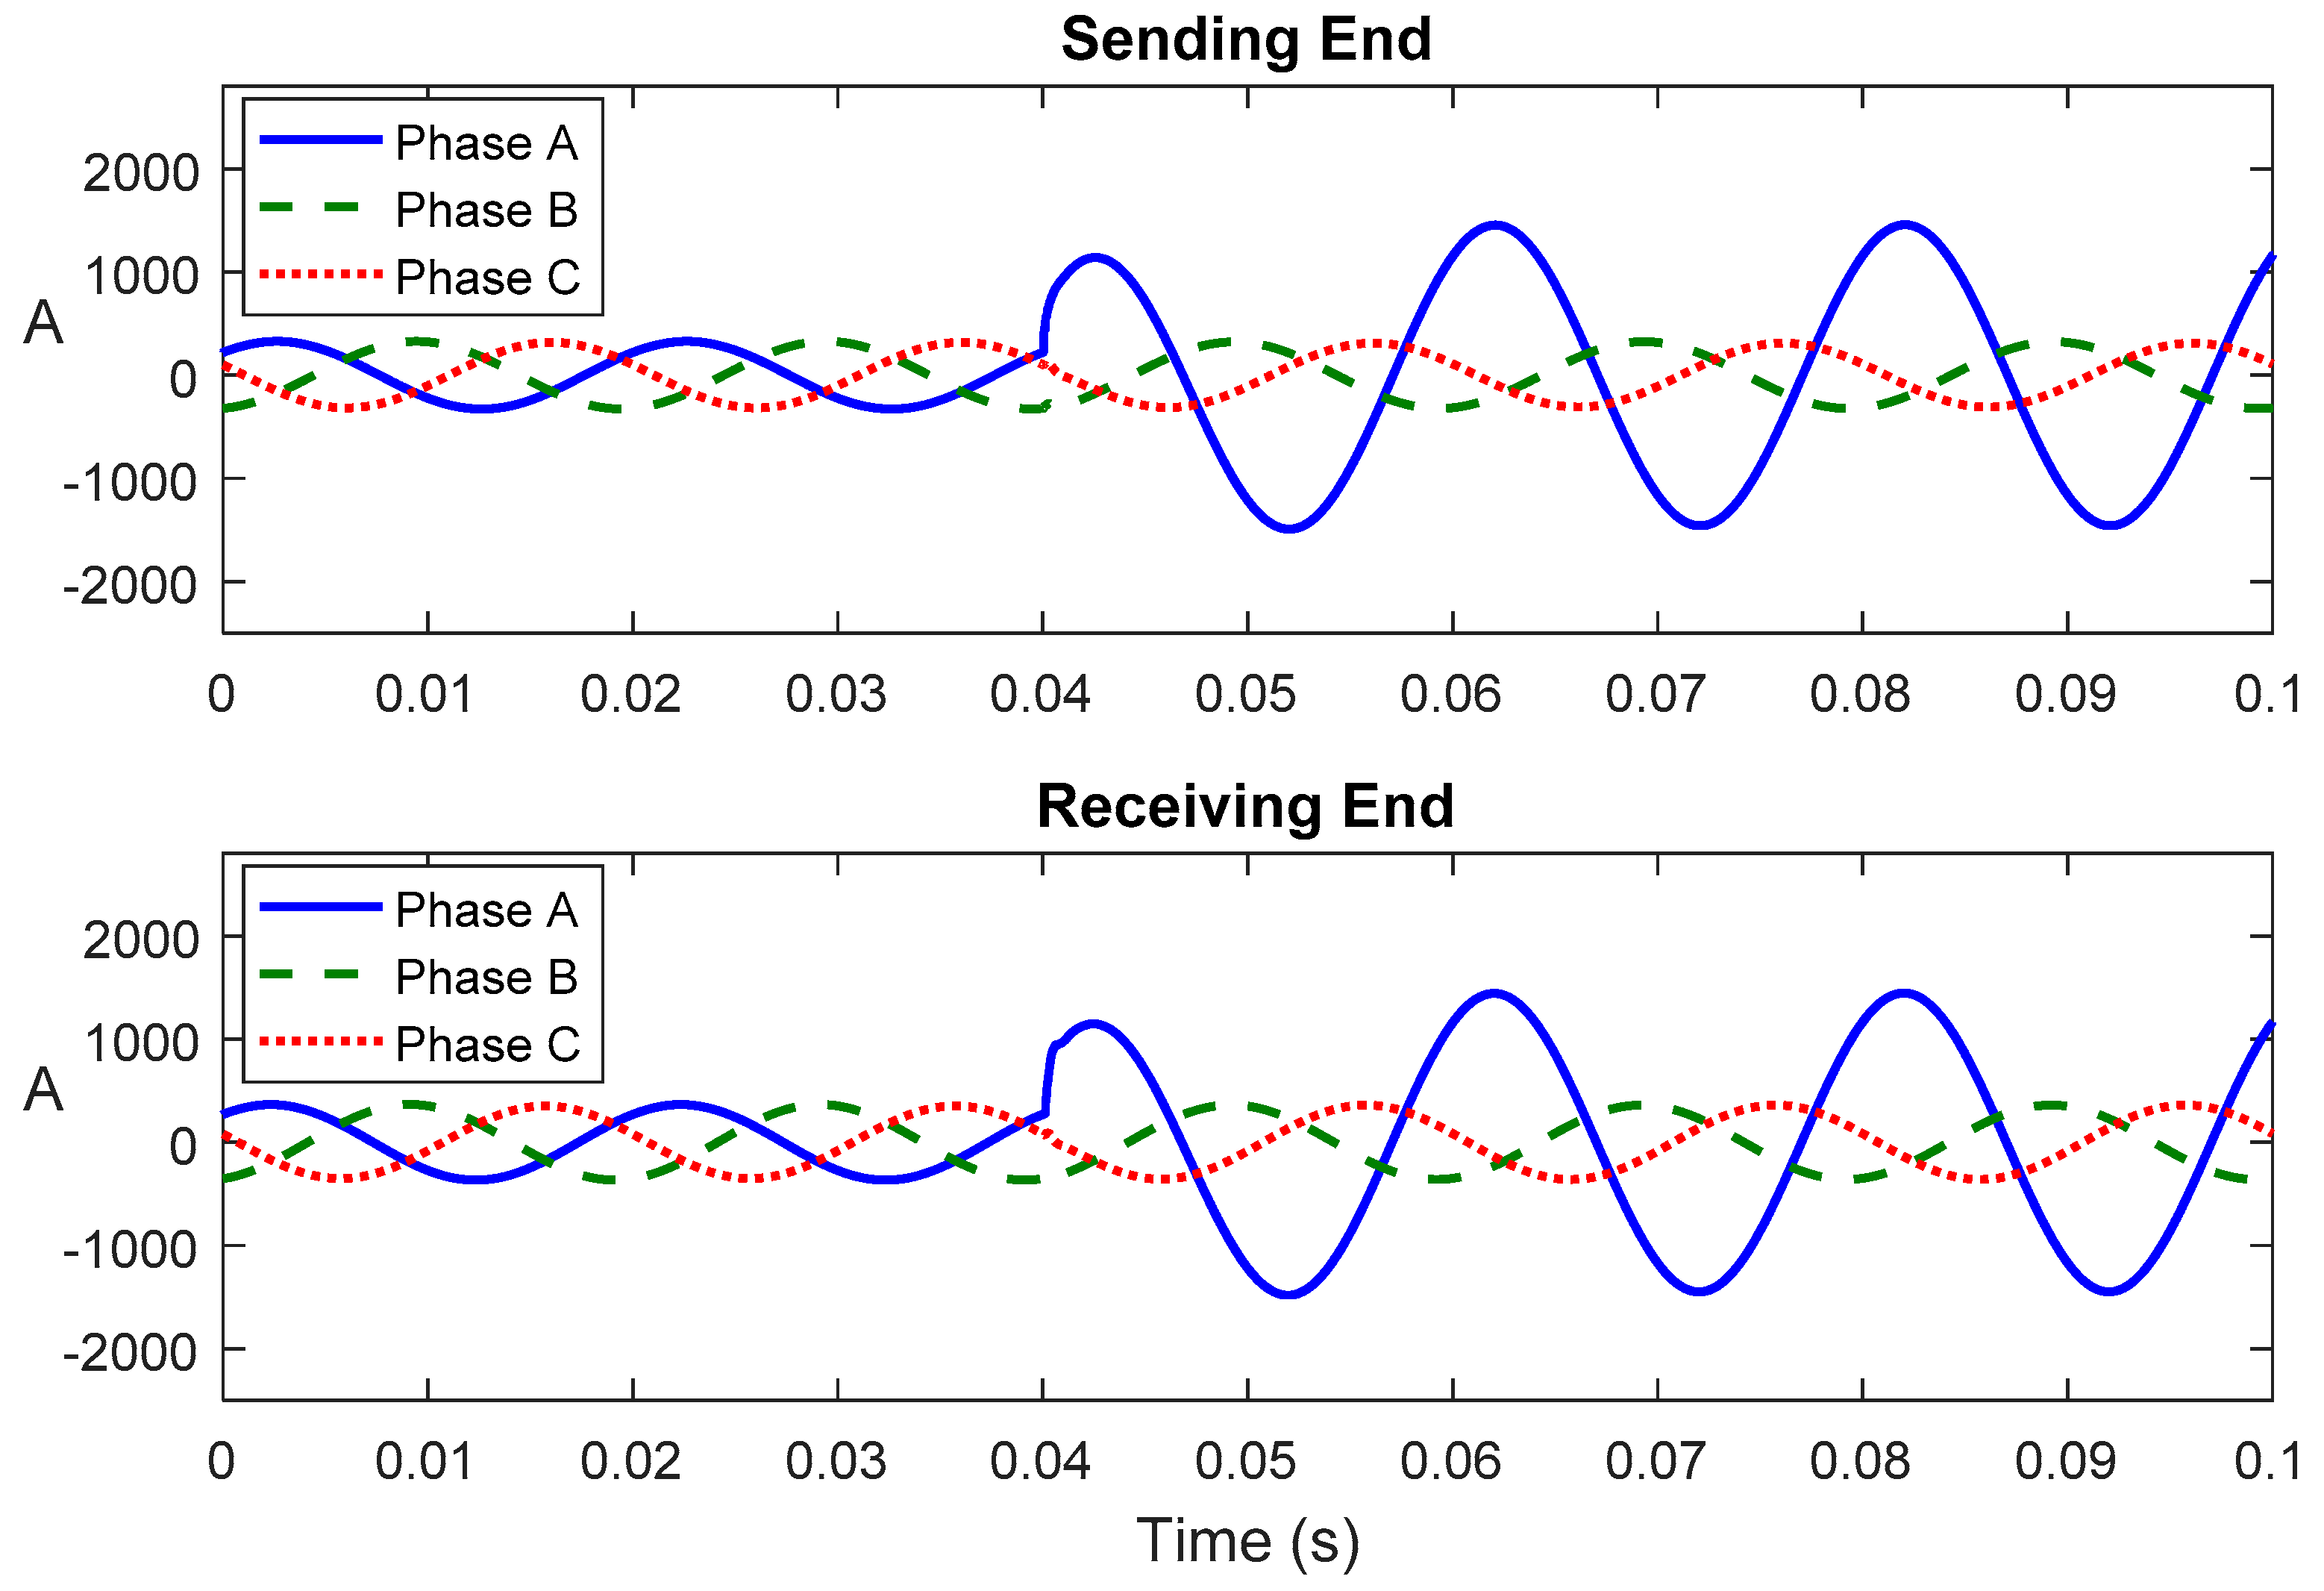
The 115-kV transmission line of the Province Electricity Authority (PEA) system in Thailand was used for simulation. PEA is responsible for providing electricity to 74 provinces of Thailand. The single circuit single conductor model was used to model the transmission lines of overhead lines and underground cables. The layout of the structures is shown in Figure 2.
Figure 2 shows the structure of the 115-kV transmission line which is divided into three parts: overhead line, riser pole, and underground cable. The overhead transmission line was set up on a 22 m concrete pole, and underground cables were installed in the duct bank 1.5 m from the ground level. The connection point between the overhead transmission line and the underground cable is the riser pole. EMTP/ATPDraw software was used for simulation. The simulated system comprised 40 km transmission lines connected between two substations. The connection point changed the cables from the overhead cable to the underground line at half of the transmission line length (20 km). The underground cable was made of copper conductor with a size of 800 mm2. The conductor had a diameter of 34.00 mm and the overall diameter of the cable was 89.00 mm. The overhead lines were fabricated of all aluminum conductor (AAC) of 400 mm2. It had an overall diameter 26.00 mm and 2.89 mm was the diameter of the wire. The specifications and structure of the transmission lines installed were based on the PEA standards.

2.1. Fault Signal

The performance of the proposed classification algorithm was evaluated using simulation software by considering varying parameters to ensure the accuracy of the algorithm. The following case studies with different parameters were analyzed:
  • The fault inception on the voltage waveform in phase A was varied from 0 to 330 degrees with 30 degree intervals;
  • The fault type under consideration consists of a single line to ground fault, double line to ground fault, line-to-line fault, and three-phase fault;
  • The fault in each phase of the transmission line was located at 10%, 20%, 30%, 40%, 50%, 60%, 70%, 80%, and 90% of the length of the transmission line measured from the sending end to the receiving end.
The model for simulating and analyzing faults in the transmission line was divided into two parts. First, EMTP/ATPDraw software generated fault signals. The parameters in Figure 2 were input into the software. Then, fault signals were decomposed using WT.
The signals from the simulation with EMTP/ATPDraw software were obtained with a sampling rate of 100 kHz, and the switch was responsible for the format and the time that the fault occurred. The fault signals were simulated for five cycles (0–0.1 s) with faults occurring at 0.04 s without clearing the faults out. As an example of the fault signal, a single line to ground fault observed in phase A located 12 km (30%) from the sending side and at an angle of fault of 0° (voltage sending end reference) is shown in Figure 3.
Figure 3 shows the current signal of both sides when a fault occurs in the transmission line at 0.04 s. Before the fault occurred, current signals were sinewaves with the same size as that of the load. After the fault occurred, the current on the fault phase significantly increased in both the send and load sides. Then, the current signal from EMTP/ATPDraw was diagnosed using discrete wavelet transform (DWT) by MATLAB program.

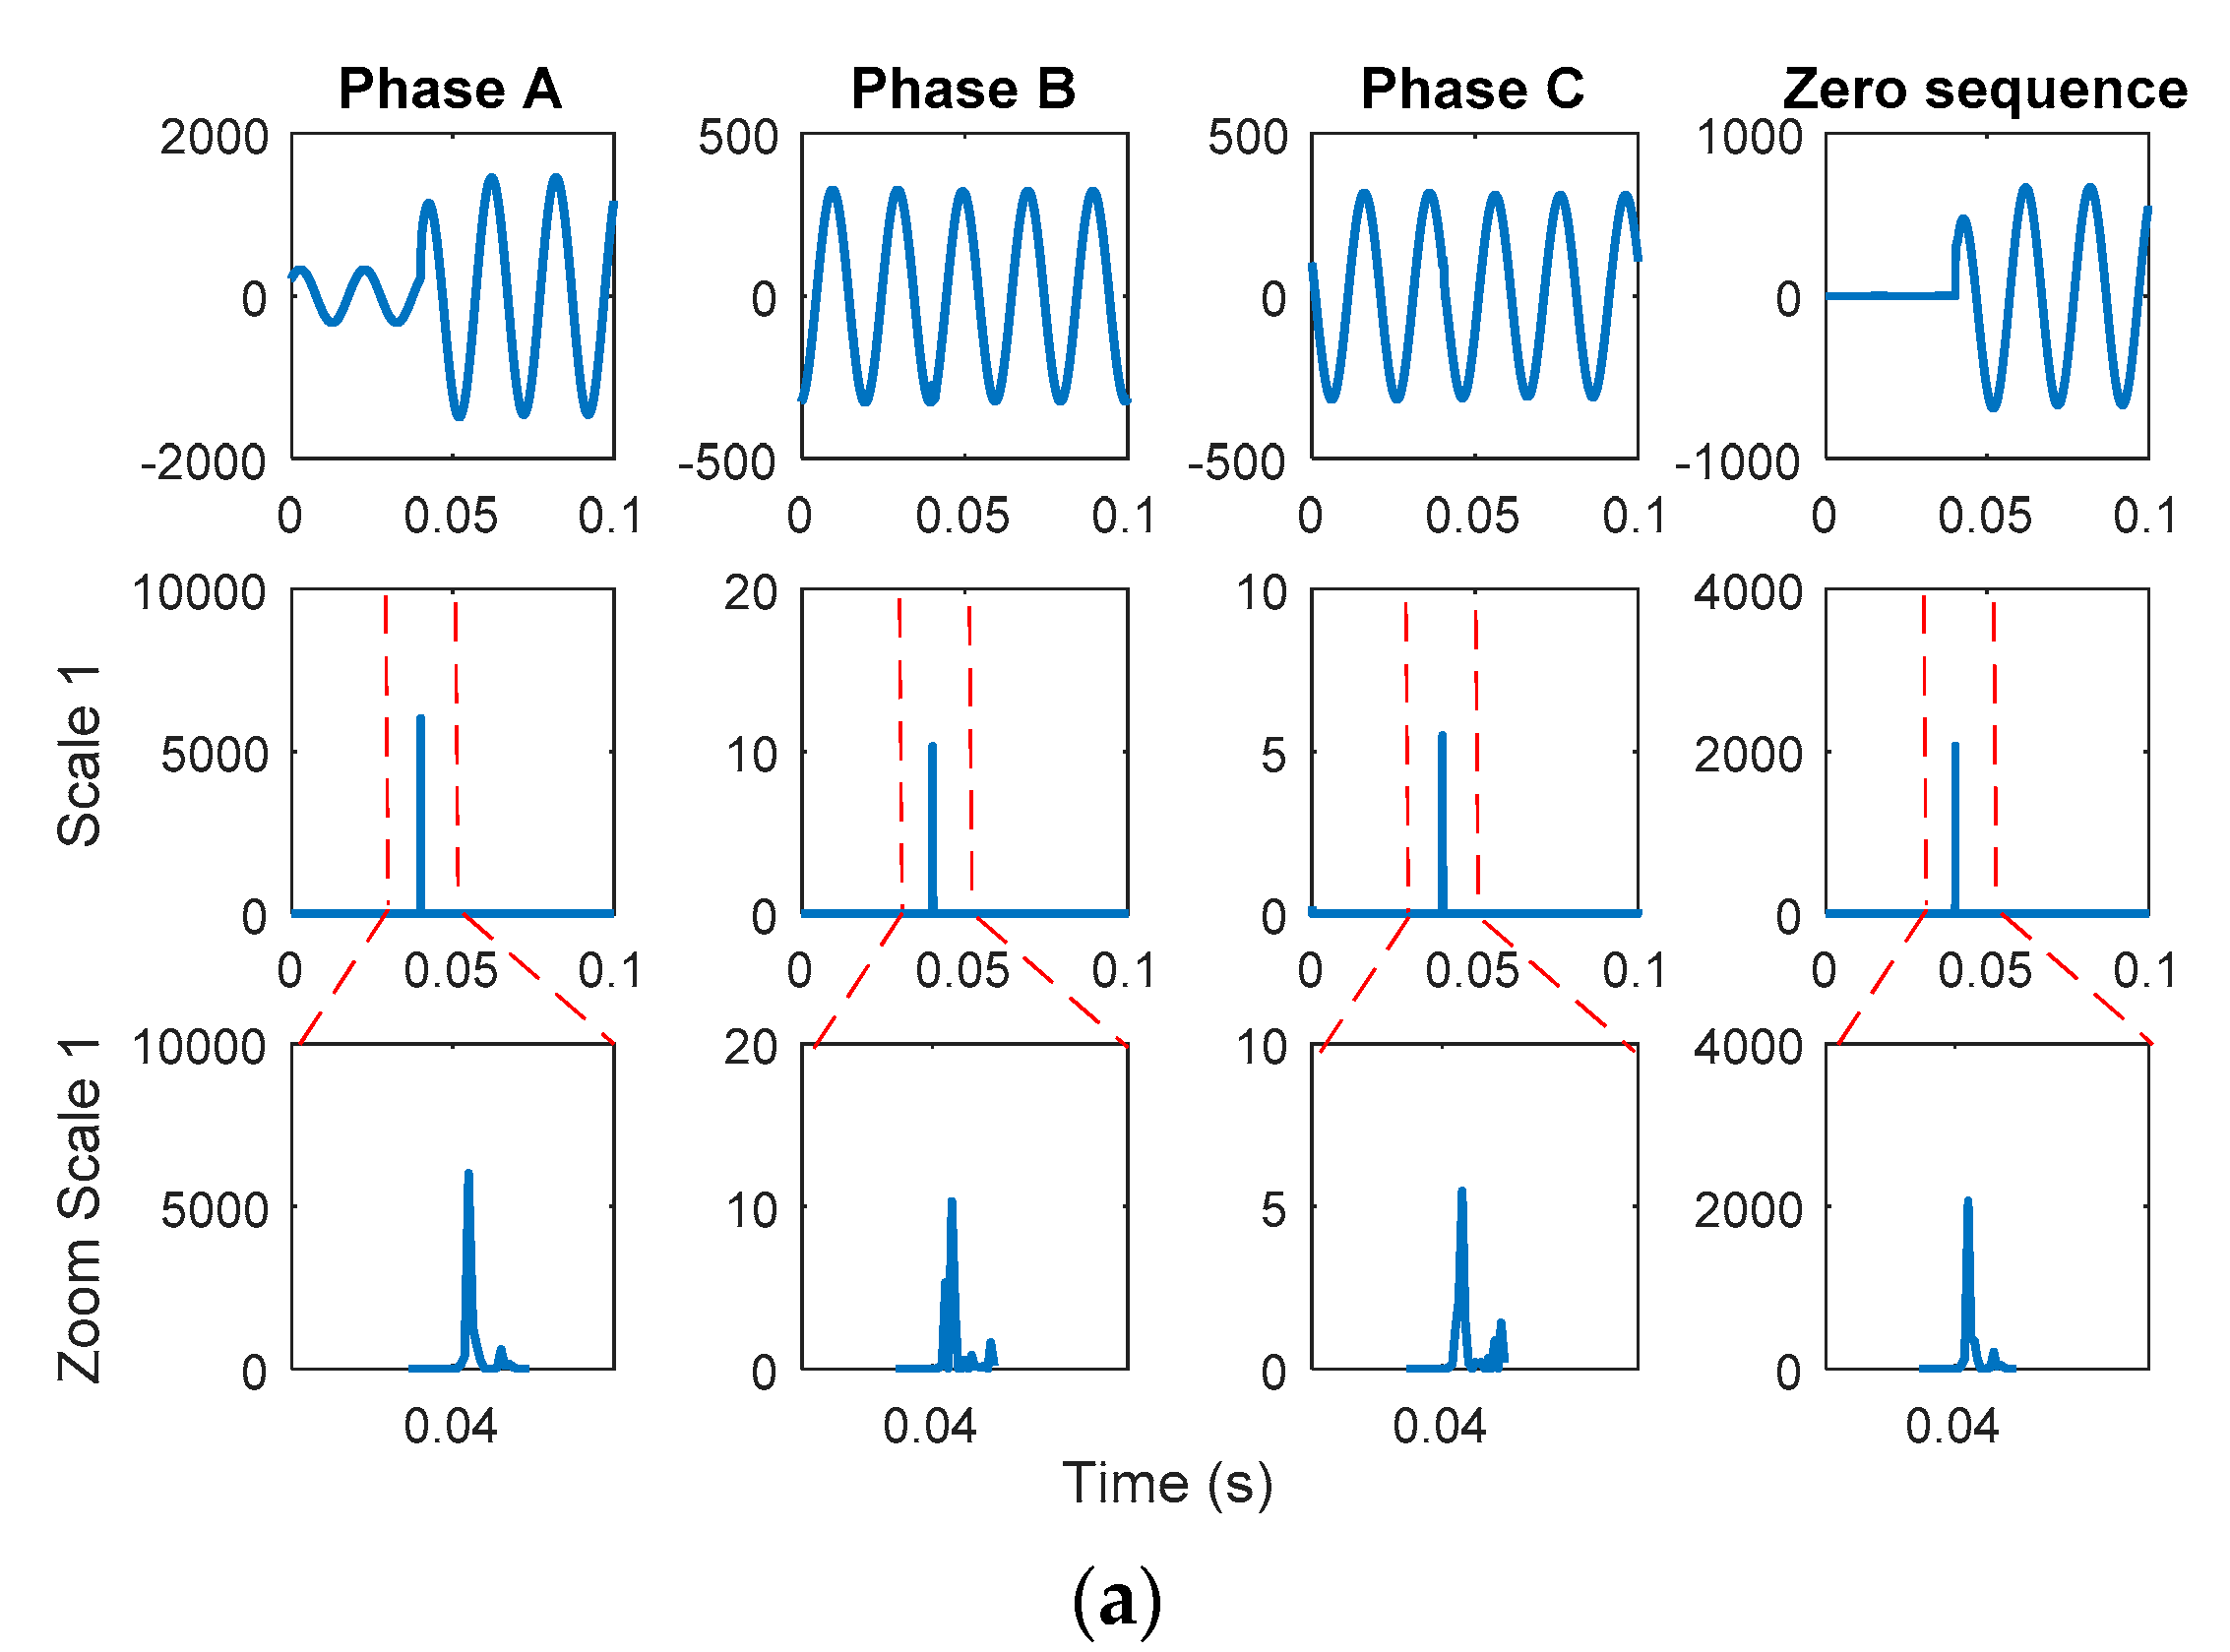
2.2. Wavelet Transform

Fault signals from EMTP/ATPDraw were decomposed by WT of MATLAB. High frequency components were caused by abnormalities in the electrical system. WT extracted and analyzed the fault signals. Three-phase current signals and zero sequence were decomposed by Daubechies (db2) of DWT for the high frequency component in scale 1. The coefficients from DWT were squared to focus on the changes in the coefficients and find the maximum coefficients, as shown in Figure 4.
Figure 4 shows the characteristics of coefficients from the DWT of phase A—short circuit to ground at 30% of the length of the transmission line and at an angle of fault of 0°. Before the fault occurred, the value of the coefficient of the three phase and zero sequence was almost zero. When the fault occurred, the value of the coefficient of phase A and zero sequence became higher than that of phases B and C. Then, because of the steady state current after the fault occurred, the value of the coefficient decreased. The coefficient of the three-phase current, the phase in which the fault occurred, had a higher coefficient than the phase in which no fault occurred. The coefficient of the case in which short circuit to ground coefficients of zero sequence occurred was higher than that in the case of short circuit underground fault.
The behavior of coefficients from DWT varies depending on various factors. The behavior of the values of the coefficients was previously analyzed to create a fault classification algorithm [7]. Moreover, there are studies of the behaviors of the coefficient value of positive sequence. This is confirmed in paper [9].

3. Fault Classification

The behavior of coefficients can be used to design an algorithm for fault classification [7]. AI methods are important for data classification because they can increase accuracy and can rapidly analyze data. AI methods were used herein for fault classification and compared. ANNs are used in data classification and data forecasting. Probabilistic neural networks (PNNs) can be applied for data classification. Back-propagation neural networks (BPNNs) are popular ANNs because they can be used to solve numerous problems. In addition, the SVM is a popular choice for data classification. In this study, we used three methods to classify types of faults to compare accuracy. The data were divided into three parts (total 1080 data): 50% of the data were used for training (540 data), 25% of the data were used for validation (270 data), and finally, 25% of the data were used for the case study (270 data). The data detected the maximum first peak coefficients of phase ABC and zero sequence (Z). The normalized values (0 to 1) of coefficients of phase ABC and zero sequence were input into the algorithm for classification.

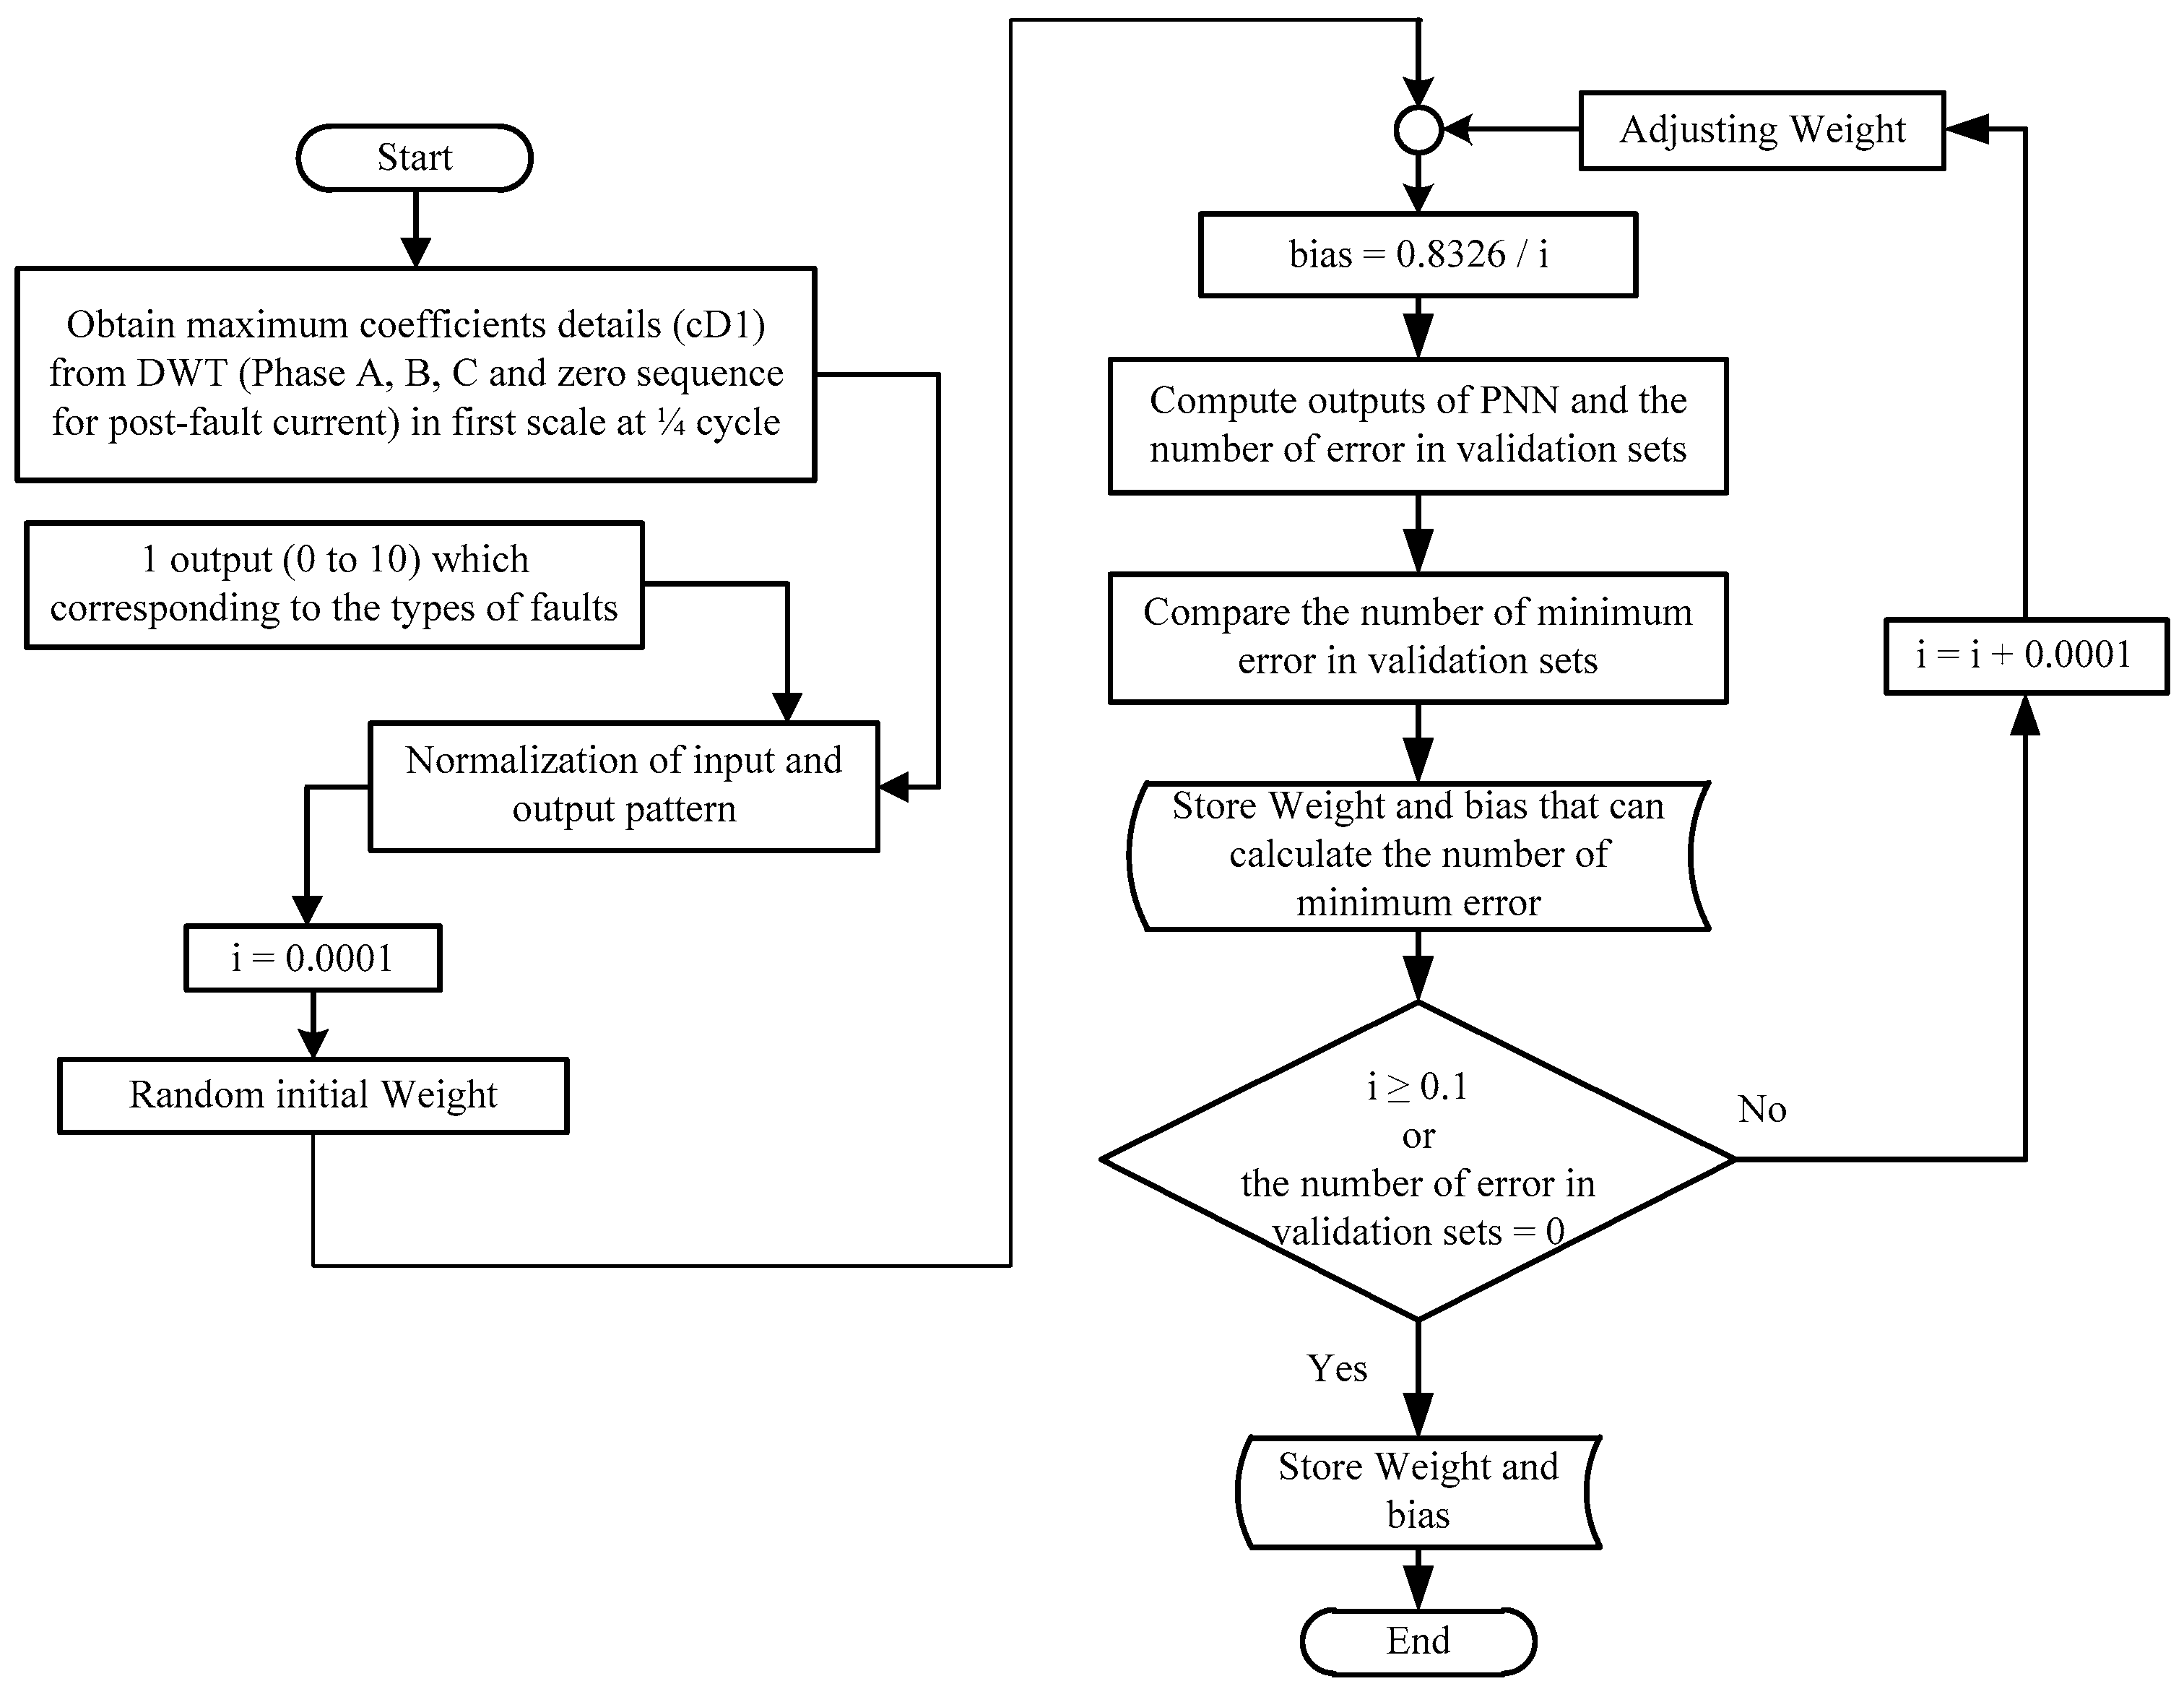
3.1. Probabilistic Neural Network: PNN

PNN is a feedforward neural network and is applied in classification and pattern recognition problems. PNN is derived from the Bayesian network and a statistical algorithm called Kernel Fisher discriminant analysis. It includes three layers (input layer, radial basis layer, and competitive layer). The first layer computes the distances from the input vector to the training input vectors and produces a vector whose element indicates how close the input is to the training input. The second layer sums these contributions for each class of input to produce its net output of the second layer, which picks the maximum of these probabilities and produces a 1 for that class and a 0 for the other classes. The training process begins with a random initial weight and the spread is increased in the radial basis layer, which corresponds to a bias value ( b = 0.8326 S p r e a d ) from 0.0001 to 0.1. An increase step of 0.0001 is used to calculate the number of minimum errors. This loop process is repeated until the maximum value (0.1) is obtained or until the minimum errors are equal to zero, after which training is stopped. The training process can be summarized as a flowchart illustrated in Figure 5. The answers are shown in the form of numbers from 1 to 10, which means 10 types of fault are present. The training time for the process is approximately 97 s.

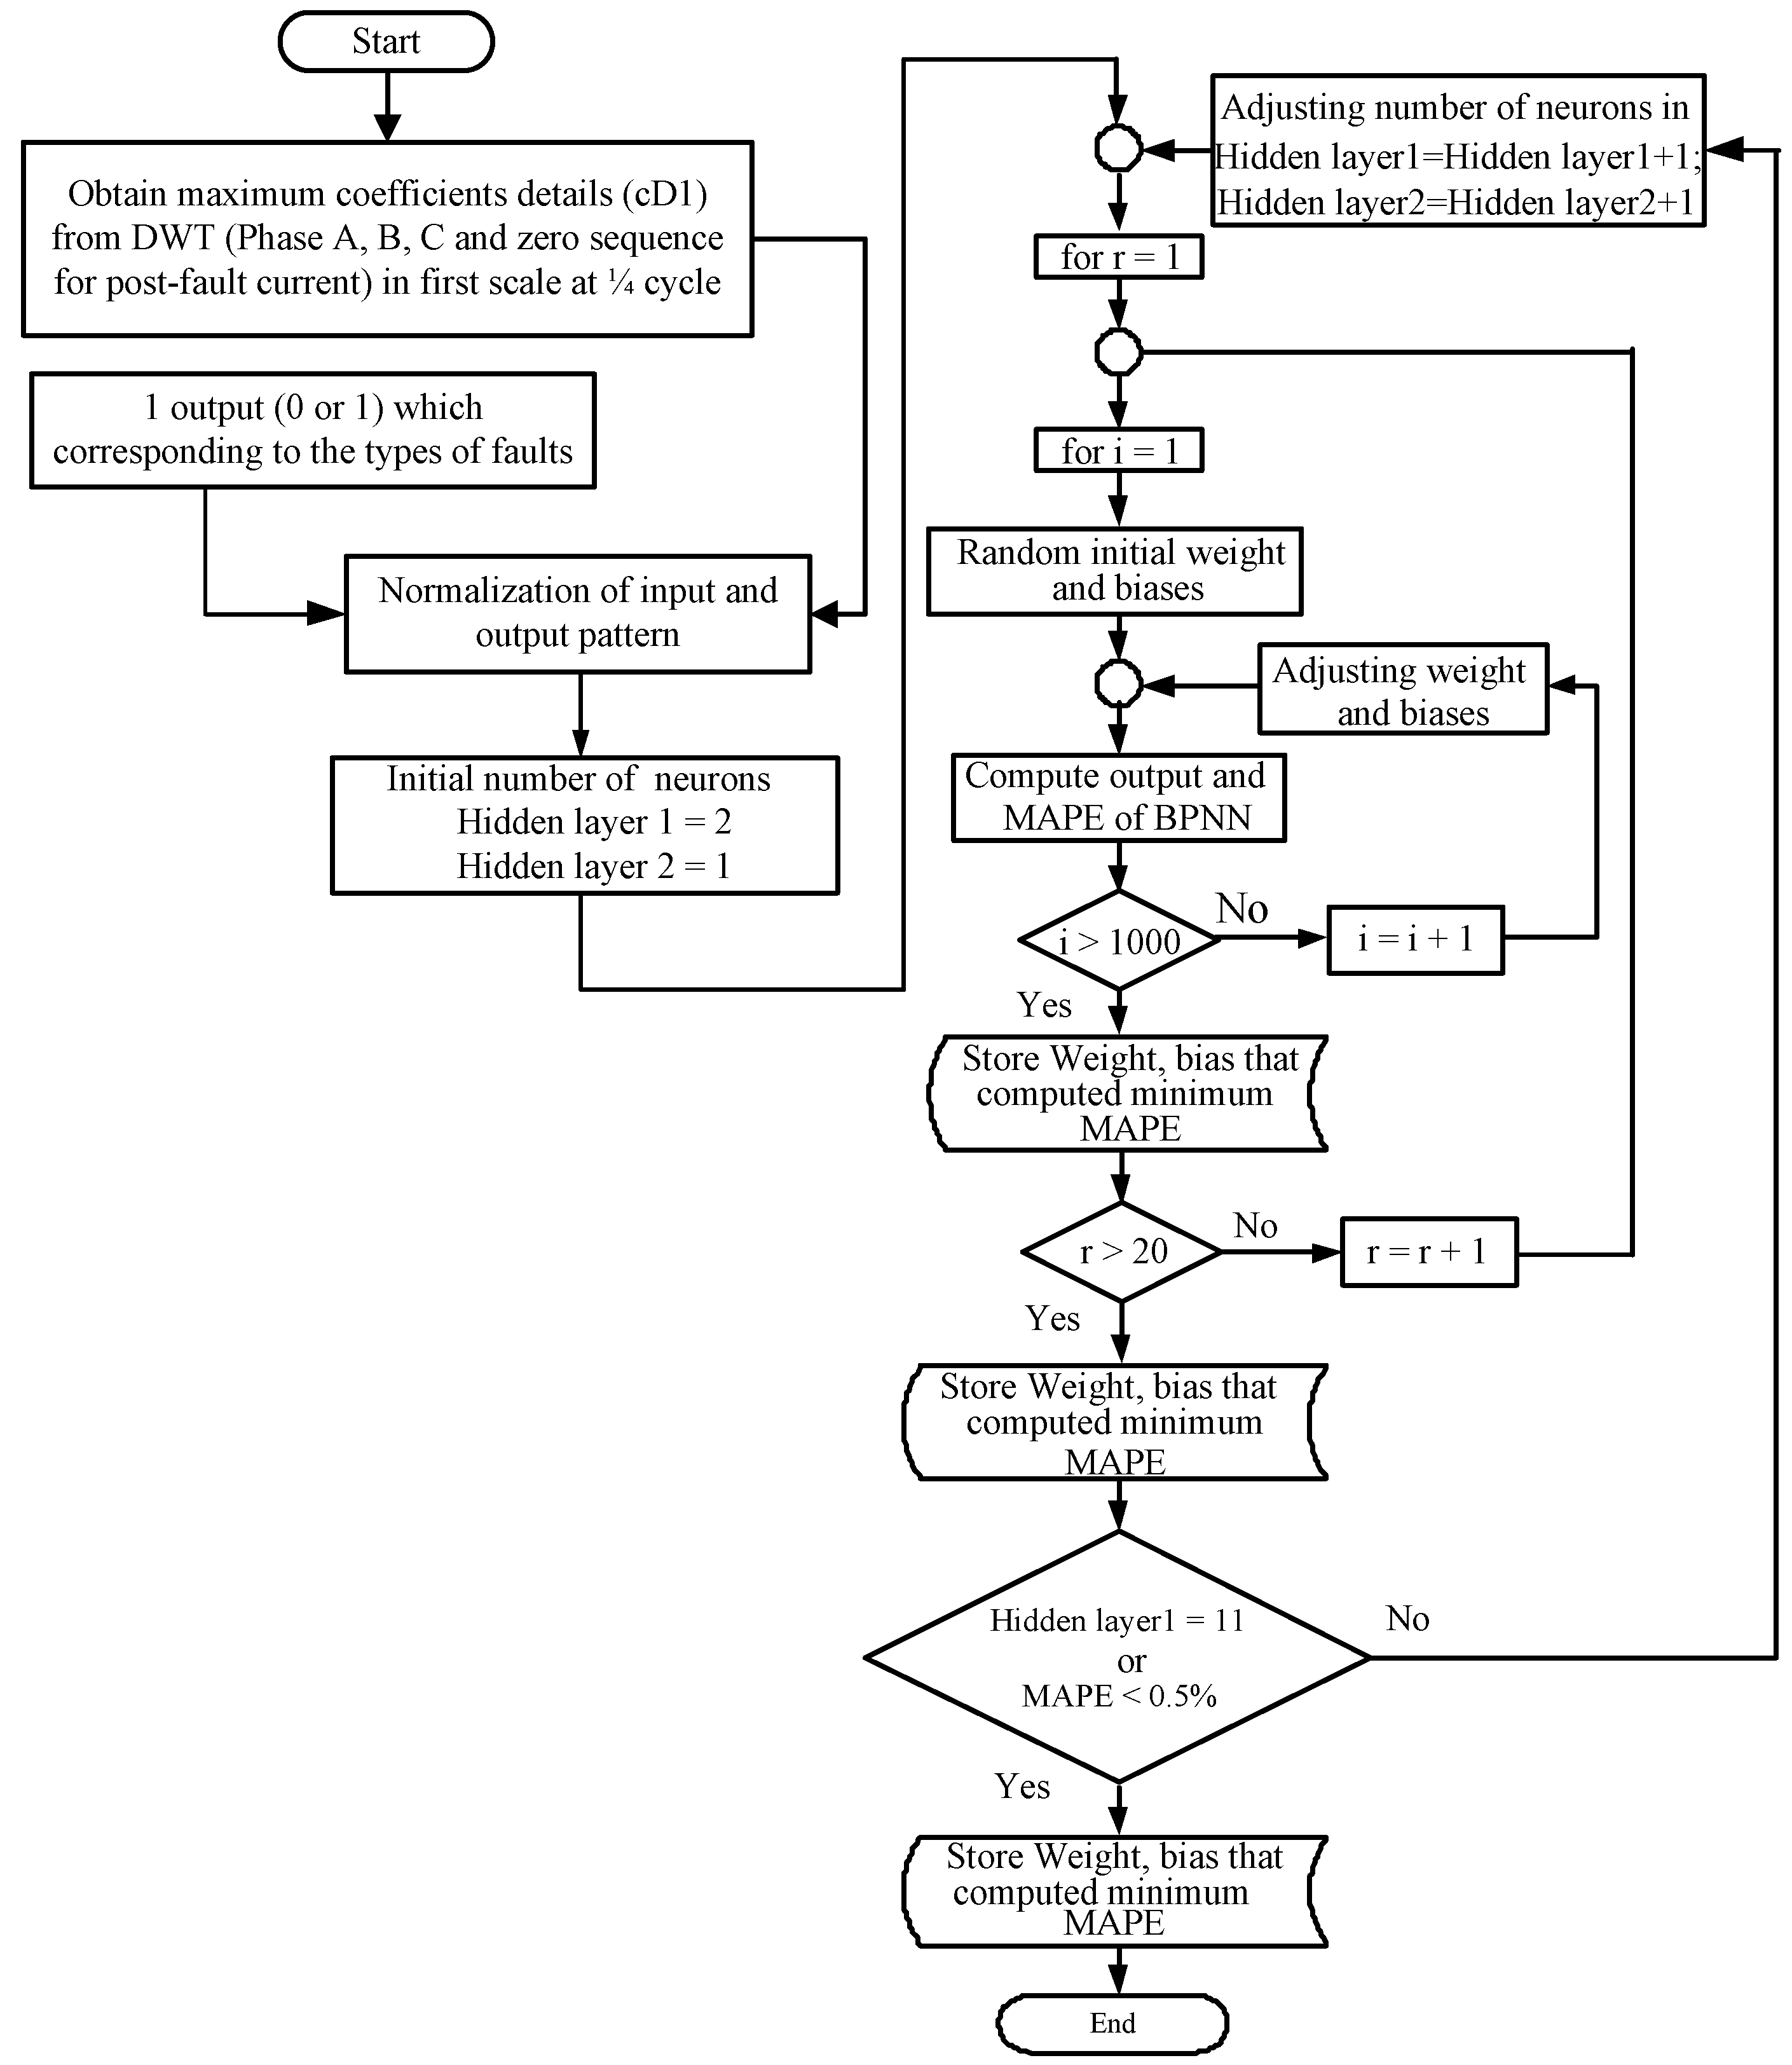
3.2. Back-Propagation Neural Network: BPNN

The back-propagation algorithm process involves calculating the gradient of the loss function with respect to each weight by the chain rule. Then, the gradient is calculated one layer at a time, and backward calculations are performed from the last layer to avoid over-calculations of intermediate terms in the chain rule. BPNN consists of four layers (an input layer, two hidden layers, and an output layer). In all hidden layers, hyperbolic tangent sigmoid functions are used, while linear functions are used in the output layer. The training process starts with a random weight and bias to the input layer. One round of training is divided into three steps. The weight and bias from the input layer are used to calculate the results of the neural networks. Then, value back-propagation of the error is performed between the output of the neural network and the target output. Next, the weight and bias are adjusted, and 20,000 iterations are performed to compute the best value of the mean absolute percentage error (MAPE). The number of neurons in hidden layers 1 and 2 is increased by one step until the MAPE value is below 0.5%. The MAPE index indicates the efficiency of BPNNs. MAPE can be computed using Equation (1). The training process of BPNN is shown in Figure 6. The training time for the BPNN is approximately 193 s. The BPNN training process consists of nine neurons on hidden layer 1 and eight neurons on hidden layer 2.
M A P E = 1 n × i = 1 n | ο / p A N N i ο / p T A R G E T i ο / p T A R G E T i | × 100 %

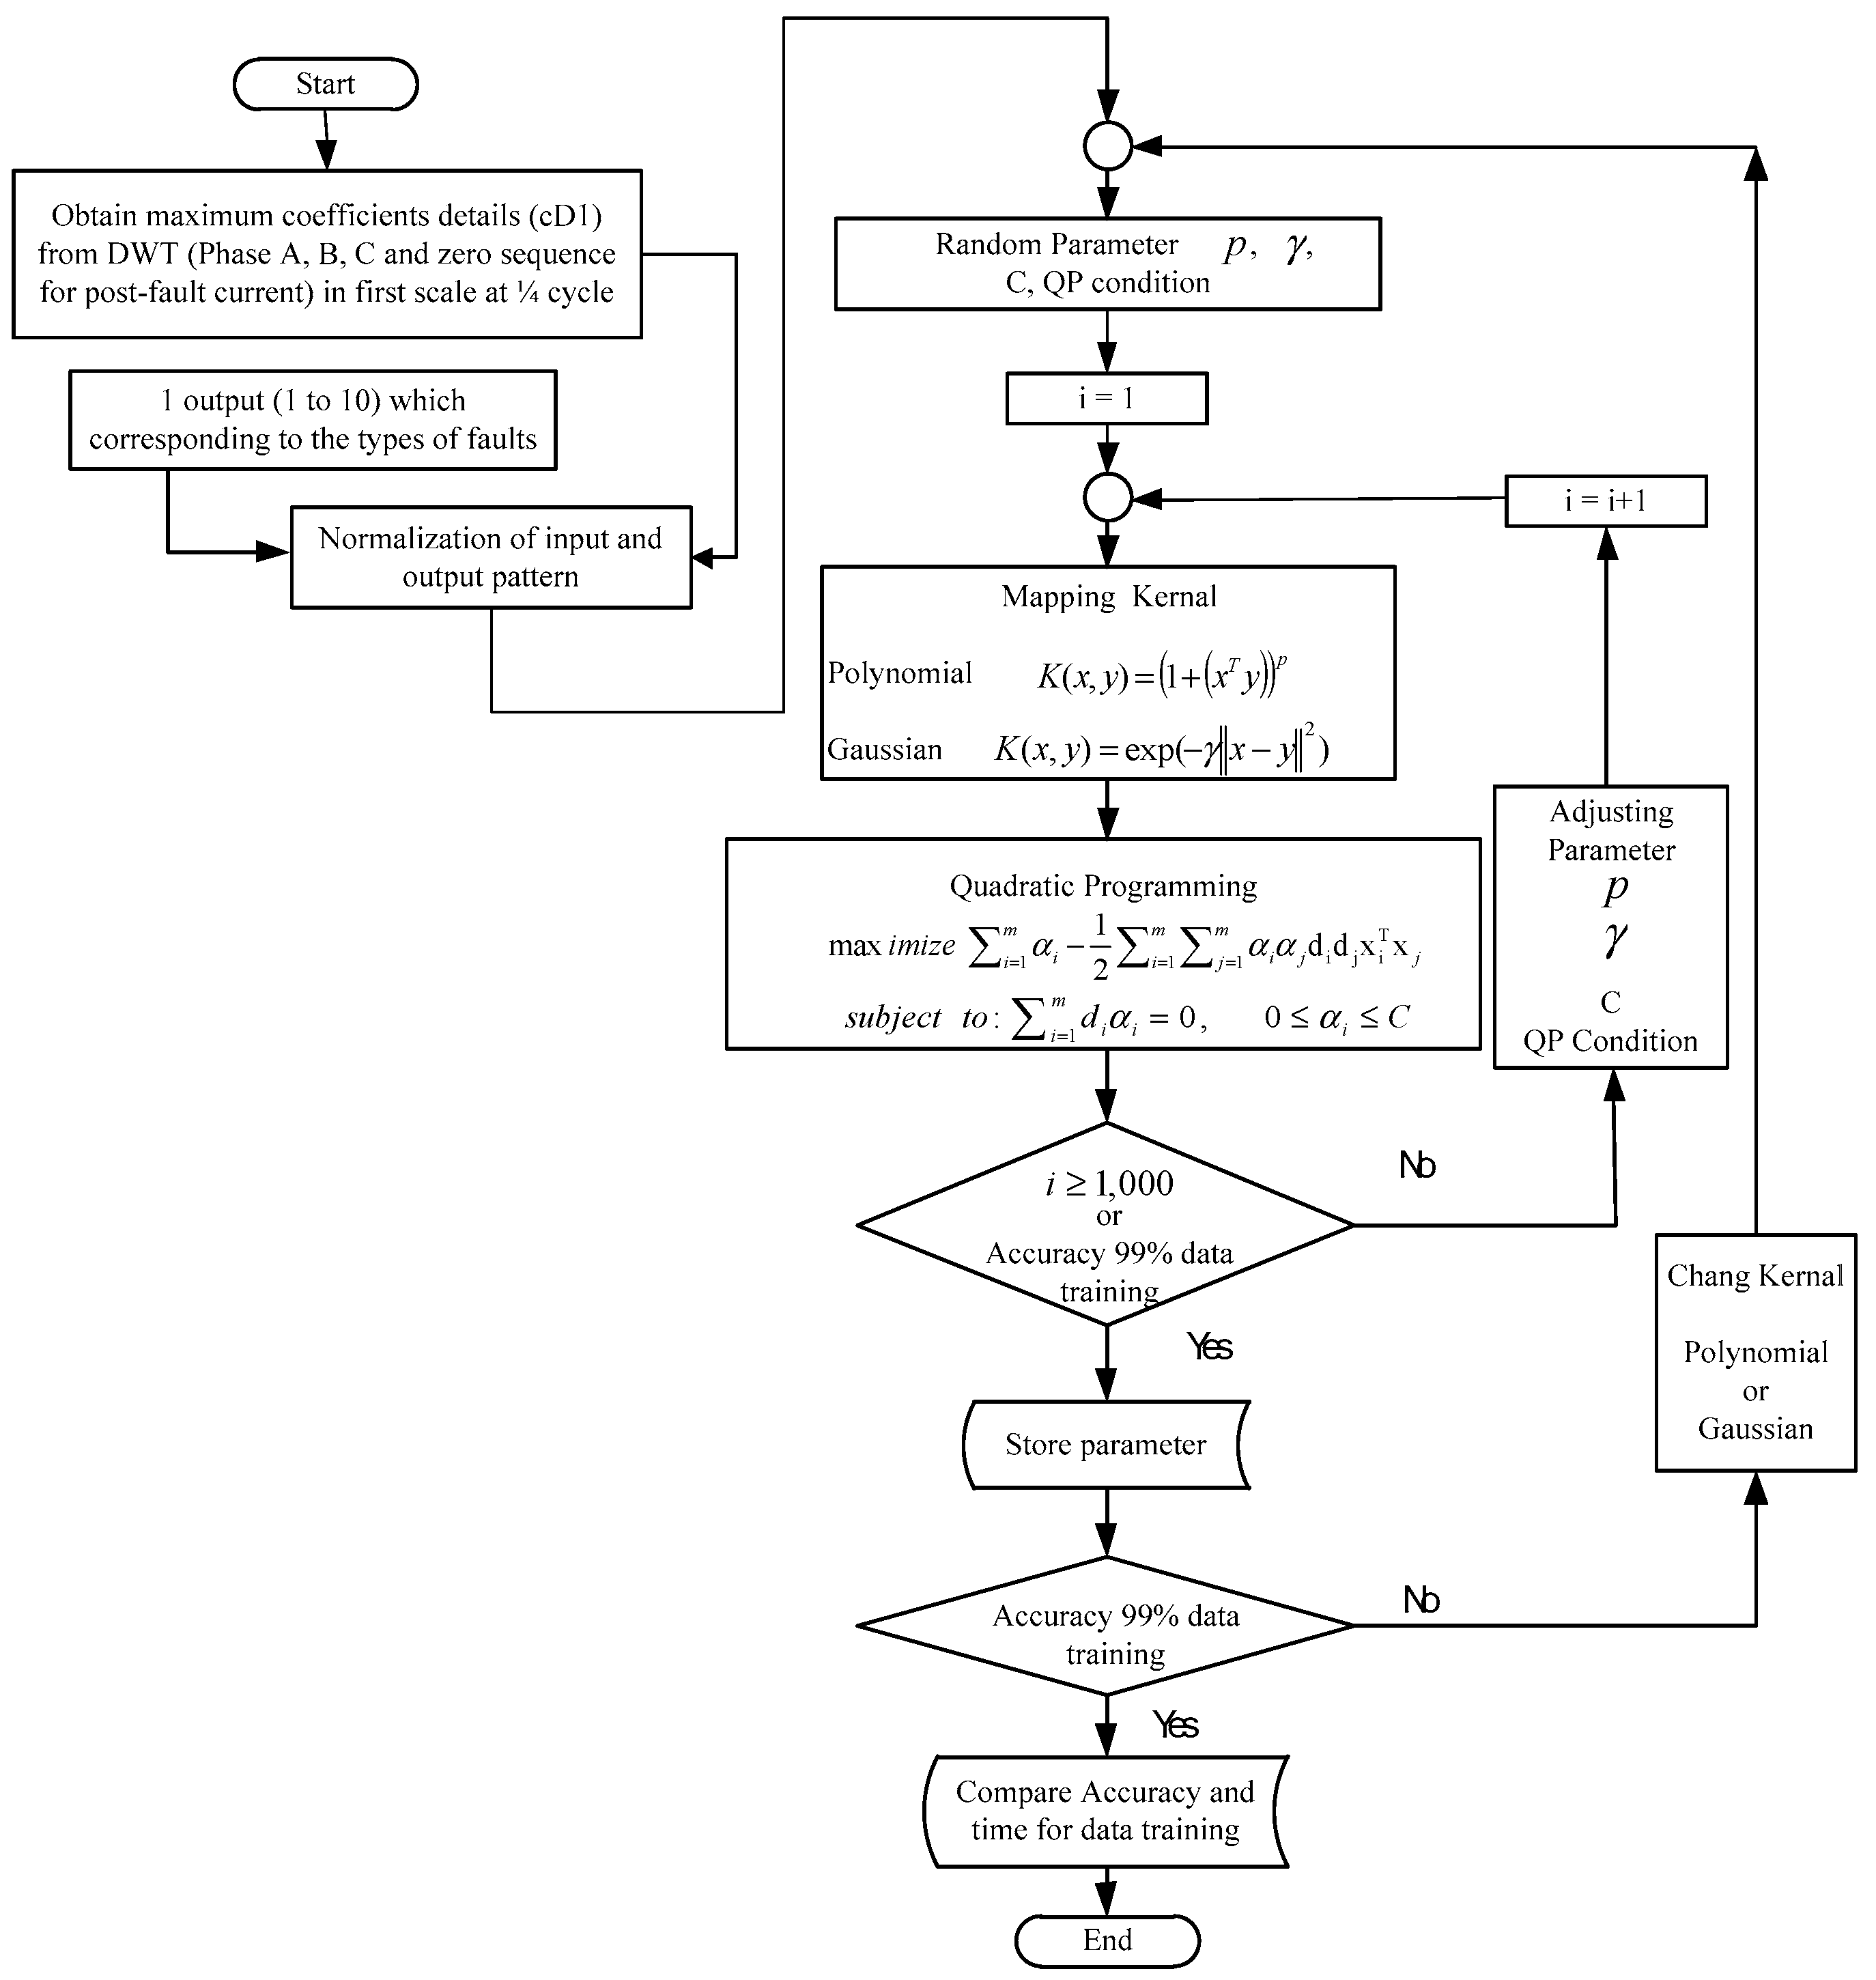
3.3. Support Vector Machine: SVM

SVMs are supervised learning models with associated learning algorithms that analyze data used for classification and regression analysis. Categories in SVMs are separated by a clear gap which is as wide as possible. In addition, SVMs are a linear model but can be used to solve complex and nonlinear problems by converting data to another space that has more dimensions. This is called the kernel function. Popular kernel functions include the Gaussian kernel and polynomial kernel. Both kernel functions were applied in this study. SVMs are divided into four models, which are used to classify different types of faults. The same data were input for all four SVM models, and the output showed different types of faults. Model 1 separates the types of fault at phase A (fault or no fault), Model 2 separates the types of fault at phase B (fault or no fault), Model 3 separates the types of faults at phase C (fault or no fault), and Model 4 separates the types of fault at zero sequence (ground fault or no ground fault).
The training process starts with random parameters of the SVM, and the parameters are adjusted to 1000 rounds. The parameters of the SVM are adjusted to find the maximum accuracy. If the results show more than 99% accuracy, the SVM parameters are recorded. Then, the kernel function changes to select the best parameter. The training time is approximately 60 s. The process is shown in Figure 7. The best kernel is polynomial kernel at kernel option level 19.

4. Result

Each AI method used 540 datapoints for training and 270 for testing. Then, the best parameters were used for classification. We used 270 datapoints for the case study and to compare the accuracies of the different AI methods. The results are shown in Table 2. Table 2 shows a comparison of the accuracy of fault classification by different AI methods at the sending end and receiving end.
Table 2 shows that PNN and SVM give the most accurate results, with 100% accuracy at both the sending and receiving ends. BPNN is the least accurate with an accuracy of 98.88% at the sending end. The sending end of BPNN has an error in the case of double line to ground fault (DLG) at 30–40% of the length of the transmission line and single line to ground fault at 40% of the length of the transmission line. BPNN shows errors because it detects DLG as a line-to-line (LL) and the single line to ground fault (SLG) is identified as a DLG. We also analyzed an additional case by varying the ground resistivity (1–100 ohm) in six cases of SLG and varying the load (70–120%) in ten cases of SLG and LL, making a total of sixteen cases. These additional cases were analyzed using the three AI models to test accuracy. Table 3 shows the percentage of accurate results in the additional cases.
PNN was the least accurate, with an accuracy of 68.75% at the sending and receiving ends. PNN showed errors in the case of high load of LL because it identified the LL as SLG at both ends. BPNN showed an accuracy of 68.75% at the sending side and 100% at the receiving end. BPNN showed errors in the case of the high load of LL, which was identified as DLG. The SVM showed the most accurate results for the additional cases, with an accuracy of 100% at both sides. Therefore, the SVM is suitable for fault identification.

5. Conclusions

In this study, the coefficients and behavior of DWTs were analyzed for fault classification using various AI methods. Fault signals in a 115-kV hybrid transmission line were simulated using EMTP/ATPDraw software. Then, the signals comprising three-phase current and zero sequence were decomposed by the WT of MATLAB software. The coefficients from the DWT had different values depending on the position and angle at which the fault occurred. When a phase fault occurred, the values of the coefficients were high, and the values at zero sequence were high when short circuit to ground fault occurred.
Using the behavior of DWT coefficients, previous studies designed algorithms for fault classification, but the algorithms had less accuracy. Therefore, this study used AI methods to increase the performance and accuracy of fault classification. ANN and SVM were chosen for fault classification because they are well-known for data classification. Two types of ANN were applied: PNN and BPNN. The 1080 datapoints were divided into three parts. Half of the data were applied for training the AI models. Data validation was performed using 25% of the data, and the case study used 25% of the data. Normalized values (0–1) of the coefficients of phase ABC and zero sequence were input into the algorithms for classification. The results of all AI for fault classification in the case study show that PNN and SVM were the most accurate. For the additional cases with all AI models for fault classification, it can be seen that the SVM was found to be more accurate than PNN and BPNN.
Because of complex information, AI methods are required for fault classification because of the high flexibility and because all fault data do not need to be input for training. PNN and BPNN showed errors in the case of different loads, and controlling the load in real-time cases is difficult. However, the SVM provided 100% accuracy for both types of data (case study and additional cases). In terms of computation time, the result was that the SVM is suitable for fault classification because it is flexible and no training is required.

Author Contributions

Conceptualization, J.K. and A.N.; methodology, J.K.; software, J.K.; validation, J.K. and A.N.; formal analysis, J.K.; investigation, J.K.; resources, A.N.; data curation, J.K.; writing—original draft preparation, J.K.; writing—review and editing, A.N.; visualization, J.K.; supervision, A.N.; project administration, A.N.; funding acquisition, A.N. All authors have read and agreed to the published version of the manuscript.

Funding

This research received no external funding.

Acknowledgments

The authors wish to gratefully acknowledge financial support for this research from King Mongkut’s Institute of Technology Ladkrabang Research fund, Thailand.

Conflicts of Interest

The authors declare no conflict of interest.

References

  1. Prasad, A.; Edward, J.B.; Ravi, K. A review on fault classification methodologies in power transmission systems: Part—I. J. Electr. Syst. Inf. Technol. 2018, 5, 48–60. [Google Scholar] [CrossRef]
  2. Prasad, A.; Edward, J.B.; Ravi, K. A review on fault classification methodologies in power transmission systems: Part—II. J. Electr. Syst. Inf. Technol. 2018, 5, 61–67. [Google Scholar] [CrossRef] [Green Version]
  3. Guillen, D.; Paternina, M.R.A.; Zamora, A.; Ramirez, J.M.; Idarraga, G. Detection and classification of faults in transmission lines using the maximum wavelet singular value and Euclidean norm. IET Gener. Transm. Distrib. 2015, 9, 2294–2302. [Google Scholar] [CrossRef]
  4. Guillen, D.; Paternina, M.R.A.; Bejar, J.O.; Tripathy, R.K.; Mendez, A.Z.; Olvera, R.T.; Tellez, E.S. Fault detection and classification in transmission lines based on a PSD index. IET Gener. Transm. Distrib. 2018, 12, 4070–4078. [Google Scholar] [CrossRef]
  5. Rathore, B.; Shaik, A.G. Fault Detection and Classification on Transmission Line using Wavelet Based Alienation Algorithm. In Proceedings of the 2015 IEEE Innovative Smart Grid Technologies—Asia (ISGT ASIA), Bangkok, Thailand, 3–6 November 2015; pp. 1–6. [Google Scholar]
  6. Adly, A.R.; Sehiemy, R.A.E.; Abdelaziz, A.Y. A Novel Single End Measuring System Based Fast Identification Scheme for Transmission Line Faults. Measurement 2017, 103, 263–274. [Google Scholar] [CrossRef]
  7. Pothisarn, C.; Jettanasen, C. The study on wavelet coefficient behavior of simultaneous fault on the hybrid between overhead and underground distribution system. Int. J. Smart Grid Clean Energy 2019, 8, 367–371. [Google Scholar]
  8. Klomjit, J.; Ngaopitakkul, A. Fault Classification on the Hybrid Transmission Line System between Overhead Line and Underground Cable. In Proceedings of the 2017 Joint 17th World Congress of International Fuzzy Systems Association and 9th International Conference on Soft Computing and Intelligent Systems (IFSA-SCIS), Otsu, Japan, 27–30 June 2017; pp. 1–6. [Google Scholar]
  9. Klomjit, J.; Ngaopitakkul, A.; Sreewirote, B. Comparison of Mother Wavelet for Classification Fault on Hybrid Transmission Line Systems. In Proceedings of the 2017 IEEE 8th International Conference on Awareness Science and Technology (iCAST), Taichung, Taiwan, 8–10 November 2017; pp. 527–532. [Google Scholar]
  10. Apisit, C.; Pothisarn, C.; Ngaopitakkul, A. An Application of Discrete Wavelet Transform and Support Vector Machines Algorithm for Fault Locations in Underground Cable. In Proceedings of the 2012 Third International Conference on Innovations in Bio-Inspired Computing and Applications, Kaohsiung, Taiwan, 26–28 September 2012; pp. 89–92. [Google Scholar]
  11. Ray, P.; Mishra, D.P.; Dey, K.; Mishra, P. Fault Detection and Classification of a Transmission Line Using Discrete Wavelet Transform & Artificial Neural Network. In Proceedings of the 2017 International Conference on Information Technology (ICIT), Bhubaneswar, India, 21–23 December 2017; pp. 178–183. [Google Scholar]
  12. Magagula, X.G.; Hamam, Y.; Jordaan, J.A.; Yusuff, A.A. Fault Detection and Classification Method Using DWT and SVM in A Power Distribution Network. In Proceedings of the 2017 IEEE PES PowerAfrica, Accra, Ghana, 27–30 June 2017; pp. 1–6. [Google Scholar]
  13. Zin, A.A.M.; Saini, M.; Mustafa, M.W.; Sultan, A.R.; Rahimuddin. New Algorithm for Detection and Fault Classification on Parallel Transmission Line using DWT and BPNN based on Clarke’s Transformation. Neurocomputing 2015, 168, 983–993. [Google Scholar]
  14. Shaaban, S.A.; Moamen, M.A.A. Wavelet Signal Energy with RBFNN and GRNN for Fault Classification in Transmission Line with Series Compensator. In Proceedings of the 2017 Innovations in Power and Advanced Computing Technologies (i-PACT), Vellore, India, 21–22 April 2017; pp. 1–6. [Google Scholar]
  15. Chang, H.H. Non-intrusive fault identification of power distribution systems in intelligent buildings based on power- spectrum-based wavelet transform. Energy Build. 2016, 127, 930–941. [Google Scholar] [CrossRef]
  16. Abdelgayed, T.S.; Morsi, W.G.; Sidhu, T.S. A New Harmony Search Approach for Optimal Wavelets Applied to Fault Classification. IEEE Trans. Smart Grid 2018, 9, 521–529. [Google Scholar] [CrossRef]
  17. Abdullah, A. Ultrafast Transmission Line Fault Detection Using a DWT Based ANN. IEEE Trans. Ind. Appl. 2018, 54, 1182–1193. [Google Scholar] [CrossRef]
  18. Jafarian, P.; Pasand, M.S. High-Frequency Transients-Based Protection of Multiterminal Transmission Lines Using the SVM Technique. IEEE Trans. Power Deliv. 2013, 28, 188–196. [Google Scholar] [CrossRef]
  19. Almeidaa, A.R.; Almeidaa, O.M.; Juniora, B.F.S.; Barretob, L.H.S.C.; Barrosca, A.K. ICA feature extraction for the location and classification of faults in high-voltage transmission lines. Electr. Power Syst. Res. 2017, 148, 254–263. [Google Scholar] [CrossRef]
  20. Dehghani, M.; Khooban, M.H.; Niknam, T. Fast fault detection and classification based on a combination of wavelet singular entropy theory and fuzzy logic in distribution lines in the presence of distributed generations. Int. J. Electr. Power Energy Syst. 2016, 78, 455–462. [Google Scholar] [CrossRef]
  21. Yadav, A.; Swetapadma, A. A novel transmission line relaying scheme for fault detection and classification using wavelet transform and linear discriminant analysis. Ain Shams Eng. J. 2015, 6, 199–209. [Google Scholar] [CrossRef] [Green Version]
  22. Govara, S.A.; Pourghasema, P.; Seyedia, H. High impedance fault protection scheme for smart grids based on WPT and ELM considering evolving and cross-country faults. Int. J. Electr. Power Energy Syst. 2019, 107, 412–421. [Google Scholar]
  23. Ray, P.; Mishra, D.P. Support vector machine based fault classification and location of a long transmission line. Eng. Sci. Technol. Int. J. 2016, 19, 1368–1380. [Google Scholar] [CrossRef] [Green Version]
  24. Babu, N.R.; Mohan, B.J. Fault classification in power systems using EMD and SVM. Ain Shams Eng. J. 2017, 8, 103–111. [Google Scholar] [CrossRef] [Green Version]
  25. Mishra, S.K.; Tripathy, L.N.; Swain, S.C. DWT approach based differential relaying scheme for single circuit and double circuit transmission line protection including STATCOM. Ain Shams Eng. J. 2019, 10, 93–102. [Google Scholar] [CrossRef]
  26. Chen, Y.Q.; Fink, O.; Giovanni Sansavini, G. Combined Fault Location and Classification for Power Transmission Lines Fault Diagnosis with Integrated Feature Extraction. IEEE Trans. Ind. Electron. 2018, 65, 561–569. [Google Scholar] [CrossRef]
  27. Shafiullah, M.; Abido, M.A.; Hamouz, Z.A. Wavelet-based extreme learning machine for distribution grid fault location. IET Gener. Transm. Distrib. 2017, 11, 4256–4263. [Google Scholar] [CrossRef]
  28. Chang, H.H.; Zhang, R. Machine Learning Techniques for Single-Line to- Ground Fault Classification in Nonintrusive Fault Detection of Extra High-Voltage Transmission Network Systems. In Proceedings of the Fifth Euro-China Conference on Intelligent Data Analysis and Applications. ECC 2018, Xian, China, 12–14 October 2018; Advances in Intelligent Systems and Computing; Springer: Cham, Switzerland, 2018; Volume 891, pp. 109–116. [Google Scholar]
  29. Reddy, M.J.B.; Gopakumar, P.; Mohanta, D.K. A novel transmission line protection using DOST and SVM. Eng. Sci. Technol. Int. J. 2016, 19, 1027–1039. [Google Scholar]
Figure 1. Overall process for simulation and analysis of faults in a 115-kV hybrid transmission line.
Applsci 10 03967 g001
Figure 2. Overview structure of the transmission lines between the overhead line and underground cable.
Applsci 10 03967 g002
Figure 3. Fault signal from EMTP/ATPDraw of the primary and secondary currents: Phase A short circuit to ground fault at 30% of the length of transmission line.
Applsci 10 03967 g003
Figure 4. Signals from the wavelet transform (WT) in the case of phase A, short circuit to ground fault at 30% of the length of the transmission line: (a) sending end; (b) receiving end.
Applsci 10 03967 g004aApplsci 10 03967 g004b
Figure 5. Training process of the probabilistic neural network (PNN).
Applsci 10 03967 g005
Figure 6. Training process of the back-propagation neural network (BPNN).
Applsci 10 03967 g006
Figure 7. Training process of the support vector machine (SVM).
Applsci 10 03967 g007
Table 1. Fault detection and classification method of past articles.
Proposed MethodParameter for DecisionReference
Wavelet Transform (WT) and Algorithm
Discrete wavelet transform (DWT)Energy[3]
Coefficients,[6,7,8,9]
Power spectral density,[4]
Alienation coefficients[5]
WT and artificial intelligence (AI)
DWT and SVMCoefficients, Spectral, Energy[10,12,18,19,28]
DWT and FuzzyCoefficients[20]
DWT and ANNCoefficients, Energy, Spectral[11,13,14,15,17,25]
DWT and HSACoefficients[16]
DWT and ELMCoefficients[26,27]
DWT and LDACoefficients[21]
Wavelet packet transform (WPT) and SVMCoefficients[22]
WPT and ELMEnergy and entropy[23]
Empirical Mode Decomposition (EMD) and SVM-[24]
Table 2. Percentage of accurate results.
Type of FaultAI Type (Sending End)AI Type (Receiving End)
PNNBPNNSVMPNNBPNNSVM
SLG100%99.86%100%100%100%100%
DLG100%99.72%100%100%100%100%
LL100%100%100%100%100%100%
3P100%100%100%100%100%100%
Average100%98.88%100%100%100%100%
Table 3. Percentage of accurate results (additional case).
Additional CaseAI Type (Sending End)AI Type (Receiving End)
PNNBPNNSVMPNNBPNNSVM
Vary ground resistivity100%100%100%100%100%100%
(1–100 ohm) 6 Case
Vary load (70–120%)50%50%100%50%100%100%
10 Case
Average68.75%68.75%100%68.75%100%100%

