Article

Prediction of Surface Roughness Based on Cutting Parameters and Machining Vibration in End Milling Using Regression Method and Artificial Neural Network

1
Graduate Institute of Precision Manufacturing, National Chin-Yi University of Technology, Taichung 41170, Taiwan
2
Intelligent Machinery Technology Center, Industrial Technology Research Institute, Taichung 40852, Taiwan
*
Author to whom correspondence should be addressed.
Appl. Sci. 2020, 10(11), 3941; https://doi.org/10.3390/app10113941
Submission received: 14 May 2020 / Revised: 1 June 2020 / Accepted: 3 June 2020 / Published: 5 June 2020
(This article belongs to the Section Mechanical Engineering)

Abstract

:
This study presents surface roughness modeling for machined parts based on cutting parameters (spindle speed, cutting depth, and feed rate) and machining vibration in the end milling process. Prediction models were developed using multiple regression analysis and an artificial neural network (ANN) modeling approach. To reduce the effect of chatter, machining tests were conducted under varying cutting parameters as defined in the stable regions of the milling tool. The surface roughness and machining vibration level are modeled with nonlinear quadratic forms based on the cutting parameters and their interactions through multiple regression analysis methods, respectively. Analysis of variance was employed to determine the significance of cutting parameters on surface roughness. The results show that the combined effects of spindle speed and cutting depth significantly influence surface roughness. The comparison between the prediction performance of the multiple regression and neural network-based models reveal that the ANN models achieve higher prediction accuracy for all training data with R = 0.96 and root mean square error (RMSE) = 3.0% compared with regression models with R = 0.82 and RMSE = 7.57%. Independent machining tests were conducted to validate the predictive models; the results conclude that the ANN model based on cutting parameters with machining vibration has a higher average prediction accuracy (93.14%) than those of models with three cutting parameters. Finally, the feasibility of the predictive model as the base to develop an online surface roughness recognition system has been successfully demonstrated based on contour surface milling test. This study reveals that the predictive models derived on the cutting conditions with consideration of machining stability can ensure the prediction accuracy for application in milling process.

1. Introduction

High-speed, high-precision machining with a high material removal rate has been an important goal in the manufacturing industry because of the high-efficiency and high-quality requirements. Further, machined parts with a high surface finish are in high demand under considerations of assemblage precision, fatigue strength, and tribological properties of the mechanical product. To achieve high productivity and high precision, machining is implemented with a higher level of cutting parameters. However, surface quality and dimensional accuracy are affected by several factors such as machining conditions, tool geometry and vibrations, cutting parameters, and machining dynamics [1]. In particular, surface finish deteriorates because of the machining vibration caused by inappropriate machining conditions and process parameters [2,3,4,5,6,7]. Bhogal et al. [2] suggested that cutting speed is a major factor affecting tool vibration, which thereby affects surface finish. Amin et al. [3] showed the effect of chatter amplitude on surface roughness under various cutting conditions with different tool holders via machining experiments. Arizmendi et al. [5] demonstrated that the surface topography of the machined part is influenced by cutting tool vibrations. Further, David et al. [6] demonstrated that workpiece topomorphy is affected by the vibration caused by a poor runout of the cutter. They found that an increased cutting force with an increasing cutting depth and feed rate leads to higher vibration, and it accordingly increases surface roughness. Zahoor [7] reported that surface roughness was affected by the vibration amplitude of the machine tool and the axial cutting depth. The vibration levels are closely related to the cutting parameters and they increase with an increase in the cutting speed and feed rate [8,9,10].
To ensure machining performance with better surface quality, the selection of optimum process parameters is crucial in metal machining. To achieve this goal, a majority of studies has employed experimental and modeling approaches to determine strategies to obtain the best final surface quality and dimensional accuracy [11,12,13,14,15]. The effect of cutting parameters on surface roughness can be effectively examined via the statistical data analysis of data collected from machining experiments under specifically designed process parameters. Subsequently, the optimization of the machining process with a better surface quality and less vibration can be obtained based on prediction models established by various approaches such as analytical modeling, statistical regression based on response surface methodology, and artificial intelligence-based models [16].
Response surface methodology is a statistical technique used to establish relationships between continuous dependent variables with independent variables in terms of mathematical models using multiple regression analysis. Prediction models derived from experimental data can help clarify the influences and contributions of cutting parameters on surface roughness or tool vibration; these models can further be applied to optimize cutting parameters [2,4,14,17,18,19,20,21]. Routara et al. [17] identified that all three cutting parameters (spindle speed, cutting depth, and feed rate) and their interactions have significant effects on surface roughness. Further, the surface response model shows significant dependence on the combination of the tool and workpiece material. Yang et al. [14] proposed an optimization process for machining conditions to ensure a desirable surface roughness based on surface response methodology. With an optimized solution, the material removal rate can be improved significantly without sacrificing surface roughness. Hayajneh et al. [22] and Joshua et al. [18], respectively, reported that feed rate has a significant effect on the surface roughness of machined alumina material compared with spindle speed and cutting depth. However, the effect of the interaction between cutting parameters has no definite tendency based on the machining conditions used in the tests. Hessainia et al. [23] conducted an investigation on the interactive effects of cutting parameters and tool vibration on surface roughness. Their results indicated that feed rate was the dominant factor affecting surface roughness, and vibrations in the radial and main cutting force directions had a low effect on surface roughness. Further, to obtain a desirable surface finish, optimum cutting parameters with less machining vibration were obtained using a predictive regression model. Ramesh et al. [24] and Premnath et al. [25] showed that the interaction of cutting speed and feed rate had a greater influence on surface roughness compared to other interactions.
As mentioned previously, tool vibration and chatter affect the surface quality of the machined product and the machining performance directly. Therefore, monitoring and controlling machining vibration has been considered an effective approach to enhance the surface precision and dimension accuracy of a machined product [26,27,28]. Bhogal et al. [2] employed mathematical models to predict the surface finish, tool vibration, and tool wear with different combinations of cutting parameters. With these models, the optimum feed rate, cutting depth, and cutting speed were obtained to reduce tool vibrations and enhance surface finish. Shelar and Shaikh [20] proposed a multiobjective optimization algorithm to minimize vibration amplitude and surface roughness. The objective functions and the second-order response surface models for surface roughness and vibration amplitude were created by performing regression analysis on experimentally collected data.
Surface roughness modeling has been comprehensively investigated using artificial neural network (ANN) analysis incorporated with optimization algorithms [11,25,26,27,29,30]. For example, Asilturk et al. [11] employed artificial neural networks and multiple regression approaches to model the surface roughness of AISI 1040 steel in turning. Three training algorithms—back-propagation training, scaled conjugate gradient (SCG), and Levenberg–Marquardt (LM)—were used in ANN modeling; the SCG algorithm was proven to achieve the best prediction accuracy. Tsai et al. [29] proposed statistical regression and ANN models to predict the surface roughness on aluminum 6061 after end milling based on three cutting parameters (spindle speed, feed rate, and cutting depth) and machining vibration. The experimental results show that the ANN surface recognition model has a higher accuracy rate compared with the regression model. In addition, a two hidden-layer ANN model shows a slightly higher accuracy (99.27%) than that of the one hidden-layer model (95.87%); however, it has low efficiency in the training model. A similar study was reported by Oktem [31], who developed a feedforward neural network integrated with a genetic algorithm to optimize machining conditions for obtaining the best surface finish of a plastic injection mold. The model was finally validated with prediction errors of 5.34% in comparison with the measurement of the machined surface roughness. Nalbant et al. [32] explored the influence of the cutting parameters and interactions between them on surface roughness; further, they established a surface roughness model based on ANN analysis, in which the SCG training algorithm with nine neurons demonstrates the best fitness and prediction accuracy in ANN modeling. Zain et al. [33] presented an ANN model to predict surface roughness in end milling. In ANN modeling, the number of layers and neurons in the hidden layers are factors that determine the prediction accuracy. Based on the prediction model, the best combination of cutting conditions for achieving the best surface roughness value can be obtained at a high speed with a low feed rate and radial rake angle.
The vibration induced in a machining process can be modeled as a function of cutting parameters via ANN analysis. As presented in the study by Zagórski et al. [34], individual vibration components (ax, ay, and az) were well predicted based on the ANN model for a specified cutting depth, feed rate, and cutting speed in the milling process for the AZ91D alloy. Further, the prediction accuracy based on a multilayered perception model was better than that of the radial basis function. The accurate modeling of vibration components allows optimizing the cutting conditions to enhance machining stability. Abouelatta et al. [
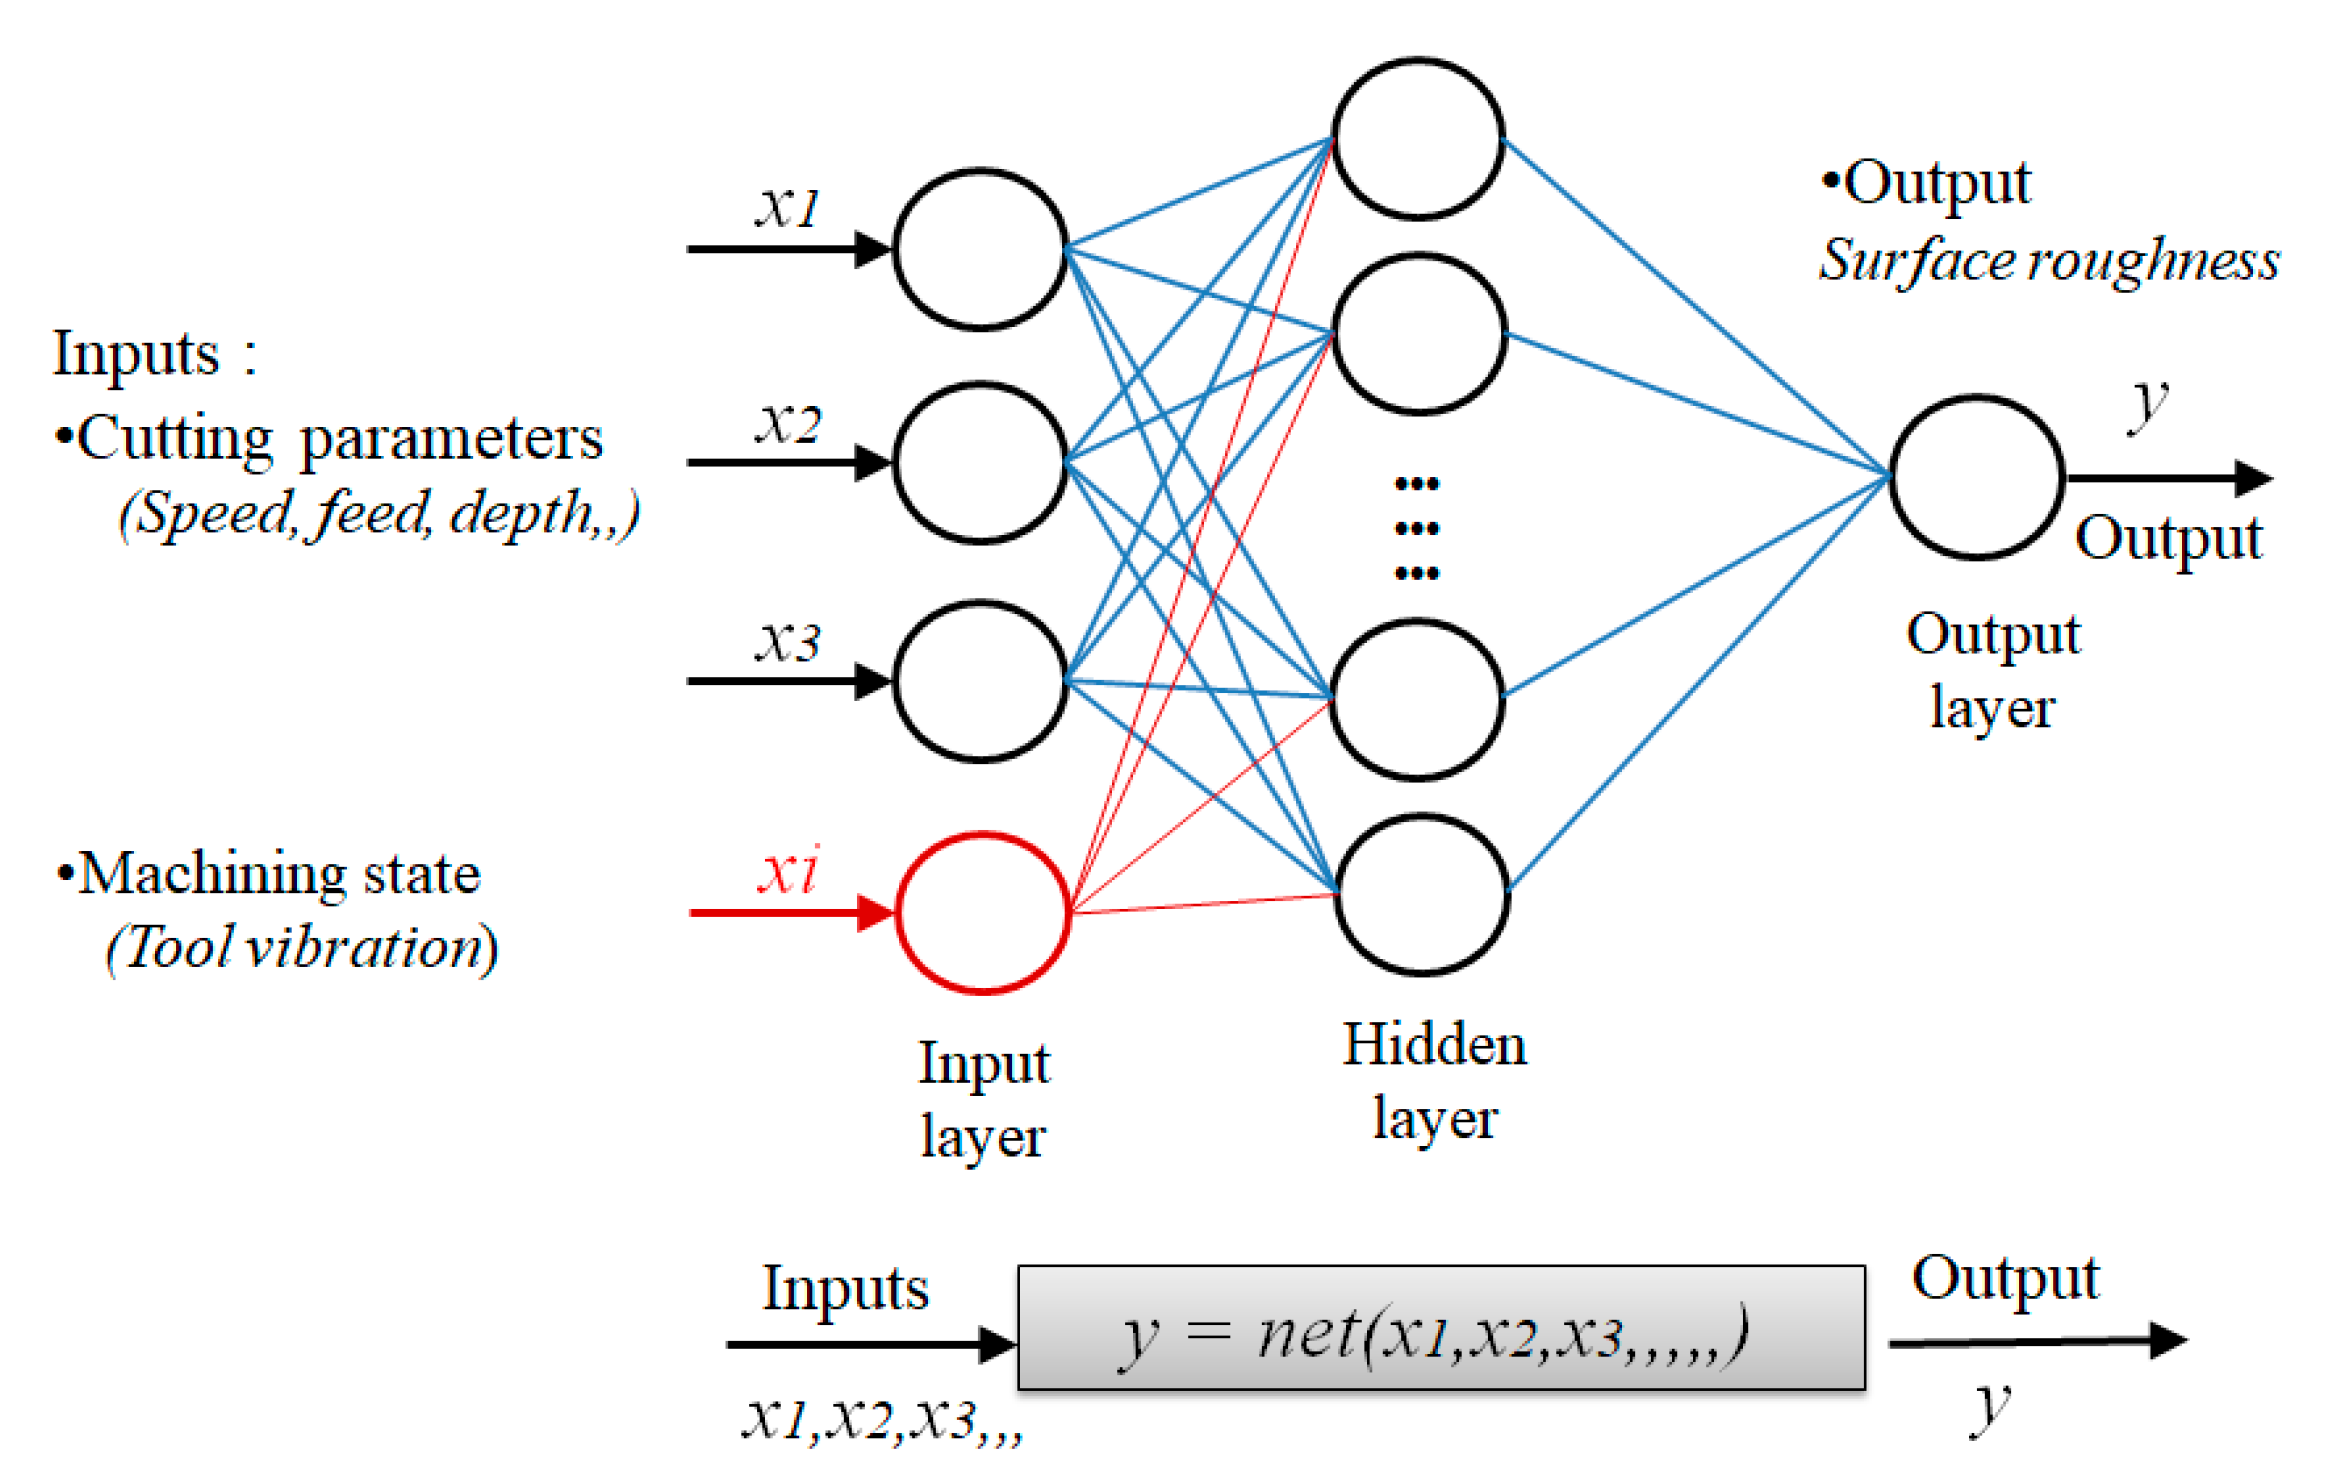
35] considered the influence of machining vibration on surface quality when establishing the surface prediction model, wherein the input variables include cutting parameters, tooling condition, and tool vibration were assessed in the turning process. Such models have higher prediction accuracies compared to those of models determined by only cutting parameters. To include the effects of cutting forces and tool vibrations in a surface roughness prediction model, Chen et al. [36] proposed a nested ANN composed of two networks: An enclosed network that uses the cutting parameters to predict the cutting force and tool vibration, and an output network that takes all outputs of the first network and the cutting parameters as inputs to predict surface roughness. According to the analysis results, the nested-ANN model using three cutting parameters as inputs shows superior prediction accuracy than any other regression and ANN models that use the cutting parameter and tool vibration as inputs. These investigations clearly illustrate the significant influences of the machining state such as the cutting forces and tool vibrations on the machined surface roughness; these effects can be adequately introduced in the roughness prediction models by acquiring sensory data from machining or through an estimation algorithm with cutting parameters as inputs.
From previous studies, it is clear that factors affecting machined surface quality are multifaceted, including cutting parameters, tooling conditions, workpiece material, and machining state. The effect of each factor and the interactions between them on surface quality and machining vibration are found to be inconsistent because of the scope of machining conditions defined in different researches [20,21,22,23]. Further, various factors used as input variables in the modeling of surface roughness enable the model demonstrating different prediction accuracies; this limits the application in practical machining. The results obtained may work well in the design space of experiments; however, there are constraints in the ranges of the cutting parameters, which limit the application of the specific models in the machining process with different cutting conditions for the desired precision or productivity [37].
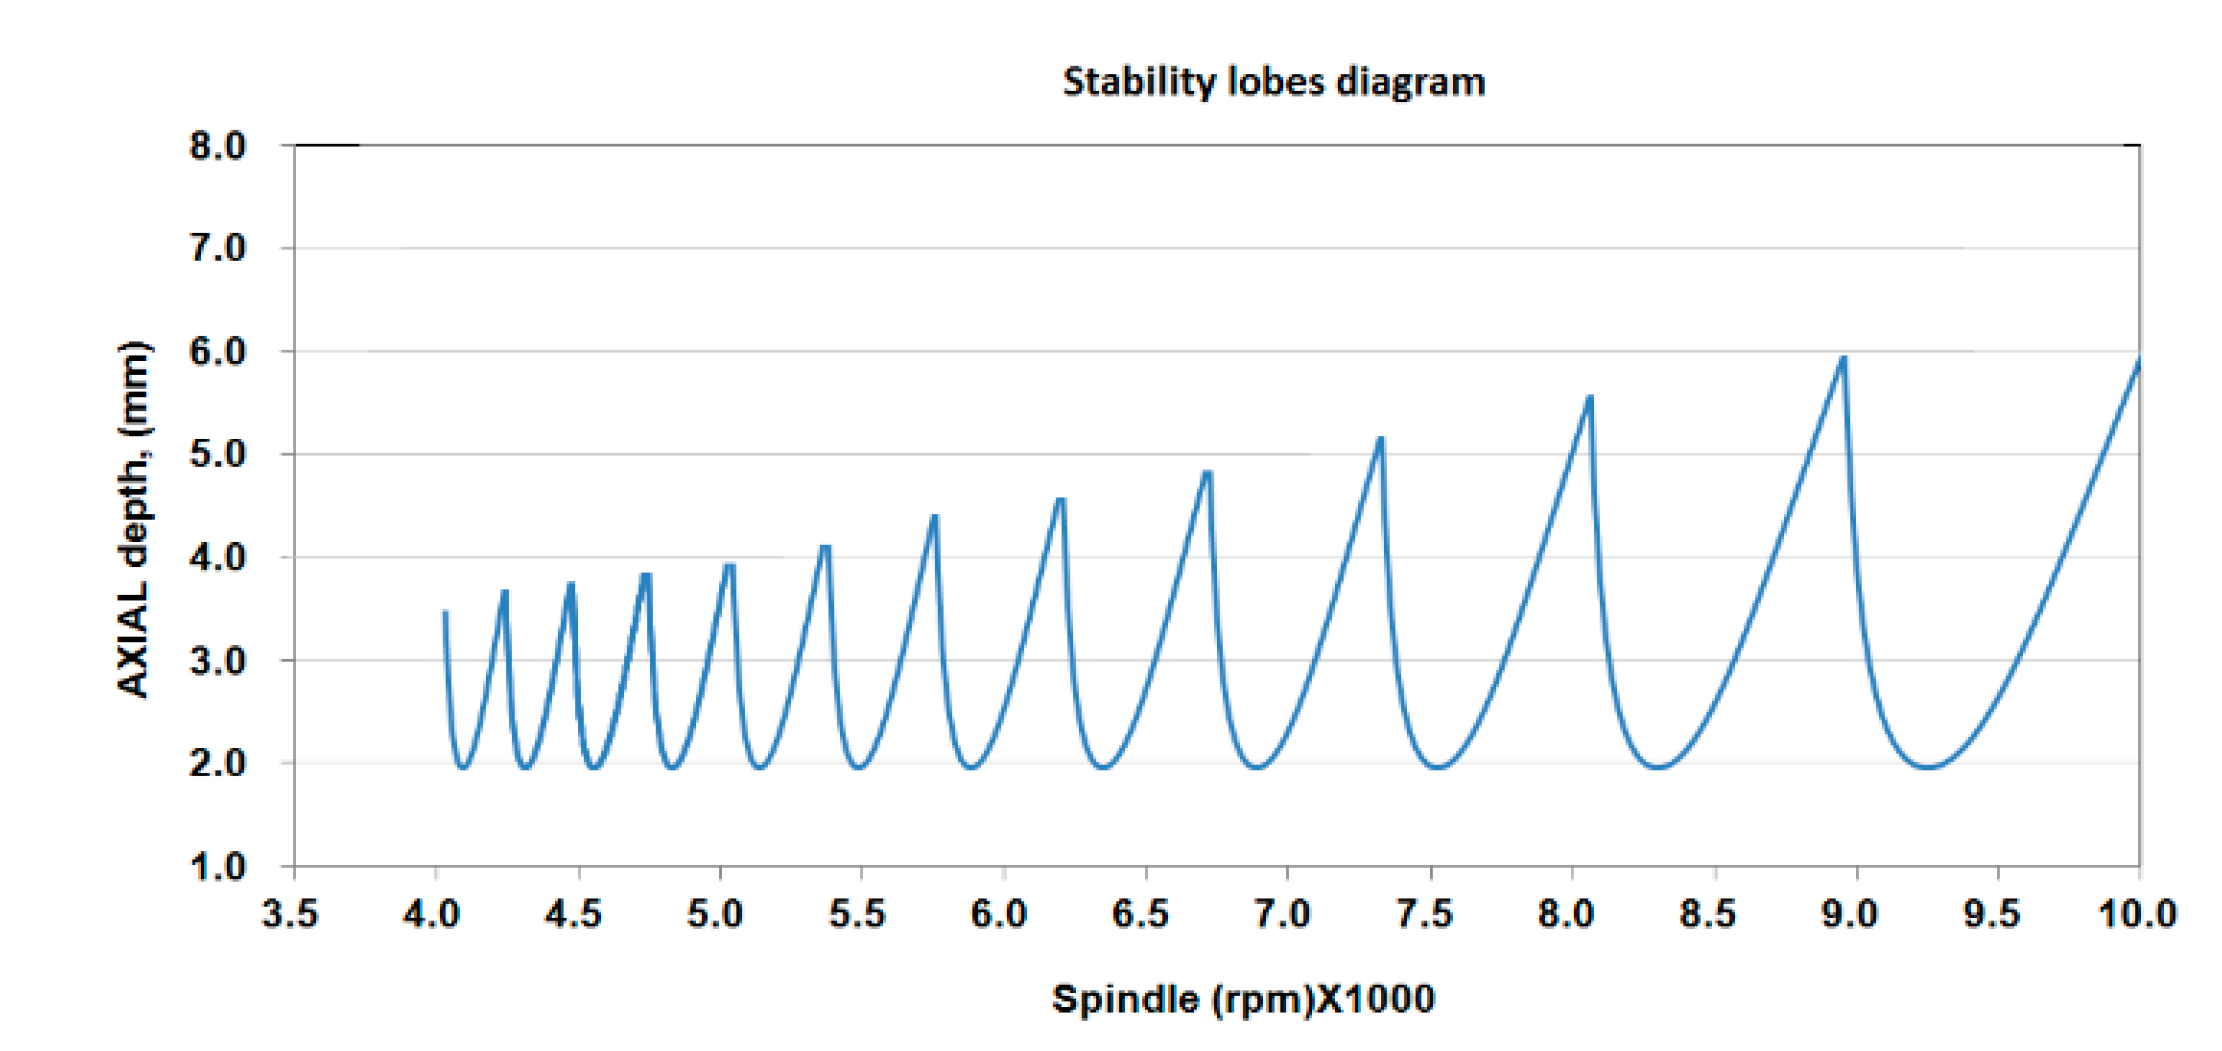
This study was aimed to model the surface roughness of the machined part based on cutting parameters with the effect of machining vibration. As the occurrence of chatter is a common factor affecting productivity and surface quality, selecting an optimum chatter-free cutting parameter is prerequisite to ensure machining performance [
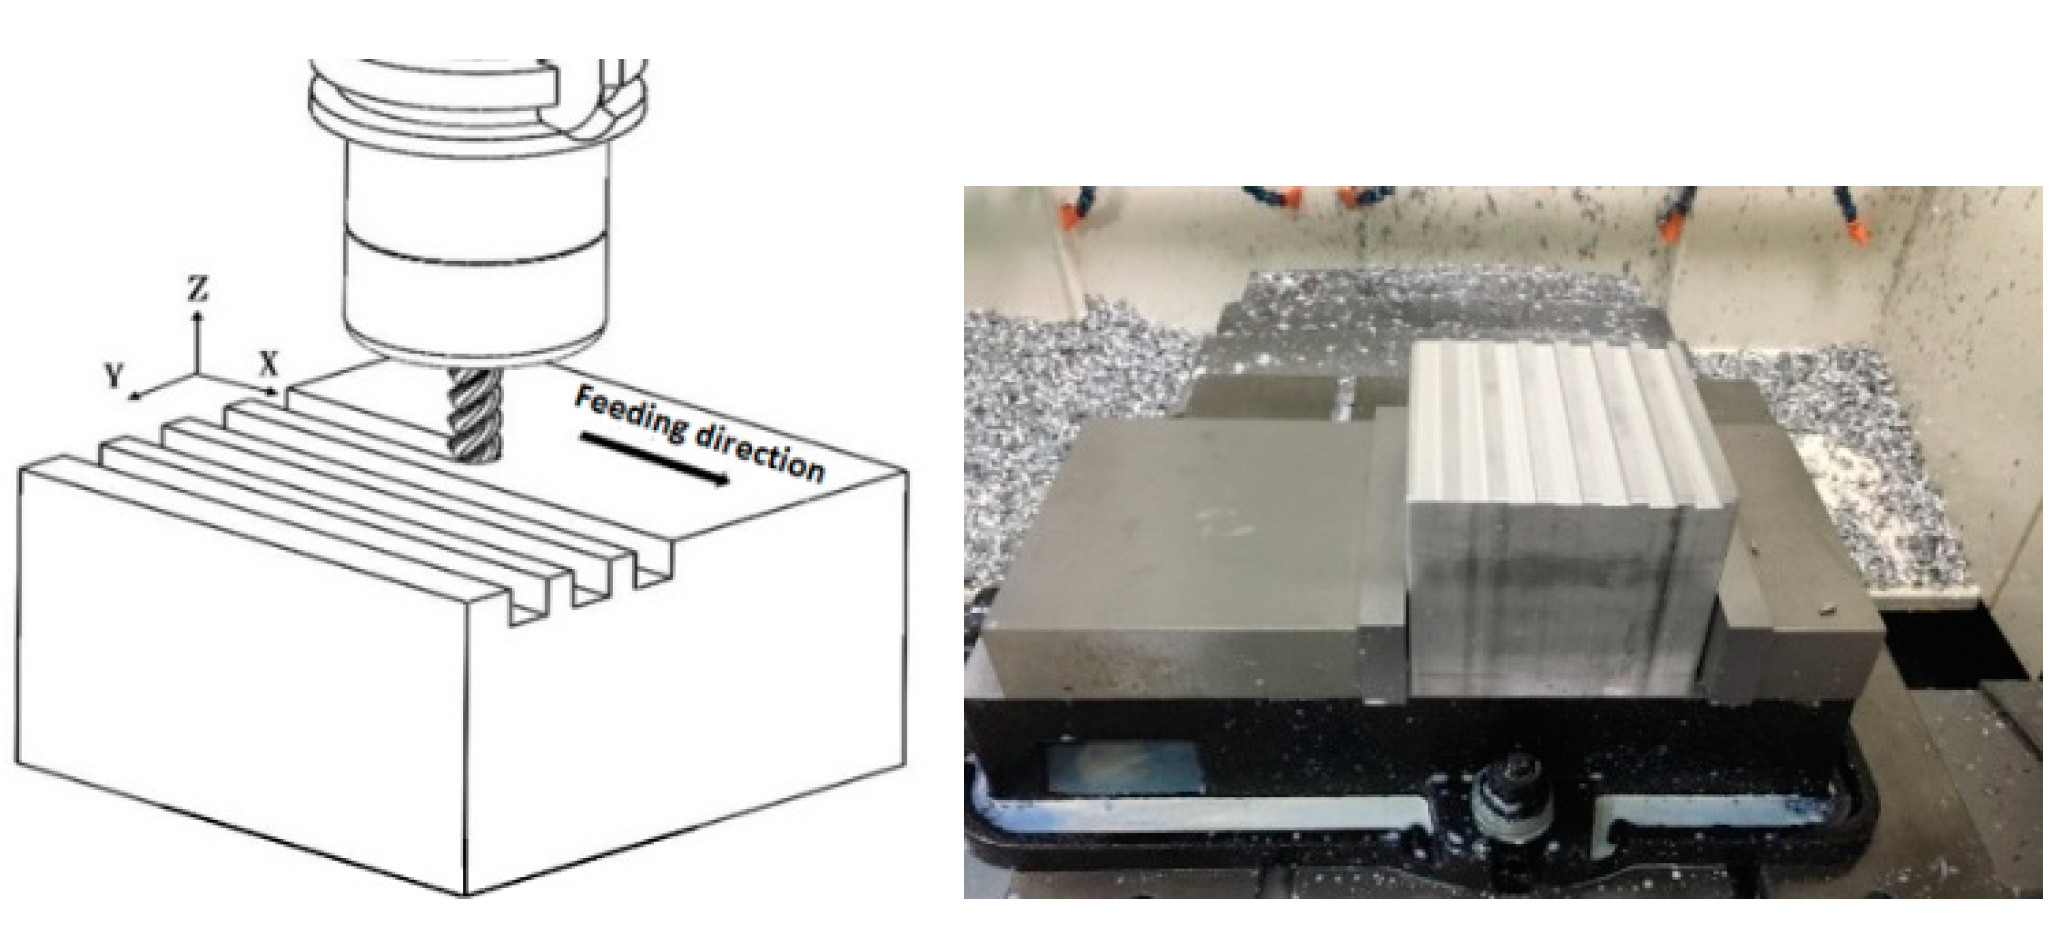
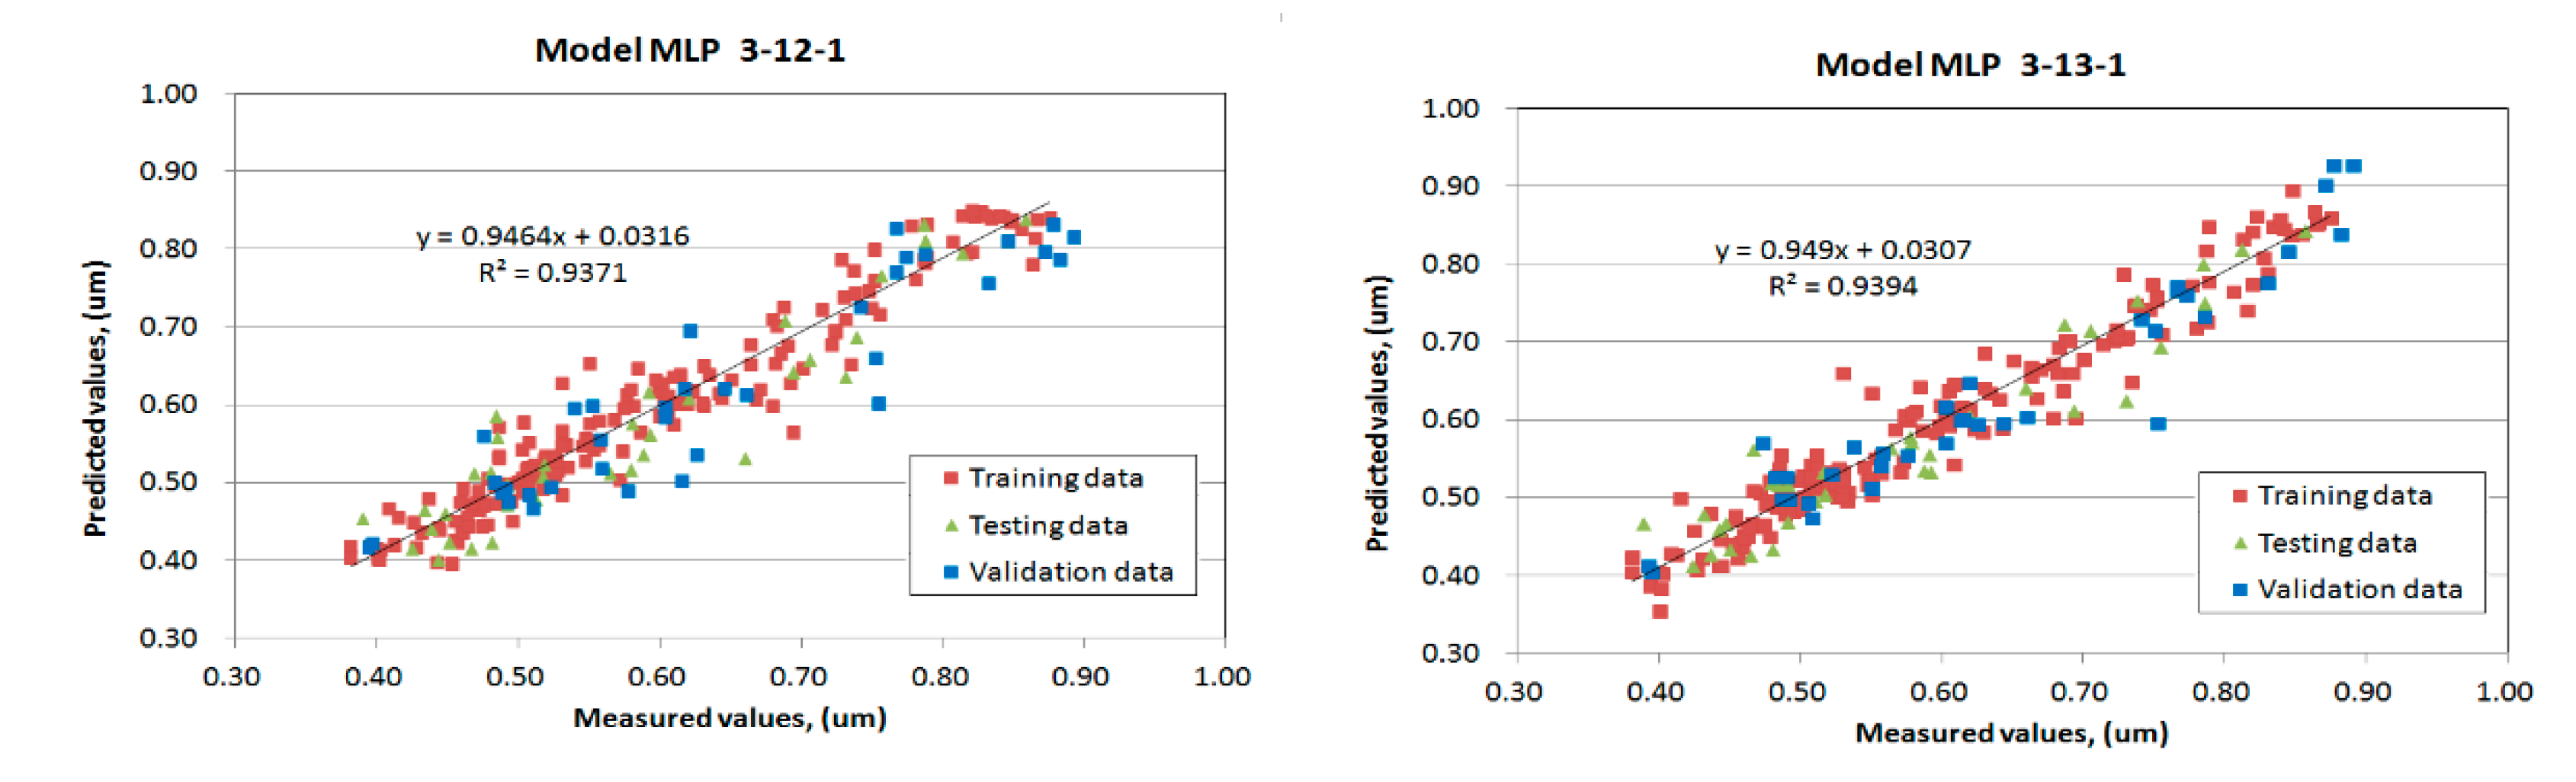
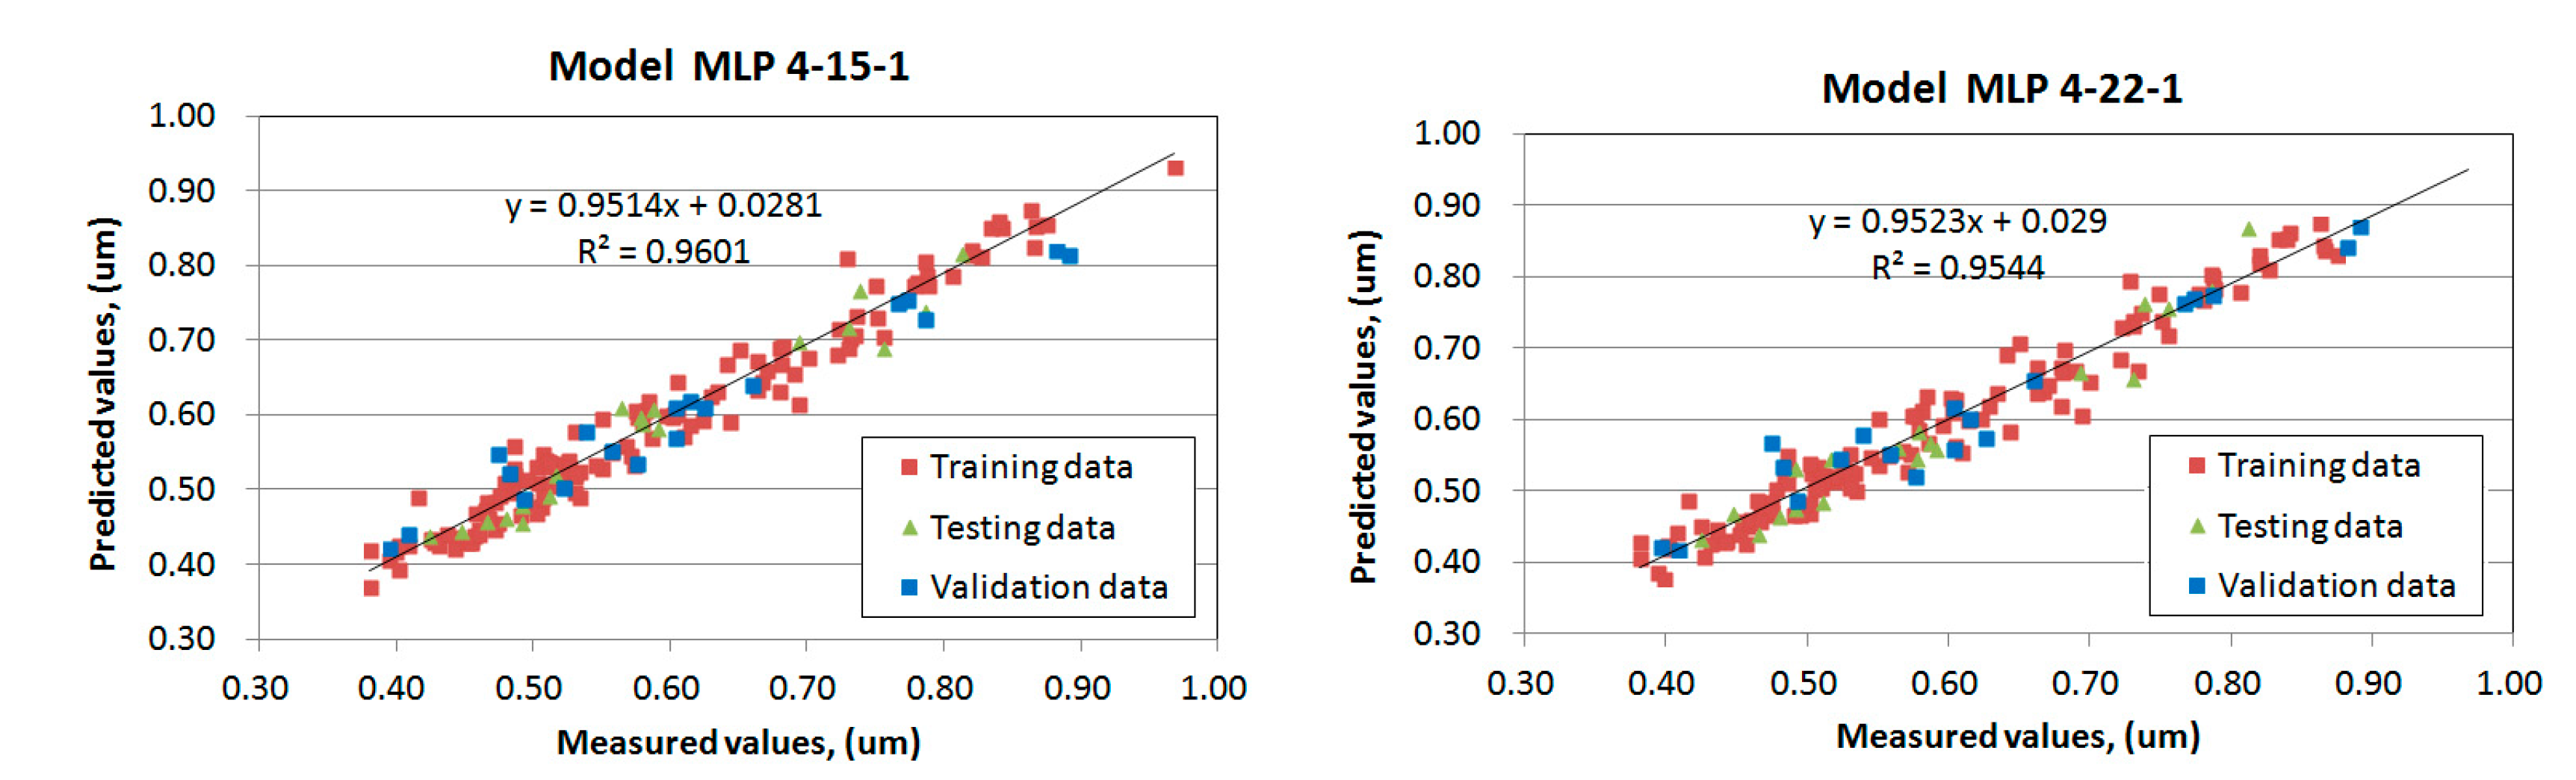
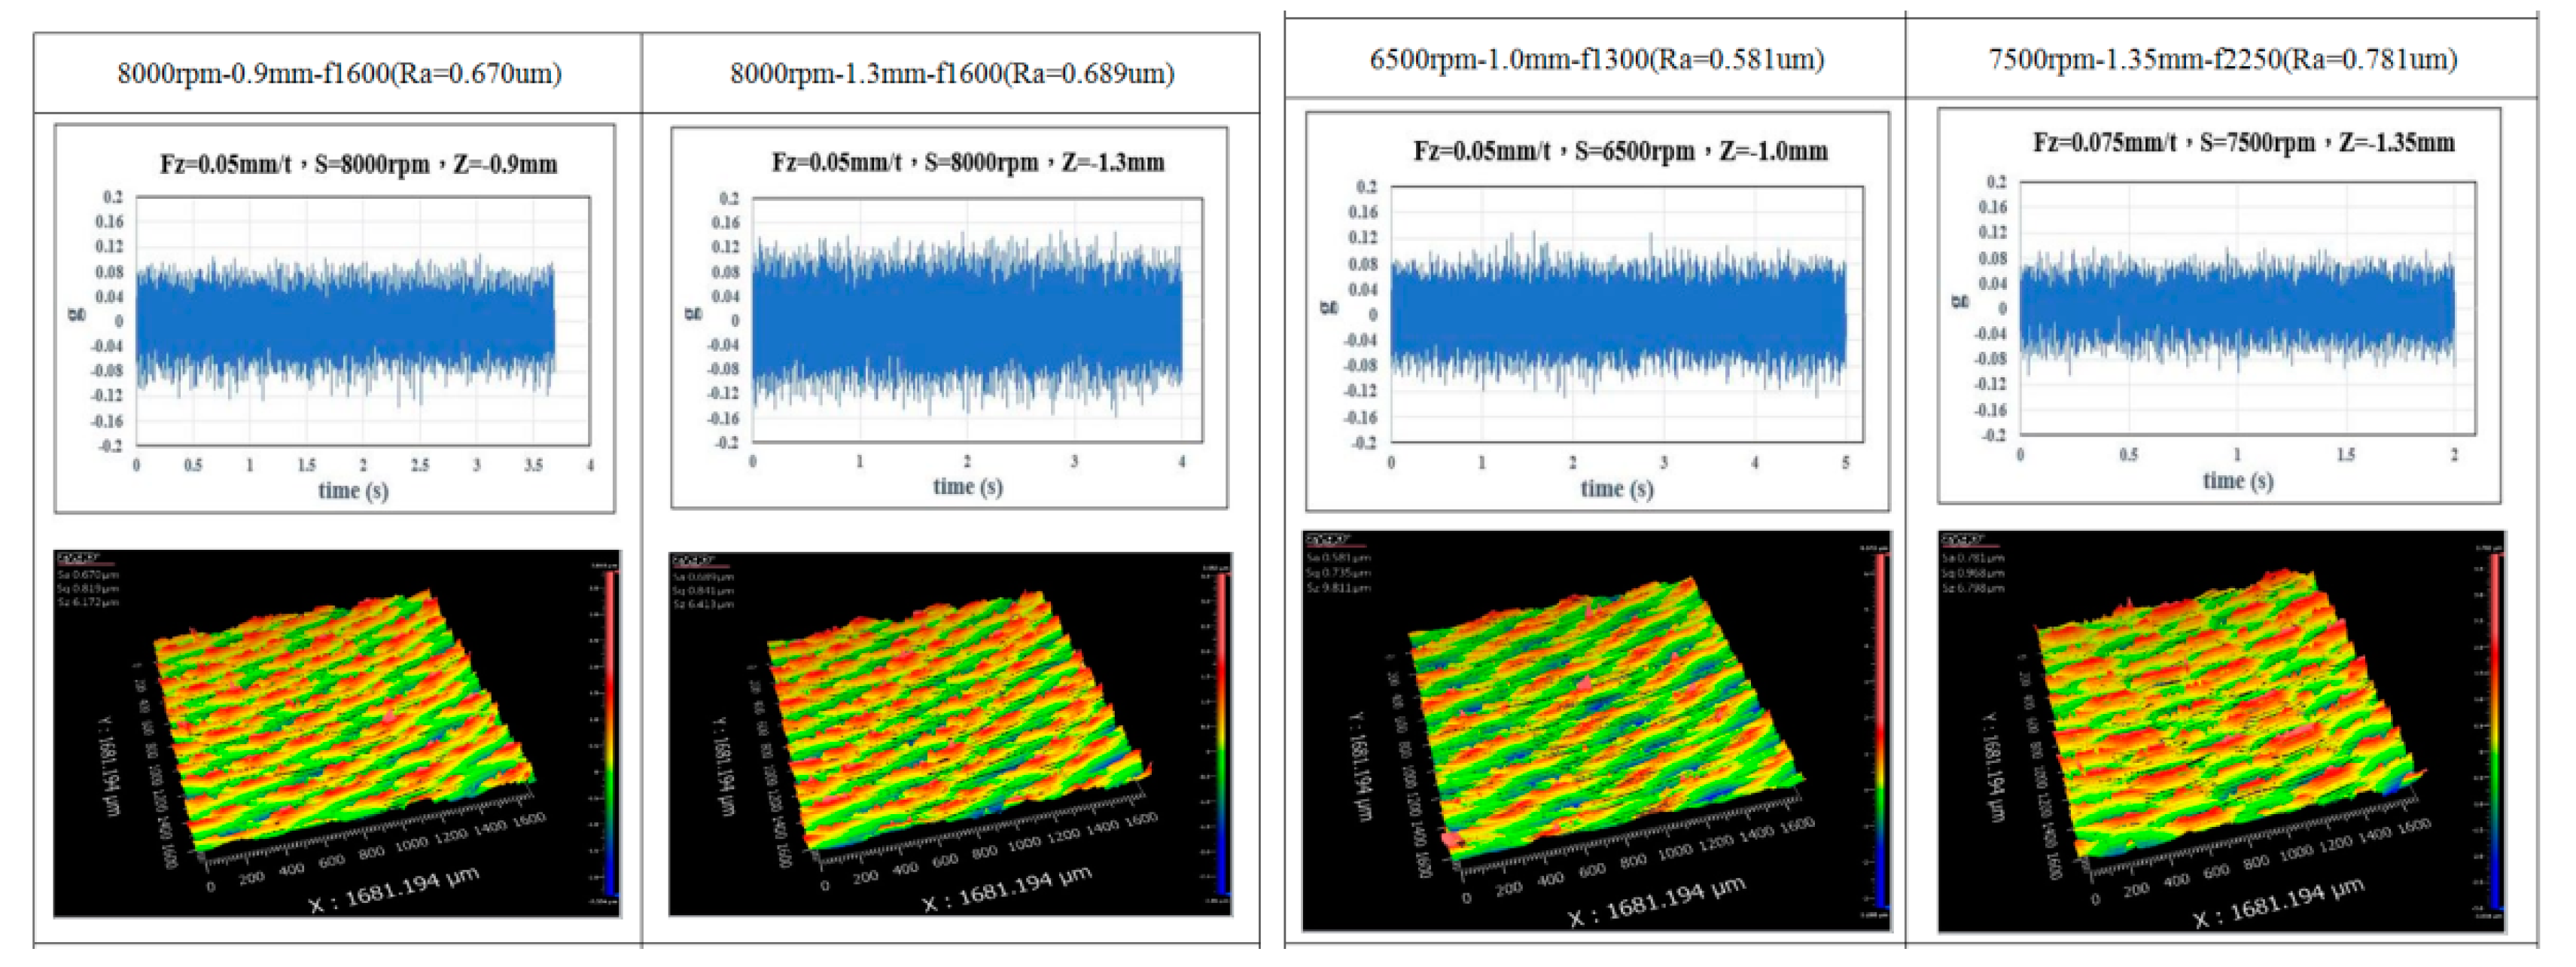
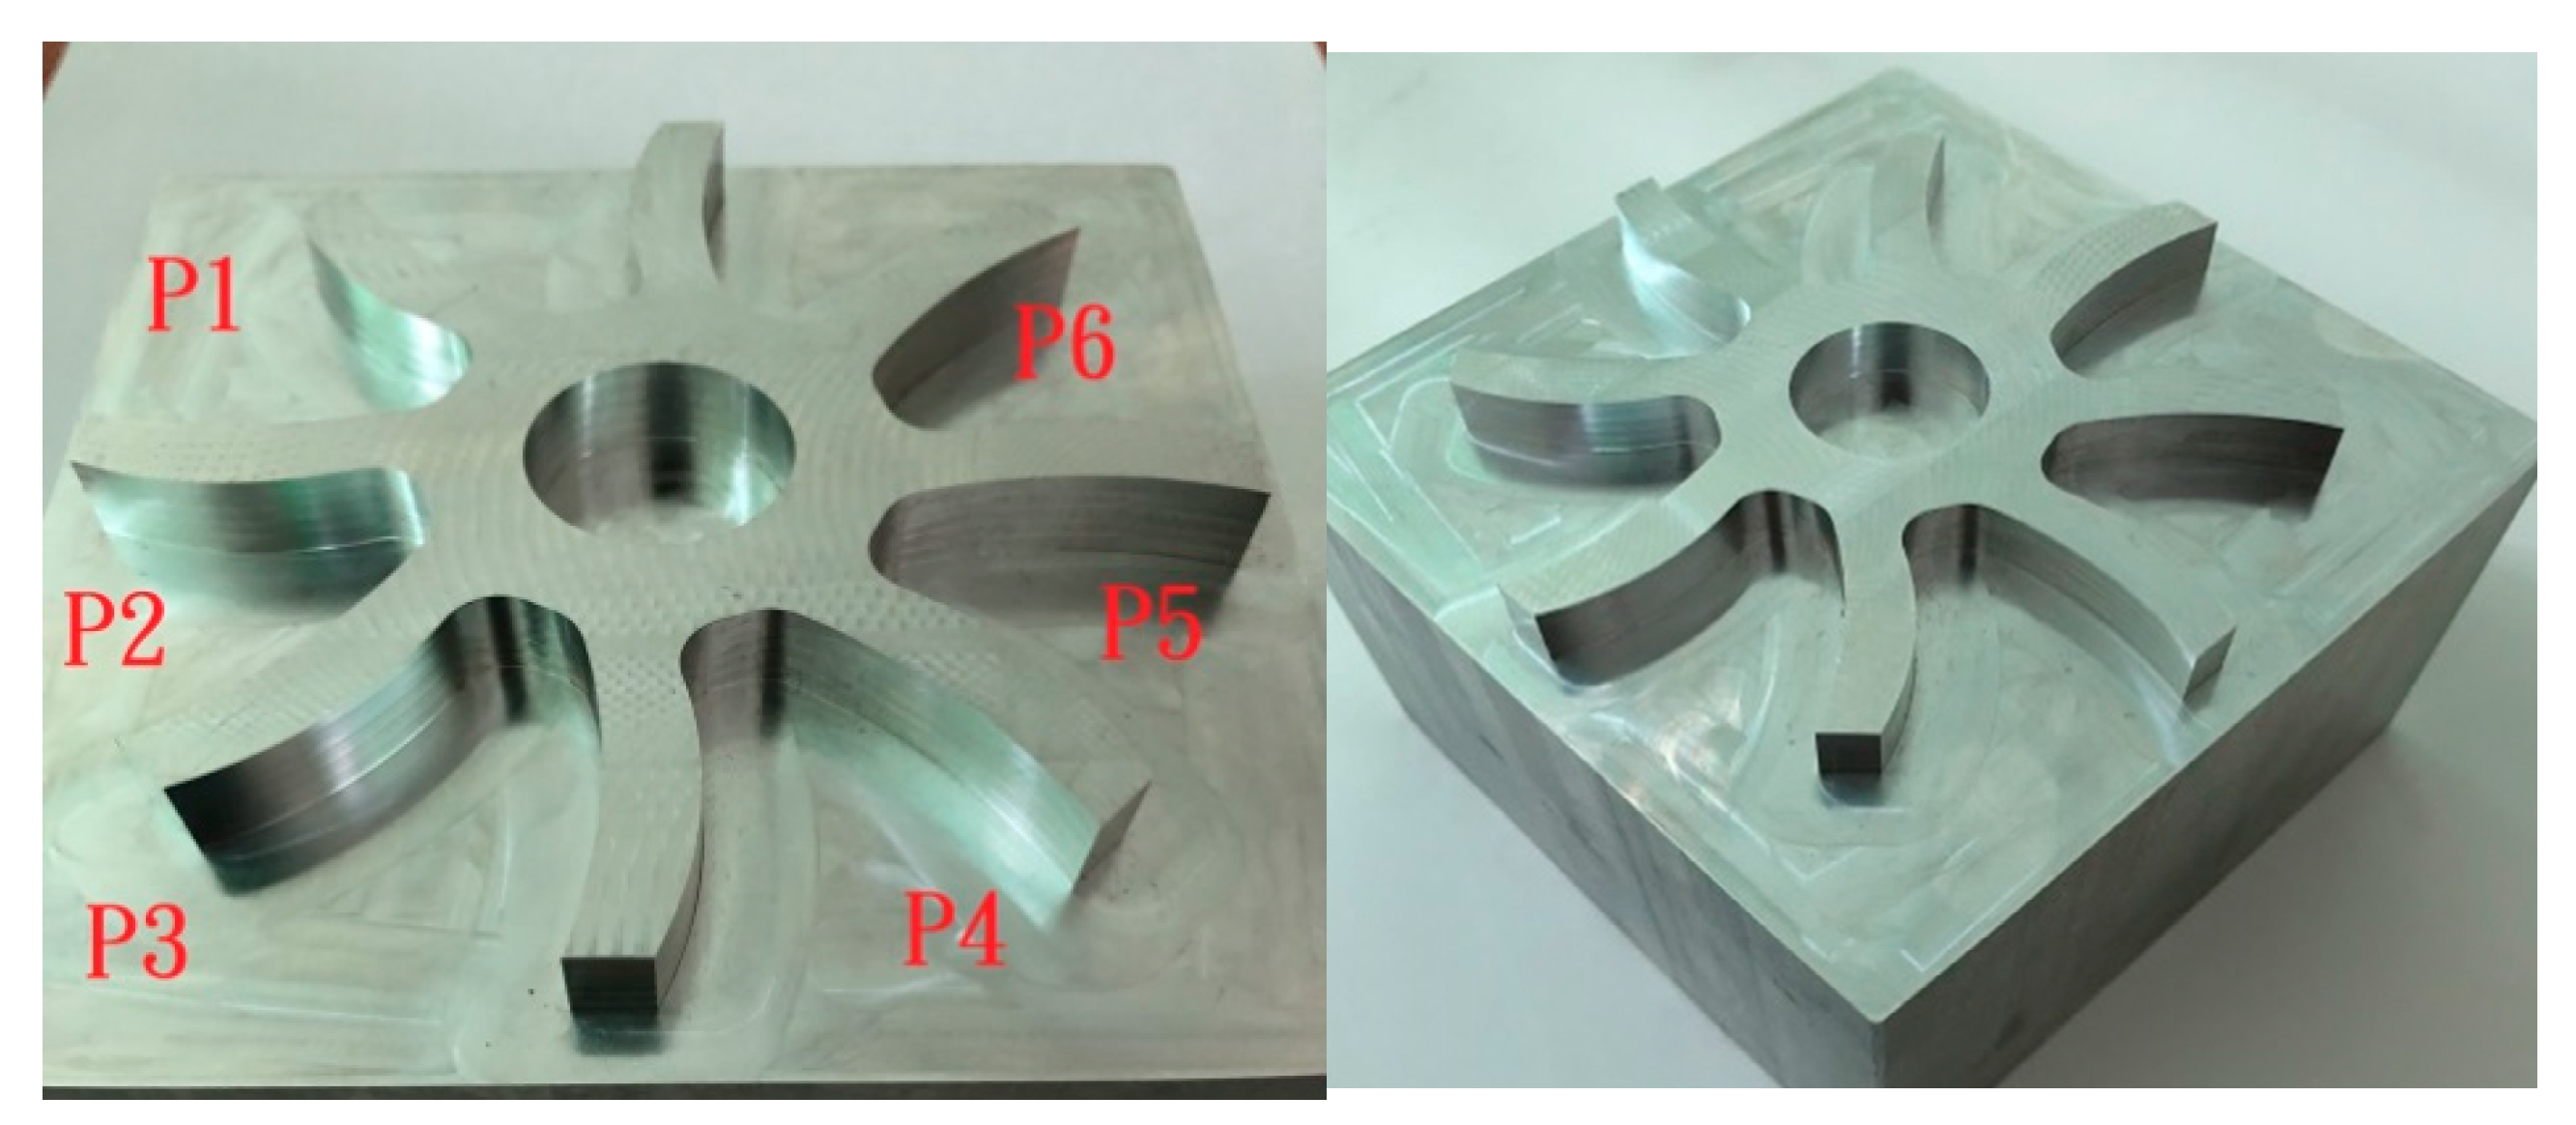
38]. Considering the effect of chatter on the machining process, the cutting parameters from rough to finish machining were selected within the stable regions defined by the machining stability lobes of the milling tool. Then, machining vibration and surface roughness of the machined parts were collected from milling experiments conducted on the aluminum alloy under various cutting conditions. Multivariable linear regression analysis was employed to establish the mathematical models for predicting the surface roughness and machining vibration. In addition, the surface roughness was modeled as a function of cutting parameters and machining vibration using a multilayer perception neural network with a back-propagation algorithm. The prediction capabilities of the models derived from different approaches were compared based on the measurements and predictions in the training data group and the validation of physical milling machining.

2. Experiment Approaches

In this study, the mathematical model for predicting the surface roughness of a milled workpiece was established based on an experimentally data driven approach that employs regression analysis and an ANN model. The training data required for prediction models were collected from machining tests. To conduct a comprehensive study, the cutting parameters, cutting depth, and spindle speed were selected within the range of spindle speed and cutting depth between low speed, rough machining to high speed, and finish machining. In particular, to ensure machining in a stable state with a higher removal rate, the cutting depth and spindle speed within the stable region were selected based on the machining stability of the cutter [38]. The stability lobes were calculated based on the frequency response function assessed from the impact test.

2.1. Assessment of Machining Stability of Milling Cutter

2.1.1. Impact Vibration Test of Cutter

Figure 1 shows the experimental configuration for assessing the frequency response function of the milling cutter, in which a 10 mm 4-tooth carbide cutter with a BT tool holder was installed in the spindle. In the test, the spindle head was located at an appropriate height from the working table. An accelerometer was mounted on the tool end to assess the vibration response excited by an impact hammer hit on the opposite side of the cutter, as shown in Figure 1.

2.1.2. Frequency Response Function and Machining Stability

Figure 2 shows the frequency response functions of the tool end measured in the x direction. The milling cutter shows the maximum compliance of 1.82 μm/N at a frequency of 5332 Hz. Based on this dominant mode, machining stability lobes were calculated according to the analytical approach proposed by Altintas [39]. To calculate machining stability, the cutting resistance coefficients for the milling material Al6061 with a carbide cutter were identified as Kt = 796 N/mm2 and Kr = 0.21 [39]. Figure 3 illustrates the stability lobes diagram of the cutter, which suggests the machining conditions with or without chatter in terms of the axial cutting depth as a function of spindle speed. As shown in the lobes diagram, the limited cutting depth is ~2.0 mm, which indicates that stable machining without chatter can be obtained when the cutting depth below the critical value is adopted.

2.2. Machining Tests

Experiments were conducted on the Feeler U600 (Fair Friend Ent. Co., Ltd, Taipei City, Taiwan) milling machine with a 4-tooth tungsten carbide end mill cutter. The workpiece material is an aluminum alloy (Al6061) with a size of 150 mm × 150 mm × 80 mm. Machining operations were performed by full immersion of slot milling, as shown in Figure 4. Each slot was milled in the X-direction under specific cutting parameters at different levels. Considering the effect of chatter on the machining process, the cutting parameters from rough to finish machining were selected within the stable regions that were defined by the machining stability lobes of the milling tool. The axial cutting depth (ap) was defined in the range of 0.1 and 2.0 mm with an increment of 0.1 mm. The spindle speed (n) was set to 3000–8000 rpm, increased in increments of 1000 rpm, respectively. The linear feed rate (f) was set at 600 to 2400 mm/min with increments of 100, which was determined by spindle speed (n) and feed per tooth of the cutter based on the formula: f (mm/min) = n (rpm) × fz (mm/tooth) × z (number of tooth). Herein, feed per tooth of the cutter was specified at two levels, 0.05 and 0.075 mm/tooth, respectively. For a given spindle speed, the linear feed rate in machining was set at lower and higher rate, respectively. During milling operations, a triaxial vibration sensor was mounted on the spindle housing to measure the acceleration signals of the vibration in the orthogonal directions (X, Y, and Z) simultaneously. For each slot machining, the average value taken from the time domain root mean square (RMS) values of the accelerations were calculated and used to compare the vibration extent of milling under different cutting parameters. After machining tests, the surface roughness (Ra) was measured using white light interferometer (Optical Surface Profiler, Zygo, NewView™ 8000 Series (Zyzo Corporation, Middlefield, CT USA). For each machined slot, roughness values were measured at five equally spaced points along the feeding direction, and then, the average of these values was recorded for subsequent analysis. There are a total of 240 machining conditions defined by the different levels of cutting parameters, including 6 spindle speeds, 2 feed rates, and 20 cutting depths.

2.3. Machined Surface Morphology and Vibration Spectrum

Figure 5 shows the morphologies of machined surfaces and the vibration spectrum of the milling spindle under specific machining conditions, which indicates that the cutting depth with a greater vibration level has a rougher surface. For example, for a cutting depth of 0.7 mm at a speed of 3000 rpm, Ra was measured as 0.494 μm, while it caused a vibration level of 0.035 (g). When the cutting depth was set at 0.6 mm, Ra = 0.580 μm was generated under a spindle speed of 6000 rpm with a vibration level of 0.05 (g). When the cutting depth was set at 1.3 mm, Ra = 0.704 μm was generated with the higher level of vibration of 0.83 (g).

3. Data Analysis Approach

In machining practice, surface roughness and tool vibration are desired objects to be monitored in the machining operation, whereas the cutting parameters are independent variables that have been verified to show different influences on the monitoring target. Therefore, the establishment of the prediction models of surface roughness or tool vibration can help optimize the cutting parameters to achieve a desired surface quality with low tool vibration.

3.1. Multivariable Regression Analysis

Multiple regression analysis is used to determine the dependency of surface roughness on selected machining parameters and vibrations in the machining. Besides the main influences of these variables, the effects of their interactions were included in the analysis.
In the response surface methodology, all independent variables are correlated to the response as
y = ϕ ( x 1 , x 2 , ...... x n ) + ε
where y is the desired model of surface roughness, ϕ is the response surface function to be determined by the independent variables xi, and ε is the statistical error of the measurements. The response surface function can also be defined as a linear combination of several independent variables with their interactions and one dependent variable. An explicit mathematical quadratic form is given by
y = b 0 + i = 1 N b i x i + i = 1 N b ii x i 2 + i j b i b j x i x j + ε i
where bi, bii, and bij, are coefficients of the linear, quadratic, and interaction terms, respectively; xi and xj are input variables; and N is the number of the independent variables.
In this study, the relationship between Ra is correlated to the cutting parameters such as cutting depth (ap), spindle speed (n), and feed rate (f) using a nonlinear quadratic model and power law model, respectively.
R a =   β 0 + β 1 a p + β 2 n + β 3 f + β 4 a p n + β 5 n f + β 6 a p f + β 7 a p f n
R a = β 0 a p   β 1   n   β 2 f   β 3
In the above equation, the influences of individual parameters and the interactions between them on the surface quality are considered. The multiple linear regression analysis is performed to determine the values of the coefficients with the least squares method.

3.2. Artificial Neural Network Model

The artificial neural network (ANN) approach has the capability to learn from an experimental dataset to establish a high nonlinear correlation between surface roughness and input parameters [33]. Because a wide range of cutting parameters were adopted in machining tests, the response surface plot of the roughness against the cutting parameters are expected to show highly nonlinear characteristics. This study, therefore, employed an ANN technique to model and predict the roughness of the machined surface based on cutting parameters. A simple multilayered architecture of a typical ANN is shown in Figure 6.
The network has three layers, namely, input, hidden, and output. The input and output layers are defined as nodes or neurons, and the hidden layer provides the relationship between the input and output layers using different numbers of neurons. The processing neurons in the hidden layer deliver the processed data from the neurons in the input layers to neurons in the output layer. For example, the input data to the neurons in the hidden layer can be characterized by the general form:
x h i d d e n , j = i = 1 n W i j u i + θ j
where Wij is the weight coefficient between the input neurons and hidden neurons, ui is the value of the input, and θj denotes the biases of the hidden neurons. The effectiveness of neural networks models is dependent on various characteristics such as network architecture, activation functions, and training algorithms. In this study, the MLP network was trained with the application of the Broyden–Fletcher–Goldfarb–Shanno (BFGS) method, conjugate gradient, and the steepest descent training algorithm. To realize the best network, the activation functions—linear, exponential, hyperbolic, logistic, and sin—were changed in the hidden and output layers, wherein the hyperbolic function is given by
f ( x ) = e 2 x 1 e 2 x + 1
In addition, the linear function was used as the output layer activation function. In ANN modeling analysis, the input neurons are the cutting depth, spindle speed, feed rate, and vibration level; the output is the surface roughness. A trial-and-error scheme has been used to determine the appropriate number of hidden neurons. Further, the error function was used to determine errors between actual values and calculated values during learning, testing, and validation, which is defined as
E r r o r s = i = 1 N ( y i t i ) 2 ,
where N is the number of dataset in ANN modeling.

3.3. Determination of the Effectiveness of Prediction Models

The effectiveness of the regression models and selected neural networks were evaluated based on root mean square error (RMSE), determination coefficient (R), and mean absolute percentage error (MAPE). These values are determined by
R M S E = ( ( 1 N ) ( i = 1 N | t i y i | 2 ) ) 1 / 2
R 2 = 1 ( i = 1 N ( t i y i ) 2 1 N ( y i ) 2 )
M A P E = i = 1 N ( ( t i y i ) / t i ) × 100 ) N
where t is the target value, y is the predicted value, and N is the number of samples in analysis.

4. Results and Discussions

4.1. Surface Roughness under Different Cutting Parameters

Figure 7 illustrates surface roughness with varying spindle speeds and cutting depths under specific feed of 0.05 and 0.075 mm/tooth, respectively, in which the spindle speed ranges from 3000 to 8000 rpm and cutting depth ranges from 0.1 to 2.0 mm. The response surface graphs indicate that surface roughness is affected to different extents by the combined effect of spindle speed and cutting depth, and by changing the feed rate. Overall, the roughness scatters from 0.5 µm under a lower cutting depth and spindle speed to a higher value of 0.9 µm under a high spindle speed and larger cutting depth. Further, it is noted that cutting depth has an apparent positive influence on surface roughness: increasing the cutting depth increases the roughness of the machined surface. The influence trend is more significant with a correlation coefficient (r ≅ 0.8–0.9) at feed of 0.075 mm/tooth as compared with feed of 0.05 mm/tooth (r ≅ 0.5–0.8). There is no significant relationship between the surface roughness and spindle speed defined in the range from 3000 to 8000 rpm for machining under lower feed per tooth. However, at a higher feed per tooth, the roughness increases with an increase in spindle speed when the cutting depth is greater than 1.0 mm, and the roughness decreases with an increase in spindle speed when machined with a lower depth (<1.0 mm). At a lower feed rate, the roughness increases at a spindle speed from 4000 to 7000 rpm, and then, the roughness decreases at speeds below 4000 rpm or those higher than 8000 rpm.
Figure 8 illustrates the variation of surface roughness under different feed rates and cutting depths. The linear feed rate is expressed in units of mm/min and ranges from 600 to 2400 mm/min, which corresponds to a corresponding spindle speed from 3000 to 8000 rpm and feed of 0.05 and 0.075 mm/tooth. As shown in Figure 8, the surface roughness generated in machining is affected by a change in the combination of the feed rate and cutting depth. Within the entire range of testing data, there is no significant correlation between the surface roughness and the feed rate. However, when machining conditions are confined within the testing conditions (Z > 1.0 mm, F = 1800–2000 mm/min, and S = 6000–8000 rpm), machining vibration apparently increases with an increase in the feed rate, spindle speed, and cutting depth, which shows a significant negative influence on surface equality with a correlation coefficient (r > 0.8). In particular, it is observed that surface roughness scatters in lower ranges when machining is performed using various cutting depths at some critical feed rates such as 900, 1200, and 1500 mm/min, corresponding to spindle speeds of 3000, 4000, and 5000 rpm and the feed of 0.075 mm/tooth.

4.2. Spindle Vibration under Different Cutting Parameters

Figure 9 illustrates the variation of machining vibration with varying cutting parameters under constant feed of 0.05 and 0.075 mm/tooth. The response surface graphs clearly indicate that the vibration level induced in machining is clearly affected by the combined effect spindle speed and cutting depth. Roughly speaking, vibration amplitude increases with an increase in the spindle speed and cutting depth, as found in Figure 9. It is noted that machining with different cutting depths and at a constant feed 0.075 mm/tooth, vibration apparently increases with an increase in the spindle speed from 3000 to 8000 rpm, with a correlation coefficient (r = 0.92–0.96). For machining at a constant feed 0.05 mm/tooth, the correlation between roughness and spindle speed is not significant (r = 0.3–0.66) depending on the cutting depth. In particular, when the cutting depth is greater than 1.6 mm, the vibration level increases with an increasing speed and reaches the maximum value at a spindle speed of 6000 rpm; it then decreases with an increasing speed.
Figure 10 illustrates the variation of the vibration level generated under different feed rates and cutting depths, in which the feed rates range from 600 to 2400 mm/min, corresponding to the spindle speed from 3000 to 8000 rpm and feed of 0.05 and 0.075 mm/tooth. The extent of the effect of feed rate on the vibration varies with a cutting depth in machining. Within the entire testing data, there is no significant correlation between the vibration level and the feed rate. However, as observed in Figure 10, at a lower cutting depth (Z < 0.8 mm), machining vibration is slightly increases with increasing the feed rate, with a correlation coefficient (r = 0.6–0.7). In addition, within the testing conditions (Z > 1.0 mm, F = 1800–2000 mm/min, and S = 6000–8000 rpm), the machining vibration apparently increases with an increase in the feed rate, spindle speed, and cutting depth, which shows a significant influence on vibration (r > 0.8), and therefore a negative influence on the surface equality, as shown in Figure 10.
The effect of machining vibration on surface roughness can be observed from Figure 11, which shows that they are moderately correlated: r = 0.58 and 0.71 for feed of 0.05 and 0.075 mm/tooth, respectively. Evidently, the vibration level induced in machining affects the roughness of the machined surface to a different extent, which depends on the interactive effects of cutting parameters. As illustrated in Figure 9, machining vibrations are relatively lower (< 0.02 g) under a specific combination of feed rate and spindle speed, such as 1200 mm/min and 4000 rpm and 1500 mm/min and 5000 rpm, respectively. Consequently, finer surfaces with less roughness are obtained. However, if the feed rate and spindle speed are 1000 mm/min and 5000 rpm or 1600 mm/min and 8000 rpm, higher level vibrations are generated (>0.03 g) to deteriorate surface precision with high roughness. Therefore, the appropriate selection of the cutting parameters can lessen the vibration in the machining operation to obtain better surface quality.

4.3. Regression Models

4.3.1. Surface Roughness Model Based on Cutting Parameters

The surface roughness (Ra) was determined by the individual cutting parameter, depth of cutting (ap, mm), feed rate (f, mm/min), and spindle speed (n, rpm) in addition to interactive parameters, such as cutting depth and spindle speed. Based on the regression coefficients listed in Table 1, the mathematical model is given by
R a =   0 . 2235 +   9 . 33 × 10 - 5   ×   n   + 0.2963   ×   a p     3 . 6 × 10 - 5 ×   n ×   a p   - 2 . 6   × 10 - 4 ×   a p   × f     - 3 . 48 × 10 - 8   ×   n   ×   f + 4 . 74 × 10 - 8   ×   a p   ×   n   × f  
In Table 2, the R-square and adjusted R-square are around 0.67, implying that the predicted values are close to the measurements, as shown in Figure 12. Further, the p-value of each input variable and their interactions against surface roughness are far less than 0.05, indicating all machining parameters have apparent influences on the roughness of the machined surface. The average percentage of prediction accuracy for all testing data is ~90.3% with an RMSE of 7.57%, indicating that the roughness prediction model is well fitted with the cutting parameters defined in wide ranges.

4.3.2. Vibration Model Based on Cutting Parameters

Using the regression coefficients in Table 3, the vibration level induced in the machining can be related to the cutting parameters in terms of the following form.
V b =   - 5 . 18 × 10 - 3 +   4 . 29 × 10 - 6   ×   n   + 2.60 × 10 - 3 ×   a p + 3 . 21 × 10 - 6 ×   a p ×   n   - 6 . 3   × 10 - 6 ×   a p × f   - 4 . 2 × 10 - 10   ×   n   ×   f   - 2 . 6 × 10 - 10   ×   a p   ×   n   × f  
As listed in Table 3, the p-value of spindle speed and its interaction with cutting depth are far less than 0.05, which demonstrates the significant influences on the vibration level of the machining system in the modeling of machining vibration. Figure 8 shows that the predicted values are in good agreement with the measured values. According to Table 2, there is a significant correlation between the predicted and measured values, with R-square and adjusted R-square of ~0.80. The average percentage of prediction accuracy for all testing data is about 86.1% with an RMSE of 4.7%. This indicates that machining vibration can be appropriately estimated from the cutting parameters by using this model.

4.3.3. Surface Roughness Model Based on Cutting Parameters with Machining Vibration

In this case, the machining vibration was incorporated with cutting parameters in regression analysis to derive the mathematical model for estimating surface roughness. Based on the regression coefficients in Table 4, Ra is expressed as
R a =   0 . 225 +   9 . 17 × 10 - 5   ×   n   + 0.295 × a p   -   3 . 710 - 5 × a p ×   n - 2 . 6   × 10 - 4 ×   a p   × f   - 3 . 3 × 10 - 8   ×   n   ×   f + 4 . 75 × 10 - 8   ×   a p   ×   n   × f + 0 . 372 ×   V b
In this case, the determination coefficients (i.e., R-square and adjusted R-square) between the predicted values and measured values are around 0.67. It is found that the input variables associated with the cutting parameters have significant influence on surface roughness, with a small p-value < 0.05; however, the effect of machining vibration is insignificant. The average percentage of prediction accuracy for all testing data is ~90.05% with an RMSE of 7.57%, and this shows that the surface roughness can also be predicted with good accuracy based on the cutting parameters and the measured vibration level in machining.
In addition, the surface roughness was also modeled by power law model, as follows.
(1)
Surface roughness model based on cutting parameters
R a =   0 . 04552 ( a p   0 . 152955 ×   n   0 . 636362 ×   f   - 0 . 40132 )
(2)
Surface roughness model based on cutting parameters with machining vibration
R a =   0 . 09804 ( a p   0 . 136115 ×   n   0 . 543685 ×   f   - 0 . 36599 ×   V B   0 . 0606 )
In Table 2, the R-square and adjusted R-square for the two power law models are ~0.55 and the average percentage of prediction accuracy is ~88% with an RMSE of 8.87%. Comparisons of the statistical parameters clearly indicate that polynomial models show better prediction performance in modeling the surface roughness than power law models.

4.4. Neural Network Analysis

In the neural network analysis, data collected from machining tests were divided into three groups, in which 70% of datasets are randomly selected for neural network training, 15% for testing, and the remaining 15% for validation. The architecture of the network includes one input layer, one hidden layer, and one output layer. The ANN modeling was conducted using multi-layered perception (MLP) by Statistica Neural Networks software [40]. The prediction models of surface roughness were first created based on the cutting parameters that include spindle speed, feed rate, and axial depth of cutting as neurons in input layers. Then, the vibration level of machining was included in the input layer to show the effect of spindle vibration on the machined quality. The surface roughness and vibration amplitude can be the output neuron to be determined in the output layer. Other network parameters, such as learning rate, number of neurons in the hidden layer, iteration times, and error function, are obtained by trial and error.
After many attempts, different ANN models are selected for comparison by observing the best ANN performance and the correlation coefficient. In this case, four models with better performance were selected, as listed in Table 5. The ANN models are labeled with the number of neurons in each layer, and the number of neurons in the hidden layer is optimized. For example, model MLP 3-12-1 has 1, 3, and 12 and neurons in the output, input, and hidden layers, respectively. The models with four input neurons—MLP 4-15-1 and MLP 4-22-1—were optimized with 15 and 22 neurons in the hidden layer, respectively. Further, Table 5 shows the sensitivity level of constructed ANN input parameters. The larger the value, the less influence this parameter has on the output parameter; conversely, the smaller the value, the greater is the influence. It is found that in models MLP4-15-1 and MLP 4-22-1 with four input variables (three cutting parameters and machining vibration), the spindle speed has the largest sensitivity values among the parameters.
The statistical values for the ANN model, correlation coefficient (R), RMSE, and MAPE are used as the basis for determining the performance of the neural network, as summarized in Table 6. The value of R represents the agreement extent between the predicted values and measured values. The values of R for the models MLP 3-12-1 and MLP 3-13-1 within the training, validation, and testing data are in the range 0.9285–0.9693. For neural models with an additional variable (machining vibration), higher values of R are found in the range of 0.9611 to 0.9785. Figure 13 shows the comparison of measured and predicted data of the surface roughness for all data, which indicate that high agreements of the prediction results with a correlation coefficient are achieved by neural network models.
For the ANN models MLP 3-12-1 and MLP 3-13-1, which were derived from cutting parameters only, the average percentage prediction accuracy of all datasets is approximately 94.9% and 95.4%, respectively. Both models have RMSE values of 4.0%. Although for models MLP 4-15-1 and MLP 4-22-1—which were modeled considering the effect of machining vibration—the average percentage prediction accuracy of all datasets is approximately 96.2% and 96.1%, respectively, and the RMSE values is ~3.0%. The comparison of the performance of four models indicates that surface roughness can be well predicted based on the proposed ANN models. Further comparisons of the RMSE and MAPE values listed in Table 6 indicate that the prediction accuracy can be increased if the spindle vibration in machining was also fed in the prediction models (MLP 4-15-1 and MLP 4-22-1), which have less RMSE values compared with the models based on only the three cutting parameters. It is observed that among the presented neural network models, the model (MLP 4-15-1) with four variables in the input layer and 15 neurons in the hidden layer shows better performance in the predictions of the surface roughness for all testing data as compared with other models.
Further, in comparison with the regression models, the neural network modeling based on cutting parameters with machining vibration shows better accuracy in predicting machined surface quality.

4.5. Validation of the Models

Previous models with better performances were selected for further validation with comparisons of the measurements and prediction of the surface roughness through independent machining tests. The machining tests were conducted with the same tooling conditions on the milling machine used in the previous tests. The details of the cutting parameters, measured surface roughness, and the predicted values are listed in Table 7. The vibration levels assessed in the machining and the surface morphologies of the workpieces are illustrated in Figure 14.
The statistical values of multiple regression models (#1 and #3) and the ANN models (MLP 3-13-1 and MLP 4-15-1) are presented in Table 8 for performance comparison; they are evaluated based on correlation coefficients, RMSE, and MAPE between the measured and predicted roughness values. As listed in Table 8, the ANN models show better prediction ability and accuracy than the regression models. In particular, the ANN model MLP 4-15-1 predicts the surface roughness with more than 93% accuracy and the least values of RMSE (4.89%) and MAPE (6.86%). This validation clearly indicates that the machining vibration plays a crucial role in affecting the surface quality of the workpiece in the milling operation. The inclusion of the machining vibration as the input variable in the modeling of the surface roughness indeed enhances the prediction performance. As a whole, the ANN model demonstrates superior performance in the prediction of the surface roughness of machined parts when compared with conventional models.

4.6. Contour Surface Milling Test

To illustrate the effectiveness of the presented model in predicting surface roughness in machining process, another milling test was conducted for part contour surface, as shown in Figure 15. The machining the part contour was carried out using 4-tooth end mill with diameter of 10 mm under the following cutting parameters; cutting depth 1.0 mm, spindle speed 6000 rpm, and feed rate 1800 mm/min. The vibrations of spindle tool along the milling path were assessed using the accelerometer mounted on the spindle housing. Surface roughness at specific points was measured, respectively, as listed in Table 9. It is found that the surface roughness at different point scatters from 0.526 to 0.584 μm, with mean value and deviation (0.5528 ± 0.0249), and the vibration level induced in machining also changes with the feeding of cutter with mean value and deviation (0.024467 ± 0.002817). Experimental results indicate that vibration of spindle tool is one of the factors contributing the variation of the surface roughness at different points although machined under the same cutting conditions. The surface roughness at the selected points can also be predicted by ANN model, in which the vibration level along with cutting parameters are fed in prediction model. The average prediction accuracy of the surface roughness by ANN model MLP 4-15-1 is ~96% compared with the measured values. The validation tests clearly verify the superior performance of the ANN models in predicting the surface roughness in end milling operation. This can further be used as the prototype to develop on-line surface roughness recognition system in future work, as shown in Figure 16. Machining vibration assessed from accelerometer can be displayed in different ways such as the time domain with vibration level in RMS or frequency domain with vibration level as function of frequency. Besides, mathematical models derived from regression analysis or ANN model can be implemented in system for predicting the surface roughness in process.

5. Conclusions

This study presents the prediction models for estimating the surface roughness of machined parts under various cutting conditions from low-speed to high-speed stable machining. The prediction modes were developed using multiple regression analysis and an ANN modeling approach. According to the analyzed results, the following conclusions were drawn.
  • The response surface graphs indicate that the surface roughness and machining vibration level are affected to different extents by the combined effect of the spindle speed and cutting depth. Overall, roughness scatters at lower values under a lower cutting depth and spindle speed. Further, vibration amplitude increases with an increase in spindle speed and cutting depth; in particular, vibration apparently increases with an increase in the spindle speed from 3000 to 8000 rpm, with a correlation coefficient (R = 0.92–0.96). Overall within the whole testing conditions, the influence of feed rate on machining vibration and roughness cannot be clearly demonstrated. However, current results reveal that for machining with given cutting depth, the lower level of cutting speed and lower feed rate generated lower roughness than the higher speed and fast feed rate. Such interaction effect of spindle speed and feed rate on machining vibration is more significant than on surface roughness.
  • Both the surface roughness and machining vibration can be modeled with nonlinear quadratic forms based on cutting parameters and their interactions via multiple regression analysis.
  • In the ANN modeling of surface roughness, predictive models (MLP 3-12-1 and MLP 3-13-1) based on three cutting parameters—spindle speed, cutting depth, and feed rate—have high correlation coefficients (R ≅ 0.9285 to 0.9693) between the predicted and measured values within training, validation, and testing data. The average percentage prediction accuracy of all datasets is about 94.5%. For neural models (MLP 4-15-1 and MLP 4-22-1) with additional variables (machining vibration), a higher correlation coefficient (R) is found in the range of 0.9611 to 0.9785. The average percentage prediction accuracy of all datasets is about 96.2%.
  • In the final validation of the predictive models through another machining test, the ANN models were found to demonstrate more accurate predictions of surface roughness. Based on the RMSE and MAPE values, the neural model MLP 4-15-1 with four input variables (three cutting parameters and machining vibration) shows a higher average prediction accuracy of 93.14% than that of the model MLP 3-13-1 with three cutting parameters. This result clearly verifies that the prediction accuracy can be increased if the spindle vibration in machining was also fed in the prediction algorithm.
The predictive model can be the base to develop an on-line surface roughness recognition system, in which cutting parameters and spindle tool vibration assessed in machining can be fed into system to estimate the surface roughness in process. Besides, these models can be effectively used to optimize the cutting conditions for rough or finish machining with better surface quality and low machining vibration.

Author Contributions

Y.-C.L. contributed to the experiments with data analysis, interpretation, and manuscript preparation. K.-D.W. and W.-C.S. conducted the experimental measurements and data analysis. P.-K.H. helped with experiments and data collection. J.-P.H. organized the research work and revised the paper. All authors have read and agreed to the published version of the manuscript.

Funding

This research received no external funding.

Acknowledgments

We gratefully acknowledge the support for this work provided by Intelligent Machinery Technology Center, Industrial Technology Research Institute, Taiwan.

Conflicts of Interest

The authors declare no conflicts of interest.

References

  1. Stephenson, D.A.; Agapiou, J.S. Metal. Cutting Theory and Practice; CRC Press: Boca Raton, FL, USA, 2016. [Google Scholar]
  2. Bhogal, S.S.; Sindhu, C.; Dhami, S.S.; Pabla, B.S. Minimization of surface roughness and tool vibration in CNC milling operation. J. Optim. 2015, 2015, 1–13. [Google Scholar] [CrossRef]
  3. Amin, A.N.; Patwari, A.U.; Sharulhazrin, M.S.; Hafizuddin, I. Investigation of effect of chatter amplitude on surface roughness during end milling of medium carbon steel. Proc. 2010 Int. Conf. Ind. Eng. Oper. Manag. 2010, 127–131. [Google Scholar]
  4. Babu, G.P.; Murthy, B.S.N.; Venkatarao, K.; Ratnam, C. Multi-response optimization in orthogonal turn milling by analyzing tool vibration and surface roughness using response surface methodology. Proc. Inst. Mech. Eng. B J. Eng. Manuf. 2017, 231, 2084–2093. [Google Scholar] [CrossRef]
  5. Arizmendi, M.; Campa, F.J.; Fernández, J.; de Lacalle, L.L.; Gil, A.; Bilbao, E.; Lamikiz, A. Model for surface topography prediction in peripheral milling considering tool vibration. CIRP Ann. Manuf. Technol. 2009, 58, 93–96. [Google Scholar] [CrossRef]
  6. David, C.; Sagris, D.; Stergianni, E.; Tsiafis, C.; Tsiafis, I. Experimental analysis of the effect of vibration phenomena on workpiece topomorphy due to cutter runout in end-milling process. Machines 2018, 6, 27. [Google Scholar] [CrossRef] [Green Version]
  7. Zahoor, S.; Mufti, N.A.; Saleem, M.Q.; Mughal, M.P.; Qureshi, M.A.M. Effect of machine tool’s spindle forced vibrations on surface roughness, dimensional accuracy, and tool wear in vertical milling of AISI P20. Int. J. Adv. Manuf. Tech. 2017, 89, 3671–3679. [Google Scholar] [CrossRef]
  8. Qadri, M.O.; Namazi, H. Fractal-based analysis of the relation between surface finish and machine vibration in milling operation. Fluct. Noise Lett. 2020, 19, 2050006. [Google Scholar] [CrossRef]
  9. Bhuiyan, M.S.H.; Choudhury, I.A. Investigation of tool wear and surface finish by analyzing vibration signals in turning Assab-705 steel. Mach. Sci. Technol. 2015, 19, 236–261. [Google Scholar] [CrossRef] [Green Version]
  10. Kiew, C.L.; Brahmananda, A.; Islam, K.T.; Lee, H.N.; Venier, S.A.; Saraar, A.; Namazi, H. Analysis of the relation between fractal structures of machined surface and machine vibration signal in turning operation. Fractals 2020, 28, 2050019. [Google Scholar] [CrossRef]
  11. Asiltürk, I.; Çunkaş, M. Modeling and prediction of surface roughness in turning operations using artificial neural network and multiple regression method. Expert. Syst. Appl. 2011, 38, 5826–5832. [Google Scholar] [CrossRef]
  12. Tseng, T.L.B.; Konada, U.; Kwon, Y.J. A novel approach to predict surface roughness in machining operations using fuzzy set theory. J. Comput. Des. Eng. 2016, 3, 1–13. [Google Scholar] [CrossRef] [Green Version]
  13. Zhang, J.Z.; Chen, J.C.; Kirby, E.D. Surface roughness optimization in an end-milling operation using the Taguchi design method. J. Mater. Process. Technol. 2007, 184, 233–239. [Google Scholar] [CrossRef]
  14. Yang, A.; Han, Y.; Pan, Y.; Xing, H.; Li, J. Optimum surface roughness prediction for titanium alloy by adopting response surface methodology. Results Phys. 2017, 7, 1046–1050. [Google Scholar] [CrossRef]
  15. Vakondios, D.; Kyratsis, P.; Yaldiz, S.; Antoniadis, A. Influence of milling strategy on the surface roughness in ball end milling of the aluminum alloy Al7075-T6. Measurement 2012, 45, 1480–1488. [Google Scholar] [CrossRef]
  16. Benardos, P.G.; Vosniakos, G. Predicting surface roughness in machining: A review. Int. J. Mach. Tools Manuf. 2003, 43, 833–844. [Google Scholar] [CrossRef]
  17. Routara, B.C.; Bandyopadhyay, A.; Sahoo, P. Roughness modeling and optimization in CNC end milling using response surface method: Effect of workpiece material variation. Int. J. Adv. Manuf. Technol. 2009, 40, 1166–1180. [Google Scholar] [CrossRef]
  18. Joshua, O.S.; David, M.O.; Sikiru, I.O. Experimental investigation of cutting parameters on surface roughness prediction during end milling of aluminium 6061 under MQL (Minimum Quantity Lubrication). J. Mech. Eng. Auto. 2015, 5, 1–13. [Google Scholar]
  19. Okokpujie, I.P.; Okonkwo, U.C. Effects of cutting parameters on surface roughness during end milling of aluminium under minimum quantity lubrication (MQL). Int. J. Sci. Res. 2015, 4, 2937–2942. [Google Scholar]
  20. Shaik, J.H.; Srinivas, J. Optimal selection of operating parameters in end milling of Al-6061 work materials using multi-objective approach. Mech. Adv. Mater. Mod. Process. 2017, 3, 5. [Google Scholar] [CrossRef] [Green Version]
  21. Jeyakumar, S.; Marimuthu, K.; Ramachandran, T. Prediction of vibration amplitude and surface roughness in machining of Al6061 metal matrix composites by response surface methodology. Int. J. Mech. Mater. Eng. 2013, 7, 222–231. [Google Scholar]
  22. Hayajneh, M.T.; Tahat, M.S.; Bluhm, J. A study of the effects of machining parameters on the surface roughness in the end-milling process. Jordan J. Mech. Ind. Eng. 2007, 1, 1–5. [Google Scholar]
  23. Hessainia, Z.; Belbah, A.; Yallese, M.A.; Mabrouki, T.; Rigal, J.F. On the prediction of surface roughness in the hard turning based on cutting parameters and tool vibrations. Measurement 2013, 46, 1671–1681. [Google Scholar] [CrossRef]
  24. Ramesh, S.; Karunamoorthy, L.; Palanikumar, K. Measurement and analysis of surface roughness in turning of aerospace titanium alloy. Measurement 2012, 45, 1266–1276. [Google Scholar] [CrossRef]
  25. Premnath, A.A.; Alwarsamy, T.; Abhinav, T.; Krishnakant, C.A. Surface roughness prediction by response surface methodology in milling of hybrid Aluminium composites. Procedia Eng. 2012, 38, 745–752. [Google Scholar] [CrossRef] [Green Version]
  26. Briceno, J.F.; El-Mounayri, H.; Mukhopadhyay, S. Selecting an artificial neural network for efficient modeling and accurate simulation of the milling process. Int. J. Mach. Tools Manuf. 2002, 42, 663–674. [Google Scholar] [CrossRef]
  27. El-Mounayri, H.; Kishawy, H.; Briceno, J. Optimization of CNC ball end milling: A neural network-based model. J. Mater. Process. Technol. 2005, 166, 50–62. [Google Scholar] [CrossRef]
  28. Liu, Q.; Altintas, Y. On-line monitoring of flank wear in turning with multilayered feed-forward neural network. Int. J. Mach. Tools Manuf. 1999, 39, 1945–1959. [Google Scholar] [CrossRef]
  29. Tsai, Y.H.; Chen, J.C.; Lou, S.J. An in-process surface recognition system based on neural networks in end milling cutting operations. Int. J. Mach. Tools Manuf. 1999, 39, 583–605. [Google Scholar] [CrossRef]
  30. Cus, F.; Zuperl, U. Approach to optimization of cutting conditions by using artificial neural networks. J. Mater. Process. Technol. 2006, 173, 281–290. [Google Scholar] [CrossRef]
  31. Oktem, H.; Erzurumlu, T.; Erzincanli, F. Prediction of minimum surface roughness in end milling mold parts using neural network and genetic algorithm. Mater. Design 2006, 27, 735–744. [Google Scholar] [CrossRef]
  32. Nalbant, M.; Gokkaya, H.; Toktaş, İ. Comparison of regression and artificial neural network models for surface roughness prediction with the cutting parameters in CNC turning. Model. Simul. Eng. 2007, 2007, 1–4. [Google Scholar] [CrossRef] [Green Version]
  33. Zain, A.M.; Haron, H.; Sharif, S. Prediction of surface roughness in the end milling machining using Artificial Neural Network. Expert Syst. Appl. 2010, 37, 1755–1768. [Google Scholar] [CrossRef]
  34. Zagórski, I.; Kulisz, M.; Semeniuk, A.; Malec, A. Artificial neural network modelling of vibration in the milling of AZ91D alloy. Adv. Sci. Technol. Res. J. 2017, 11, 261–269. [Google Scholar] [CrossRef]
  35. Abouelatta, O.B.; Madl, J. Surface roughness prediction based on cutting parameters and tool vibrations in turning operations. J. Mater. Process. Technol. 2001, 118, 269–277. [Google Scholar] [CrossRef]
  36. Chen, Y.; Sun, R.; Gao, Y.; Leopold, J. A nested-ANN prediction model for surface roughness considering the effects of cutting forces and tool vibrations. Measurement 2017, 98, 25–34. [Google Scholar] [CrossRef]
  37. Mukherjee, I.; Ray, P.K. A review of optimization techniques in metal cutting processes. Comput. Ind. Eng. 2006, 50, 15–34. [Google Scholar] [CrossRef]
  38. Munoa, J.; Beudaert, X.; Dombovari, Z.; Altintas, Y.; Budak, E.; Brecher, C.; Stepan, G. Chatter suppression techniques in metal cutting. CIRP Ann. Manuf. Technol. 2016, 65, 785–808. [Google Scholar] [CrossRef]
  39. Altintas, Y.; Budak, E. Analytical prediction of stability lobes in milling. CIRP Ann. Manuf. Technol. 1995, 4, 357–362. [Google Scholar] [CrossRef]
  40. TIBCO Data Science. Available online: http://www.statsoft.com/Products/STATISTICA/Automated-Neural-Networks (accessed on 11 November 2018).
Figure 1. Experimental configurations of vibration test of milling spindle with and without tool holder/cutter. (a) Measurement at tool tip. (b) Measurement at spindle nose.
Applsci 10 03941 g001
Figure 2. Frequency response function (FRF) of the milling cutter. (a) FRF—Dynamic compliance. (b) FRF—Real part.
Applsci 10 03941 g002
Figure 3. Stability lobes diagram in the X direction.
Applsci 10 03941 g003
Figure 4. Machining test and workpiece.
Applsci 10 03941 g004
Figure 5. Morphologies of the machined surfaces under different cutting parameters.
Applsci 10 03941 g005
Figure 6. Multilayered architecture of a typical artificial neural network.
Applsci 10 03941 g006
Figure 7. Variation of surface roughness with varying spindle speed and cutting depth at lower and higher feed rate, respectively.
Applsci 10 03941 g007aApplsci 10 03941 g007b
Figure 8. Variation of surface roughness under different feed rates and specific cutting depths.
Applsci 10 03941 g008
Figure 9. Variation of vibration levels with varying spindle speed and cutting depth at lower and higher feed rate, respectively.
Applsci 10 03941 g009
Figure 10. Variation of vibration level under different feed rates and specific cutting depths.
Applsci 10 03941 g010
Figure 11. Correlation between surface roughness and machining vibration level.
Applsci 10 03941 g011
Figure 12. Comparisons of the predicted and measured values: (a) surface roughness and (b) machining vibration.
Applsci 10 03941 g012
Figure 13. Comparison of the target and output values of the surface roughness for all data.
Applsci 10 03941 g013aApplsci 10 03941 g013b
Figure 14. Morphologies of the machined surfaces under various cutting parameters.
Applsci 10 03941 g014
Figure 15. Contour surface milling sample for verification of predictive model.
Applsci 10 03941 g015
Figure 16. Monitoring system for machining vibration and prediction of surface roughness.
Applsci 10 03941 g016
Table 1. Regression parameters for surface roughness prediction model.
ParametersCoefficientsStandard Deviationsp-Value
Intercept2.235 × 10−14.935 × 1029.459 × 106
Spindle speed (n)9.330 × 1051.530 × 1054.754 × 109
Cutting depth (ap)2.964 × 10−15.391 × 1021.010 × 107
Depth × speed (ap × n)−3.600 × 1051.350 × 107.991 × 103
Depth × feed (ap × f)−2.600 × 1043.830 × 1058.078 × 1011
Feed × speed (f × n)−3.400 × 1085.130 × 1093.956 × 1010
Depth × speed × feed (ap × n × f)4.740 × 1086.650 × 1091.312 × 1011
Table 2. Comparisons of statistical parameters of prediction models.
Prediction ModelRR SquareAdjusted R SquareRMSEMAPE
(a) Polynomial roughness model (Ra)0.826650.683360.675217.57%9.97%
(a) Power-law roughness model (Ra)0.7479940.5594960.553898.75%11.8%
(a) Polynomial Machining vibration (Vb)0.894780.800630.795490.47%13.9%
(b) Polynomial roughness model (Ra)0.826760.683530.673987.57%9.95%
(b) Power-law roughness model (Ra)0.7496390.562040.5548588.76%11.8%
(a) Based on cutting parameters (spindle speed, cutting depth, and feed rate).
(b) Based on cutting parameters and machining vibration.
RMSE: Root mean square error; MAPE: Mean absolute percentage error.
Table 3. Regression parameters of the vibration prediction model.
ParametersCoefficientsStandard Deviationsp-Value
Intercept−5.180 × 1033.105 × 1039.655 × 102
Spindle speed (n)4.290 × 1069.650 × 1071.350 × 105
Cutting depth (ap)2.603 × 1033.392 × 1034.435 × 101
Depth × speed (ap × n)3.210 × 1068.520 × 1072.140 × 104
Depth × feed (ap × f)−6.300 × 1062.410 × 1069.133 × 103
Feed × speed (f × n)−4.200 × 10103.230 × 10101.931 × 101
Depth × speed × feed (ap × n × f)−2.600 × 10104.180 × 10105.371 × 101
Table 4. Regression parameters of the nonlinear polynomial model.
ParametersCoefficientsStandard Deviationsp-Value
Intercept2.254 × 1014.974 × 1029.330 × 106
Spindle speed (n)9.170 × 1051.600 × 1053.080 × 108
Cutting depth (ap)2.954 × 1015.408 × 1021.210 × 107
Depth × speed (ap × n)−3.700 × 1051.400 × 1057.929 × 103
Depth × feed (ap × f)−2.600 × 1043.890 × 1052.190 × 1010
Feed × speed (f × n)−3.300 × 1085.160 × 1095.790 × 1010
Depth × speed × feed (ap × n × f)4.750 × 1086.670 × 1091.360 × 1011
Vibration (Vb)3.721 × 1011.0437.217 × 101
Table 5. Sensitivity level of the input variables of the selected neural network models.
ANN ModelSensitivity Levels
Spindle SpeedFeed RateCutting DepthVibration Level
MLP 3-12-129.2212.7312.13-
MLP 3-13-128.0224.4011.97-
MLP 4-15-171.2216.7112.5831.16
MLP 4-22-161.6827.9415.208.67
Table 6. Statistical values of neural network models.
DatasetTraining DatasetValidation Dataset Testing Dataset
RRMSEMAPERRMSEMAPERRMSEMAPE
ANN ModelANN models based on cutting parameters (three input variables)
MLP 3-12-10.9683.31%4.25%0.9295.82%7.90%0.9324.77%6.86%
MLP 3-13-10.9693.24%4.21%0.9584.31%5.93%0.9474.14%5.91%
ANN models based on cutting parameters and vibration level (four input variables)
MLP 4-15-10.9782.72%3.53%0.9734.02%4.92%0.9762.87%3.96%
MLP 4-22-10.9752.70%3.56%0.9614.13%5.06%0.9763.02%4.35%
R: Correlation coefficients; RMSE: Root mean square error; MAPE: Mean absolute percentage error.
Table 7. Details of the cutting parameters, measured surface roughness, and predicted values for model validation.
Input VariablesMeasured Roughness (µm)Predictions of Surface Roughness
Spindle Speed (rpm)Cutting Depth (mm)Feed Rate (mm/min)Vibration LevelsMultiple Regression ModelArtificial Neural Network Model
Model #1Model #3MLP 3-13-1MLP 4-15-1
Predicted Value (µm)Error (%)Predicted Value (µm)Error (%)Predicted Value (µm)Error (%)Predicted Value (µm)Error (%)
30000.709000.0130.5290.46911.260.47011.090.4838.780.4887.80
30000.809000.0140.5260.4789.220.4799.020.4887.240.4906.83
40001.0012000.0170.5130.5022.240.5022.210.4933.860.4894.69
40001.3012000.0190.5650.5217.760.5217.730.5276.660.49612.25
60000.6018000.0240.580.49414.840.49514.620.5397.050.6033.89
60001.3012000.0380.7040.6813.27%0.6833.040.7628.200.7496.38
80000.9016000.0330.670.7176.980.7156.750.7176.990.74010.50
80001.3016000.0390.6890.79515.350.79315.140.82219.290.76210.53
65001.0013000.0350.5810.66915.090.67015.270.6064.320.5871.03
75001.3522500.0300.7810.67713.280.67713.310.7109.110.7128.87
75001.4522500.0320.7750.7019.560.7019.530.7315.660.7394.63
75001.5522500.0330.7870.7257.930.7257.900.7406.010.7484.99
Average9.73Average9.63Average7.78Average6.86
Table 8. Comparisons of the statistical values of the prediction models.
Model TypeRRMSEMAPE
(a) Regression model #10.81576.91%9.73%
(b) Regression model #30.81726.85%9.63%
(a) ANN MLP 3-13-10.87665.78%7.77%
(b) ANN MLP 4-15-10.90654.89%6.86%
(a) Based on cutting parameters (spindle speed, cutting depth and feed rate). (b) Based on cutting parameters and machining vibration
Table 9. Predictions of surface roughness in end milling process by ANN.
PointsSpindle Speed (rpm)Cutting Depth (mm)Feed Rate (mm/min)Machining Vibration (g)Measured Roughness (μm)Predicted Value (μm)Error
160001.018000.02390.5240.5403.00%
260001.018000.02560.5630.5502.25%
360001.018000.02340.5470.5352.27%
460001.018000.02800.5860.5457.02%
560001.018000.02610.5710.5513.47%
660001.018000.01980.5260.4857.88%
Average0.024460.5530.5344.31%

