Climate-Smart Agro-Hydrological Model for a Large Scale Rice Irrigation Scheme in Malaysia

 ,
,  ,
,
Abstract
1. Introduction
2. Materials and Methods
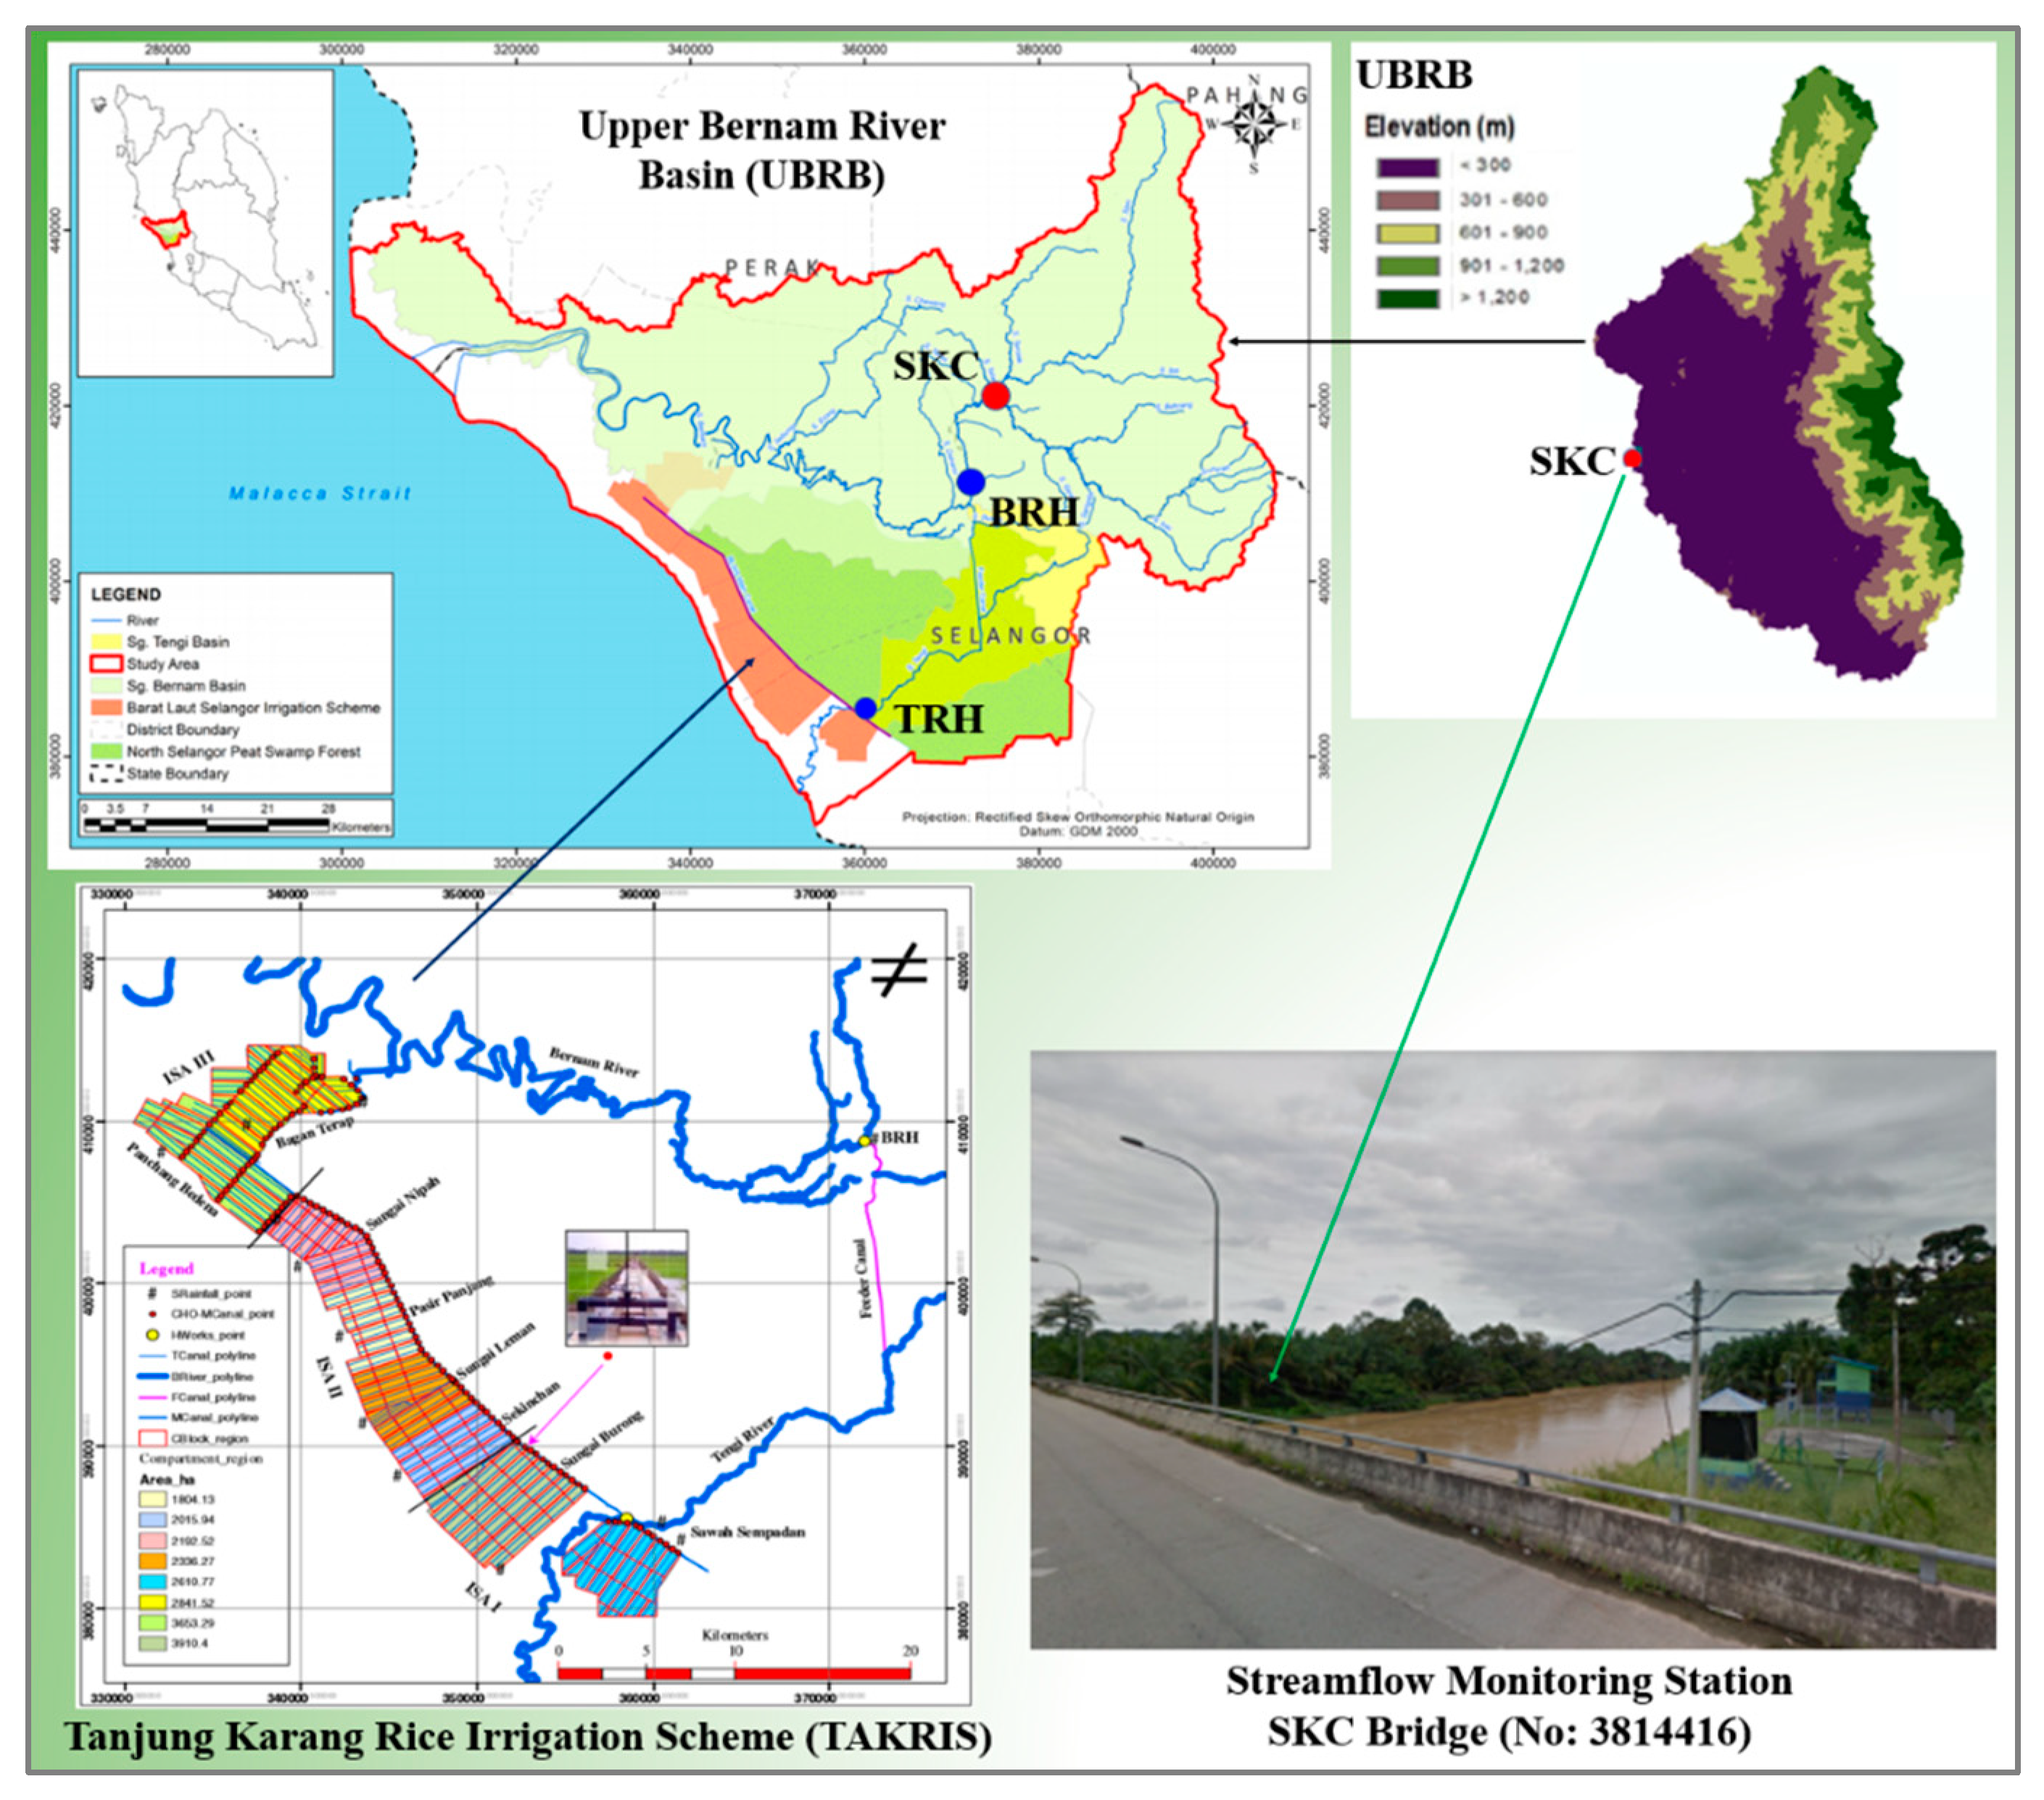
2.1. Study Area
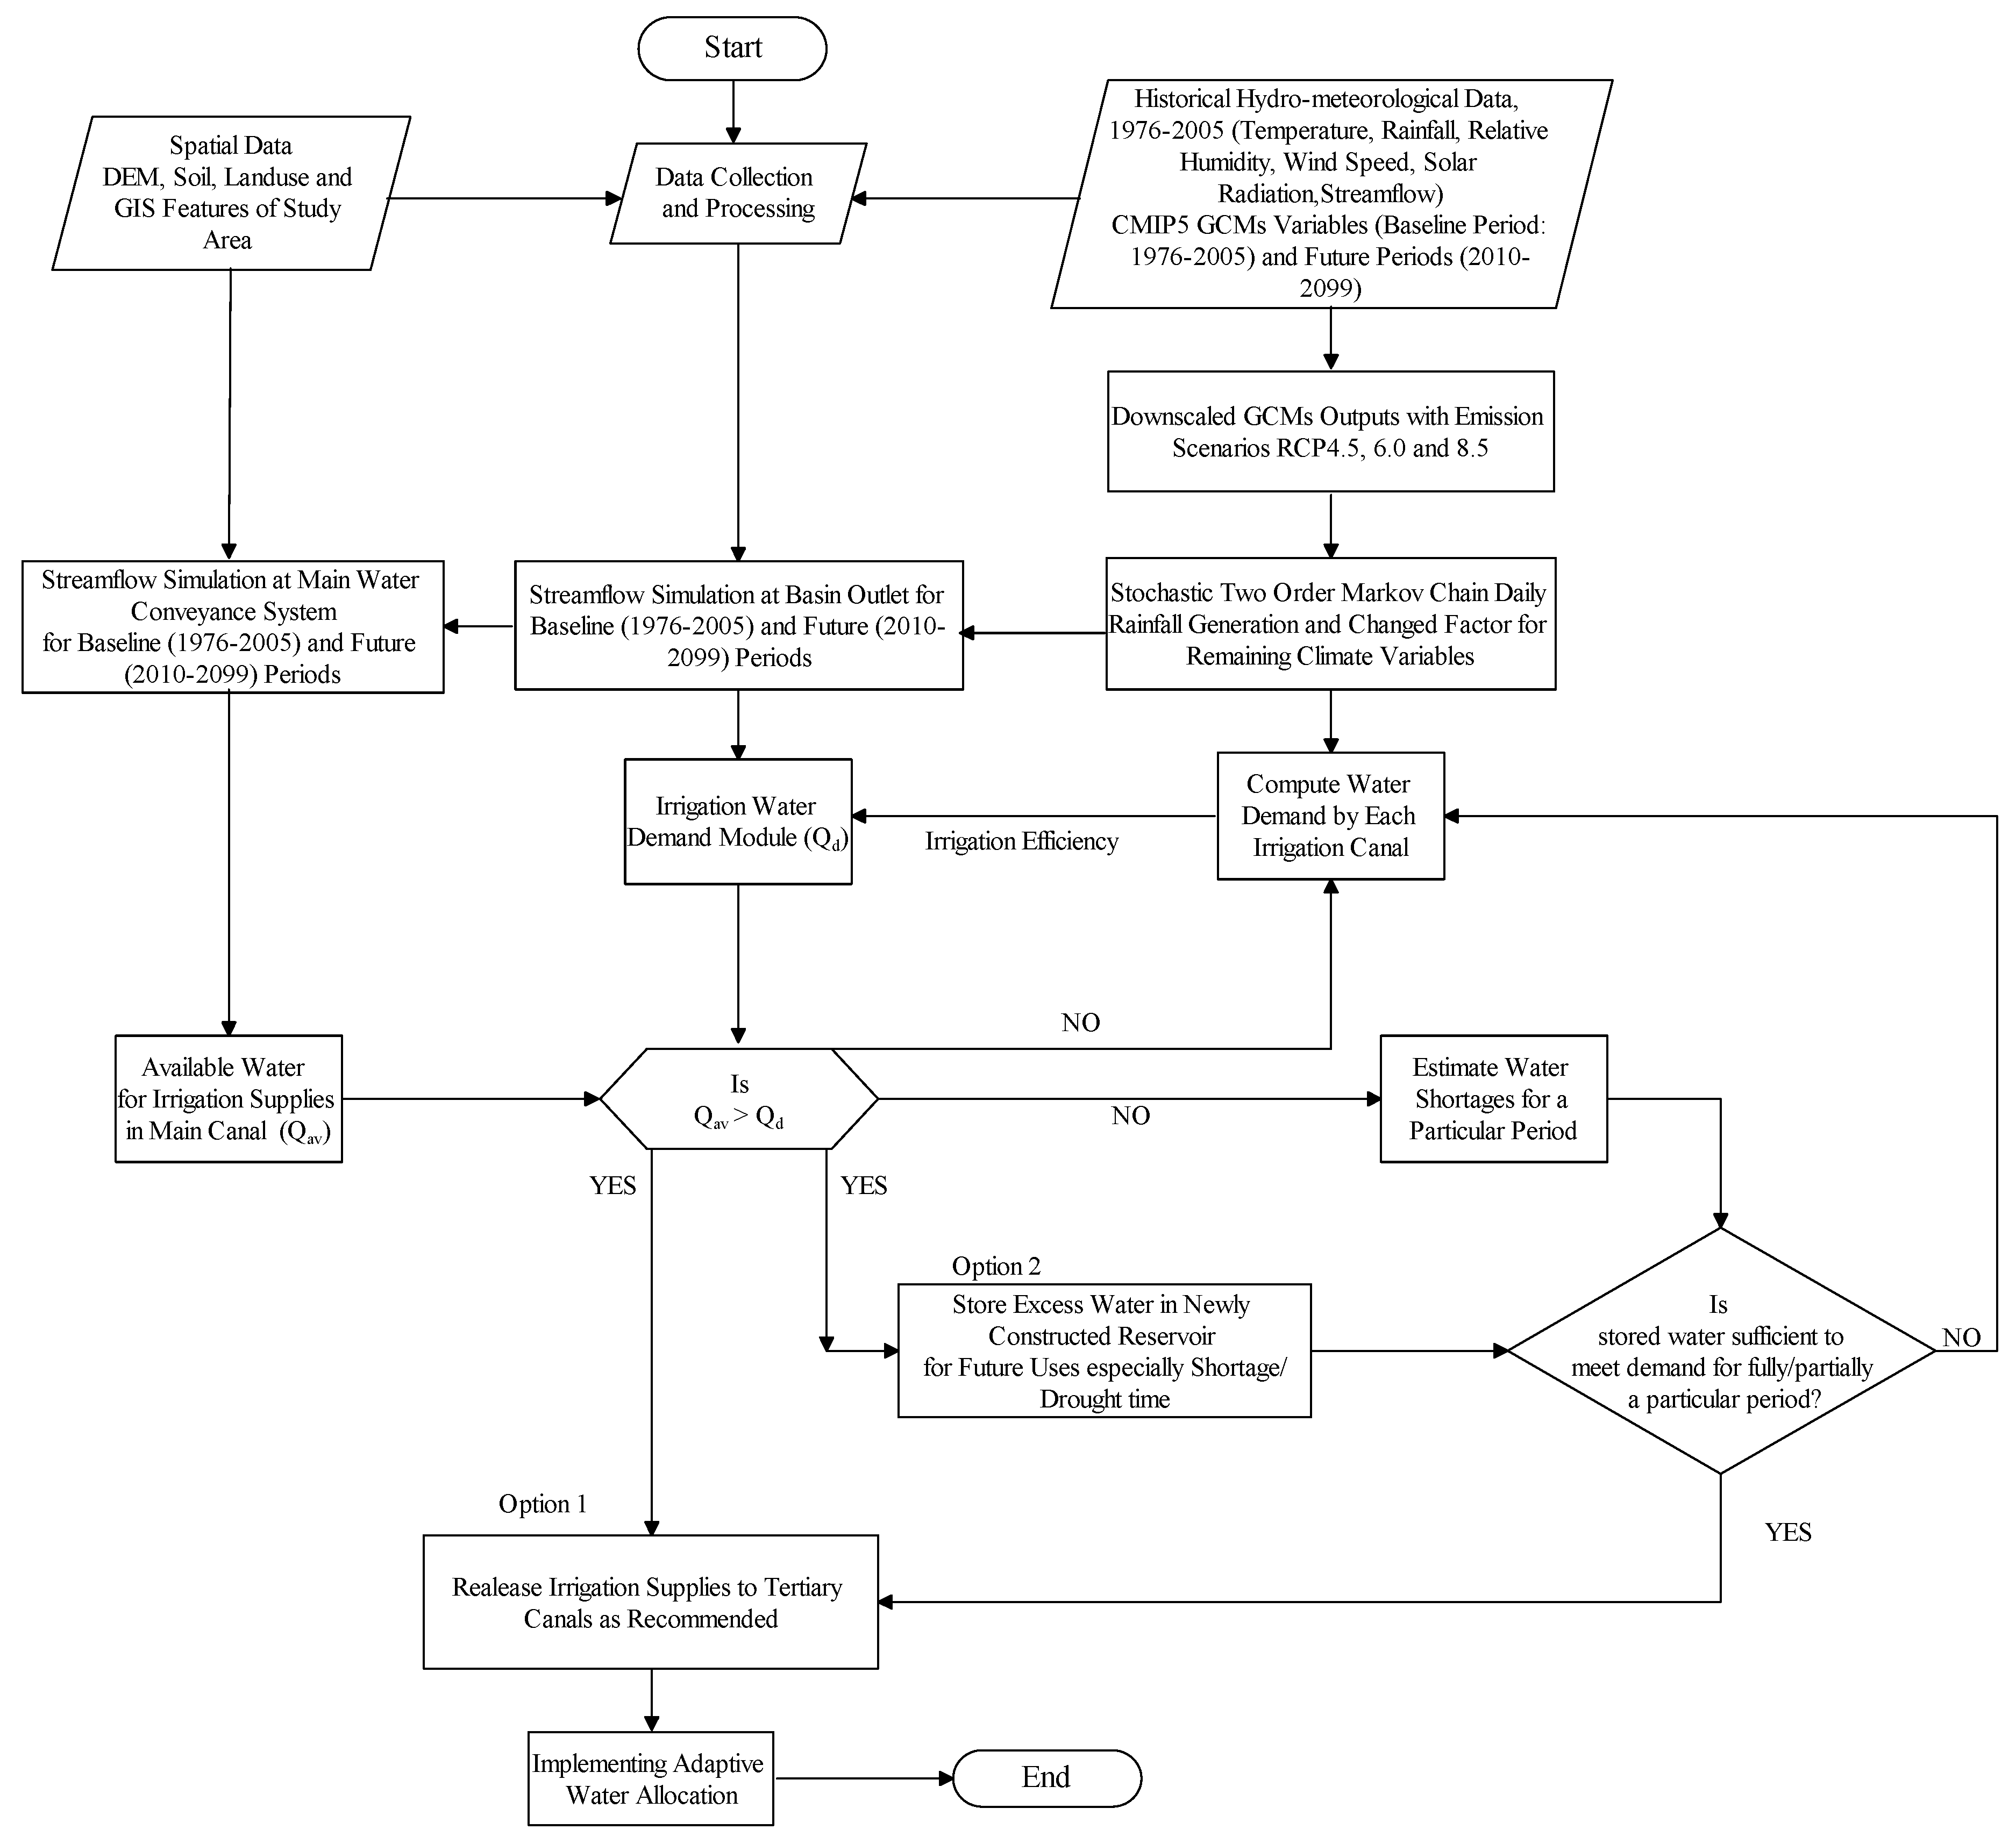
2.2. Methodological Approach
2.3. Downscaling of GCMs Outputs
2.4. Simulation of Future Impacts of Climate Change on Hydrological Processes
2.5. Computation of Available Discharges for Irrigation Supply
2.6. Statistical Evaluation of Models
2.7. Water Demand Estimation
2.8. Flow Analysis for Storage Pond
2.9. Design and Development of Climate-Smart Agro-Hydrological Tool
3. Results and Discussion
3.1. Hydrological Modeling
3.2. Hydraulic Modeling
3.3. Climate-Smart Agro-Hydrological Model Simulation Outputs
3.3.1. Hydro-Meteorological Variables
3.3.2. Temperature Projection
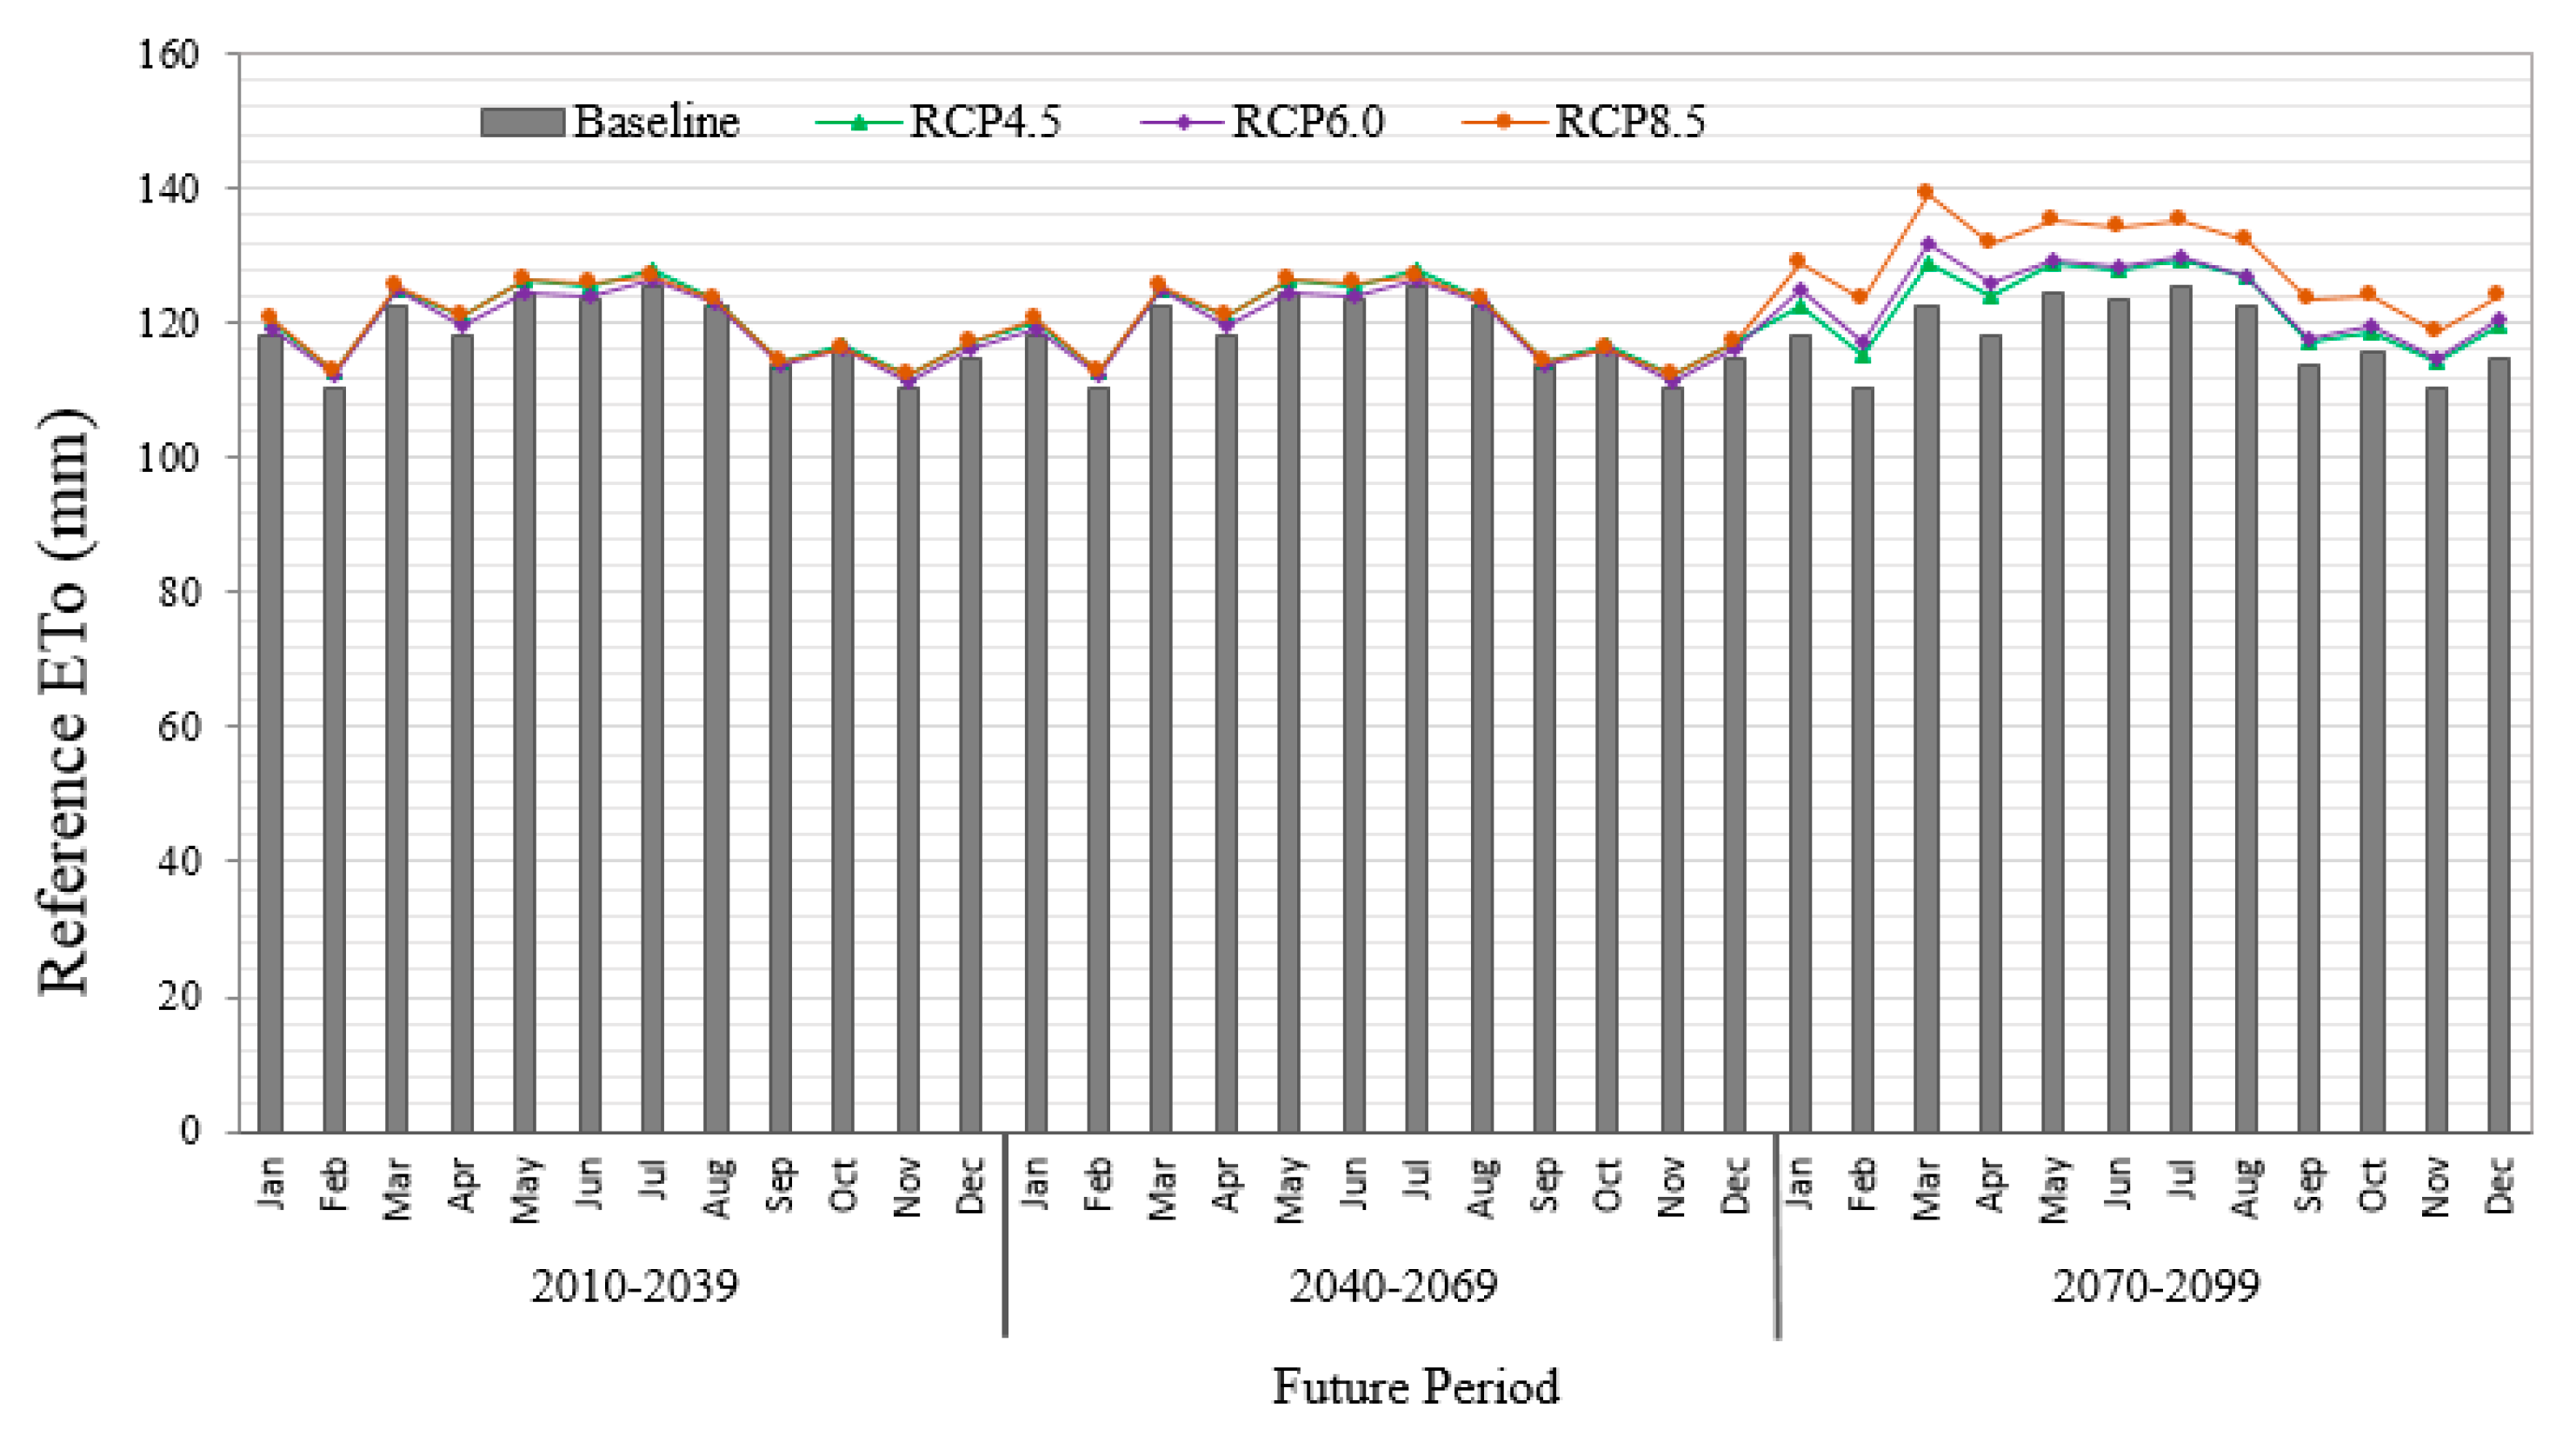
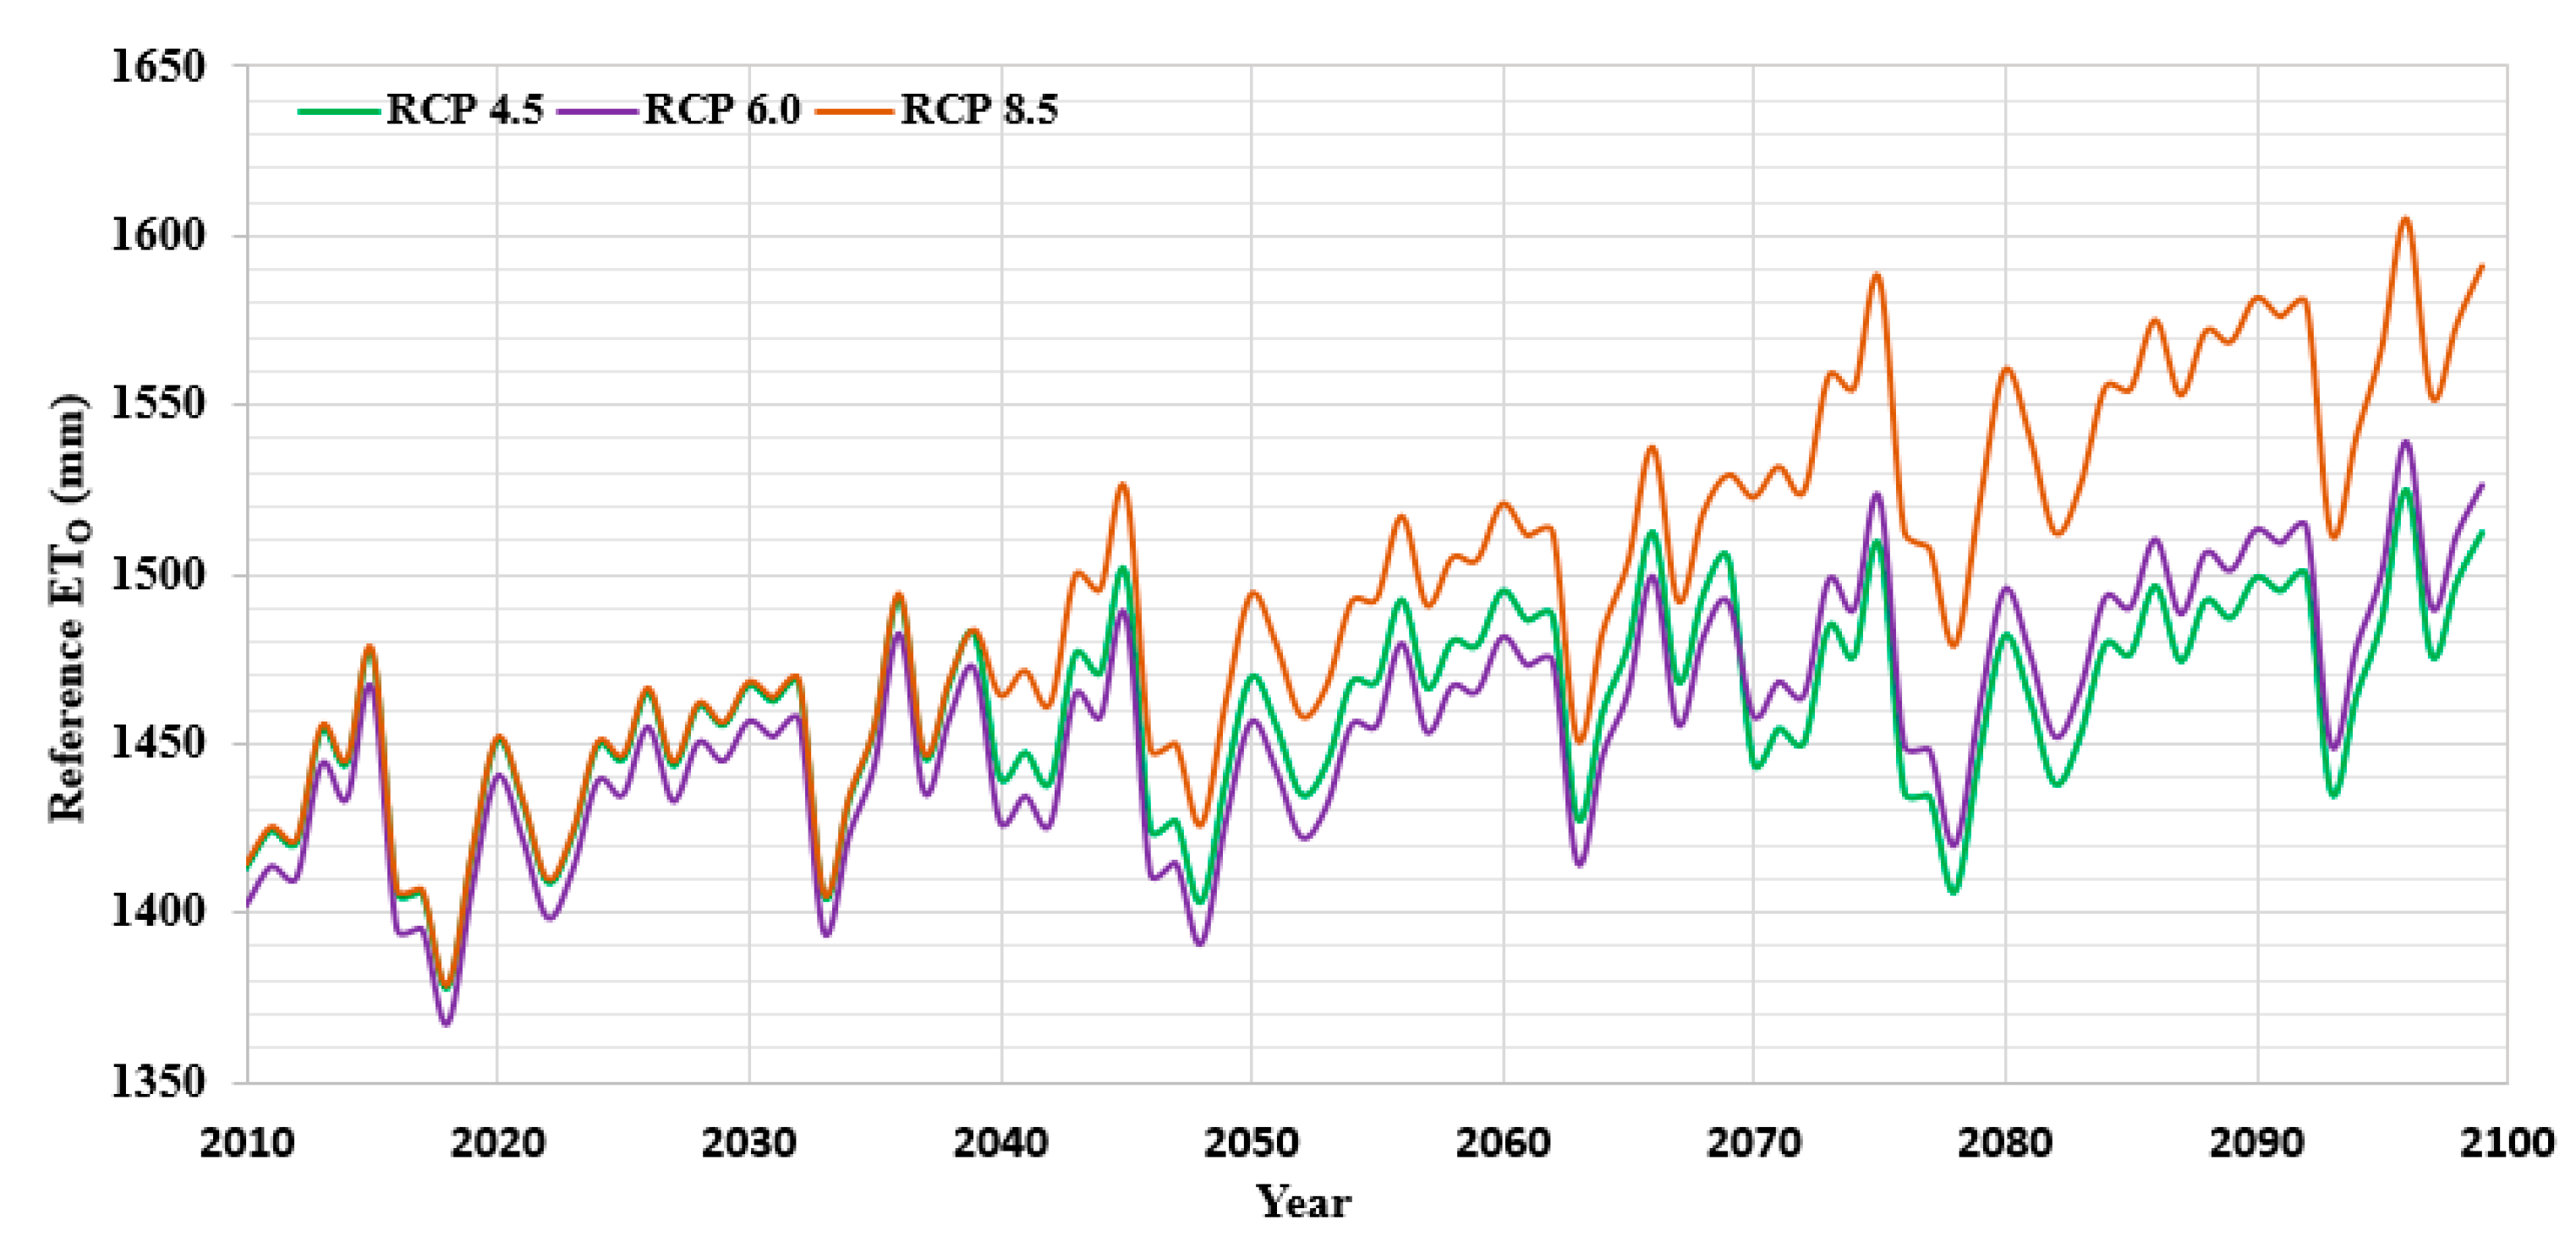
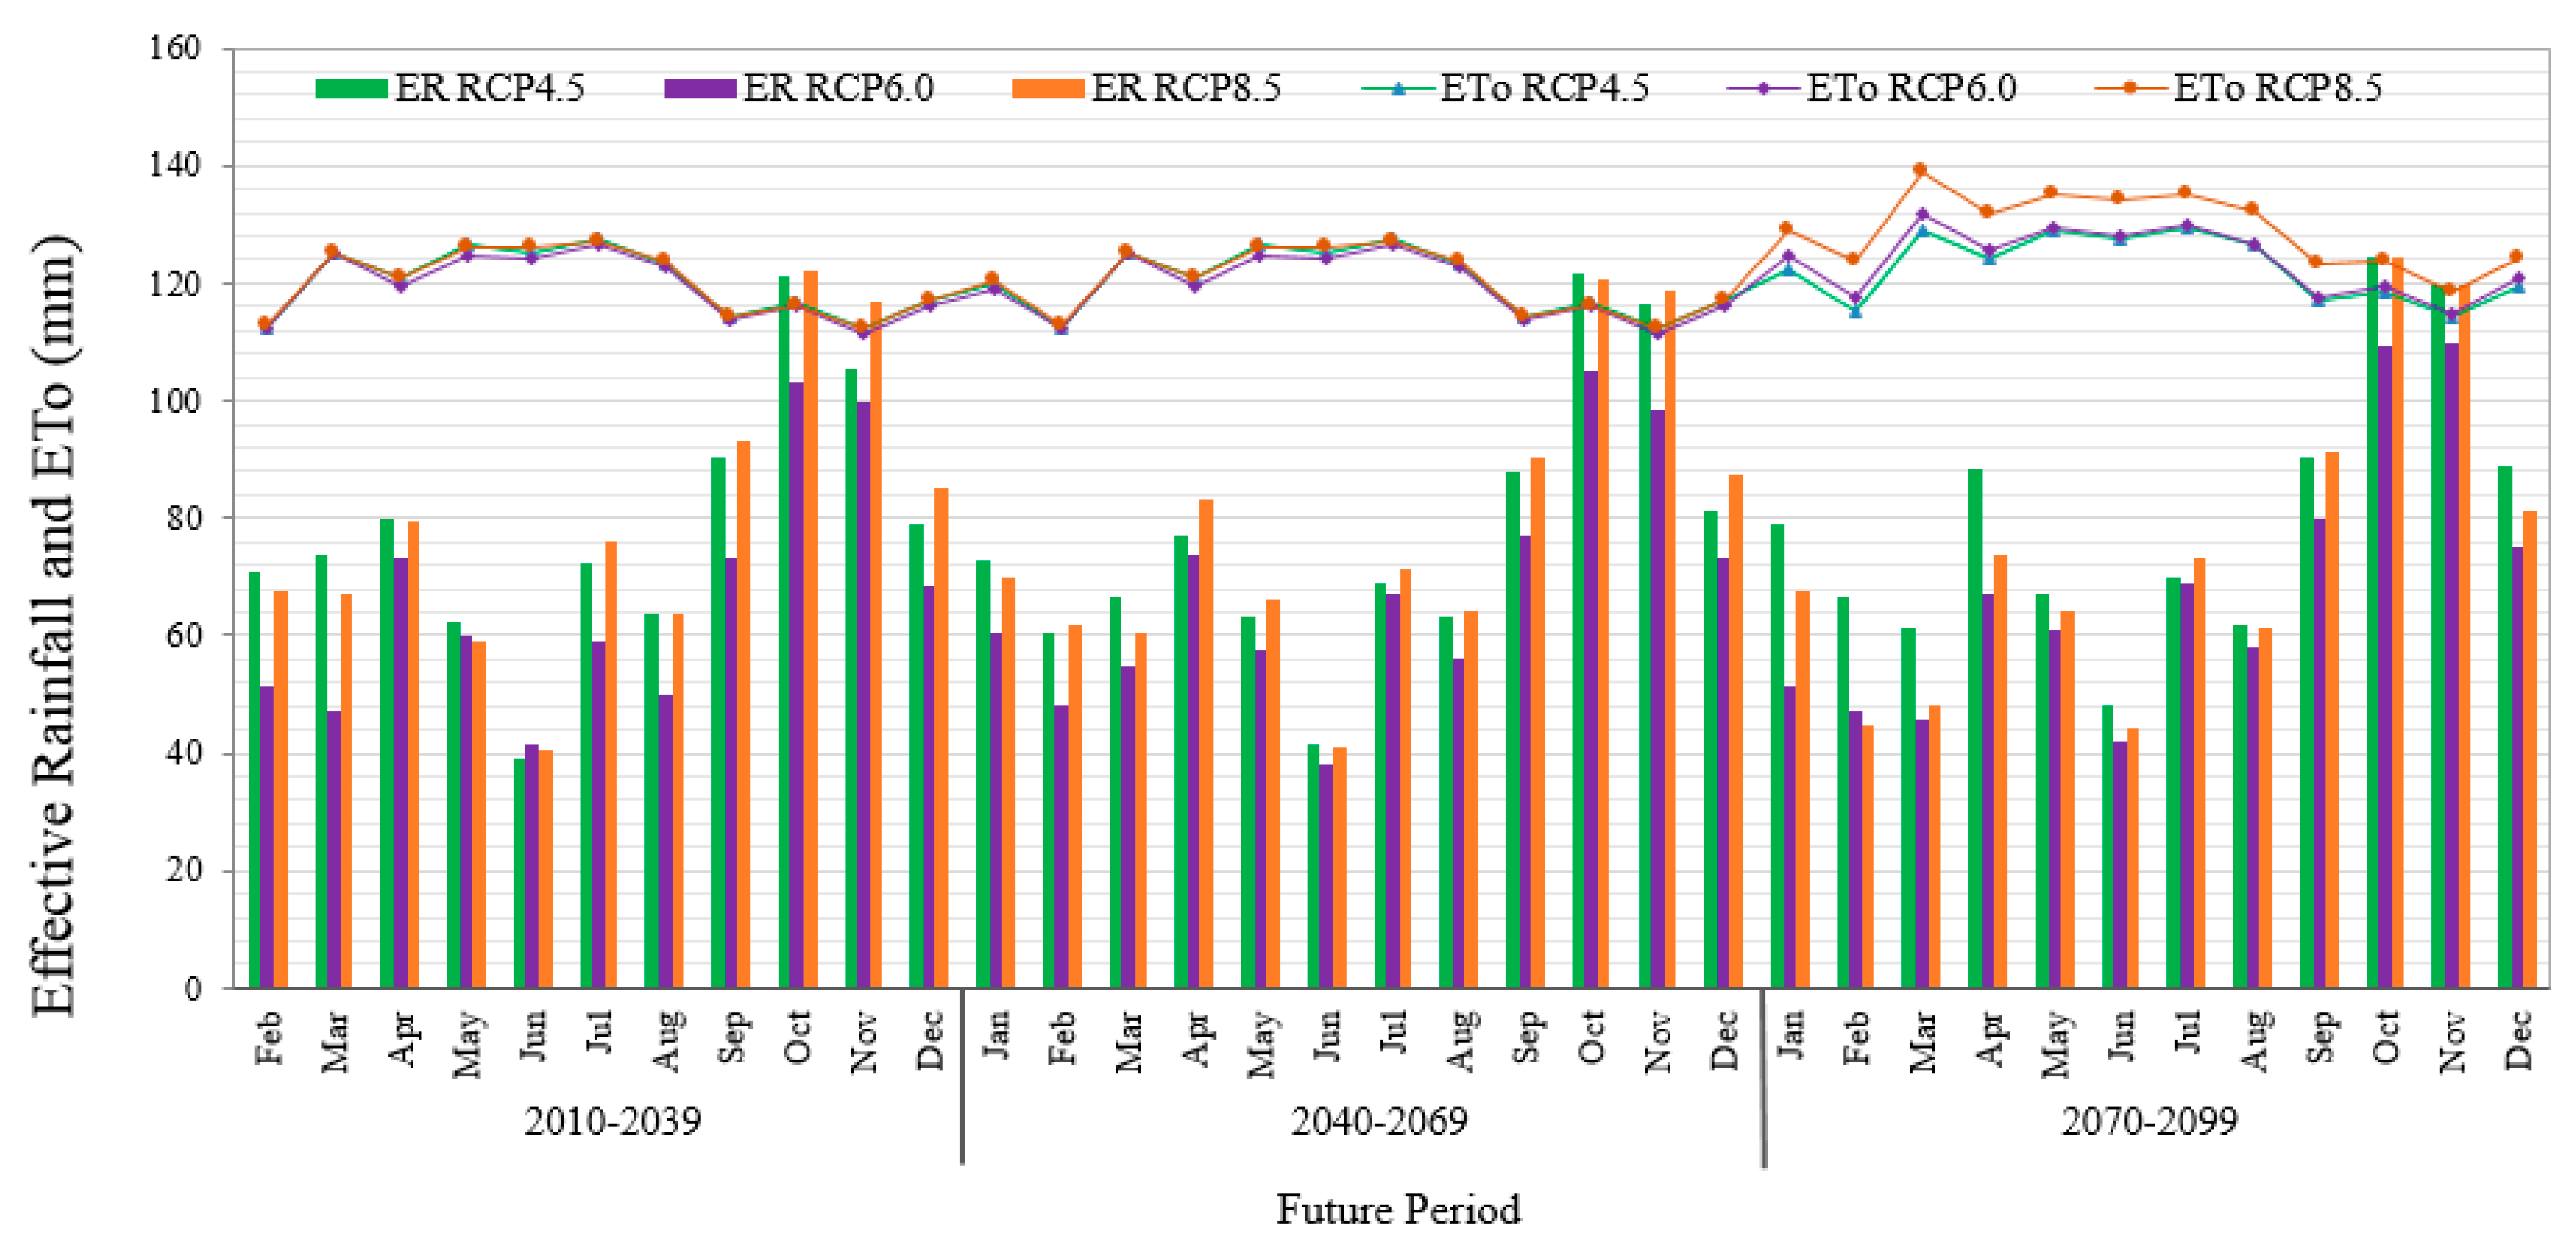
3.3.3. Impact on Potential Evapotranspiration
3.4. Modeling Streamflow under Climate Change Impacts
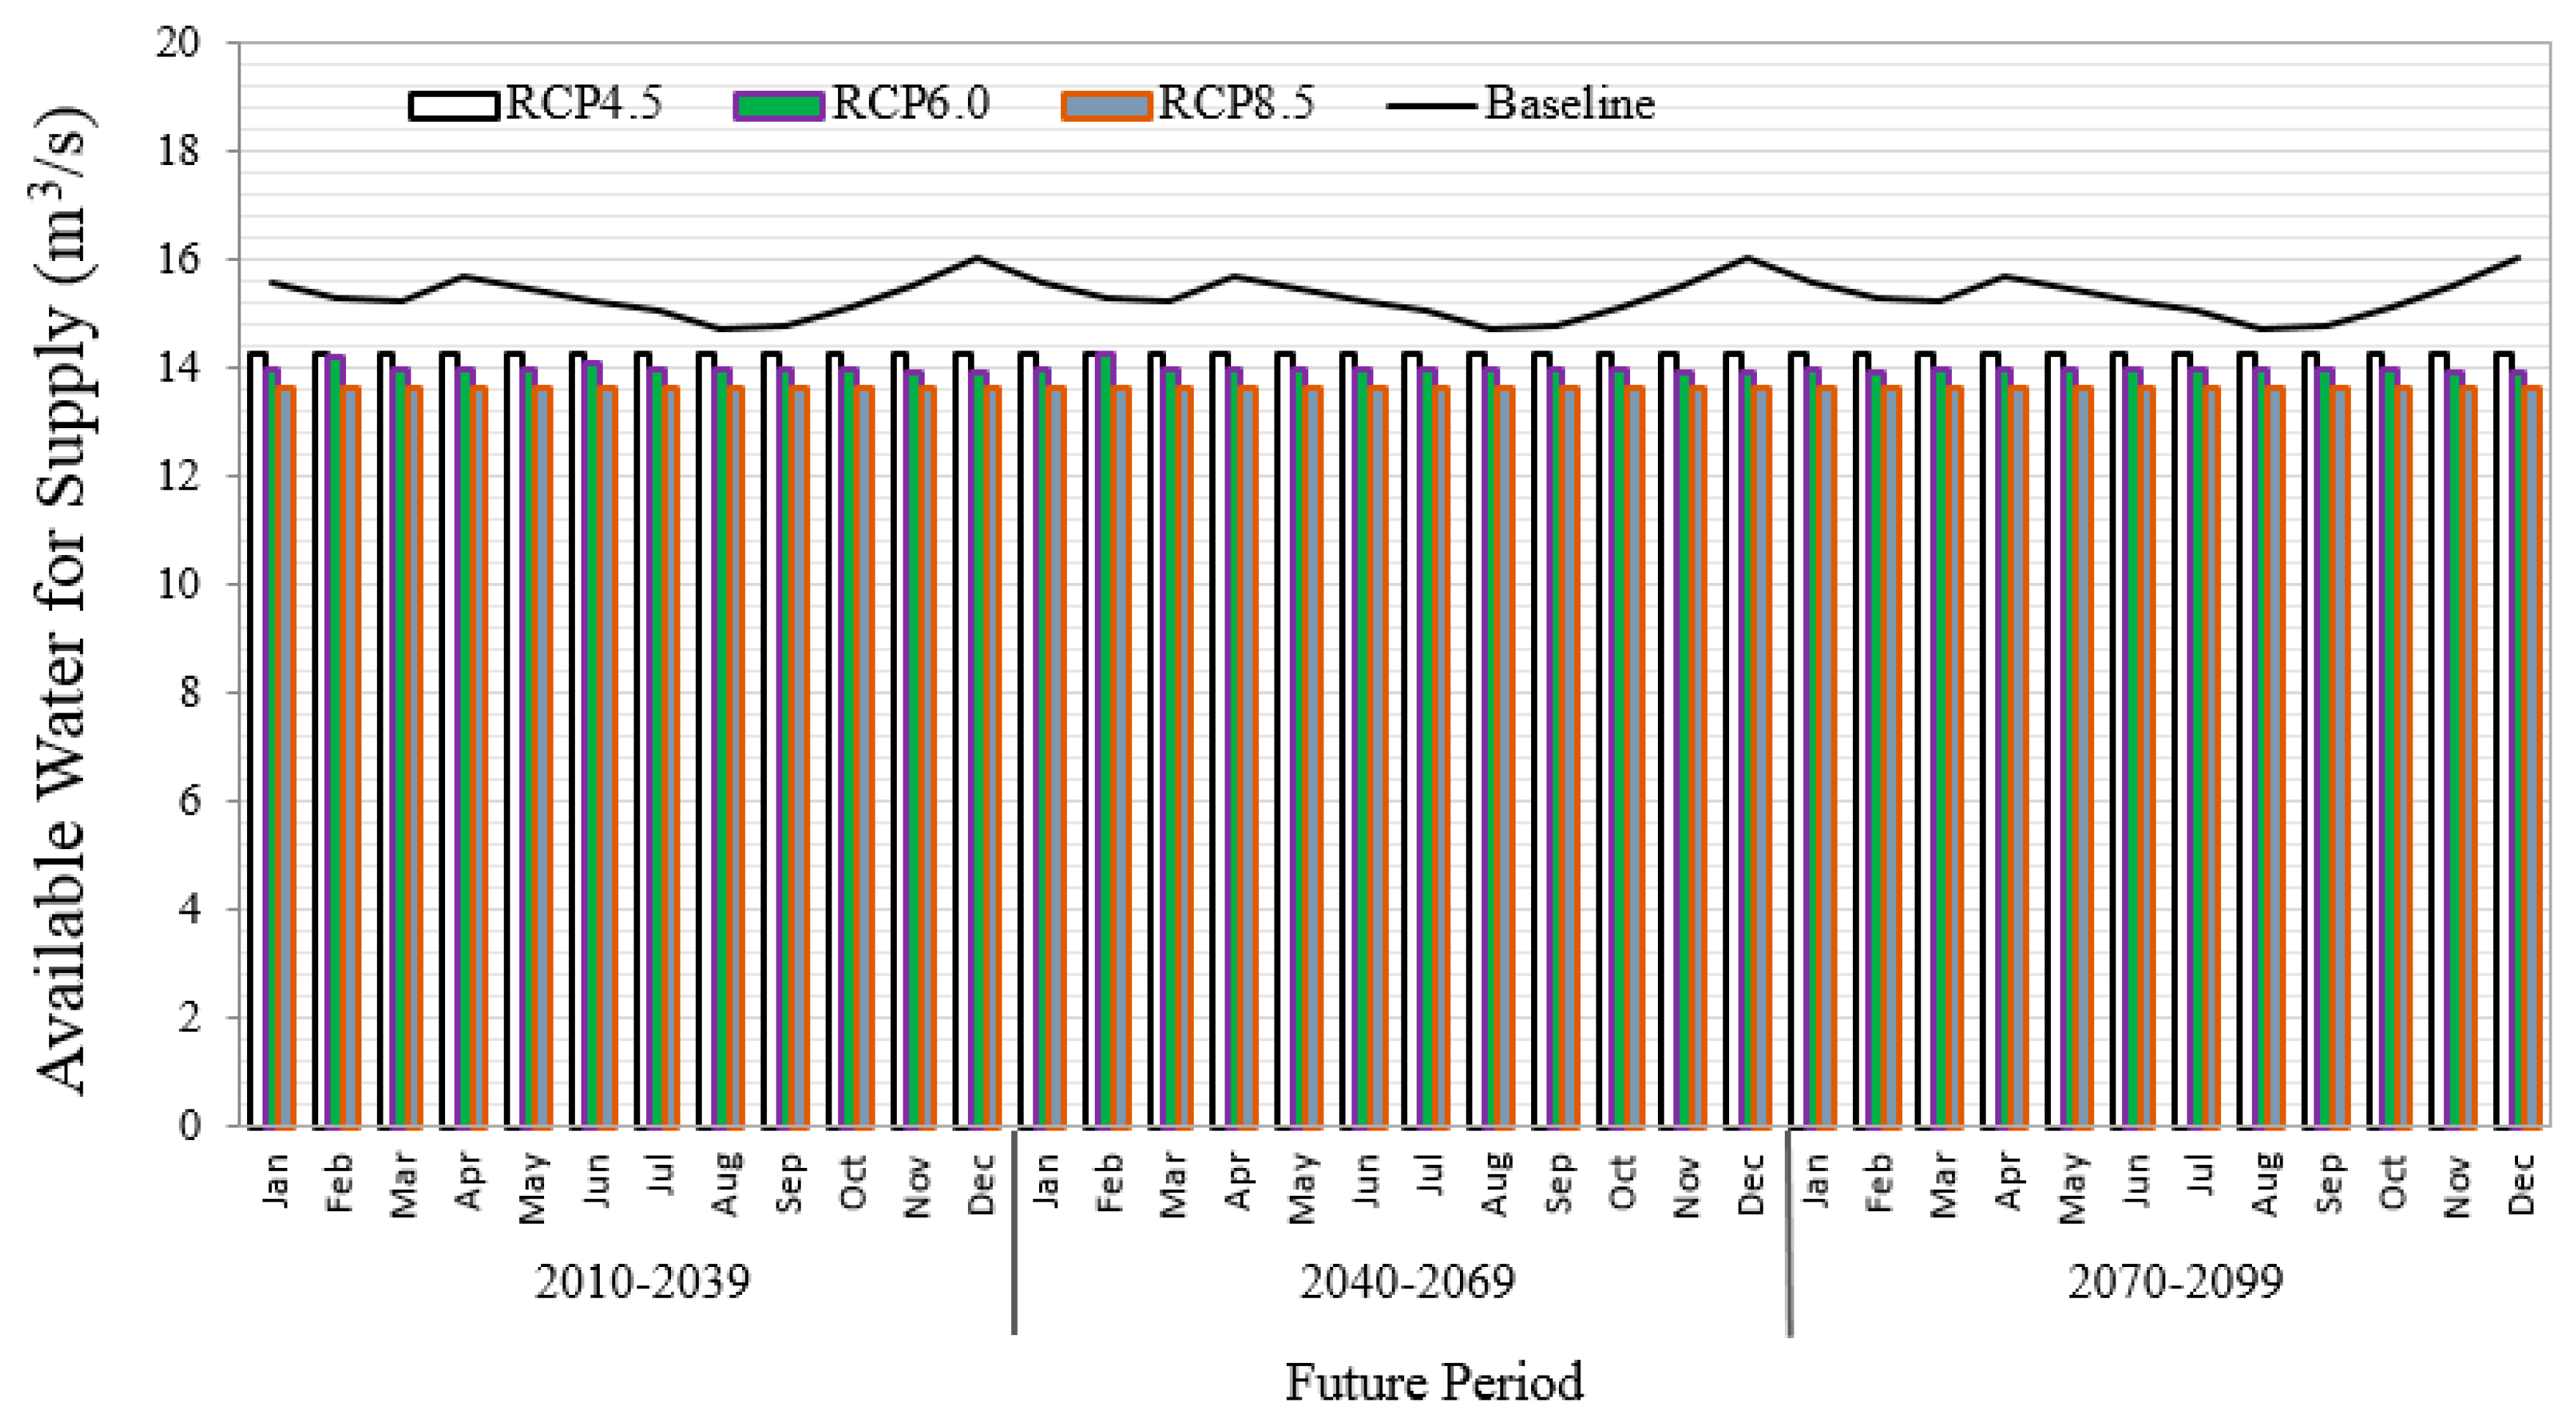
Projection of Available Supply for Irrigation
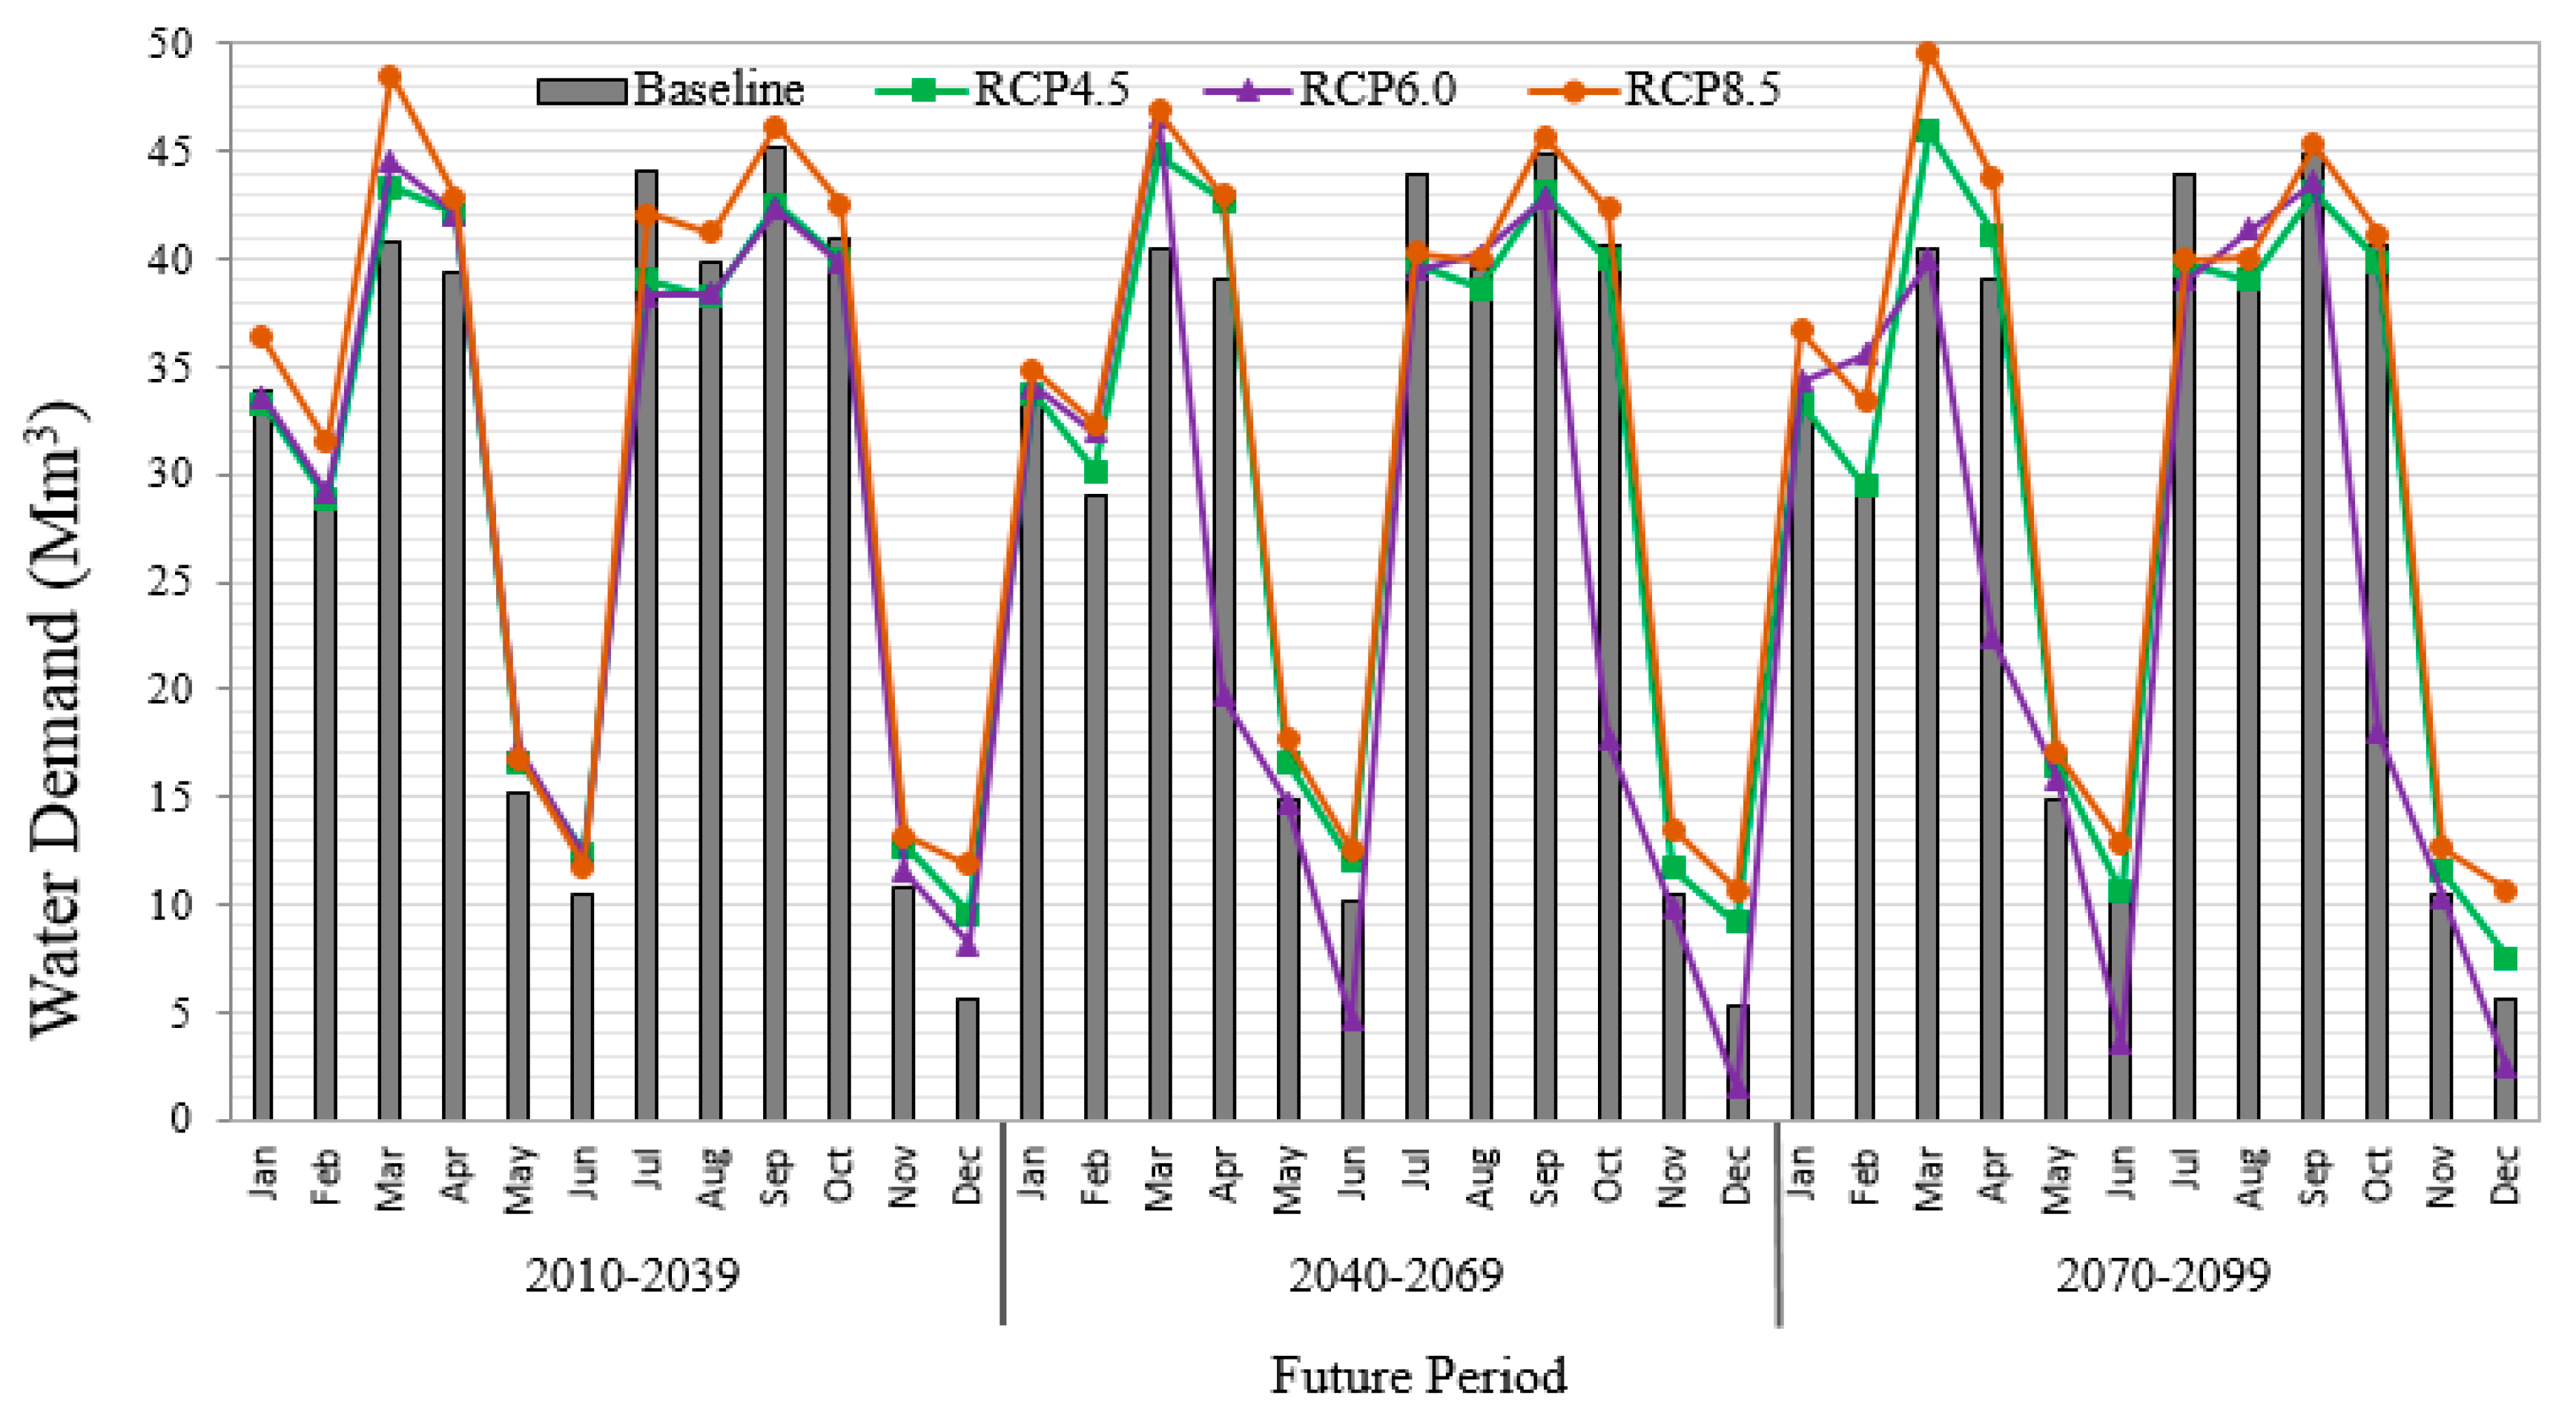
3.5. Water Demand Projection
4. Conclusions
- (1)
- Occurrence of floods and droughts: Due to increased rainfall events, the future of paddy farming is likely to face floods during the wet season and droughts during the dry season. Such changes will influence planning for the scheme’s water resources. Hence, vigilance will be needed to ensure proper management of the rice crop to reduce negative impacts.
- (2)
- Construction of storage reservoirs: While shortages of water will be experienced in some periods during the season, there will be an excess of water in other periods, which would run as waste. A storage reservoir was recently built in the scheme, however, its capacity is inadequate. Alternatively, reservoir(s) to store more water for future use based on the modeled discharge at the supply intake would be useful. The excess water could be stored in the reservoir(s) and used during the periods of high demand.
- (3)
- Altering of the paddy cropping schedule: In general, the issue of climate change may not impose significant water shortages for paddy cultivation in terms of physical water shortages. However, water-use efficiency could be improved with an additional cropping season (i.e., five seasons per two-year period), considering the projected increase in rain water. This could be achieved by improvements in crop patterns and alternate approaches in water management.
Author Contributions
Funding
Acknowledgments
Conflicts of Interest
References
- Haghighi, A.T.; Darabi, H.; Shahedi, K.; Solaimani, K.; Kløve, B. A scenario-based approach for assessing the hydrological impacts of land use and climate change in the Marboreh Watershed, Iran. Environ. Model. Assess. 2020, 25, 41–57. [Google Scholar] [CrossRef]
- United Nations Water Home Page. Available online: https://www.unwater.org/publications/climate-change-adaptation-pivotal-role-water/ (accessed on 19 February 2019).
- Haro-Monteagudo, D.; Palazón, L.; Beguería, S. Long-term Sustainability of Large Water Resource Systems under Climate Change: A Cascade Modeling Approach. J. Hydrol. 2020, 582, 124546. [Google Scholar] [CrossRef]
- Arnell, N.; Reynard, N. The effects of climate change due to global warming on river flows in Great Britain. J. Hydrol. 1996, 183, 397–424. [Google Scholar] [CrossRef]
- Chien, H.; Yeh, P.J.F.; Knouft, J.H. Modeling the potential impacts of climate change on streamflow in agricultural watersheds of the Midwestern United States. J. Hydrol. 2013, 491, 73–88. [Google Scholar] [CrossRef]
- Dlamini, N.S. Decision Support System for Water Allocation in Rice Irrigation Scheme under Climate Change Scenarios. Ph.D. Thesis, Universiti Putra Malaysia, Seri Kembangan, Malaysia, 2017. [Google Scholar]
- Ma, Z.; Kang, S.; Zhang, L.; Tong, L.; Su, X. Analysis of impacts of climate variability and human activity on streamflow for a river basin in arid region of northwest China. J. Hydrol. 2008, 352, 239–249. [Google Scholar] [CrossRef]
- CGSpace Home Page. Available online: https://cgspace.cgiar.org/handle/10568/107279 (accessed on 19 February 2019).
- Ghosh, M. Climate-smart Agriculture, Productivity and Food Security in India. J. Dev. Policy Pract. 2019, 4, 166–187. [Google Scholar] [CrossRef]
- Ding, Y.; Wang, W.; Song, R.; Shao, Q.; Jiao, X.; Xing, W. Modeling spatial and temporal variability of the impact of climate change on rice irrigation water requirements in the middle and lower reaches of the Yangtze River, China. Agric. Water Manag. 2017, 193, 89–101. [Google Scholar] [CrossRef]
- Flörke, M.; Schneider, C.; McDonald, R.I. Water competition between cities and agriculture driven by climate change and urban growth. Nat. Sustain. 2018, 1, 51. [Google Scholar] [CrossRef]
- Xu, X.; Jiang, Y.; Liu, M.; Huang, Q.; Huang, G. Modeling and assessing agro-hydrological processes and irrigation water saving in the middle Heihe River basin. Agric. Water Manag. 2019, 211, 152–164. [Google Scholar] [CrossRef]
- Chandrasiri, S.; Galagedara, L.; Mowjood, M. Impacts of rainfall variability on paddy production: A case from Bayawa minor irrigation tank in Sri Lanka. Paddy Water Environ. 2020, 18, 1–12. [Google Scholar] [CrossRef]
- Nguyen, Q.D.; Roussey, C.; Poveda-Villalón, M.; Vaulx, C.D.; Chanet, J.P. Development experience of a Context-Aware System for Smart Irrigation Using CASO and IRRIG Ontologies. Appl. Sci. 2020, 10, 18033. [Google Scholar] [CrossRef]
- Rowshon, M.; Dlamini, N.; Mojid, M.; Adib, M.; Amin, M.; Lai, S. Modeling climate-smart decision support system (CSDSS) for analyzing water demand of a large-scale rice irrigation scheme. Agric. Water Manag. 2019, 216, 138–152. [Google Scholar] [CrossRef]
- Wanhyun, C.; Myung, H.N.; Yuha, P.; Deok, H.K.; Yongbeen, C. Prediction of Weights during Growth Stages of Onion Using Agricultural Data Analysis Method. Appl. Sci. 2020, 10, 2094. [Google Scholar] [CrossRef]
- Ghobadi, M.; Ebrahimian, H.; Abbasi, F.; Norouzi, S. Development and application of a seasonal furrow irrigation model (SFIM). J. Irrig. Drain. 2020, 69, 1–191. [Google Scholar]
- Jiang, J.; Feng, S.; Ma, J.; Huo, Z.; Zhang, C. Optimizing regional irrigation water use by integrating a two-level optimization model and an agro-hydrological model. Agric. Water Manag. 2016, 178, 76–88. [Google Scholar] [CrossRef]
- Noory, H.; Van Der Zee, S.; Liaghat, A.M.; Parsinejad, M.; Van Dam, J. Distributed agro-hydrological modeling with SWAP to improve water and salt management of the Voshmgir Irrigation and Drainage Network in Northern Iran. Agric. Water Manag. 2011, 98, 1062–1070. [Google Scholar] [CrossRef]
- Ma, Y.; Feng, S.; Huo, Z.; Song, X. Application of the SWAP model to simulate the field water cycle under deficit irrigation in Beijing, China. Math. Comput. Model. 2011, 54, 1044–1052. [Google Scholar] [CrossRef]
- Jiang, J.; Feng, S.; Ma, J.; Huo, Z.; Zhang, C. Irrigation management for spring maize grown on saline soil based on SWAP model. Field Crops Res. 2016, 196, 85–97. [Google Scholar] [CrossRef]
- Van Gaelen, H.; Vanuytrecht, E.; Willems, P.; Diels, J.; Raes, D. Bridging rigorous assessment of water availability from field to catchment scale with a parsimonious agro-hydrological model. Environ. Model. Assess. 2017, 94, 140–156. [Google Scholar] [CrossRef]
- Siad, S.M.; Iacobellis, V.; Zdruli, P.; Gioia, A.; Stavi, I.; Hoogenboom, G. A review of coupled hydrologic and crop growth models. Agric. Water Manag. 2019, 224, 105746. [Google Scholar] [CrossRef]
- Amin, M.; Rowshon, M.; Aimrun, W. Paddy water management for precision farming of rice. Curr. Issues Water Manag. 2011, 6, 107–142. [Google Scholar]
- DID and JICA, Detailed study of water resources availability Northwest Selangor Integrated Agricultural Development Project. In Final Report; JICA: Tokyo, Japan, 1996; Volume 1.
- Rowshon, M.; Mojid, M.; Amin, M.; Azwan, M.; Yazid, A. Improving irrigation water delivery performance of a large-scale rice irrigation scheme. J. Irrig. Drain. E-Asce. 2014, 140, 04014027. [Google Scholar] [CrossRef]
- Ghosh, S.; Mujumdar, P. Nonparametric methods for modeling GCM and scenario uncertainty in drought assessment. Water Resour. Res. 2007, 43, W07405. [Google Scholar] [CrossRef]
- New, M.; Hulme, M. Representing uncertainty in climate change scenarios: A Monte-Carlo approach. Integr. Assess. 2000, 1, 203–213. [Google Scholar] [CrossRef]
- Abatzoglou, J.T.; Brown, T.J. A comparison of statistical downscaling methods suited for wildfire applications. Int. J. Climatol. 2012, 32, 772–780. [Google Scholar] [CrossRef]
- Fang, G.; Yang, J.; Chen, Y.; Zammit, C. Comparing bias correction methods in downscaling meteorological variables for a hydrologic impact study in an arid area in China. Hydrol. Earth Syst. Sci. 2015, 19, 2547–2559. [Google Scholar] [CrossRef]
- Wong, C.; Venneker, R.; Jamil, A.; Uhlenbrook, S. Development of a gridded daily hydrometeorological data set for Peninsular Malaysia. Hydrol. Process. 2011, 25, 1009–1020. [Google Scholar] [CrossRef]
- Wong, C.; Venneker, R.; Uhlenbrook, S.; Jamil, A.; Zhou, Y. Variability of rainfall in Peninsular Malaysia. Hydrol. Earth Syst. Sci. Discuss. 2009, 6, 5471–5503. [Google Scholar] [CrossRef]
- Meenu, R.; Rehana, S.; Mujumdar, P. Assessment of hydrologic impacts of climate change in Tunga–Bhadra river basin, India with HEC-HMS and SDSM. Hydrol. Process. 2013, 27, 1572–1589. [Google Scholar] [CrossRef]
- Babel, B.S.P.; Walid, S.M. Climate change and water resources in the Bagmati River, Nepal. Theor. Appl. Climatol. 2014, 115, 639–654. [Google Scholar] [CrossRef]
- USACE-HEC. Hydraulic Reference Manual. In US Army Corps of Engineers; USACE-HEC: Davis, CA, USA, 2016. [Google Scholar]
- Chow, V.T. Open Channel Hydraulics; McGraw-Hill Book Company: New York, NY, USA, 1959. [Google Scholar]
- Chan, C.; Cheong, A. Seasonal weather effects on crop evapotranspiration and rice yield. J. Trop. Agric. Food Sci. 2001, 29, 77–92. [Google Scholar]
- Allen, R.G.; Pereira, L.S.; Raes, D.; Smith, M. Crop evapotranspiration-Guidelines for computing crop water requirements-FAO Irrigation and drainage paper 56. Fao Rome 1998, 300, D05109. [Google Scholar]
- IADA. Final Report: Kajian Keberkesanan Taliair Tersier Di Seluruh Kawasan IADA Barat Laut Selangor; Paradigm Ingenieurs SDN BHD: Selangor Darul-Ehsan, Malaysia, 2018. [Google Scholar]
- Moriasi, D.N.; Arnold, J.G.; Van Liew, M.W.; Bingner, R.L.; Harmel, R.D.; Veith, T.L. Model evaluation guidelines for systematic quantification of accuracy in watershed simulations. Trans. ASABE 2007, 50, 885–900. [Google Scholar] [CrossRef]
- Dlamini, N.; Rowshon, M.; Saha, U.; Lai, S.; Fikri, A.Z.; Zubaidi, J. Simulation of future daily rainfall scenario using stochastic rainfall generator for a rice-growing irrigation scheme in Malaysia. Asian J. Appl. Sci. 2015, 3, 492–506. [Google Scholar]
- Goodarzi, M.; Eslamian, S. Performance evaluation of linear and nonlinear models for the estimation of reference evapotranspiration. Int. J. Hydrol. Sci. Technol. 2018, 8, 1–15. [Google Scholar] [CrossRef]
- Soltani, A.A.F.; Zeynali, E.; Galeshi, S.A.; Niari, N. Simulating GFDL predicted climate change impacts on rice cropping in Iran. J. Agric. Sci. 2001, 3, 81–90. [Google Scholar]
- Shakoor, U.; Saboor, A.; Baig, I.; Afzal, A.; Rahman, A. Climate variability impacts on rice crop production in Pakistan. Pak. J. Agric. Sci. 2015, 28, 19–27. [Google Scholar]
- McKague, K.; Rudra, R.; Ogilvie, J. ClimGen-a convenient weather generation tool for Canadian climate stations. In Proceedings of the Meeting of the CSAE/SCGR Canadian Society for Engineering in Agricultural Food and Biological Systems, Montreal, QC, Canada, 6–9 July 2003. [Google Scholar]
- Tukimat, N.; Harun, S.; Shahid, S. Modeling irrigation water demand in a tropical paddy cultivated area in the context of climate change. J. Water Res. Plan Manage. 2017, 143, 05017003. [Google Scholar] [CrossRef]
- De Souza Groppo, G.; Costa, M.A.; Libânio, M. Predicting water demand: A review of the methods employed and future possibilities. Water Supply 2019, 19, 2179–2198. [Google Scholar] [CrossRef]


| Cropping Activities | Dry Season | Wet Season | ||||||
|---|---|---|---|---|---|---|---|---|
| ISA I | ISA II | ISA III | ISA IV | ISA I | ISA II | ISA III | ISA IV | |
| Pre-saturation | 1-January | 1-February | 1-March | 1-April | 1-July | 1-August | 1-September | 1-October |
| Sowing starts | 15-January | 15-February | 15-March | 15-April | 15-July | 15-August | 15-September | 15-October |
| Normal irrigation | 1-February | 1-March | 1-April | 1-May | 1-August | 1-September | 1-October | 1-November |
| Irrigation ends | 10-April | 10-May | 10-June | 10-July | 10-October | 10-November | 10-December | 10-January |
| GCMs | RCP4.5 | RCP6.0 | RCP8.5 | ||||||
|---|---|---|---|---|---|---|---|---|---|
| 2020s | 2050s | 2080s | 2020s | 2050s | 2080s | 2020s | 2050s | 2080s | |
| CANESM2 | – | – | – | – | – | – | 16.38 | 27.72 | 37.85 |
| CCSM4 | −0.98 | 3.86 | 3.95 | −6.46 | −2.97 | 0.59 | −2.28 | 5.46 | −3.65 |
| CNRM | −6.58 | −0.95 | −4.47 | – | – | – | −1.88 | −7.05 | 0.00 |
| CSIRO | −1.87 | 1.33 | 8.07 | −4.65 | −9.70 | −7.14 | 0.29 | −33.5 | −72.20 |
| GFDL-ESM2G | 3.35 | 6.14 | 3.55 | 4.68 | 6.62 | 8.09 | 1.24 | 14.60 | 0.00 |
| GFDL-ESM2M | 5.56 | 2.92 | 6.47 | 7.23 | 14.46 | 14.16 | 11.72 | 5.15 | 9.28 |
| HadGEM2-CC | 13.75 | −5.13 | 5.46 | – | – | – | 4.09 | −1.47 | 0.14 |
| HadGEM2-ES | 1.97 | −9.42 | −0.65 | −55.31 | −55.46 | −62.29 | −0.78 | −8.44 | −8.23 |
| MPI-ESM-LR | 34.1 | 28.7 | 43.6 | – | – | – | 44.9 | 34.7 | 27.3 |
| MRI-CGCM3 | 2.72 | −2.88 | 10.14 | −5.43 | −0.16 | −6.08 | −3.17 | 3.85 | −5.14 |
| Period | Changes in Temperature under RCPs | ||
|---|---|---|---|
| RCP4.5 | RCP6.0 | RCP8.5 | |
| Maximum temperature (°C) | |||
| 2020s | 0.68 | 0.52 | 0.82 |
| 2050s | 1.29 | 1.06 | 1.85 |
| 2080s | 1.57 | 1.85 | 3.25 |
| Average | 1.18 | 1.14 | 1.97 |
| Minimum temperature (°C) | |||
| 2020s | 0.71 | 0.62 | 0.92 |
| 2050s | 1.36 | 1.16 | 1.95 |
| 2080s | 1.75 | 1.85 | 3.36 |
| Average | 1.27 | 1.21 | 2.08 |
| Irrigation Season | Period | Changes (%) in Streamflow | ||
|---|---|---|---|---|
| RCP4.5 | RCP6.0 | RCP8.5 | ||
| 2020s | −0.40 | −1.70 | −5.66 | |
| Dry Season | 2050s | −0.63 | −1.90 | −5.54 |
| 2080s | −0.18 | −1.44 | −5.94 | |
| Average | −0.40 | −1.68 | −5.71 | |
| 2020s | 0.19 | −0.84 | −3.92 | |
| Wet Season | 2050s | 0.59 | −0.47 | −3.67 |
| 2080s | 0.31 | −0.71 | −3.90 | |
| Average | 0.36 | −0.67 | −3.83 | |
| Irrigation Season | Period | Annual Changes (%) in Water Demand under RCPs | ||
|---|---|---|---|---|
| RCP4.5 | RCP6.0 | RCP8.5 | ||
| 2020s | 4.36 | 5.54 | 10.03 | |
| 2050s | 6.21 | −11.40 | 11.02 | |
| Dry Season | 2080s | 6.21 | −11.40 | 11.09 |
| Average | 5.59 | −5.75 | 10.71 | |
| 2020s | −2.3 | −4.5 | −5.4 | |
| Wet Season | 2050s | −2.4 | 17.5 | −5.9 |
| 2080s | −3.3 | 14.0 | −7.3 | |
| Average | −2.6 | 9.0 | −6.2 | |
| Season | Historical | RCP4.5 | RCP6.0 | RCP8.5 | ||||||
|---|---|---|---|---|---|---|---|---|---|---|
| 1976–2005 | 2020s | 2050s | 2080s | 2020s | 2050s | 2080s | 2020s | 2050s | 2080s | |
| Dry season | ||||||||||
| Jan | 2.92 | 1.80 | 1.65 | 1.78 | 1.38 | 1.26 | 1.16 | 0.11 | 0.67 | −0.11 |
| Feb | 3.35 | 2.46 | 1.92 | 2.19 | 2.01 | 0.89 | −0.61 | 0.76 | 0.42 | 0.20 |
| Mar | −0.03 | −1.94 | −2.47 | −2.87 | −2.66 | −3.50 | −4.61 | −4.46 | −4.94 | −6.52 |
| Apr | 0.51 | −1.98 | −2.23 | −1.61 | −2.27 | 6.38 | 5.33 | −2.87 | −2.90 | −3.53 |
| May | 9.84 | 8.06 | 8.07 | 8.14 | 7.56 | 8.44 | 8.04 | 7.37 | 7.10 | 7.22 |
| June | 11.21 | 9.50 | 9.65 | 10.20 | 9.23 | 12.22 | 12.57 | 9.12 | 8.83 | 9.07 |
| Wet season | ||||||||||
| Jul | −1.40 | −0.34 | −0.62 | −0.59 | −0.32 | −0.76 | −0.61 | −2.03 | −1.40 | −1.23 |
| Aug | −0.13 | −0.02 | −0.15 | −0.30 | −0.37 | −1.03 | −1.49 | −1.73 | −1.26 | −1.23 |
| Sep | −2.63 | −2.22 | −2.36 | −2.36 | −2.38 | −3.62 | −3.56 | −4.22 | −4.39 | −4.73 |
| Oct | −0.15 | −0.68 | −0.67 | −0.62 | −0.90 | 7.37 | 7.25 | −2.23 | −2.16 | −2.08 |
| Nov | 11.39 | 9.34 | 9.76 | 9.81 | 9.51 | 10.17 | 9.97 | 8.56 | 8.45 | 8.77 |
| Dec | 13.90 | 10.68 | 10.84 | 11.45 | 10.92 | 13.44 | 13.02 | 9.25 | 9.67 | 9.69 |
© 2020 by the authors. Licensee MDPI, Basel, Switzerland. This article is an open access article distributed under the terms and conditions of the Creative Commons Attribution (CC BY) license (http://creativecommons.org/licenses/by/4.0/).
Share and Cite
Ismail, H.; Kamal, M.R.; bin Abdullah, A.F.; bin Mohd, M.S.F. Climate-Smart Agro-Hydrological Model for a Large Scale Rice Irrigation Scheme in Malaysia. Appl. Sci. 2020, 10, 3906. https://doi.org/10.3390/app10113906
Ismail H, Kamal MR, bin Abdullah AF, bin Mohd MSF. Climate-Smart Agro-Hydrological Model for a Large Scale Rice Irrigation Scheme in Malaysia. Applied Sciences. 2020; 10(11):3906. https://doi.org/10.3390/app10113906
Chicago/Turabian StyleIsmail, Habibu, Md Rowshon Kamal, Ahmad Fikri bin Abdullah, and Mohd Syazwan Faisal bin Mohd. 2020. "Climate-Smart Agro-Hydrological Model for a Large Scale Rice Irrigation Scheme in Malaysia" Applied Sciences 10, no. 11: 3906. https://doi.org/10.3390/app10113906
APA StyleIsmail, H., Kamal, M. R., bin Abdullah, A. F., & bin Mohd, M. S. F. (2020). Climate-Smart Agro-Hydrological Model for a Large Scale Rice Irrigation Scheme in Malaysia. Applied Sciences, 10(11), 3906. https://doi.org/10.3390/app10113906