Selective Laser Melting Heat Sinks under Jet Impingement Cooling for Heat Dissipation of Higher Light Output LED Lighting in a Limited Space


Abstract
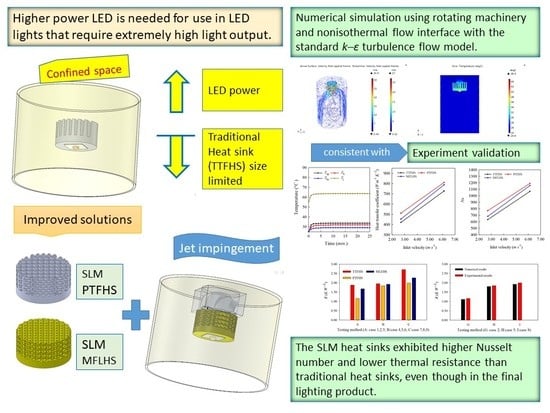
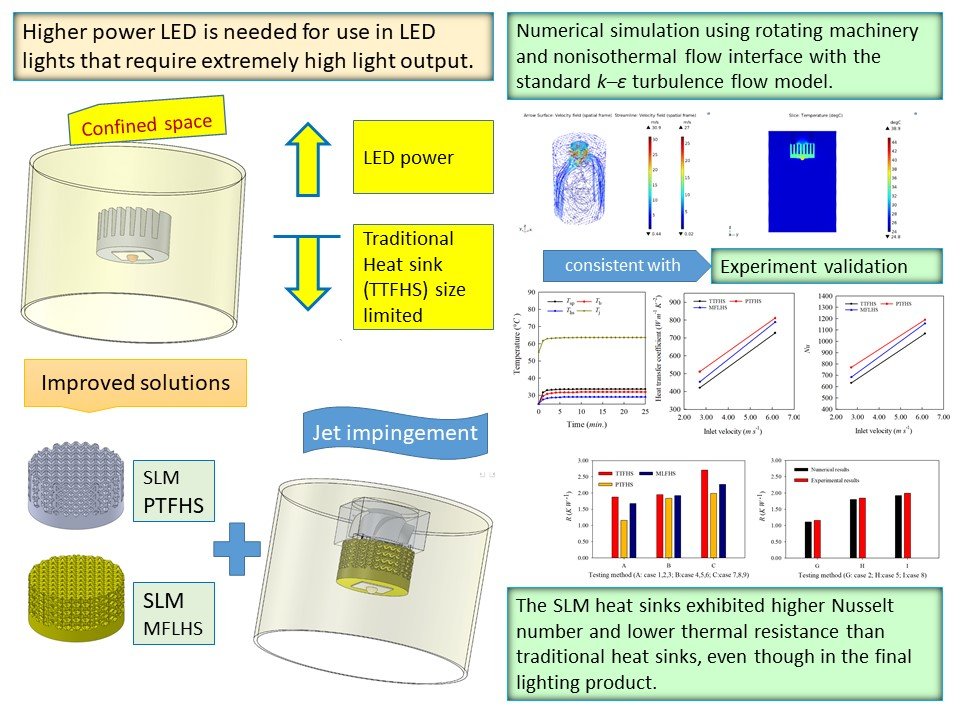
1. Introduction
1.1. Research Procedure
1.2. Geometric Design of Heat Sinks
2. Mathematical Formulation
2.1. Governing Equations and Numerical Models
2.2. Numerical Computations
3. Numerical Simulation Modeling
3.1. Grid Generation (Meshing)
3.2. Boundary Conditions
4. Experiment Setup
4.1. Heat Sink Sample Fabrication
4.2. Experimental Setup and Procedure
4.3. LED Junction Temperature and Thermal Resistance Calculation
4.4. Measurement Uncertainties
5. Results and Discussion
5.1. Numerical Results
5.1.1. Numerical Results of Velocity Field
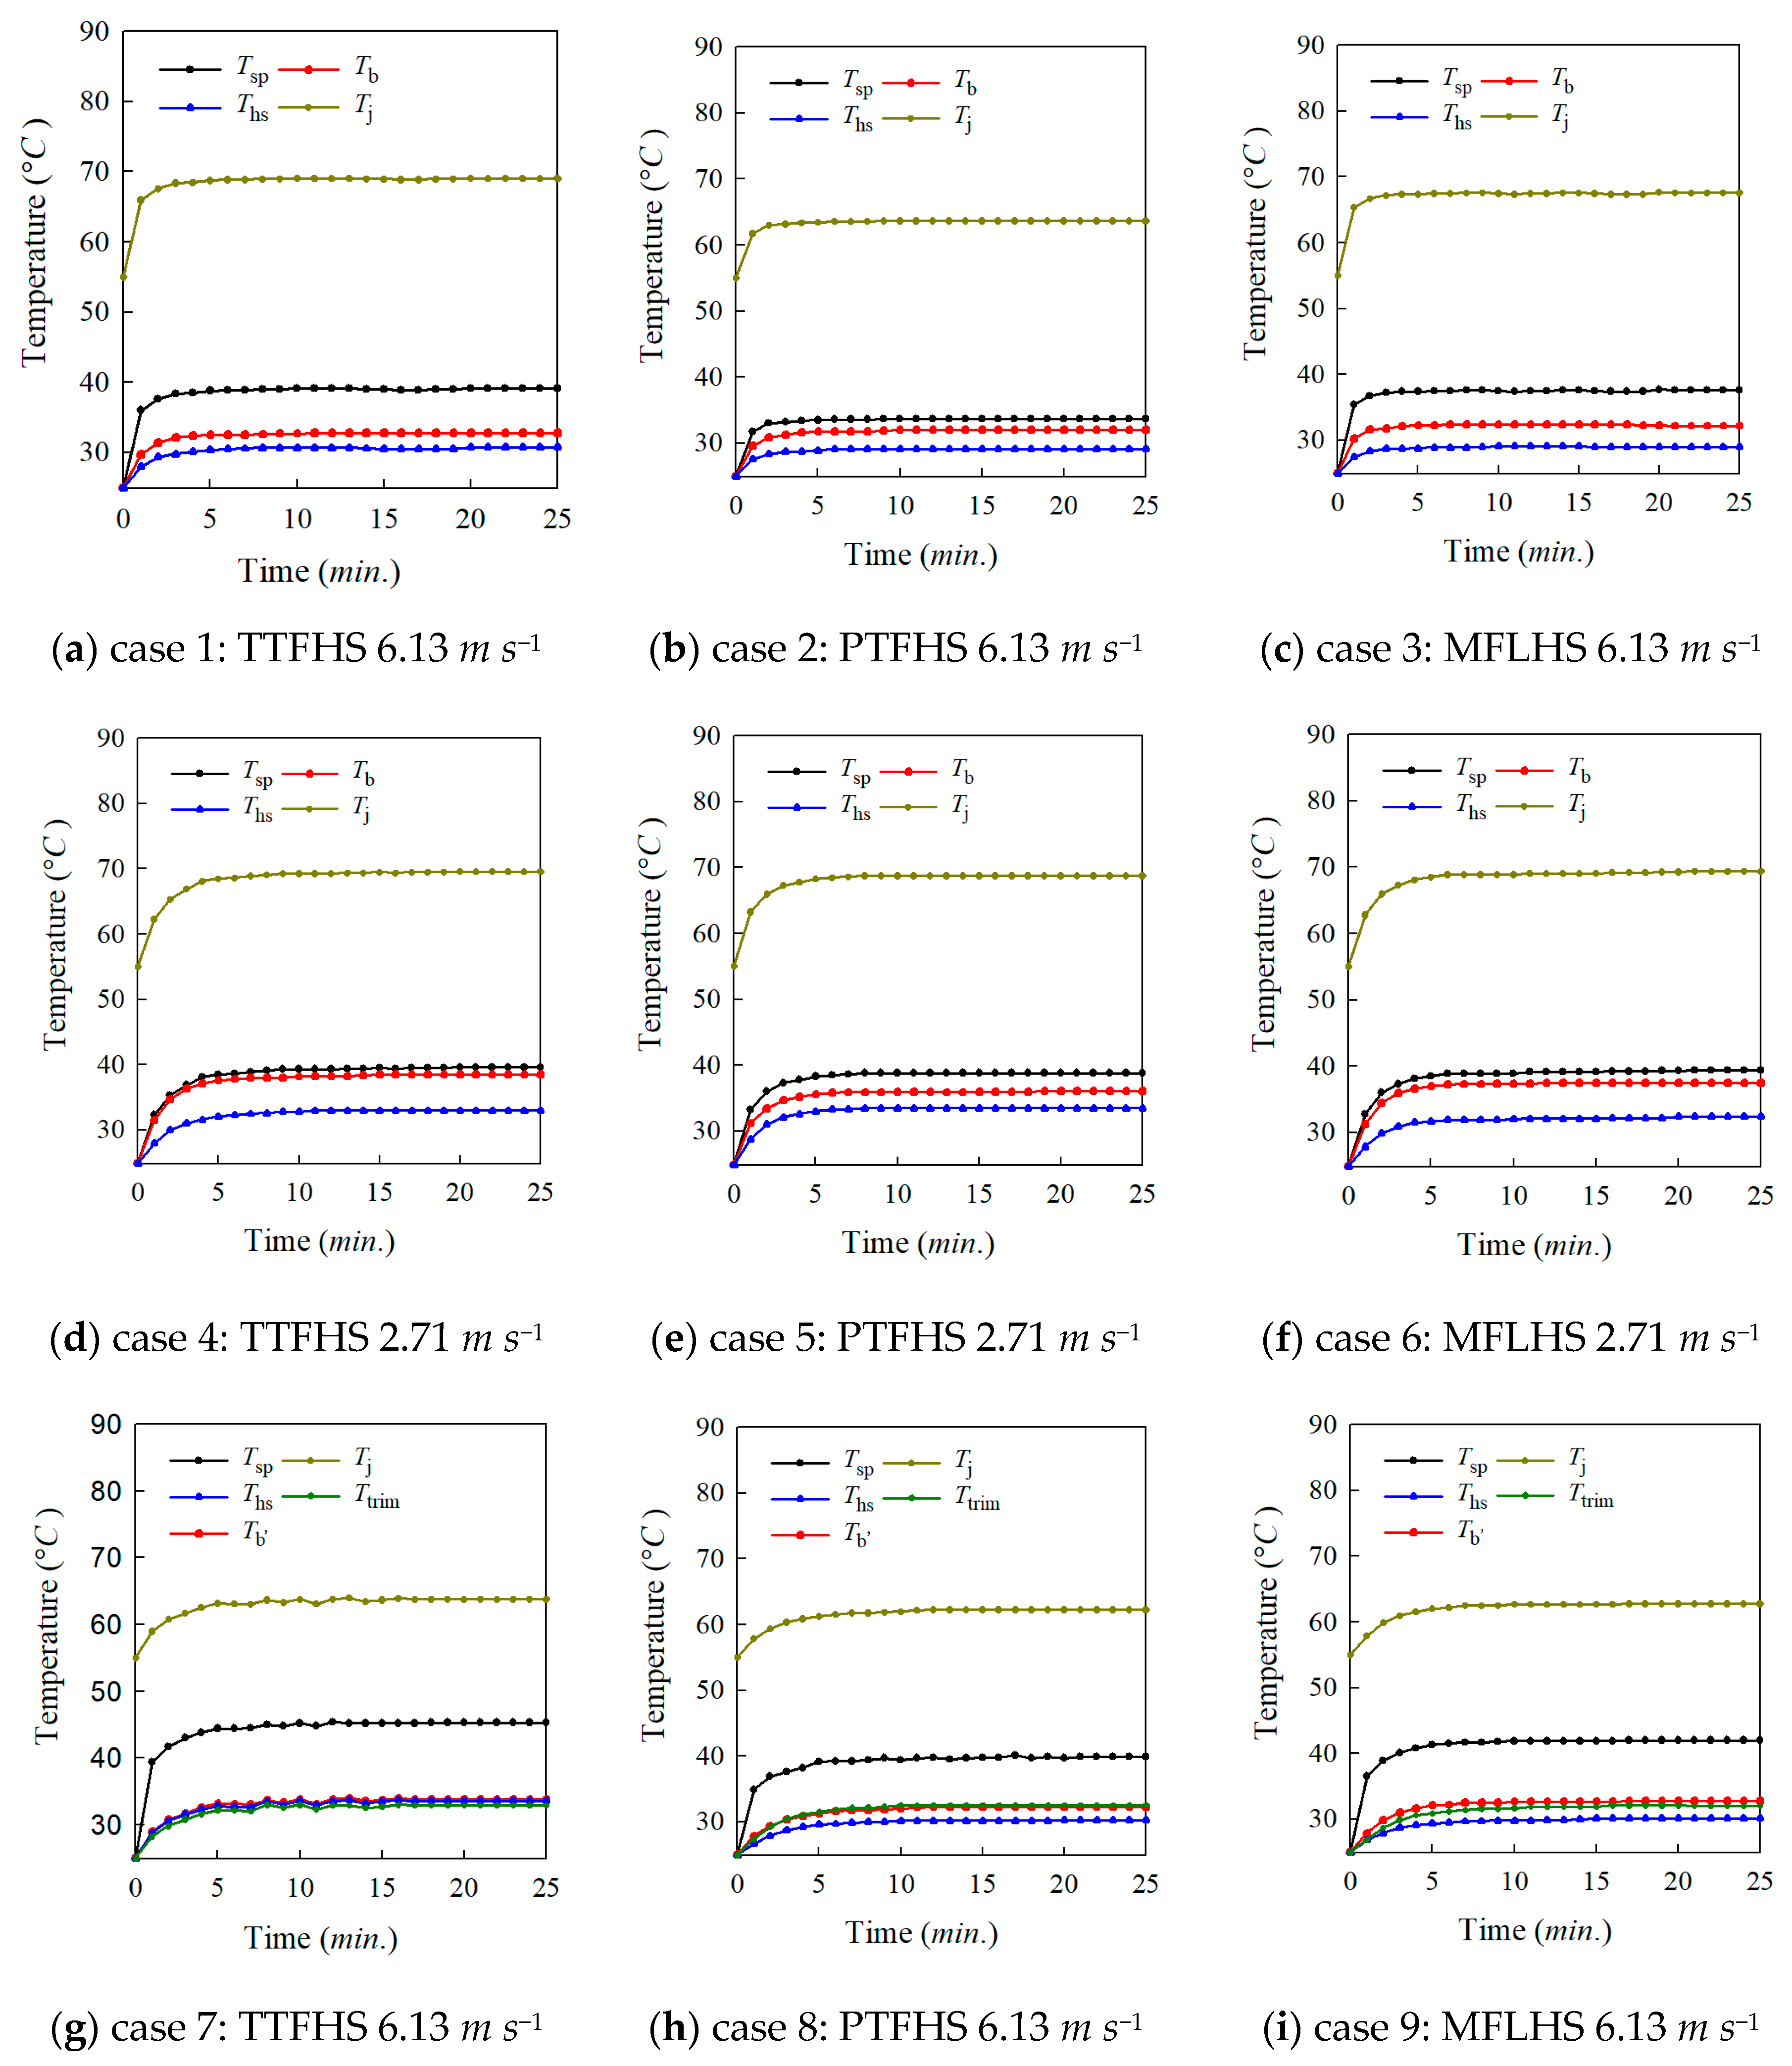
5.1.2. Numerical Results of Temperature Field
5.2. Experimental Results
5.3. Effects of Nusselt Number, Thermal Resistance Reduction, and Weight Reduction
5.4. Allowable Increasing Temperature Difference for Existing CLRDL Using Relatively Higher Power LEDs
6. Conclusions
- (1)
- Using the SLM approach, the PTFHS exhibited the highest heat transfer performance followed by the MFLHS and TTFHS irrespective of lower or higher Reynolds number turbulent air flow, because the PTFHS possesses increased heat transfer surface area and less air flow obstruction. Although MFLHS has increased heat transfer surface area, its heat transfer performance was less than the PTFHS because of its relatively narrow air flow channels obstructing heat exchange with the environment.
- (2)
- The proposed PTFHS and MFLHS increased the Nusselt number by 10.3% and 7.7%, reduced thermal resistance by 40.3% and 13.0%, and achieved weight reduction of 23.6% and 24.6%, respectively, based on comparisons of TTFHS. This enhanced the heat transfer rate and reduced the LED lighting module weight. Therefore, it allowed the CLRDL to increase LED power higher than 10 W for further light output requirement.
- (3)
- This study contributes to the applications of small or narrow spaces and a large heat removal requirement by applying jet impingement cooling. The numerical simulation results were consistent with experimental results. This consistency validated the approach of using the CLRDLs with PTFHS, MFLHS, and TTFHS under an environment with a high heat-source temperature and maintaining a low LED’s junction temperature for ensuring LEDs longer lifetimes specified by Energy Star.
Author Contributions
Funding
Acknowledgments
Conflicts of Interest
Nomenclature
| A | Area | m2 |
| Ab | Area of heat sink base | m2 |
| Cp | Specific heat at constant pressure | J kg−1 K−1 |
| D | Inlet jet hole diameter | m |
| F | Volume force | N m−3 |
| g | Gravity, 9.8 m s−2 | m s−2 |
| h | Convective heat transfer coefficient | W m−2 K−1 |
| hm | Modified convective heat transfer coefficient | W m−2 K−1 |
| Average heat transfer coefficient | W m−2 K−1 | |
| I | Identity matrix | – |
| If | LED forward current | mA |
| k | Thermal conductivity | W m−1 K−1 |
| k | Turbulent kinetic energy | m−2 s−2 |
| Lc | Characteristic length | M |
| Nu | Nusselt number | Dimensionless |
| p | Pressure | Pa |
| rbp | Rotation axis base point (present study keeps it zero, constants) | – |
| Heat generation per volume, heat dissipation rate | W m−3 | |
| Heat flux | W m−2 | |
| Re | Reynolds number | Dimensionless |
| R | Thermal resistance | K W−1 |
| Rb-jet | Thermal resistance of heatsink base to inlet air jet temperature | K W−1 |
| Rj-jet | Thermal resistance of junction to inlet air jet temperature | K W−1 |
| Rj-sp | Thermal resistance of junction to solder point | K W−1 |
| Rsp-hs | Thermal resistance of solder point to heatsink | K W−1 |
| Rsp-b | Thermal resistance of solder point to heatsink base | K W−1 |
| Rsp-jet | Thermal resistance of solder point to inlet air jet temperature | K W−1 |
| Rsp-trim | Thermal resistance of solder point to trim temperature | K W−1 |
| T | Celsius temperature | °C |
| T | Kelvin temperature, °C + 273.15 °C | K |
| Ta | Ambient temperature | °C |
| Tb | Heat sink base temperature | °C |
| Th | Housing temperature | °C |
| Ths | Heatsink temperature | °C |
| Tj | Junction temperature | °C |
| Tjet | Inlet air jet temperature | °C |
| Tsp | Solder point temperature | °C |
| Ttrim | Trim temperature under housing | °C |
| t | Time | s |
| t* | Frozen time | s |
| u | Velocity | m s−1 |
| Averaged velocity | m s−1 | |
| Vf | LED forward voltage | V |
| w | Angular velocity | rad s−1 |
| Greek symbols | ||
| α | Thermal diffusivity | m2 s−1 |
| β | Volume expansivity | K−1 |
| ε | Turbulent energy dissipation rate | m−2 s−2 |
| Δ | Difference | – |
| ∇ | Gradient | – |
| ρ | Density | kg m−3 |
| μ | Viscosity or dynamic viscosity | Pa.s |
| Kinematic viscosity | m2 s−1 | |
| ω | Angular displacement | Rad |
| Superscript | ||
| T | The transpose of matrix | – |
References
- COMSOL Inc. COMSOL Multiphysics 5.3, CFD Module, Software Licensed by COMSOL Inc.; Pitotech: Changhua City, Taiwan, 2017. [Google Scholar]
- Li, H.Y.; Chiang, M.H.; Chen, K.Y. Performance analysis of pin-fin heat sinks with confined impingement cooling. IEEE Trans. Compon. Packag. Technol. 2007, 30, 383–389. [Google Scholar] [CrossRef]
- Yang, Y.T.; Lin, S.C.; Wang, Y.H.; Hsu, J.C. Numerical simulation and optimization of impingement cooling for rotating and stationary pin–fin heat sinks. Int. J. Heat Fluid Flow 2013, 44, 383–393. [Google Scholar] [CrossRef]
- Collins, I.L.; Weibel, J.A.; Pan, L.; Garimella, S.V. A permeable-membrane microchannel heat sink made by additive manufacturing. Int. J. Heat Mass Transf. 2019, 131, 1174–1183. [Google Scholar] [CrossRef]
- Li, Y.; Gu, D. Parametric analysis of thermal behavior during selective laser melting additive manufacturing of aluminum alloy powder. Mater. Des. 2014, 63, 856–867. [Google Scholar] [CrossRef]
- Kempen, K.; Thijs, L.; Van Humbeeck, J.; Kruth, J.P. Mechanical properties of AlSi10Mg produced by selective laser melting. Phys. Procedia 2012, 39, 439–446. [Google Scholar] [CrossRef]
- Huang, C.H.; Chen, Y.H. An impingement heat sink module design problem in determining simultaneously the optimal non-uniform fin widths and heights. Int. J. Heat Mass Transf. 2014, 73, 627–633. [Google Scholar] [CrossRef]
- Ong, K.; Tan, C.; Lai, K.; Tan, K. Heat spreading and heat transfer coefficient with fin heat sink. Appl. Therm. Eng. 2017, 112, 1638–1647. [Google Scholar] [CrossRef]
- Hsu, H.C.; Huang, Y.C. Numerical simulation and experimental validation for the thermal analysis of a compact LED recessed downlight with heat sink design. Appl. Sci. 2016, 7, 4. [Google Scholar] [CrossRef]
- Huang, Y.C.; Hsu, H.C. Numerical simulation and experimental validation of heat sinks fabricated using selective laser melting for use in a compact LED recessed downlight. Microsyst. Technol. 2018, 25, 121–137. [Google Scholar] [CrossRef]
- Wong, M.; Owen, I.; Sutcliffe, C.; Puri, A. Convective heat transfer and pressure losses across novel heat sinks fabricated by Selective Laser Melting. Int. J. Heat Mass Transf. 2009, 52, 281–288. [Google Scholar] [CrossRef]
- Ahn, B.; Park, J.; Yoo, S.; Kim, J.; Jeong, H.; Leigh, S.; Jang, C. Synergetic Effect between Lighting Efficiency Enhancement and Building Energy Reduction Using Alternative Thermal Operating System of Indoor LED Lighting. Energies 2015, 8, 8736–8748. [Google Scholar] [CrossRef]
- Moffat, R.J. Contributions to the theory of single-sample uncertainty analysis. J. Fluids Eng. 1982, 104, 250–258. [Google Scholar] [CrossRef]
- Wang, T.; Simon, T. Development of a special-purpose test surface guided by uncertainty analysis. J. Thermophys. Heat Transf. 1989, 3, 19–26. [Google Scholar] [CrossRef]
- Yan, Y.; Owen, J. Uncertainties in transient heat transfer measurements with liquid crystal. Int. J. Heat Fluid Flow 2002, 23, 29–35. [Google Scholar] [CrossRef]
- Chein, R.; Yang, H.; Tsai, T.H.; Lu, C. Experimental study of heat sink performance using copper foams fabricated by electroforming. Microsyst. Technol. 2009, 16, 1157–1164. [Google Scholar] [CrossRef]


| Case | Testing Method | Velocity of 6.13 m s−1 | Velocity of 2.71 m s−1 |
|---|---|---|---|
| 1 | TTFHS heat sinks with LED | ● | |
| 2 | PTFHS heat sinks with LED | ● | |
| 3 | MFLHS heat sinks with LED | ● | |
| 4 | TTFHS heat sinks with LED | ● | |
| 5 | PTFHS heat sinks with LED | ● | |
| 6 | MFLHS heat sinks with LED | ● | |
| 7 | TTFHS heat sinks with LED and housing | ● | |
| 8 | PTFHS heat sinks with LED and housing | ● | |
| 9 | MFLHS heat sinks with LED and housing | ● |
| Fan Velocity of 6.13 m s−1 | Fluid Condition | Thermal Condition | Rotating Fan Condition |
|---|---|---|---|
| Inlet | 6.13 m s−1 | Tjet = 25 °C | 7200 rpm |
| p = 101.325 kPa | Negative angular velocity | ||
| Pressure outlet | p = 0 Pa | ||
| Wall | Wall functions, no slip | ||
| Boundary heat source from LED | Q = 7.5 W | ||
| Fan velocity of 2.71 m s−1 | Fluid condition | Thermal condition | Rotating fan condition |
| Inlet | 2.71 m s−1 | Tjet = 25 °C | 2500 rpm |
| p = 101.325 kPa | Negative angular velocity | ||
| Pressure outlet | p = 0 Pa | ||
| Wall | Wall functions, no slip | ||
| Boundary heat source from LED | Q = 7.5 W |
| Case | Type | Tsp (°C) | Tjet (°C) | h (W m−2k−1) | Nu | Rsp-jet (K W−1) |
|---|---|---|---|---|---|---|
| 1 | TTFHS | 38.9 | 25.0 | 728.298 | 1068.545 | 1.85 |
| 2 | PTFHS | 33.3 | 25.0 | 811.532 | 1190.665 | 1.11 |
| 3 | MFLHS | 37.1 | 25.0 | 788.989 | 1157.591 | 1.61 |
| Case | Type | Tsp (°C) | Tjet (°C) | h (W m−2k−1) | Nu | Rsp-jet (K W−1) |
|---|---|---|---|---|---|---|
| 1 | TTFHS | 39.3 | 25.0 | 420.794 | 633.275 | 1.91 |
| 2 | PTFHS | 38.5 | 25.0 | 511.777 | 770.199 | 1.80 |
| 3 | MFLHS | 38.7 | 25.0 | 454.458 | 683.937 | 1.83 |
| Case | Type | Tsp (°C) | Tjet (°C) | Rsp-jet (K W−1) |
|---|---|---|---|---|
| 7 | TTFHS | 44.9 | 25.0 | 2.65 |
| 8 | PTFHS | 39.4 | 25.0 | 1.92 |
| 9 | MFLHS | 41.5 | 25.0 | 2.20 |
| Case | Type | Tsp (°C) | Tb (°C) | Ths (°C) | Tjet (°C) | D (m) | Ab (°C) | h (W m−2k−1) | Nu | Rsp-jet (K W−1) |
|---|---|---|---|---|---|---|---|---|---|---|
| 1 | TTFHS | 39.1 | 32.8 | 30.8 | 25.0 | 0.038 | 0.00132 | 728.298 | 1068.545 | 1.88 |
| 2 | PTFHS | 33.7 | 32.0 | 29.1 | 25.0 | 0.038 | 0.00132 | 811.532 | 1190.665 | 1.16 |
| 3 | MFLHS | 37.6 | 32.2 | 29.0 | 25.0 | 0.038 | 0.00132 | 788.989 | 1157.591 | 1.68 |
| Case | Type | Tsp (°C) | Tb (°C) | Ths (°C) | Tjet (°C) | D (m) | Ab (°C) | h (W m−2k−1) | Nu | Rsp-jet (K W−1) |
|---|---|---|---|---|---|---|---|---|---|---|
| 4 | TTFHS | 39.6 | 38.5 | 33.0 | 25.0 | 0.038 | 0.00132 | 420.794 | 633.275 | 1.95 |
| 5 | PTFHS | 38.8 | 36.1 | 33.5 | 25.0 | 0.038 | 0.00132 | 511.777 | 770.199 | 1.84 |
| 6 | MFLHS | 39.4 | 37.5 | 32.4 | 25.0 | 0.038 | 0.00132 | 454.458 | 683.937 | 1.92 |
| Case | Type | Tsp (°C) | Tb′ (°C) | Ths (°C) | Tjet (°C) | Ttrim (°C) | Rsp-jet (K W−1) |
|---|---|---|---|---|---|---|---|
| 7 | TTFHS | 45.3 | 33.8 | 33.6 | 25.0 | 32.9 | 2.71 |
| 8 | PTFHS | 39.9 | 32.8 | 30.3 | 25.0 | 32.5 | 1.99 |
| 9 | MFLHS | 42.0 | 32.3 | 30.1 | 25.0 | 32.0 | 2.27 |
| Heat Sink Type | PTFHS | MFLHS |
|---|---|---|
| Nusselt number increase, % | 10.3 | 7.7 |
| Thermal resistance reduction, % | 40.3 | 13.0 |
| Weight reduction, % | 23.6 | 24.6 |
| Type | Tsp (°C) | Tj (°C) | Specified LED Limited Tj (°C) | Allowance of Tj to be Increased (°C) |
|---|---|---|---|---|
| PTFHS | 39.4 | 69.4 | 135 | 65.6 |
| MFLHS | 41.5 | 71.5 | 135 | 63.5 |
© 2020 by the authors. Licensee MDPI, Basel, Switzerland. This article is an open access article distributed under the terms and conditions of the Creative Commons Attribution (CC BY) license (http://creativecommons.org/licenses/by/4.0/).
Share and Cite
Huang, Y.-C.; Hsu, H.-C. Selective Laser Melting Heat Sinks under Jet Impingement Cooling for Heat Dissipation of Higher Light Output LED Lighting in a Limited Space. Appl. Sci. 2020, 10, 3898. https://doi.org/10.3390/app10113898
Huang Y-C, Hsu H-C. Selective Laser Melting Heat Sinks under Jet Impingement Cooling for Heat Dissipation of Higher Light Output LED Lighting in a Limited Space. Applied Sciences. 2020; 10(11):3898. https://doi.org/10.3390/app10113898
Chicago/Turabian StyleHuang, Yi-Cheng, and Huan-Chu Hsu. 2020. "Selective Laser Melting Heat Sinks under Jet Impingement Cooling for Heat Dissipation of Higher Light Output LED Lighting in a Limited Space" Applied Sciences 10, no. 11: 3898. https://doi.org/10.3390/app10113898
APA StyleHuang, Y.-C., & Hsu, H.-C. (2020). Selective Laser Melting Heat Sinks under Jet Impingement Cooling for Heat Dissipation of Higher Light Output LED Lighting in a Limited Space. Applied Sciences, 10(11), 3898. https://doi.org/10.3390/app10113898