1. Introduction
Digitalization has infiltrated into every aspect of life. Emerging new technologies have an impact on our lives and change the way we do our daily work, raising our performance to a new height. The technology used in education has allowed educators to implement new theories to enhance the teaching and learning process. This shift from “traditional learning” has led to a model in which learning can take place outside the classroom, facilitating different learner attributes such as visual, verbal, aural and solitary learning within the “blended learning” approach [
1]. Educators use innovative technologies to cater to different learners with blended learning, and learners can use these technologies to improve their cognitive abilities to excel in the courses being taught [
2]. Educators use virtual classrooms, webinars, links, simulations or any other online mechanism to deliver the information [
3].
In blended learning environments (BLE), the approach to education is a flipped classroom, where content is provided through the Internet in advance before the commencement of the class [
4]. The flipped classroom enables students to come to the class prepared, and the educator uses activities in the class that can clear the doubts of the students, as well as helping them in their assessments and the concepts learned from the content provided to them in the form of discussions or activities. The content that is usually provided by the educator for the flipped classroom includes reading along with questions and answers, created video lectures, demonstration videos, an online class discussion room, lecture slides, tutorials and reading from textbooks or reference books [
5].
The adoption of flipped classrooms by higher education institutions (HEI) has rapidly increased in recent years [
6]. The crucial factor in flipped classrooms is the electronic support that the HEI uses to disseminate knowledge among the learners. Encouraging learners to learn at their own pace, including through video lectures, frees up classroom time for more applied learning or active learning. Educators take support from various educational technologies to replicate the virtual classroom.
At Middle East College (MEC), different systems are in place to store student information. The student information system (SIS) stores the related academic data; the learning management system (LMS)—i.e., Moodle—is used as an e-learning tool to disseminate knowledge at the same time as online behavior is stored in the logs for each student; and the video streaming server (VSS) is used alongside Moodle to share video lectures to the students [
7]. As mobile culture is on the rise, an in-house built mobile application—eDify—has been developed to share video lectures to students since spring 2019, enhancing the teaching and learning process. With the use of eDify, the collection of students’ video interactions was made easy, providing valuable information about the learners. The data which these systems hold about the learners can be useful for enhancing the teaching and learning process. Learning analytics (LA) help HEIs to gain useful insights about their learners interacting with the system [
8,
9,
10,
11]. When videos are used to provide useful information about the learners, it is called video learning analytics (VLA) [
10,
12,
13,
14].
The study aimed to use systems such as SIS, LMS and eDify to explore students’ overall performance at the end of the semester. Education data mining is used to elucidate this issue as this uses predictive analysis on the data [
8,
15,
16]. The majority of the research suggests that the classification model can be used to predict success in HEIs using data related to student profiles and data logs from Moodle [
17,
18,
19]. Similarly, research has been carried out to predict student performance using videos, but little work has been done on using both systems to predict the students’ academic performance. The study attempts to predict student performance in HEIs using video learning analytics and data mining techniques to help faculty, learners and the management to make better decisions.
The contribution of this paper is threefold: (1) when the classification model is formed using interaction data from different systems used in the learning setting, we determine which algorithm and preprocessing techniques are best for predicting successful students; (2) we determine the impacts that feature selection techniques have on classification performance; and (3) we determine which features have greater importance in the prediction of student performance.
This paper is organized as follows:
Section 2 presents a literature review and an overview of related works in this field.
Section 3 presents the methodology used in the study.
Section 4 presents the results.
Section 5 presents the discussion on the study. Finally,
Section 6 draws a conclusion and proposes future research.
2. Literature Review and Related Works
2.1. Learning Analytics
LA is defined as the usage of data, statistical analysis, and explanatory and predictive models to gain insight and act on complex issues. LA involves the data analysis of the learners and their activities to enhance the student learning experience [
20]. Implementing LA allows higher education institutions to understand their learners and the barriers to their learning, thus ensuring institutional success and retaining a larger and more diverse student population, which is important for operational facilities, fundraising and admissions. Student success is a key factor in improving academic institutions’ resource management.
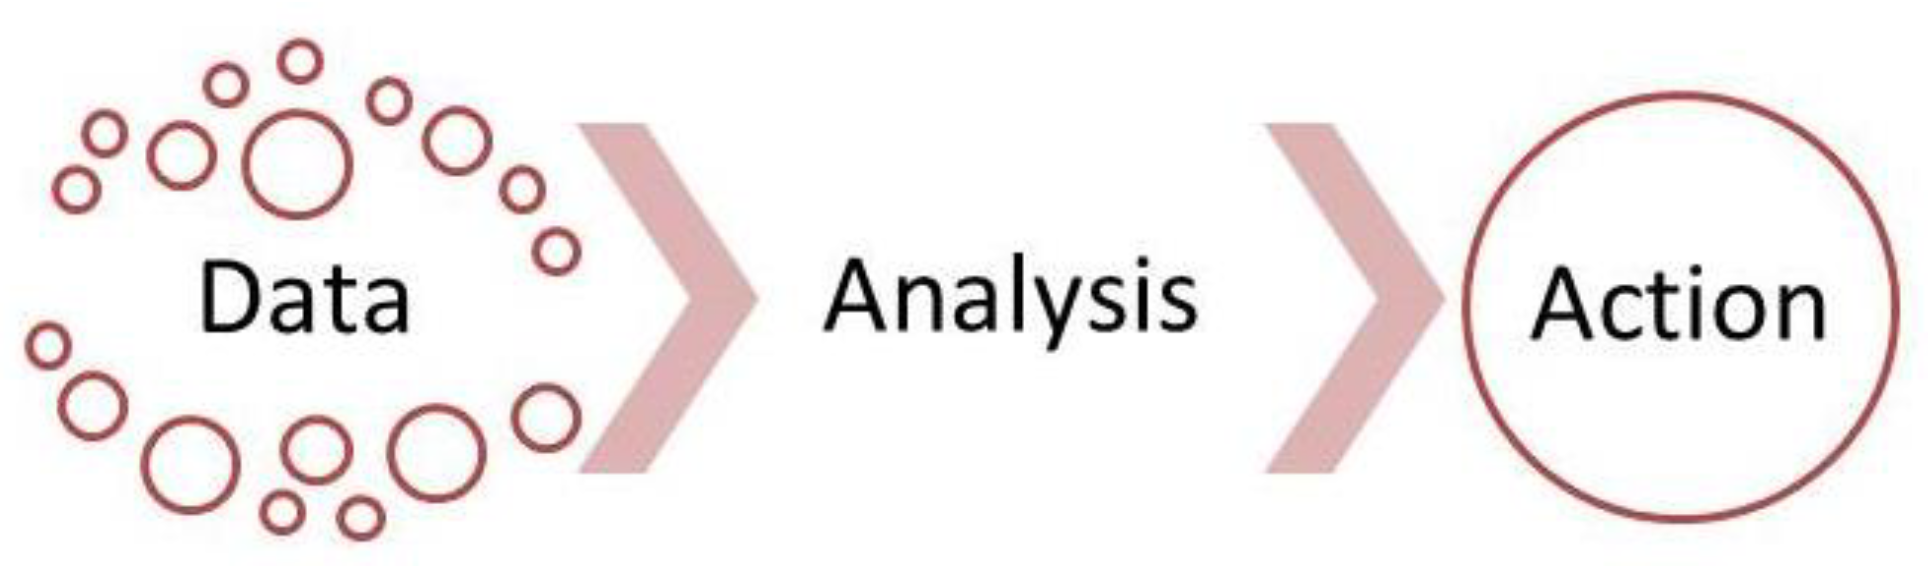
LA is the measurement, collection, analysis and reporting of data about learners. Understanding context is important for the purposes of optimization and learning and for the environments in which learning occurs [
21], as shown in
Figure 1.
Several studies have been conducted on LA to understand the students’ learning behaviors and to optimize the learning process. Thus, HEIs will able to identify the learners’ behavior and patterns to detect low achievers or students who are at-risk. Early warning systems are investigated in order to achieve these objectives. Predictive modelling is usually used to predict the learners’ end-of-term academic performance, with the data from different online learning systems being evaluated [
22]. Purdue university uses course signals which allow faculty to provide real-time feedback to the students. Grades, demographic data, learning management system (LMS) interaction data, grade history and students’ effort are measured with the help of LA. A personalized email is used to communicate with students about their current status with the help of traffic lights. The system helps to retain information, and performance outcomes are thus evaluated [
23]. Predictive analysis using PredictED emails students about their behavior to predict their end-of-semester grades with the help of LMS access logs [
24]. An LA study showed that students’ online activities correlate with their performance in the course, and a prediction can be made regarding the possible outcome of their performance at the end of the course [
25]. The study suggests that LA plays a vital role in affecting students’ perspectives and the way they learn in the different online settings [
26]. LA not only provides the educator with insights on the outcomes of the course, but also provides an opportunity for self-evaluation for the students [
9,
27].
2.2. Video Learning Analytics
VLA enables us to understand and improve the effectiveness of video-based learning (VBL) as a tool and its related practices [
28]. Flipped teaching is an important component of VBL, where an educator uploads a video lecture. The evaluation of this type of education can be enhanced through LA and can predict the students’ overall performance in the course. With the rapidly changing environments in teaching and learning, different technologies in VLA can help stakeholders, educators and learners to understand the data generated by these videos. Different research has been carried out to understand this relationship. Regarding the use of YouTube to upload lectures, quantitative data were analyzed by using the trends of the video interactions [
13]. The researcher used student interactions in the analyzed video to understand the students’ behavior and tried to predict the outcomes of their final scores with the help of machine learning. These interactions within the video are called the “Clickstream” [
28,
29]. Researchers use different data mining algorithms to predict student performance or for grade prediction [
12].
2.3. Educational Data Mining
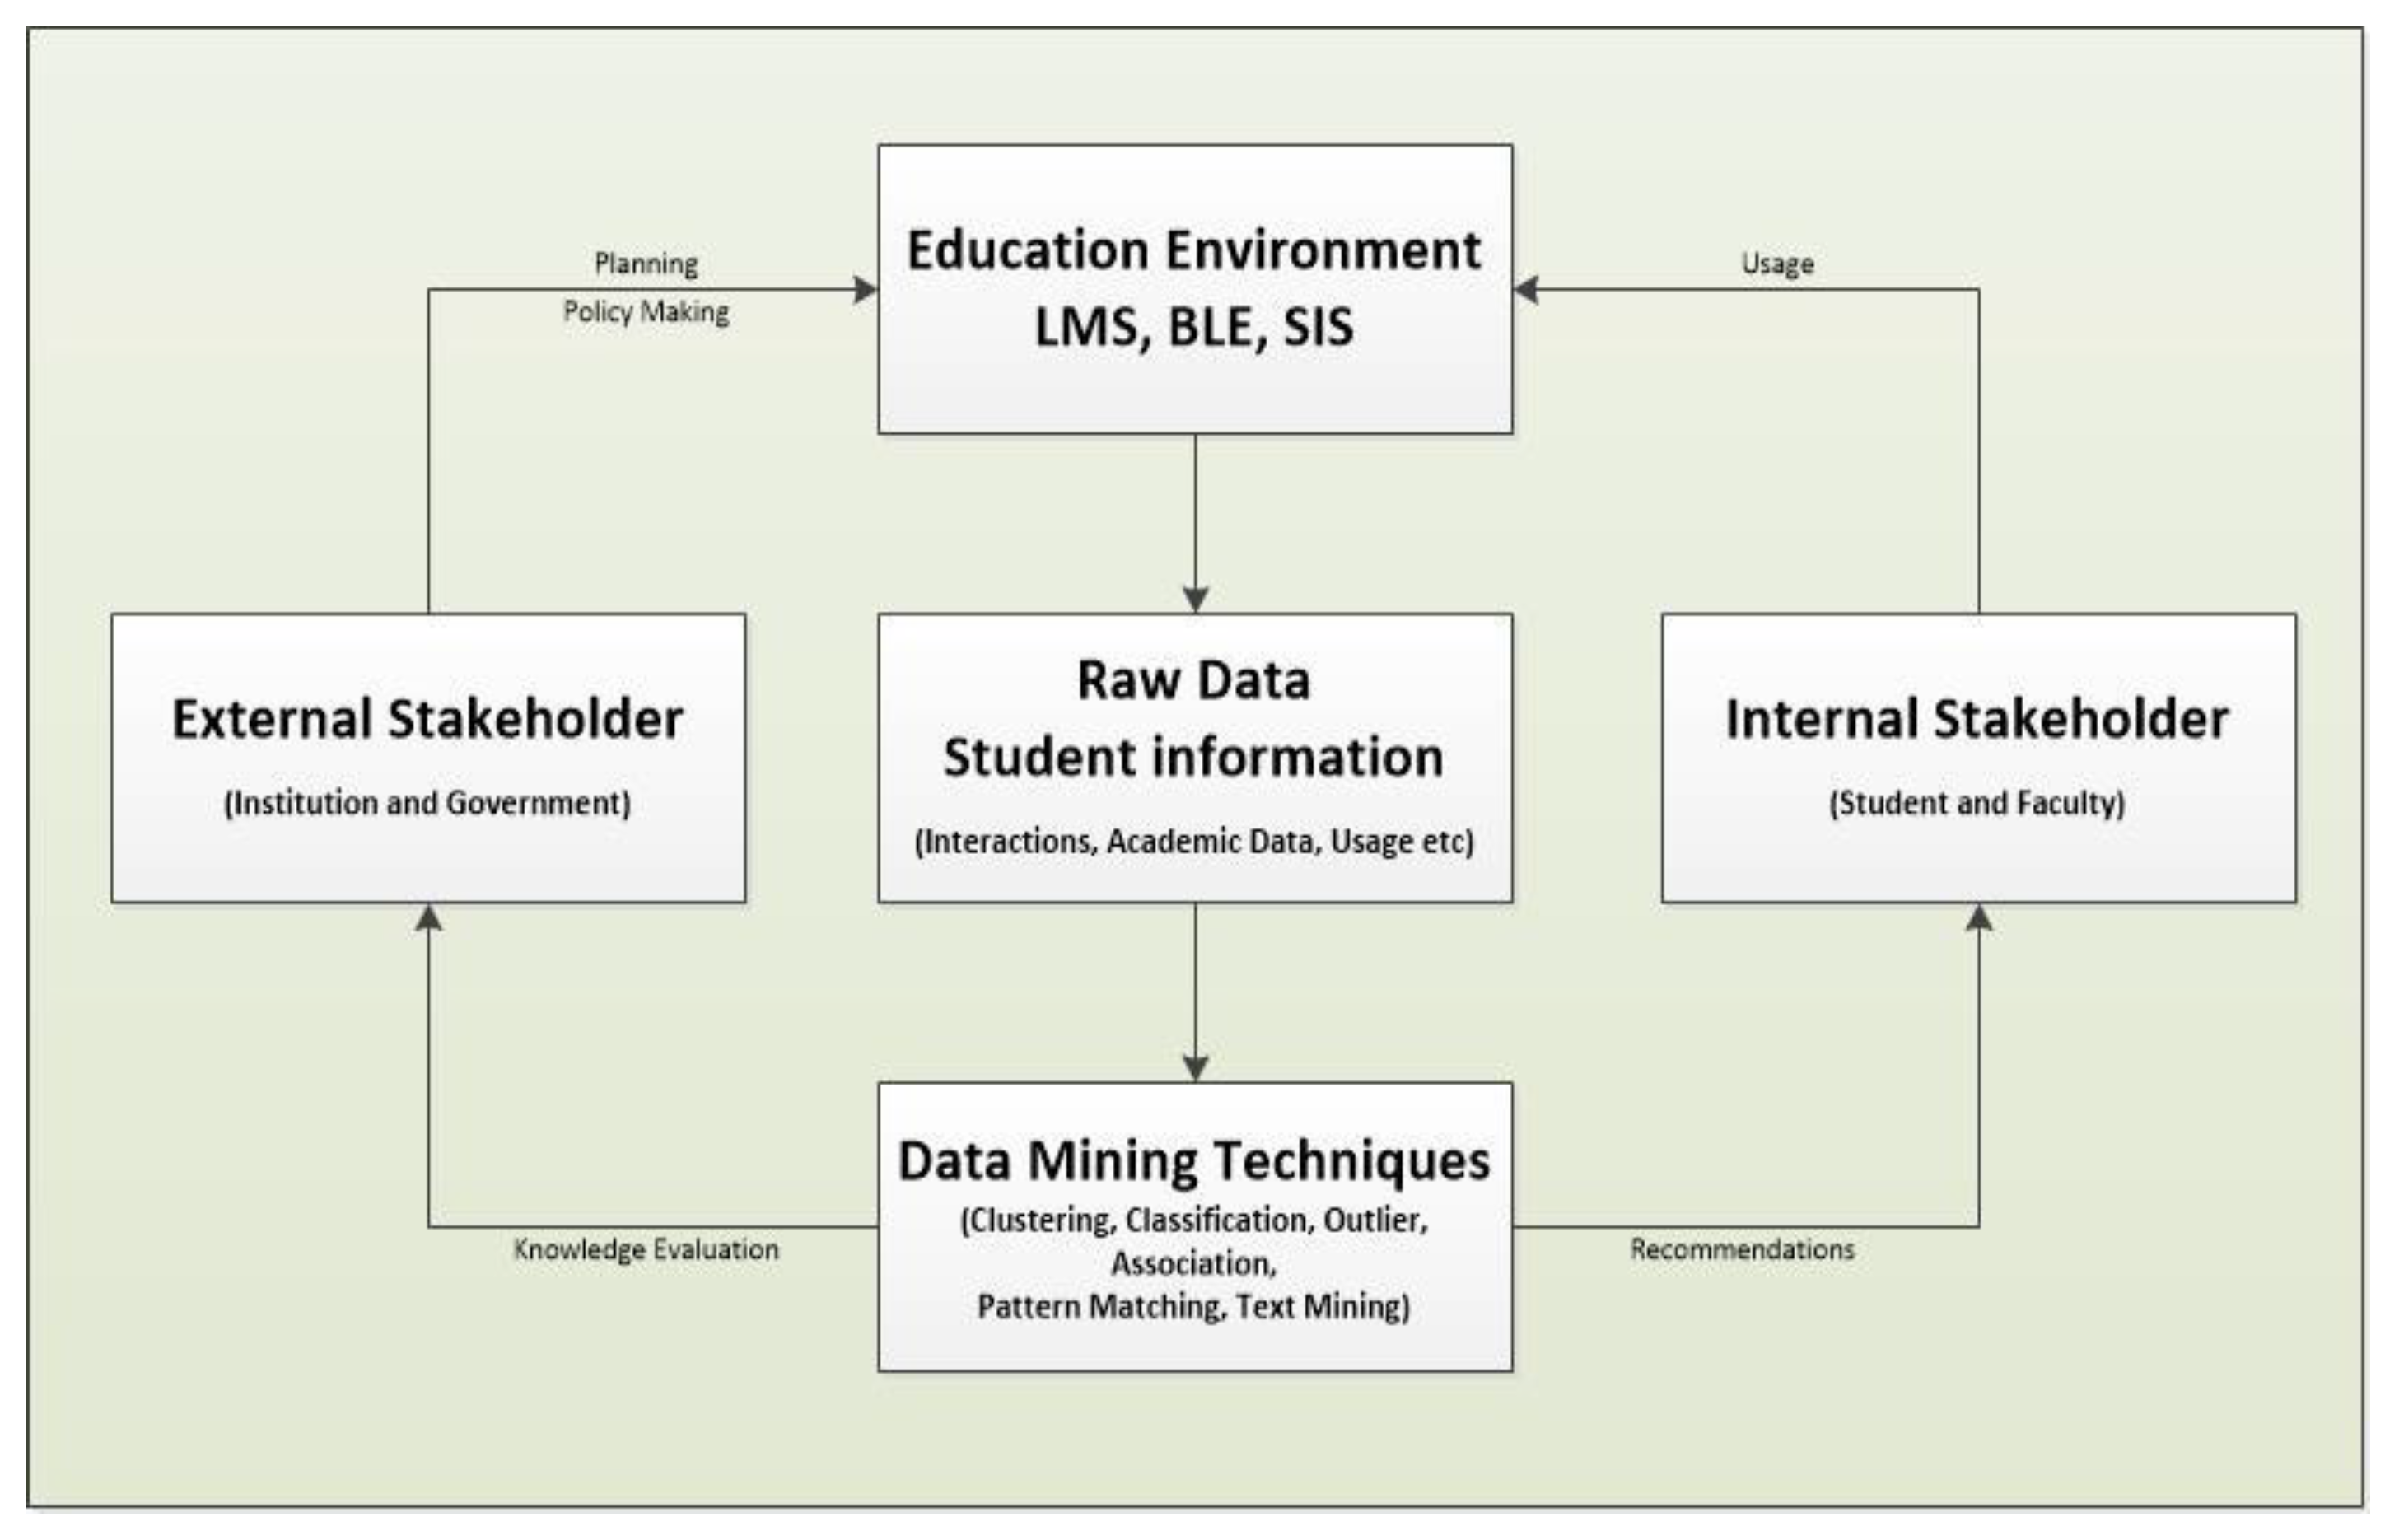
Data mining (DM) refers to the discovery of associable patterns from large datasets. It is a powerful tool in artificial intelligence (AI) and facilitates the categorization of data into different dimensions, identifying relationships and categorizing the information. This allows stakeholders to use the information extracted from DM and can help improve decision-making. Educational data mining (EDM) is a growing discipline which is used to discover meaningful and useful knowledge from data extracted from educational settings. Applying DM techniques, EDM provides researchers with a better understanding of student behavior and the settings in which learning happens, as shown in
Figure 2 [
18,
30].
The EDM process converts raw data from different systems used in HEIs into useful information that has a potential impact on educational practice and research [
32]. It is also referred to as Knowledge Discovery in Databases (KDD) due to the hierarchical nature of the data used [
18,
30]. The methods used for KDD or EDM are as follows.
2.3.1. Prediction
This is a widely used technique in EDM. Here, historical data are used in terms of student grades, demographic data, etc., to predict the future outcomes of the students’ results. Many studies have been carried out in which classification is most the commonly used method to make predictions. In order to achieve their research targets, researchers have used the Decision Tree, Random Forest, Naïve Bayes, Support Vector Machines, Linear Regression or Logistic Regression models, and K means approaches [
33,
34,
35,
36,
37,
38]. The studies mainly suggest the prediction of students’ academic performance either before the classes, at the middle of the session or at the end of the term.
2.3.2. Clustering
This is a process of finding and grouping a set of objects, called a cluster, in the same group based on similar traits. This technique is used in EDM, where student participation in online forums, discussion groups or chats is studied. Studies show that classification should be used after clustering. Researchers have used similar algorithms as those for prediction to determine students’ academic success [
39,
40,
41,
42].
2.3.3. Relationship
This method is used to look for similar patterns from multiple tables as compared to other methods. The methods commonly used to investigate relationships are association, correlation, and sequential patterns. The study suggests that, in EDM, an association rule should be used to predict students’ end-of-semester exam results and performance using heuristic algorithms [
43,
44].
2.3.4. Distillation
This recognizes and classifies features of the data, depicted in the form of a visualization for human inference [
18,
36,
45].
2.4. State-Of-The-Art
EDM aims to predict student performance either using demographic data or socio-economic data or online activity on the learning management system at different educational levels. A problem arises when the data are imbalanced or where researchers have used other techniques alongside a simple classification method such as data balancing, cost-sensitive learning and genetic programing [
8,
46]. Early dropout studies have been conducted by researchers to determine the factors that can influence student retention. Here, classical classification methods were also used to predict early dropout. Feature selection plays a vital role in the accuracy of the classification algorithms. The genetic algorithm was used and obtained 10 attributes out of 27, and the efficiency was improved [
47,
48]. For our study into handling imbalanced data, we use the K-fold cross-validation technique; to reduce features, we use ranking and scoring, the genetic search algorithm, principle component analysis and the multiview learning approach using multivariate projection along with the CN2 Rule induction for easier interpretation, as the multiview learning approach uses sparse data where a high percentage of the variable’s cells do not contain actual data.
HEIs use different learning systems and the amount of data accumulated from these systems is enormous. The LA provides the analysis of data from these systems and finds meaningful patterns which can be helpful for educators and learners. From the literature review and related works, it is evident that, when analyzing student academic performance prediction, LA is a widely used method in EDM. The classification technique is also used to classify the parameters used for the prediction and success of the model. Due to innovative teaching and learning pedagogies and the implementation of flipped classrooms, the use of VBL is on the increase, where students can study prior to the class at their own leisure and come prepared to the class. Little research has been carried out on VLA and on determining students’ attitude and behavior towards VBL. Educators apply different settings within or outside the classroom to create an effective learning experience for learners. For effective knowledge transfer, an educator needs a predictive model to understand the future outcomes for each student. This will help the educator to identify the methods which should be applied, to identify poorly performing students and provide better support to the students to obtain good grades at an early stage.
3. Methodology
The study is exploratory in nature. The quantitative prediction method is used for the study.
3.1. Educational Datamining Model
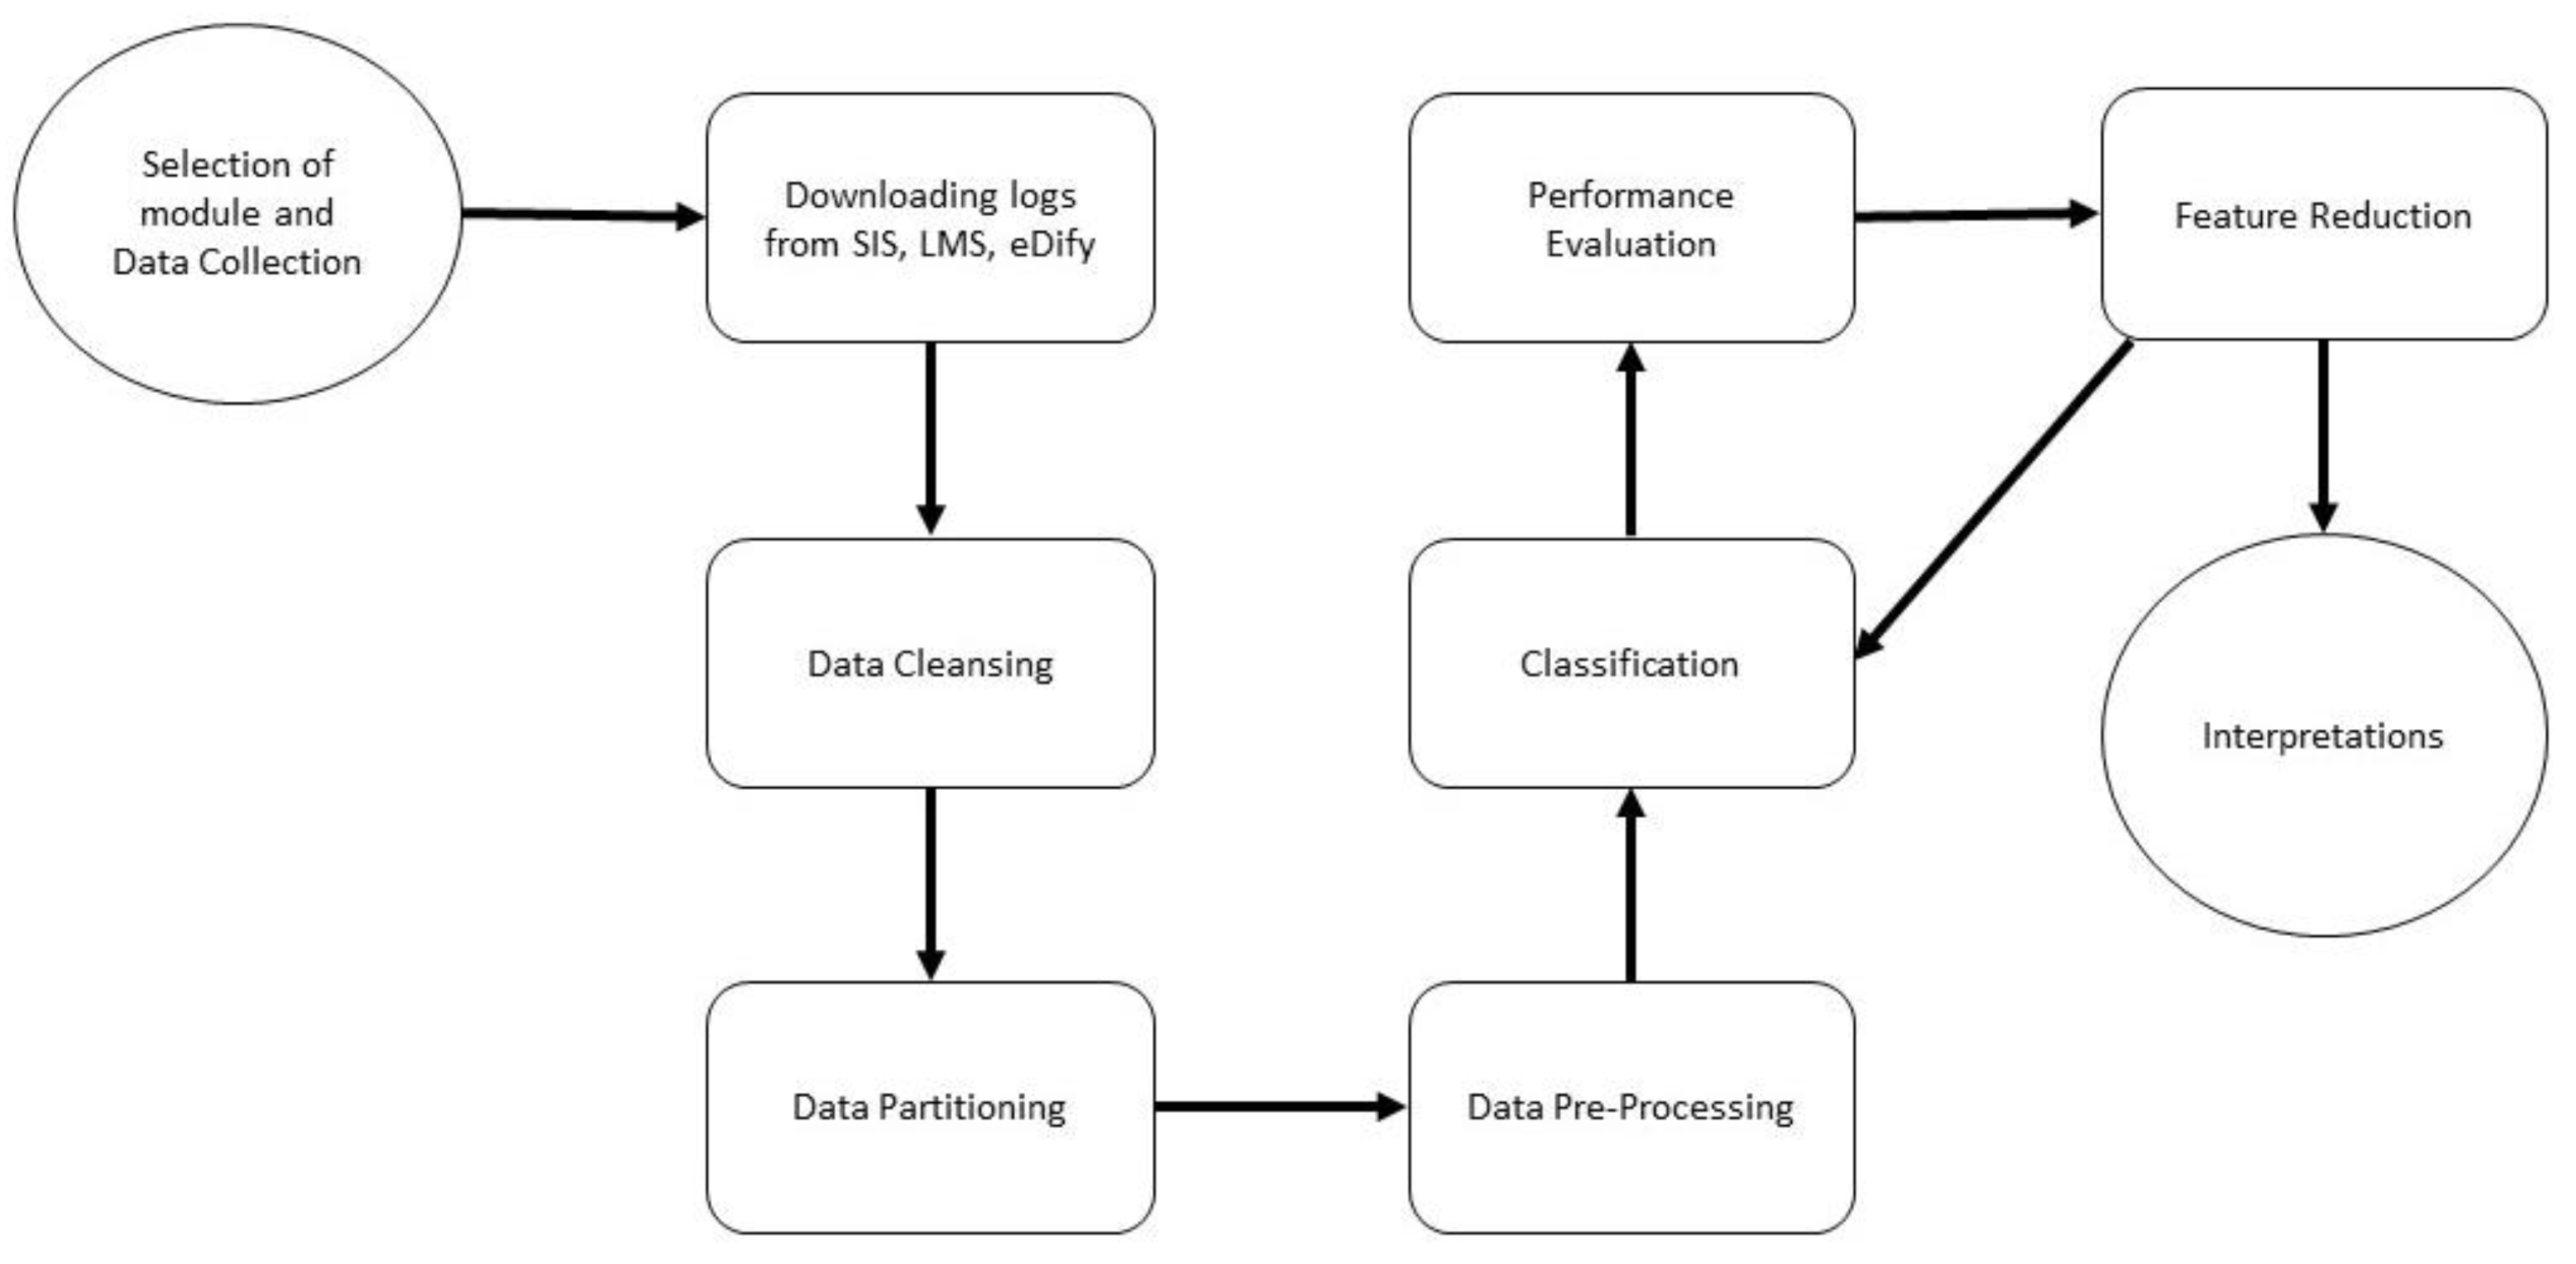
According to the literature review in the previous section, some of the important activities are recognized in educational datamining, as shown in
Figure 3. The classification method is used to predict student academic performance as a widely used method in prediction, as shown in the literature review. For this study, we also use the classification method, and the data are gathered from multiple systems which are already running in the HEI: student academic information is gathered from the student information system (SIS), student online activity from LMS Moodle and student video interactions data from eDify (mobile application). The algorithms used for this study are based on the frequently used algorithms form the existing literature: Classification Tree, Random Forest, k-Nearest Neighbors (kNN), Support Vector Machine (SVM), Logistic Regression, Naïve Bayes, Neural Network and CN2 Rule Induction.
3.2. Module Selection
The study was conducted at a private HEI in Oman with a dataset consisting of 772 instances of students registered in the sixth semester. The modules chosen were e-commerce (COMP 1008) and e-commerce technologies (COMP 0382). The reason for choosing these modules was that the modules are offered in different specializations, sharing the same course content and yielding the maximum number of students necessary for making the dataset.
3.3. Data Collection
Before starting data collection for any research, ethical approval is necessary. For this study, informed consent was obtained from the applicants, explaining the purpose of study and the description. There were “no potential risks” or discomfort while using eDify, but if the applicant, for any reason, felt discomfort or risk, they were able to withdraw from the study at any time. To ensure confidentiality and privacy, all the information from the study was coded to protect applicant names. No names or other identifying information were used when discussing or reporting data. Once the data was fully analyzed, it was destroyed. This research was voluntary and the applicant retained the right to withdraw from participation at any time; this was also communicated to the students when the semester started.
The data were collected from the Spring 2019 and Fall 2019 semesters after the implementation of eDify (mobile application) supporting VBL and by capturing students’ video interactions. Eight lecture videos were used in the module, but for study purposes, the data from all lecture videos were used.
3.4. Data Cleansing
In this activity, unnecessary data were cleansed and data were separated from information which was not relevant for the analysis. Historical data for each student registered in the two modules were considered for the study. In total, 19 features were selected for study, from which 12 features and one meta attribute was used from SIS; Moodle yielded two features related to the online activity within and outside the campus; and four features were selected from eDify.
3.5. Data Partionioning
After the data cleansing activity, data partitioning was performed. Relevant data were extracted and combined for further analysis, as shown in
Table 1.
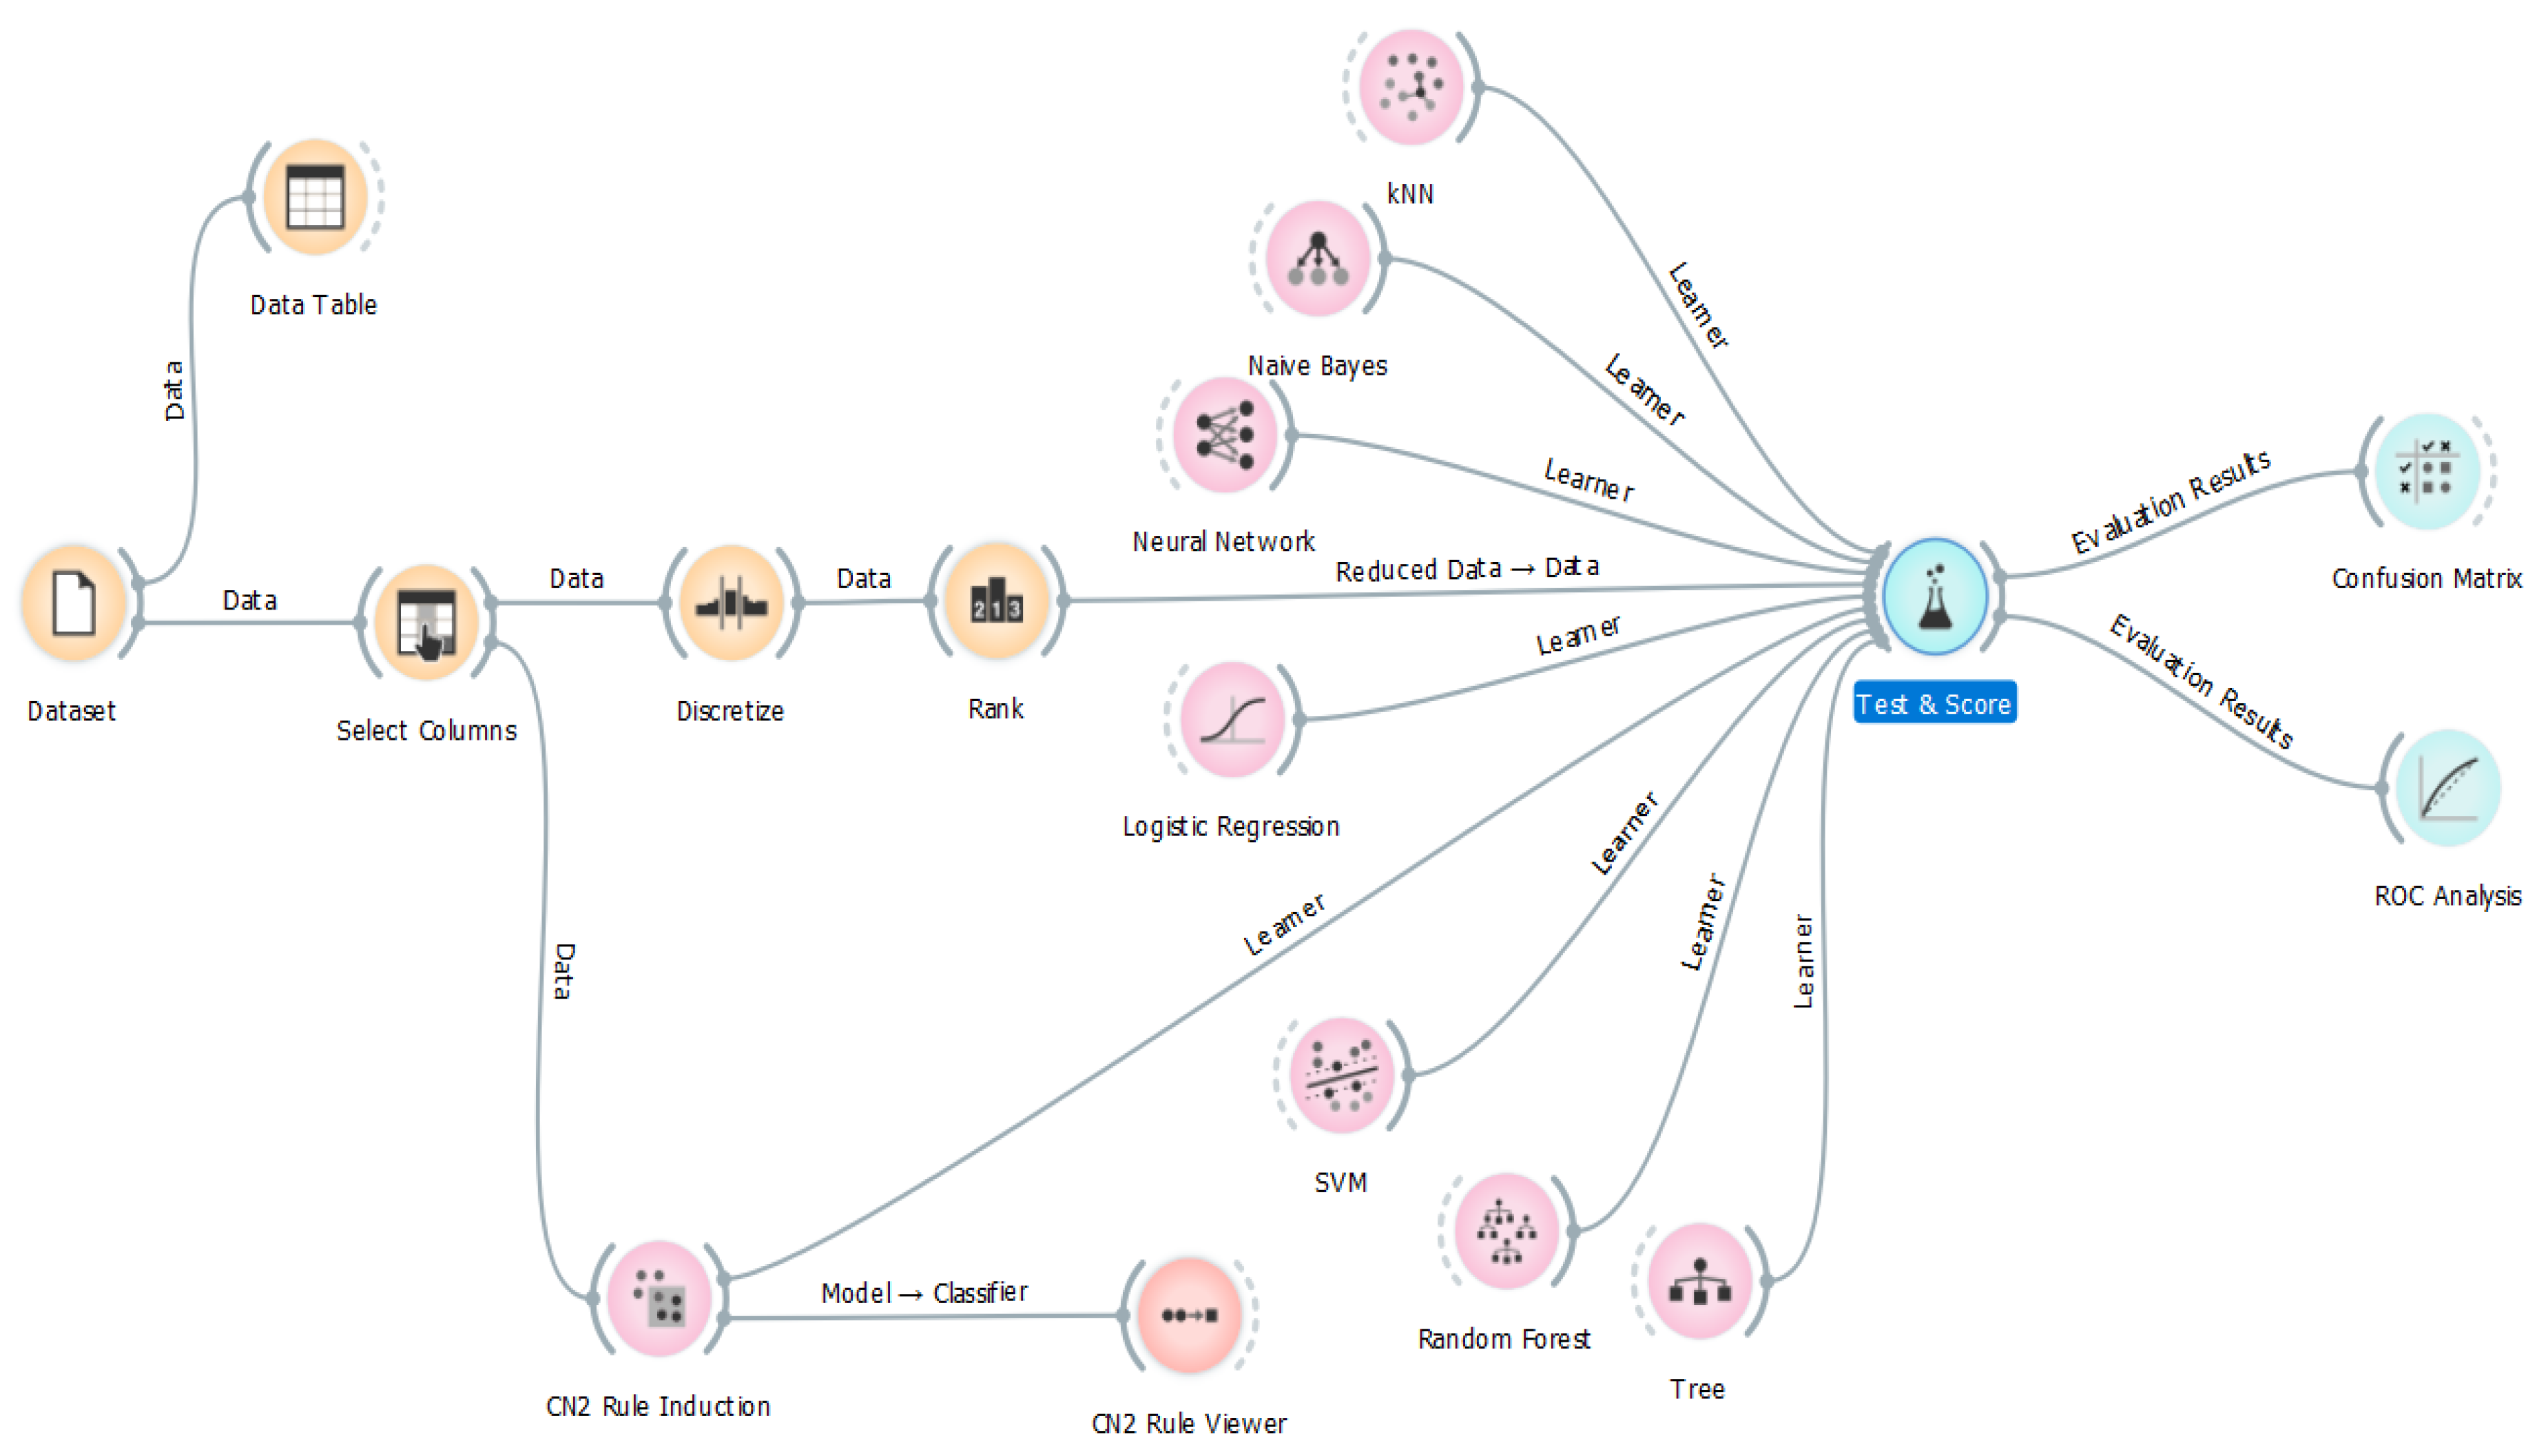
3.6. Data Pre-Processing
The main reason for testing several algorithms on the dataset was that their performance varies for the selected features. The study suggested that algorithms behave differently; depending on the dataset, the efficiency and performance may also vary. With this approach, it is easier to identify any one algorithm which suits the dataset with better accuracy and performance. For this purpose, a similar approach was used for this study. For the study, the Orange data mining tool was used in accordance with the process shown in
Figure 4 [
49].
Pre-processing methods were used to transform raw data collected from these systems into an understandable form.
Table 1 shows the features selected from SIS, where CGPA is converted into nominal order as excellent, very good, good, fair, adequate, or poor/fail; plagiarism count into low, medium, or high; coursework (CW)1 into pass or fail; CW2 into pass or fail; and end-of-semester evaluation (ESE) into pass or fail. Online activity was captured from Moodle in terms of minutes and is converted into nominal order as follows: activity on campus—low, medium, or high; and activity off campus—low, medium, or high. From eDify, four features—played, paused, likes/dislikes and segment—were selected, and discretization was applied on the continuous data to transform them into categorical data.
The dataset was fed into the analyzer, and the select column widget was used to select the features from the available variables. Student ID is the meta attribute, and the result was selected as the target variable. The discretize widget was used to transform the variable into categorical data in order to be used in the study. The rank widget scoring technique was used for feature selection, which could be used further for prediction. Information gain, gain ratio, and the Gini decrease weight were compared for the performance of the prediction model. Furthermore, the investigation of the feature selection proceeded using the genetic algorithm, and principle component analysis (PCA) was used to further reduce the features. Multivariate projection was used as an optimization method that finds a linear projection and associated scatterplot that best separates instances of separate classes, uncovering feature interactions and providing information about intra-class similarities.
3.7. Performance Evaluation
The performance of the classification algorithms was determined in the study; performance was based on the four standard evaluation metrics for accuracy, sensitivity, specificity and f-measure. A 10-fold cross-validation for comparison with the baseline method was used, splitting the data into 10 folds and using nine folds for training and one fold for testing. Confusion metrics were used for the analysis of supervised learning, where each column of the matrix represents the instances in a predicted class, while each row represents the instances in an actual class to avoid mislabeling as shown in
Table 2.
The entries in the confusion matrix have the following meaning in the context of a data mining problem: a is the correct negative prediction, also called true negative (TN), classified as failed by the model; b is the incorrect positive prediction, also called false positive (FP), classified as passed by the model; c is the incorrect negative prediction, also called false negative (FN), classified as failed by the model; and d is the correct positive prediction, also called true positive (TP), classified as passed by the model.
The performance metrics according to this confusion matrix are calculated as follows.
3.7.1. Accuracy
The accuracy (AC) is the proportion of the total number of predictions that were correct. It is determined using the following equation:
3.7.2. Sensitivity
The recall or TP rate is the proportion of positive cases that were correctly identified, as calculated using the following equation:
3.7.3. Specificity
The TN rate is the proportion of negatives cases that were correctly classified as negative, as calculated using the following equation:
3.7.4. F-Measure
The confusion matrix belongs to a binary classification, returning a value of either “passed” or “failed”. The sensitivity and specificity measures may lead to biased comments in the evaluation of the model, as calculated using the following equation:
4. Results
A supervised data classification technique was used to determine the best prediction model that fit the requirements for giving an optimal result. For analysis, the same set of classification algorithms, performance metrics and the 10-fold cross-validation method were used.
4.1. No Feature Selection and Transformation
The CN2 Rule Inducer and Random Forest algorithm exhibited a performance rate of 85.1%, as shown in
Table 3. Further investigating the performance metrics of the CN2 Rule Inducer showed good sensitivity, levelling-out the lower specificity and giving a good F-measure score. When no data transformation and no feature selection were undertaken, the CN2 rule inducer showed the highest classification accuracy.
4.2. No Feature Selection and Equal Frequency Transformation
When data transformation was applied with equal frequency, the Random Forest algorithm predicted with an accuracy of 85%, as shown in
Table 4. The predicted scores were similar to the previous results when no data transformation and no feature selection were applied, as shown in
Table 3.
4.3. No Feature Selection and Equal Width Transformation
When data transformation was applied with equal width, the Random Forest predicted with an accuracy of 85.5%, as shown in
Table 5. From the analysis, it was found that the equal width data transformation technique can be further investigated with feature selection, as the result showed slight improvements.
4.4. Information Gain Feature Selection and Equal Width Transformation
The tree-based algorithm showed improvements in accuracy when a data transformation of equal width was applied with the ranking technique, utilizing the scoring methods provided by the Orange data mining tool. The accuracy of Random Forest increased from 85.5% to 87.6%, the CN2 Rule Inducer increased from 85.1% to 87.3%, and Classification Tree increased from 84.3% to 87.2% when the information gain feature was selected. The nine selected features were found in all the three scoring methods—CW1, ESE, CW2, likes, paused, played, segment, Moodle on campus and Moodle off campus. SVM performed worse compared to others, but the accuracy of SVM was slightly improved from 82% to 82.5%, as shown in
Table 6.
4.5. Information Gain Ratio Feature Selection and Equal Width Transformation
Random Forest’s accuracy was improved by 0.7% with better sensitivity and F-measure when the equal width data transformation technique and information gain ratio technique were applied. The CN2 Rule Inducer improved by 0.1% with less sensitivity and better specificity. Interestingly, Classification Tree, Logistic Regression, Naïve Bayes, Neural Network and SVM showed no sign of improvement and remained unchanged. kNN’s performance was decreased by 3% from the previous example, as shown in
Table 7.
4.6. Gini Decrease Feature Selection and Equal Width Transformation
Data transformation with equal width and the feature selection of Gini decrease reduced the overall accuracy of all the selected algorithms in the study, except the Neural Network, as shown in
Table 8. Although kNN performed well compared to the other classification algorithms, its accuracy was less than the information gain, as shown in
Table 6. Thus, the Gini decrease method was omitted as the accuracy was not enhanced, as shown in
Table 8.
4.7. Feature Selection Using Genetic Algorithm and Classification
Due to the limitation of the Orange tool to run the genetic algorithm for feature selection, Weka (Waikato Environment for Knowledge Analysis) was used on the same dataset for feature selection using genetic search. Before applying classification algorithms in Orange, relevant features were selected by using feature selection method. Feature selection was performed by using the genetic algorithm, and applicant, at-risk, CW1, CW2, ESE and played were selected. Tree predicted with an accuracy of 87.4%, as shown in
Table 9. Feature selection using the genetic search reduced the features to six as compared to the information gain ratio feature selection technique and equal width transformation, but the accuracy was not improved, as shown in
Table 7.
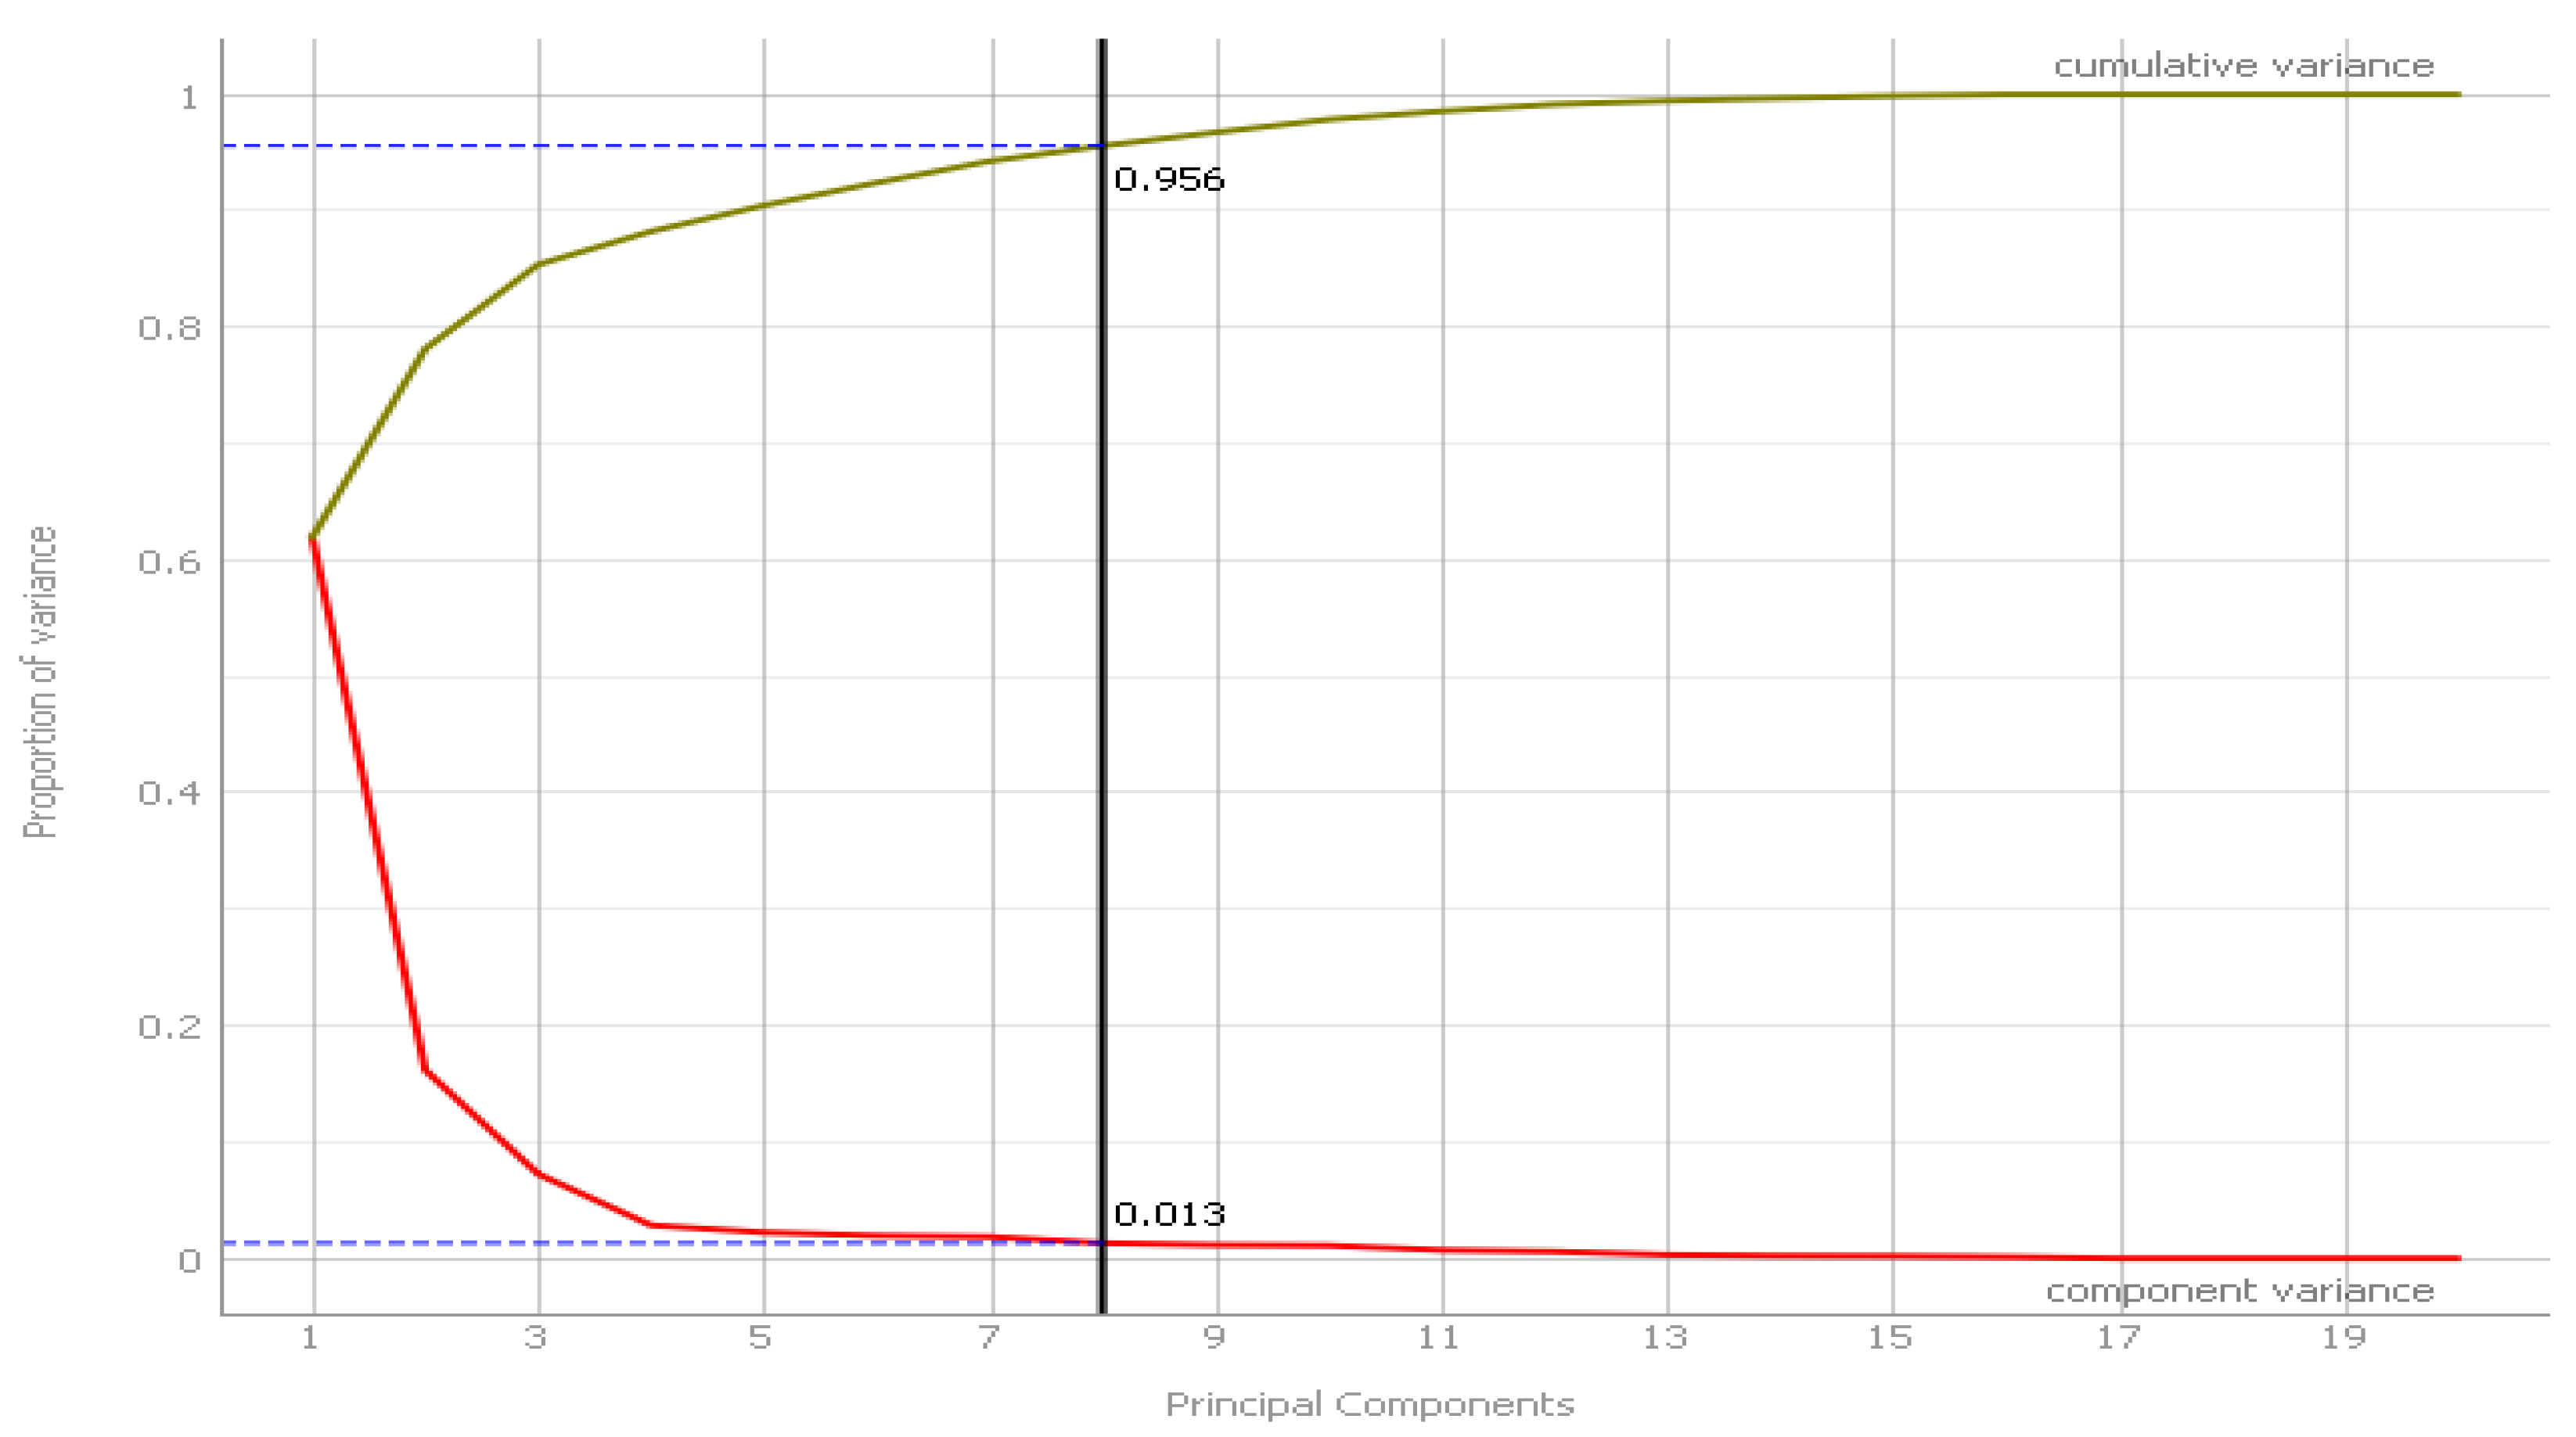
4.8. Principal Component Analysis
A principle component analysis (PCA) was undertaken to reduce the number of variables from 19 to eight components with a variance of 95.6%, as shown in
Figure 5.
Table 10 shows the PCA component variances.
PC1 shows that a video being played and paused and the segment correspond to the behavior of a video being watched. PC2 shows that a video being played and the segment correspond to the behavior of a video being watched and rewound. PC3 shows that CGPA indicates high academic achievers. PC4 shows that at risk, ESE and likes correspond to the behavior of a student being at risk; those who scored fewer marks in the ESE will like video content. PC5 shows that plagiarized, likes and Moodle activity outside campus correspond to the behavior of a student who is weak in academic writing but likes the video and watches the video outside the campus. PC6 shows that attempt count, at risk, plagiarized, CW1, CW2 and Moodle activity in campus correspond to the behavior of a weak student that spends time on Moodle inside the campus to get better grades in the ESE. PC7 shows that not at risk, plagiarized, CW1, ESE and Moodle activity outside the campus correspond to the behavior of weak students who spend time on Moodle activities outside the campus. PC8 shows that not at risk, plagiarized, CW1, CW2, likes, Moodle activity inside the campus, and less Moodle activity outside the campus correspond to the behavior of weak students, with the attributes in common that they spend time on Moodle both inside and outside the campus.
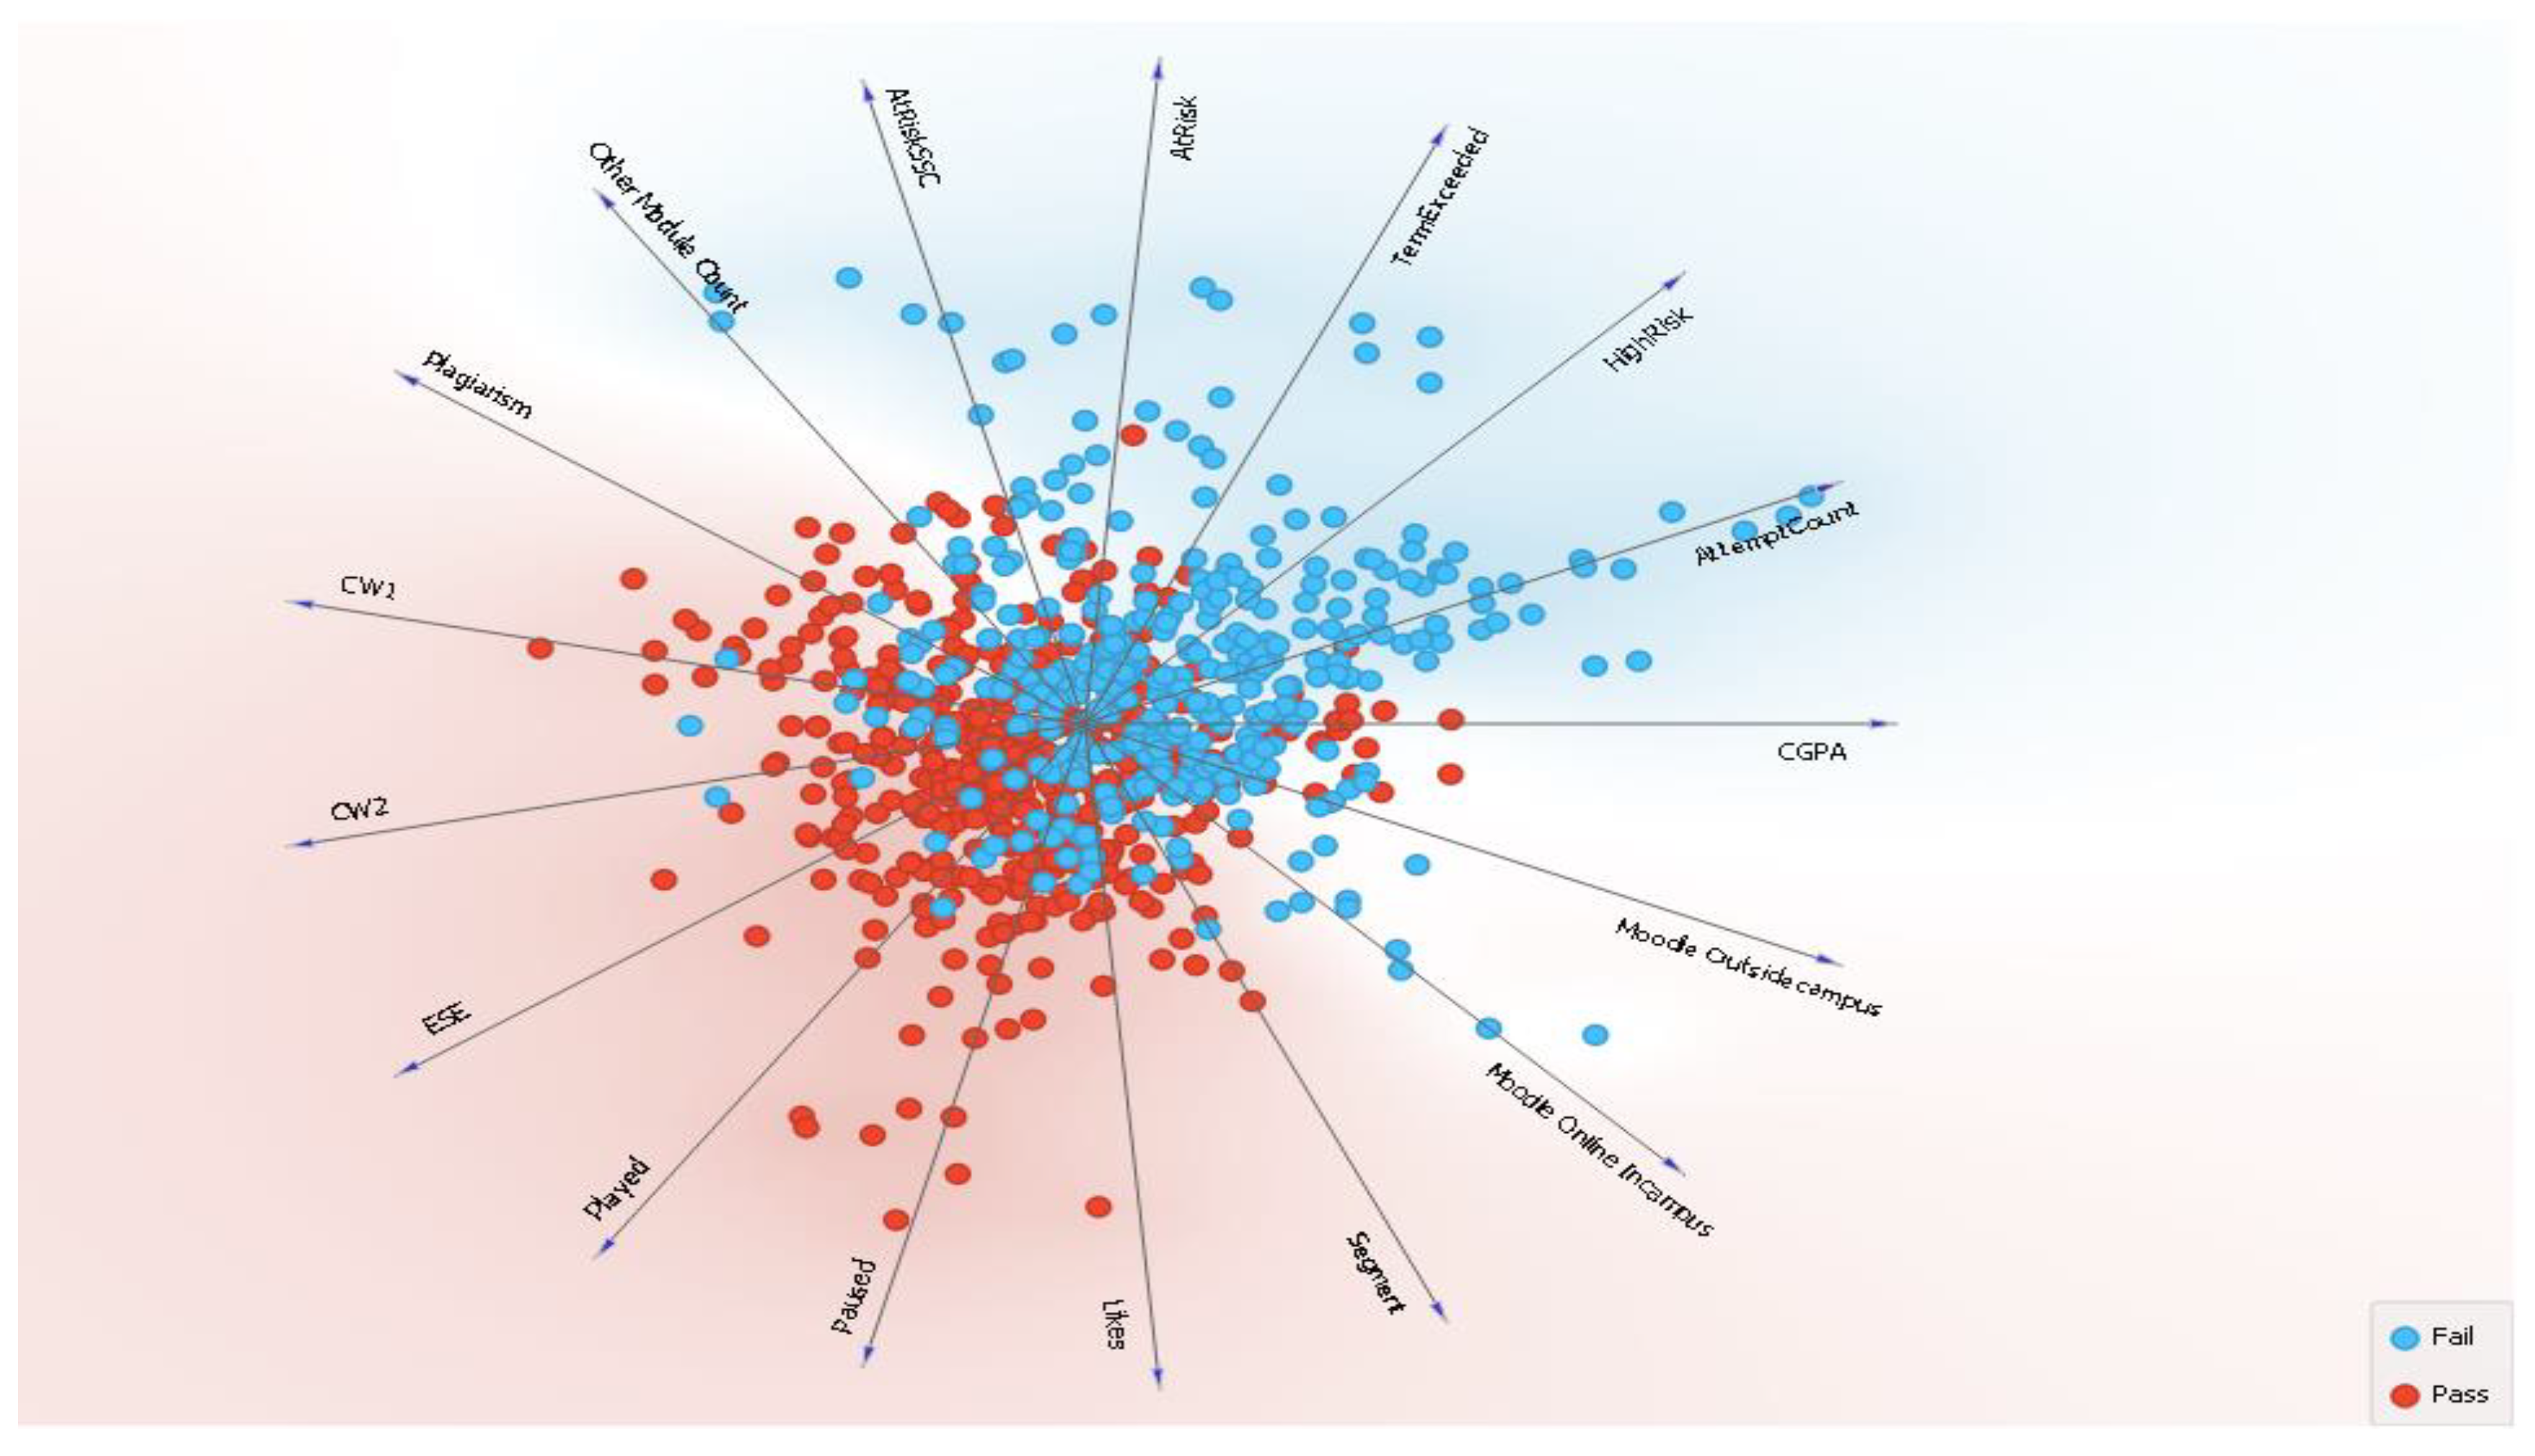
4.9. Multivariate Projection
Multivariate visualization is one of the tools used in datamining and provides the starting point in an explorative study. With an increasing number of features, it requires some automatic means of finding good projections that would optimize criteria of quality and expose any inherit structure in the data. FreeViz is used for multivariate projection, which optimizes the linear projection and displays the projected data in a scatterplot. The target projection is found through a gradient optimization approach [
50].
Figure 6 depicts the multivariant projection on the dataset; based on the target variable, the projection is made, and two clusters are easily visible. First, the cluster “pass” identified students that passed the module, with relationships in CW1, CW2, ESE, played, paused, likes, segment and Moodle activity either on campus or outside, all of which play a significant role in their overall pass performance; the second cluster, “fail”, identified students that failed the module, with relationships in at risk, SSC, high risk, term exceed, at risk, attempt count, CGPA and Moodle activity within the campus.
4.10. CN2 Rule Viewer
CN2 Rule Inducer has a closer accuracy to Random Forest;
Table 11 depicts the rules set by CN2 Rule Inducer. Out of 45 rules, only 23 rules were selected based on either Moodle activity or video interactions or both. The reason for selecting CN2 Rule Inducer was because it is easier to interpret for non-expert users of data mining. For this case, it would be easier for a faculty member to determine the probabilities of student interactions within the learning setting systems. The interpretation of the rules set by CN2 Rule inducer is that there is a high probability—92%—that a student will pass the module if the student is available on Moodle when active on campus and he/she played the video at least three times or more. A student is likely to pass the module with a probability of 75% if there is Moodle activity in and outside the campus. A student has a high chance of passing the end-of-semester examination if they engaged in the activities outside the campus on Moodle, played the video more than once and paused the video at least three times or more, with a probability of 94%. A student spending time on Moodle activities on campus has a fair chance of passing the module, with a probability of 83%. The student is likely to pass the module if they use Moodle outside the campus and like a video which they paused either twice or more. A video being paused more than or equal to 10 times and accessing Moodle outside the campus indicates a probability of 67% that the student will not be successful at the end semester examination. A student playing a video equal to or more than five times and exhibiting activity Moodle outside the campus has a probability of 90% of passing the module. If the student pauses a video more than or equal to four times and has low Moodle activity, they are likely to pass the module with a probability of 83%. If a student likes the video content equal to or more than twice with little Moodle activity outside the campus, they have a chance of 88% of passing the module. A student has a probability of 87% of passing the module if the student has Moodle activity outside the campus and played the video at least twice. Students’ CW1 marks are important, as if the student failed the CW1 and played the video equal to or less than twice along with rewinding to capture the concepts, they have a chance of 75% of passing the module. A student playing the video content many times, such as more than or equal to five times, and pausing the video many times has a 91% chance of passing the module. A student who engages in rewinding and listening to the content many times has high chances, at 93%, of passing the module. For video content, a student who pauses the videos many times and moves slowly to gather the concepts has an 80% probability of passing the module, but if the frequency is more than or equal to 13 times, the student has an 83% chance of failing the end-of-semester examination. If a student failed in CW1 and exhibits low activity on Moodle on campus, there are high chances of failure in the module, at 90%. If a student plays the video content at least twice, with a low activity on Moodle outside the campus, and pauses the video much more than seven times, they have high chances of passing the module, at 90%. If a student passed in CW1, plays the video at least twice, exhibits a high activity on Moodle outside campus and likes the video more than once, they have high chances of passing the module at 80%. If a student pauses the video less than four times, exhibits a high activity on Moodle outside campus and plays the video more than twice, they have high chances of passing the module, at 90%. Playing video content more than or equal to five times gives a high probability of 83% that the student will fail in the module. Similarly, if the video is paused more than or equal to seven times, the probability goes to 62%. Playing a video up to four times results in a probability of 71% of a student passing the module. It is evident from the analysis and visualization projection (
Figure 5) that videos being played, paused, segments and likes along with either in-campus or off-campus use can enhance learning as compared to the normal setting in which this opportunity was not available.
5. Discussion
The study was conducted to create a model that can predict students’ end-of-semester academic performance in the modules e-commerce (COMP 1008) and e-commerce technologies (COMP 0382). End-of-semester results from these two modules were taken into consideration as the performance indicators and were considered as target features. The data of students from these modules was collected using three different systems such as SIS (student academics), LMS (online activities) and eDify (video interactions). Firstly, the performance of the most widely used classification algorithms was compared using the complete dataset. Secondly, data transformation and feature selection techniques were applied to the dataset to determine the impact on the performance on the classification algorithms. Lastly, we reduced the features and determined the appropriate features that can be used in order to predict the students’ end-of-semester performance. Four performance metrics—accuracy, sensitivity, specificity and F-Measure—were evaluated in order to compare the performance of the classification models.
The effect of data transformation on classification performance was tested by converting the features into a categorical form using the techniques of equal width and equal frequency. Results indicated that models with categorical data performed better than those with continuous data. Observation showed that equal width data transformation performance results were better compared with equal frequency data transformation.
The impact of feature election on classification performance was tested. For this purpose, a ranking and scoring technique was used with three feature selection methods: information gain, information gain ratio and Gini decrease. Nine features were determined from ranking and scoring techniques—CW1, ESE, CW2, likes, paused, played, segment, Moodle on campus and Moodle off campus—and were tested regarding the performance of the classification models.
Moreover, feature selection using the genetic algorithm was used to further reduce the features. The features were reduced from nine to six: applicant, at risk, CW1, CW2, ESE and played. Here, a meta attribute was selected and the Moodle activity feature was not selected. The performance of the classification model accuracy was less than the data transformation method and the information gain ratio selection technique. Then, a PCA analysis was performed to reduce the features with a variance of 95.6%; PCA derived eight component solutions. The feature selection method enables the prediction model to be interpreted more easily. However, PCA resulted in one fewer component, and it is difficult to interpret for a normal faculty member from a different specialization field.
Furthermore, multivariate projection using a gradient optimization approach and CN2 Rule viewer was used to interpret the relationship within the dataset and the features. Relationship, features that were extracted with help of data transformation method and information gain ratio selection technique showed a resemblance which enhances the understanding for the novice users..
From the results of this study, we can conclude that Random Forest provides a high classification accuracy rate in conditions where equal width data transformation method and information gain ratio selection techniques were used (
Table 7). The Random Forest outperformed the other selected algorithms in predicting successful students. The confusion matrix for 10-fold cross-validation derived via Random Forest is provided in
Table 12. The classification model correctly predicted 629 students out of 645 students, with an accuracy of 88.3%.
6. Conclusions and Future Works
In this study, a supervised data classification model is proposed with the aim of predicting student academic performance at the end of the semester. Two modules were selected for the study based on the similarity of the course content. The dataset consisted of student academic data gathered from SIS (student academics) and performance in the modules using two different learning environments; i.e., Moodle (LMS) and eDify (mobile application). Activities performed by students in Moodle on campus and outside campus were used. Video interactions (clickstreams) of students in eDify were used for prediction. In total, 18 features and one meta attribute were used to form the dataset, 12 features were extracted from SIS, 2 from Moodle, four from eDify and one result was used as the target feature for prediction. The dataset consisted of 772 samples from one academic year. The complete dataset was tested with eight classification algorithms derived from the literature review and related works.
The Tree-based classification model—specifically, Random Forest—outperformed the other techniques with an accuracy of 88.3%. This accuracy was achieved using the equal width data transformation method and information gain ratio selection technique. To identify which features have greater importance in the prediction of student performance, features were reduced using the genetic algorithm and PCA. The result was inconclusive as the reduced features have low significance in predicting student performance. Multivariate analysis was conducted to inspect the correlations, and nine variables were selected using scoring and ranking techniques to successfully predict the students’ academic performance. Thus, the results obtained with reduced features were better than those using all the features. The CN2 Rule Inducer algorithm was the second-best performing algorithm, showing 87.4% accuracy. The reason for using CN2 Rule Viewer is that it provides rules induction with probability, which is easier to interpret for non-expert users such as faculty who can therefore easily relate to the situation, as shown in
Table 12.
For future work, a dashboard with data representations from these virtual learning environments would help in projecting the students’ performance and interactions. Predicting the students’ performance and outcomes on a weekly basis could help faculty to identify poor-performing students. This can act as an early alert system for faculty to intervene with any problems faced by the students within the module. Students could also self-assess their own performance within the module with the help of a dashboard.

 ,
, 


