Article

Development and Characterization of a DC-Driven Thermal Oscillator Using Acrylate-Based Composites

Department of Mechanical Engineering, National Taiwan University, Taipei 10617, Taiwan
*
Author to whom correspondence should be addressed.
Appl. Sci. 2020, 10(11), 3825; https://doi.org/10.3390/app10113825
Submission received: 24 April 2020 / Revised: 25 May 2020 / Accepted: 29 May 2020 / Published: 31 May 2020
(This article belongs to the Special Issue Phase Transitions in Polymer and Polymer-Based (Nano)Composites)

Abstract

:
This paper presents the design, fabrication, and characterization of a thermal oscillator driven by fixed DC voltages. The proposed device consists of a miniaturized ultra-sensitive temperature sensor and a microheater. The temperature sensor was fabricated by depositing acrylate-based temperature sensing material with a positive temperature coefficient (PTC) effect on an interdigital electrode pair, and this was the key component that enabled oscillations by periodically switching the microheater on and off. The acrylate-based material, which was prepared by dispersing an acrylate copolymer with graphite particles, exhibits an order-of-magnitude variation in resistivity over a temperature change of a few degrees. The transient behavior of the fabricated device was measured, and the effects on different driving conditions with active cooling were measured and discussed. In addition, the measurement results also show that the temperature drift is not obvious in long-term testing, which indicates that the acrylate composite is quite reliable during repeated phase transition.

1. Introduction

Studies on conductive polymer composites (CPCs) have received significant attention because of these composites’ potential applications in various industries [1,2,3,4,5]. In general, CPCs comprise single or multiple conductive fillers (e.g., graphene [6], carbon nanotubes [7], metal powders [8], silver nanoparticles [9], and separated conductive polymers [10]) dispersed in a polymer matrix. The positive temperature coefficient (PTC) effect, which is a phenomenon found in many composite conductive polymers, was first observed in the carbon black-filled low-density polyethylene composite by Frydman [11] in 1945. The resistivity of materials with PTC effects exhibits order-of-magnitude variations over a temperature change of a few degrees.
Many theories that describe the microscopic behaviors giving rise to the PTC effect have been reported. One of the theories considered that the PTC effect is caused by the fact that the polymer matrix expands more than the conductive fillers as the temperature increases, and, subsequently, the compressive force on conductive fillers decreases. As the temperature increases to a certain point, a very sharp increase in the resistivity of the polymer is observed [12]. Additionally, Ohe et al. speculated that the distribution of inter-grain gaps among graphite particles is comparatively uniform when the temperature is relatively low. As the temperature increases, the inter-grain gaps become random, which results in a sharp increase in resistivity and gives rise to the PTC effect [13]. In addition, the mechanism of the PTC effect could be attributed to the thermal expansion of the crystalline polymer during melting, which leads to the breakdown of the conductive network of fillers [14]. The above-mentioned theories have addressed various viewpoints regarding the mechanisms of the PTC effect, but the actual nature of the PTC effect has not yet been determined [15,16]. Nevertheless, it is generally accepted that the thermal expansion of the polymer matrix near the melting temperature gives rise to the rapid resistivity increase when the temperature increases.
Studies on PTC materials have attracted attention during the past decades because PTC materials can be easily employed as temperature-sensing elements. A self-adjusting heating device fabricated by connecting different types of PTC materials in series was proposed [17]. Additionally, Skindhoj et al. presented reusable current limiters realized by using materials with the PTC effect. The proposed devices limit electric current by increasing their resistance when the current exceeds the designated values [18]. Printable thermal sensors based on acrylate polymers and graphite were reported. The sensors exhibit large resistance changes near body temperature under physiological conditions with high repeatability and short response times [19]. In addition, gas sensors were realized by employing conductive carbon-black particles, of which the surface was successfully modified by grafting PE-b-PEO using a two-step method. The electric resistance of the composite increased by several orders of magnitude in several solvent vapor samples [20]. Furthermore, PTC material was used as the additive on the electrodes of a lithium-ion battery for cutting off charge transportation paths in the vicinity of internal short sites before the local temperature of the battery reaches the onset of thermal runaway [21].
These aforementioned studies demonstrated various applications of PTC materials. However, to the best of our knowledge, the oscillating behaviors induced by the temperature-sensitive resistance variation of PTC materials have not yet been reported. In this work, we present a PTC-based electrothermal oscillator by employing an ultra-sensitive temperature sensor for self-switching a microheater on and off with a DC power supply. The proposed device consists of a miniaturized ultra-sensitive temperature sensor and a microheater. The temperature sensor was realized by depositing an acrylate-based temperature-sensing layer with the PTC effect on an interdigital electrode pair. The temperature sensor cuts off the supply current to the microheater when the resistance of the PTC composite increases significantly, which, in turn, produces the switching behaviors. A C-shaped planar heat sink is employed to speed up the cooling process.
The remainder of this paper is organized as follows: The working principle and the device design are introduced in Section 2. The fabrication process of the proposed device is described in Section 3. Section 4 presents the measurement results and discussion. Finally, a conclusion is offered in Section 5.

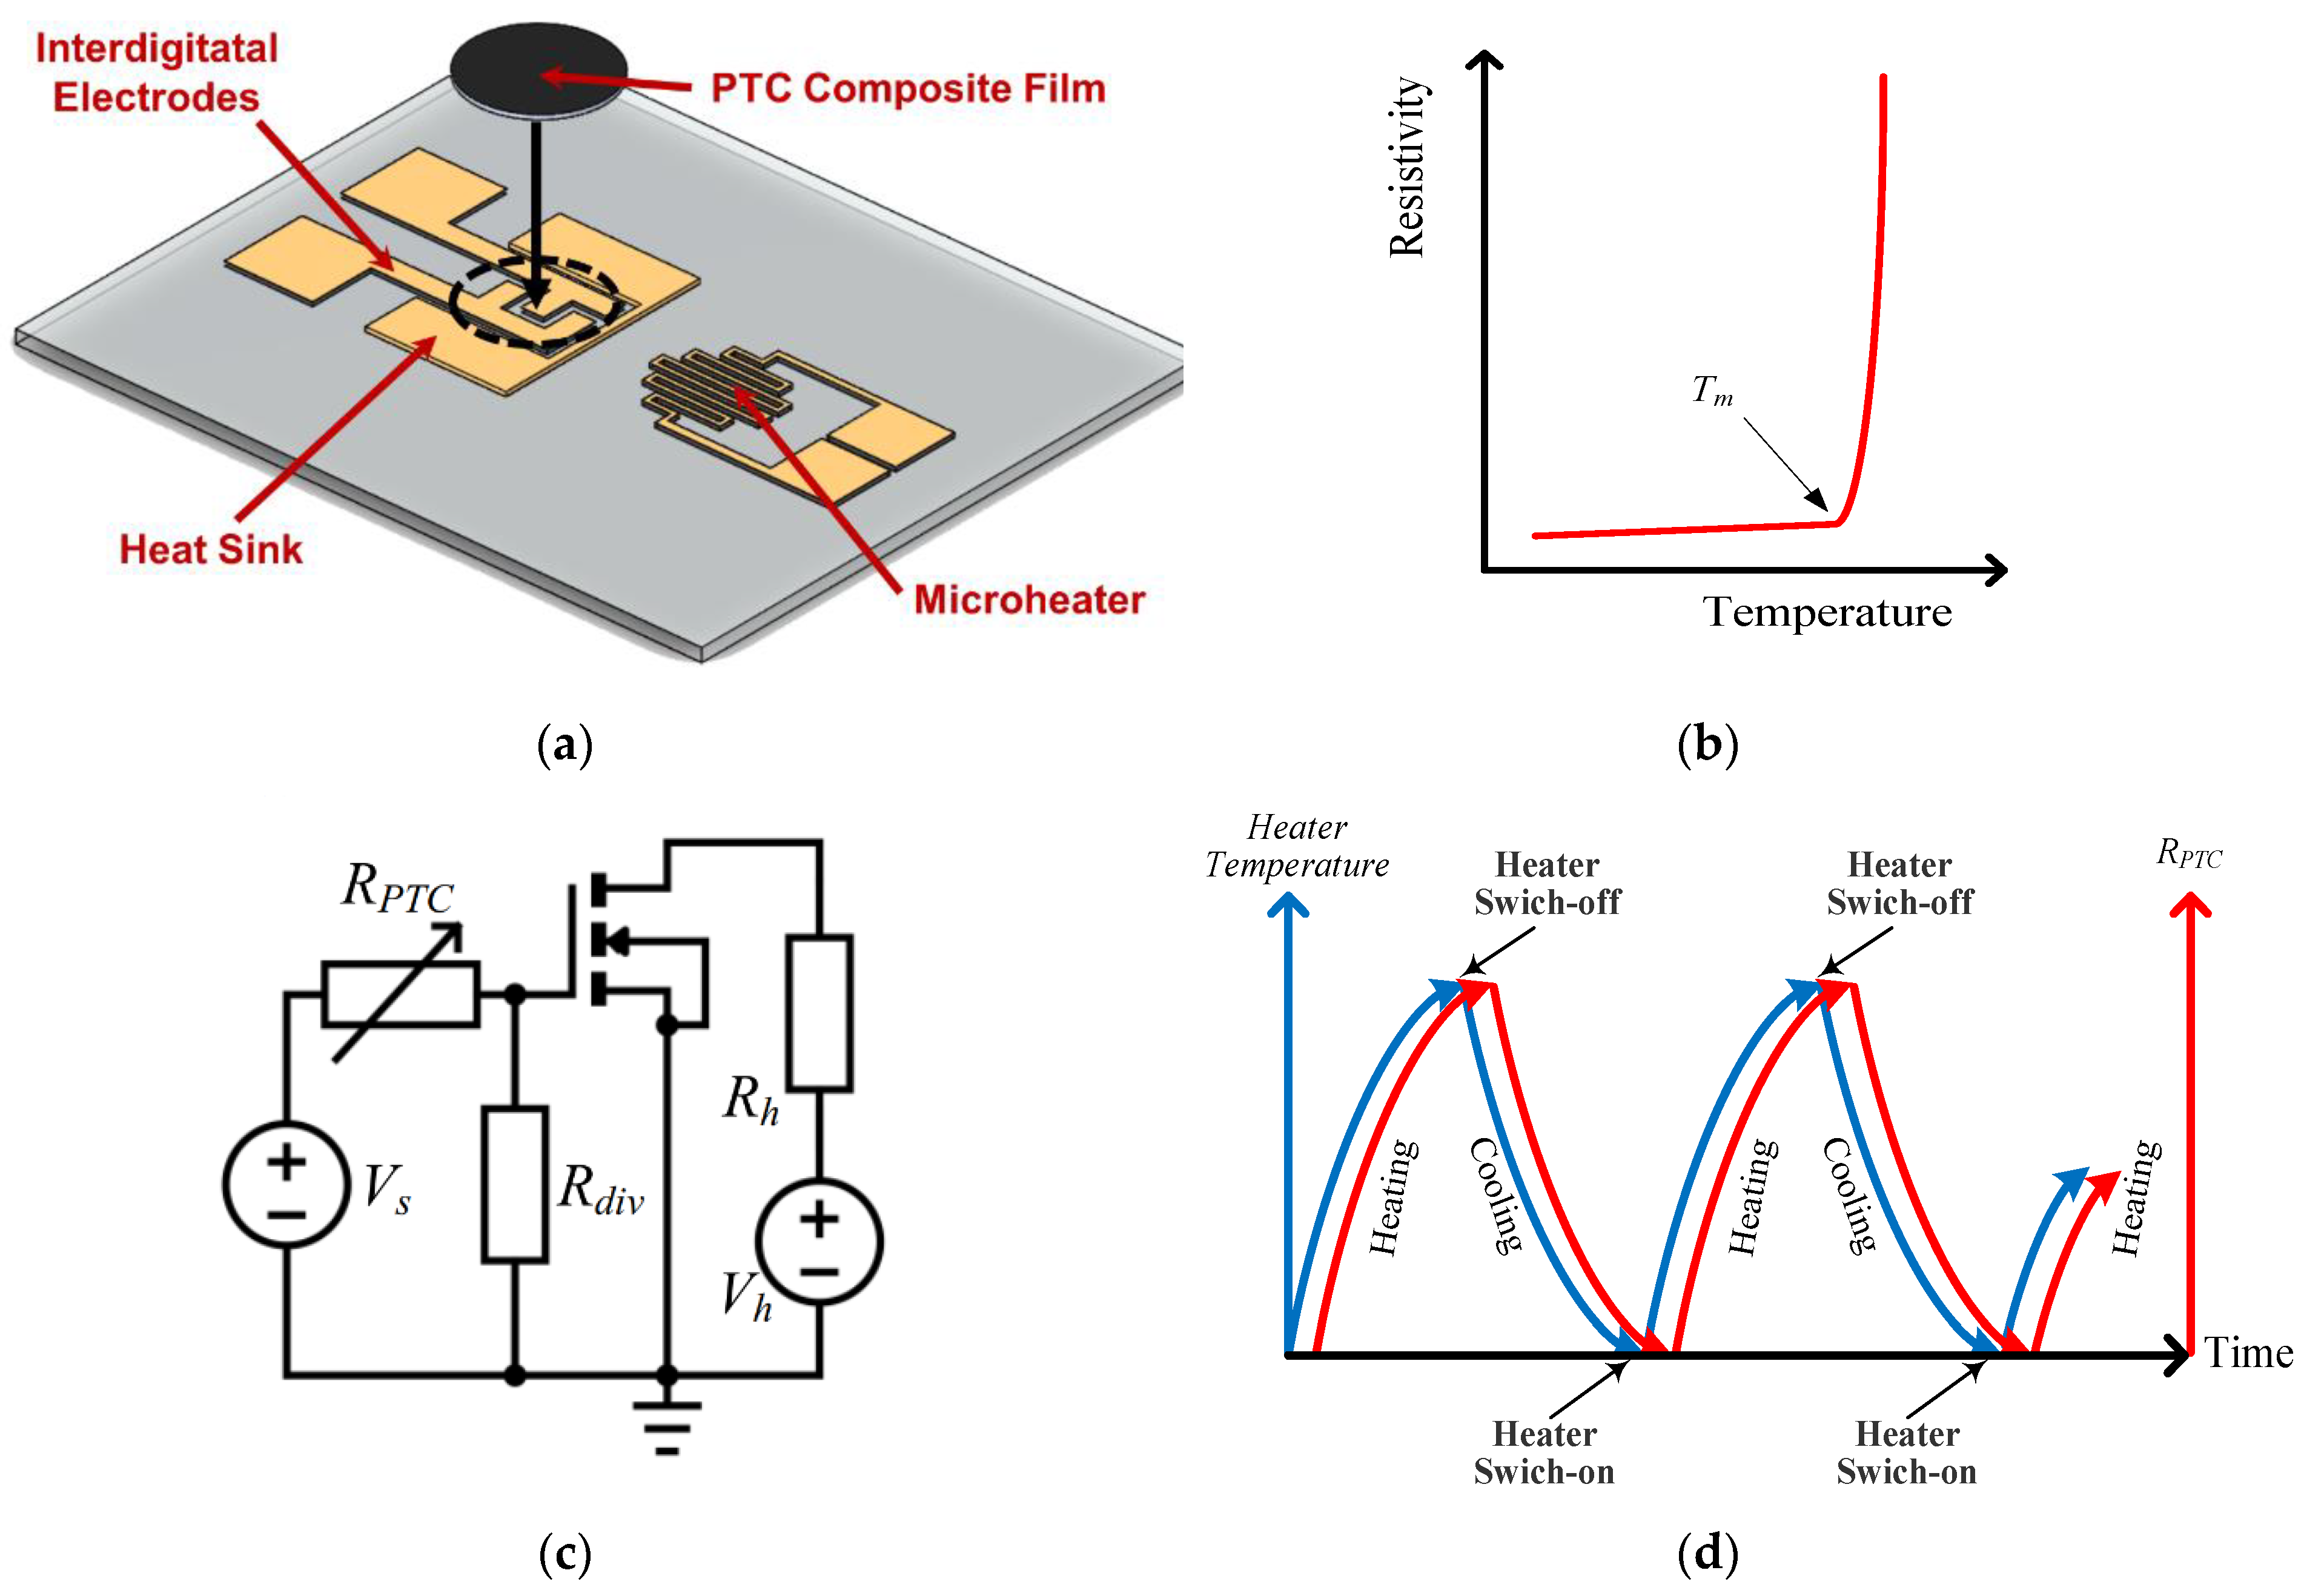
2. Working Principle and Device Design

In this study, we implemented a PTC-based thermal oscillator by employing the characteristic of the reversible rapid resistivity change of PTC composites due to temperature variation. Figure 1a shows a schematic and the exploded view of the proposed oscillator device. The device consists of a microheater, a PTC composite temperature sensor, and a C-shaped planar heat sink. All three components are implemented on a glass substrate.
An electrothermal microheater made of a Ti/Au layer acts as a heat source, which heats the PTC composite by heat conduction. The PTC composite film, which is laid on the interdigital electrodes, senses the changes in resistance in response to temperature changes. In addition, the glass substrate provides the main heat conduction path between the microheater and the PTC temperature sensor. The C-shaped heat sink surrounding the sensor is used to improve the temperature uniformity around the PTC composite film for speeding up the cooling process.
Figure 1b shows the typical resistance–temperature characteristic of acrylate PTC materials. The temperature dependence before the melting point ( T m ) is weak. However, a strong increase of a few orders of magnitude in resistivity is observed around T m . This behavior is repetitive, and the resistivity returns to almost the same value after a heating/cooling cycle. In addition, the hysteresis effect of the acrylate-based PTC material is essentially insignificant [19].
Figure 1c shows an equivalent circuit diagram of the DC-driven thermal oscillator using the PTC material. V s is the total voltage across the PTC temperature sensor ( R P T C ) and the divider resistor ( R d i v ). V h is a fixed DC voltage applied to the microheater ( R h ). A MOSFET (IRF3205) was used to switch the microheater on and off.
Figure 1d illustrates the temperature oscillation induced by PTC composite because of its rapid resistivity change due to temperature.
As the heater turns on, the temperature of the PTC composite increases. Additionally, R P T C increases with the elevated temperature, which results in a decrease in V d i v , which is the gate-to-source voltage of the MOSFET. Once the V d i v drops below the threshold voltage of the MOSFET, the MOSFET switches to the cut-off region. Consequently, the microheater turns off, and the system therefore cools down. As the temperature of the PTC composite decreases, its resistance also decreases significantly, which, in turn, increases V d i v . The heating process starts again as the MOSFET switches to the saturation region because the voltage across R d i v (i.e., V d i v ) exceeds the threshold voltage of the MOSFET.

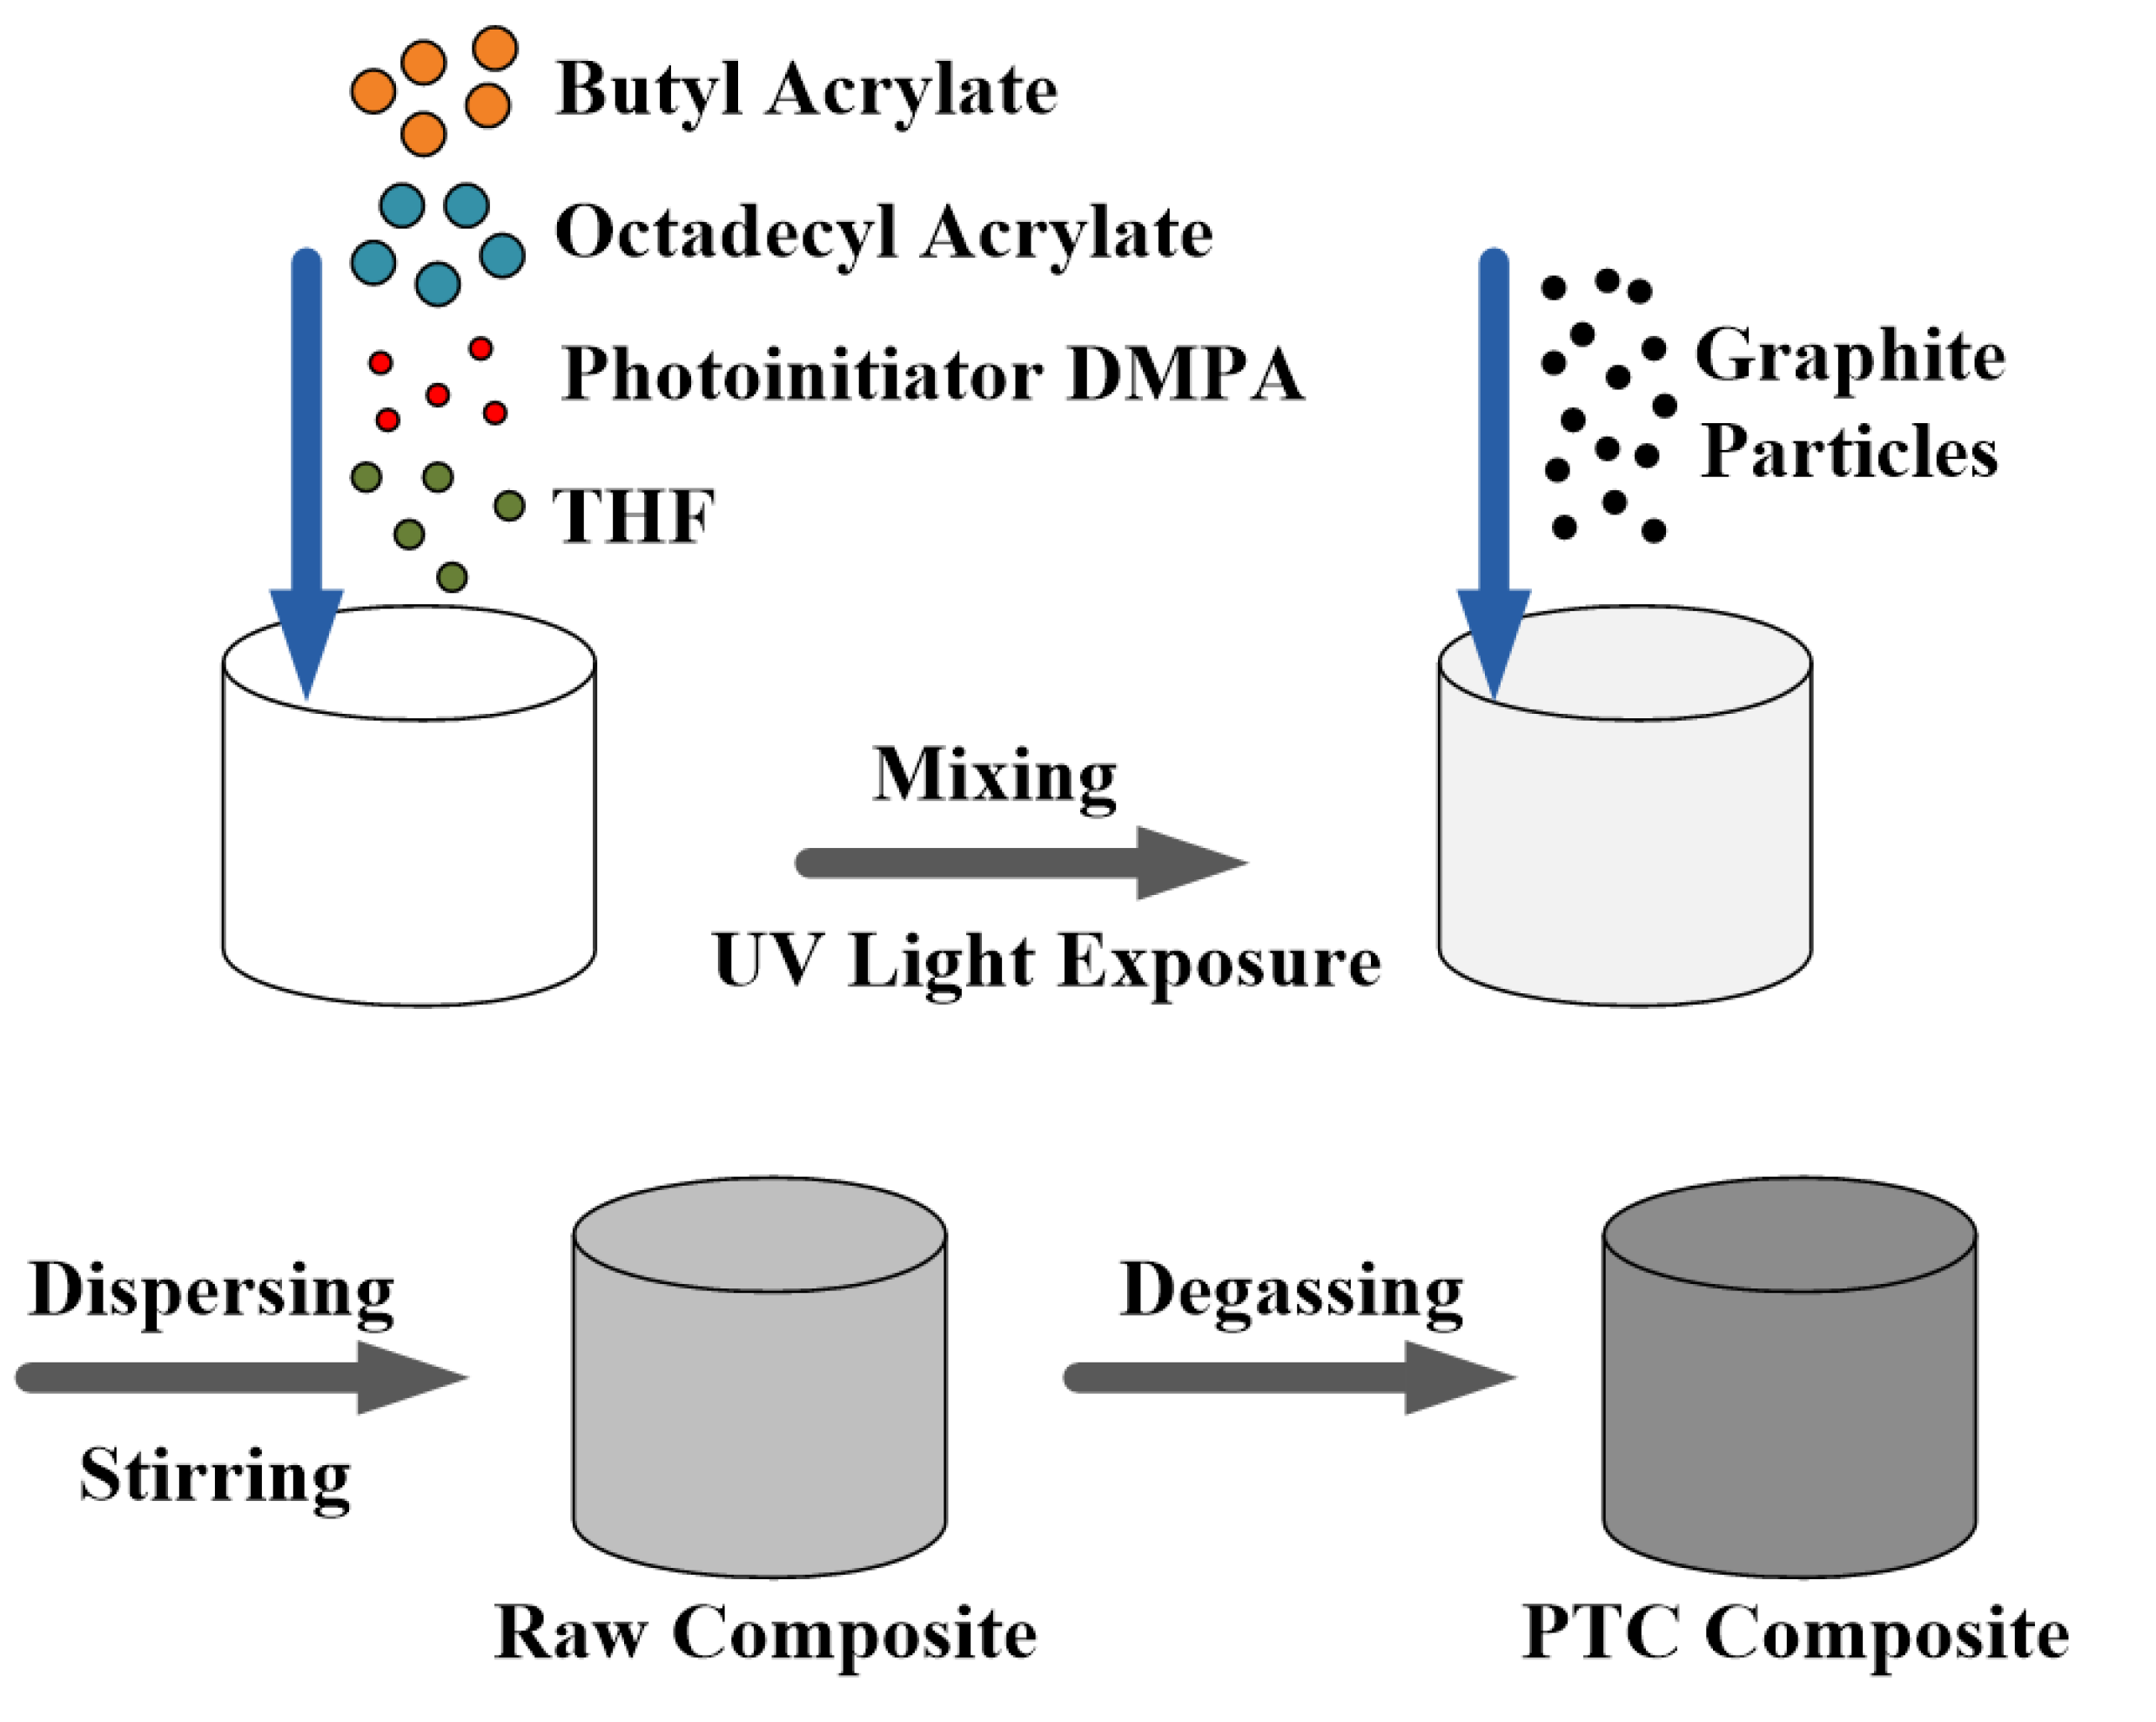
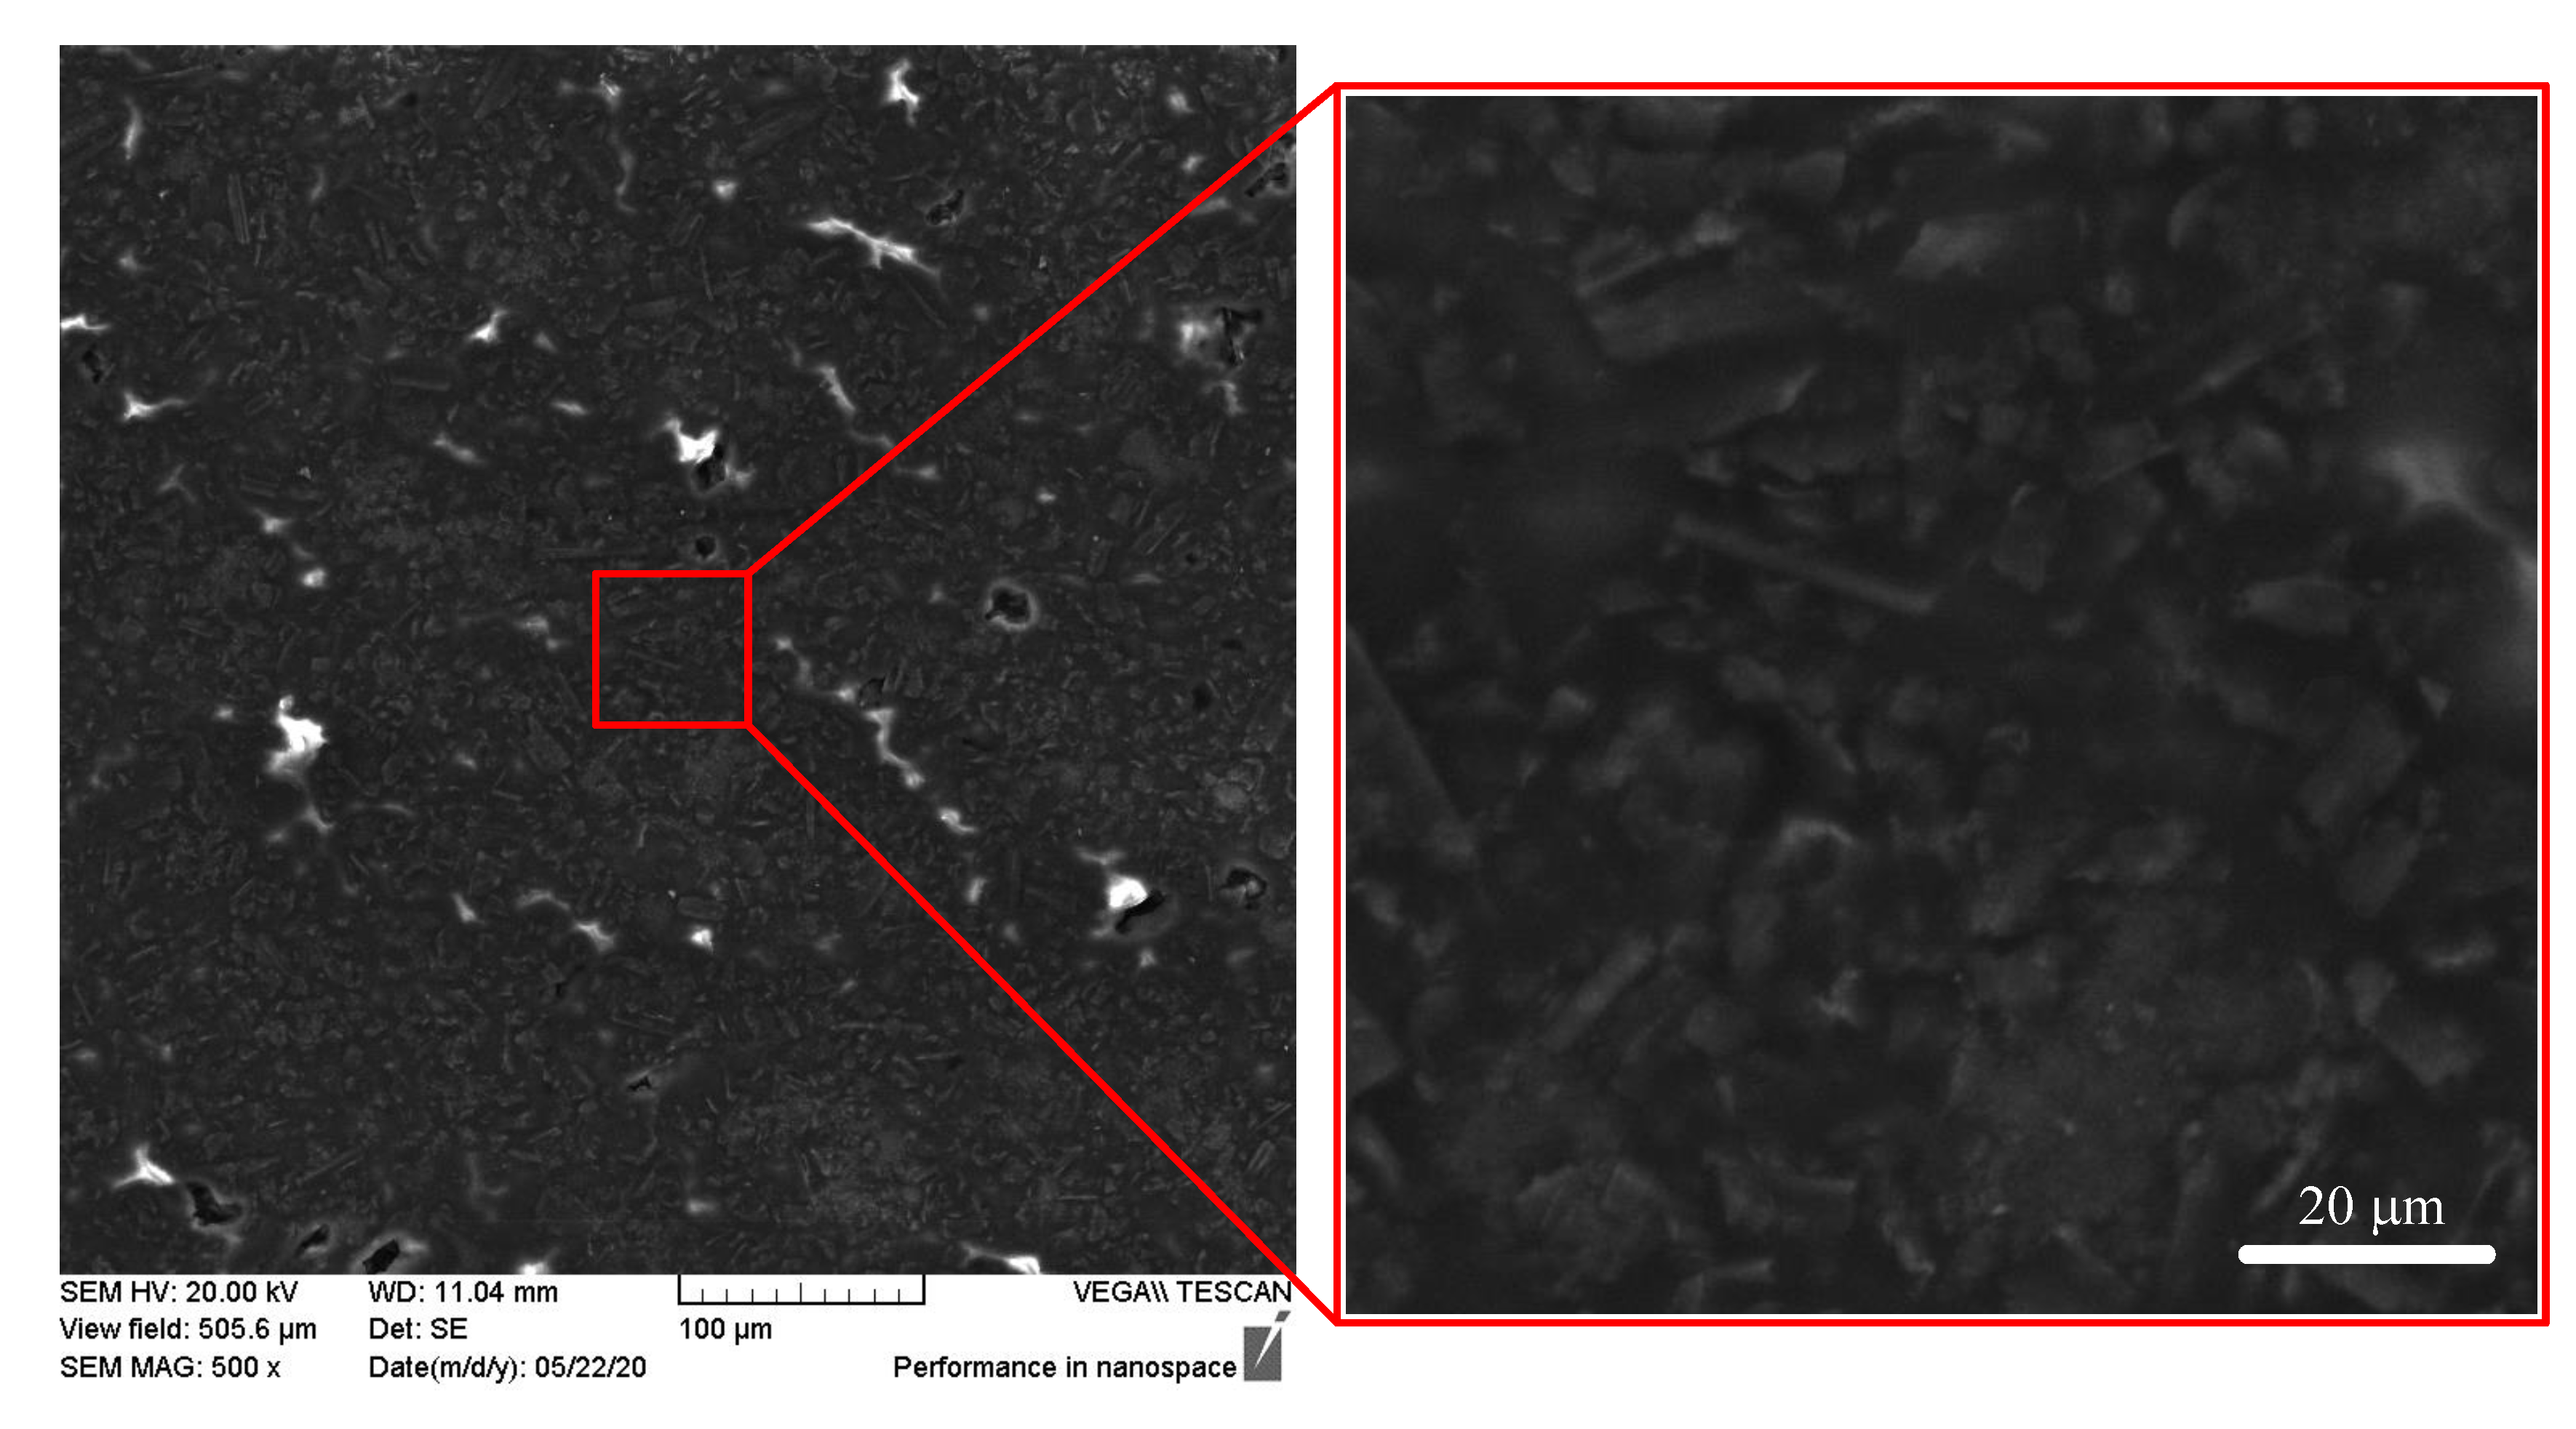
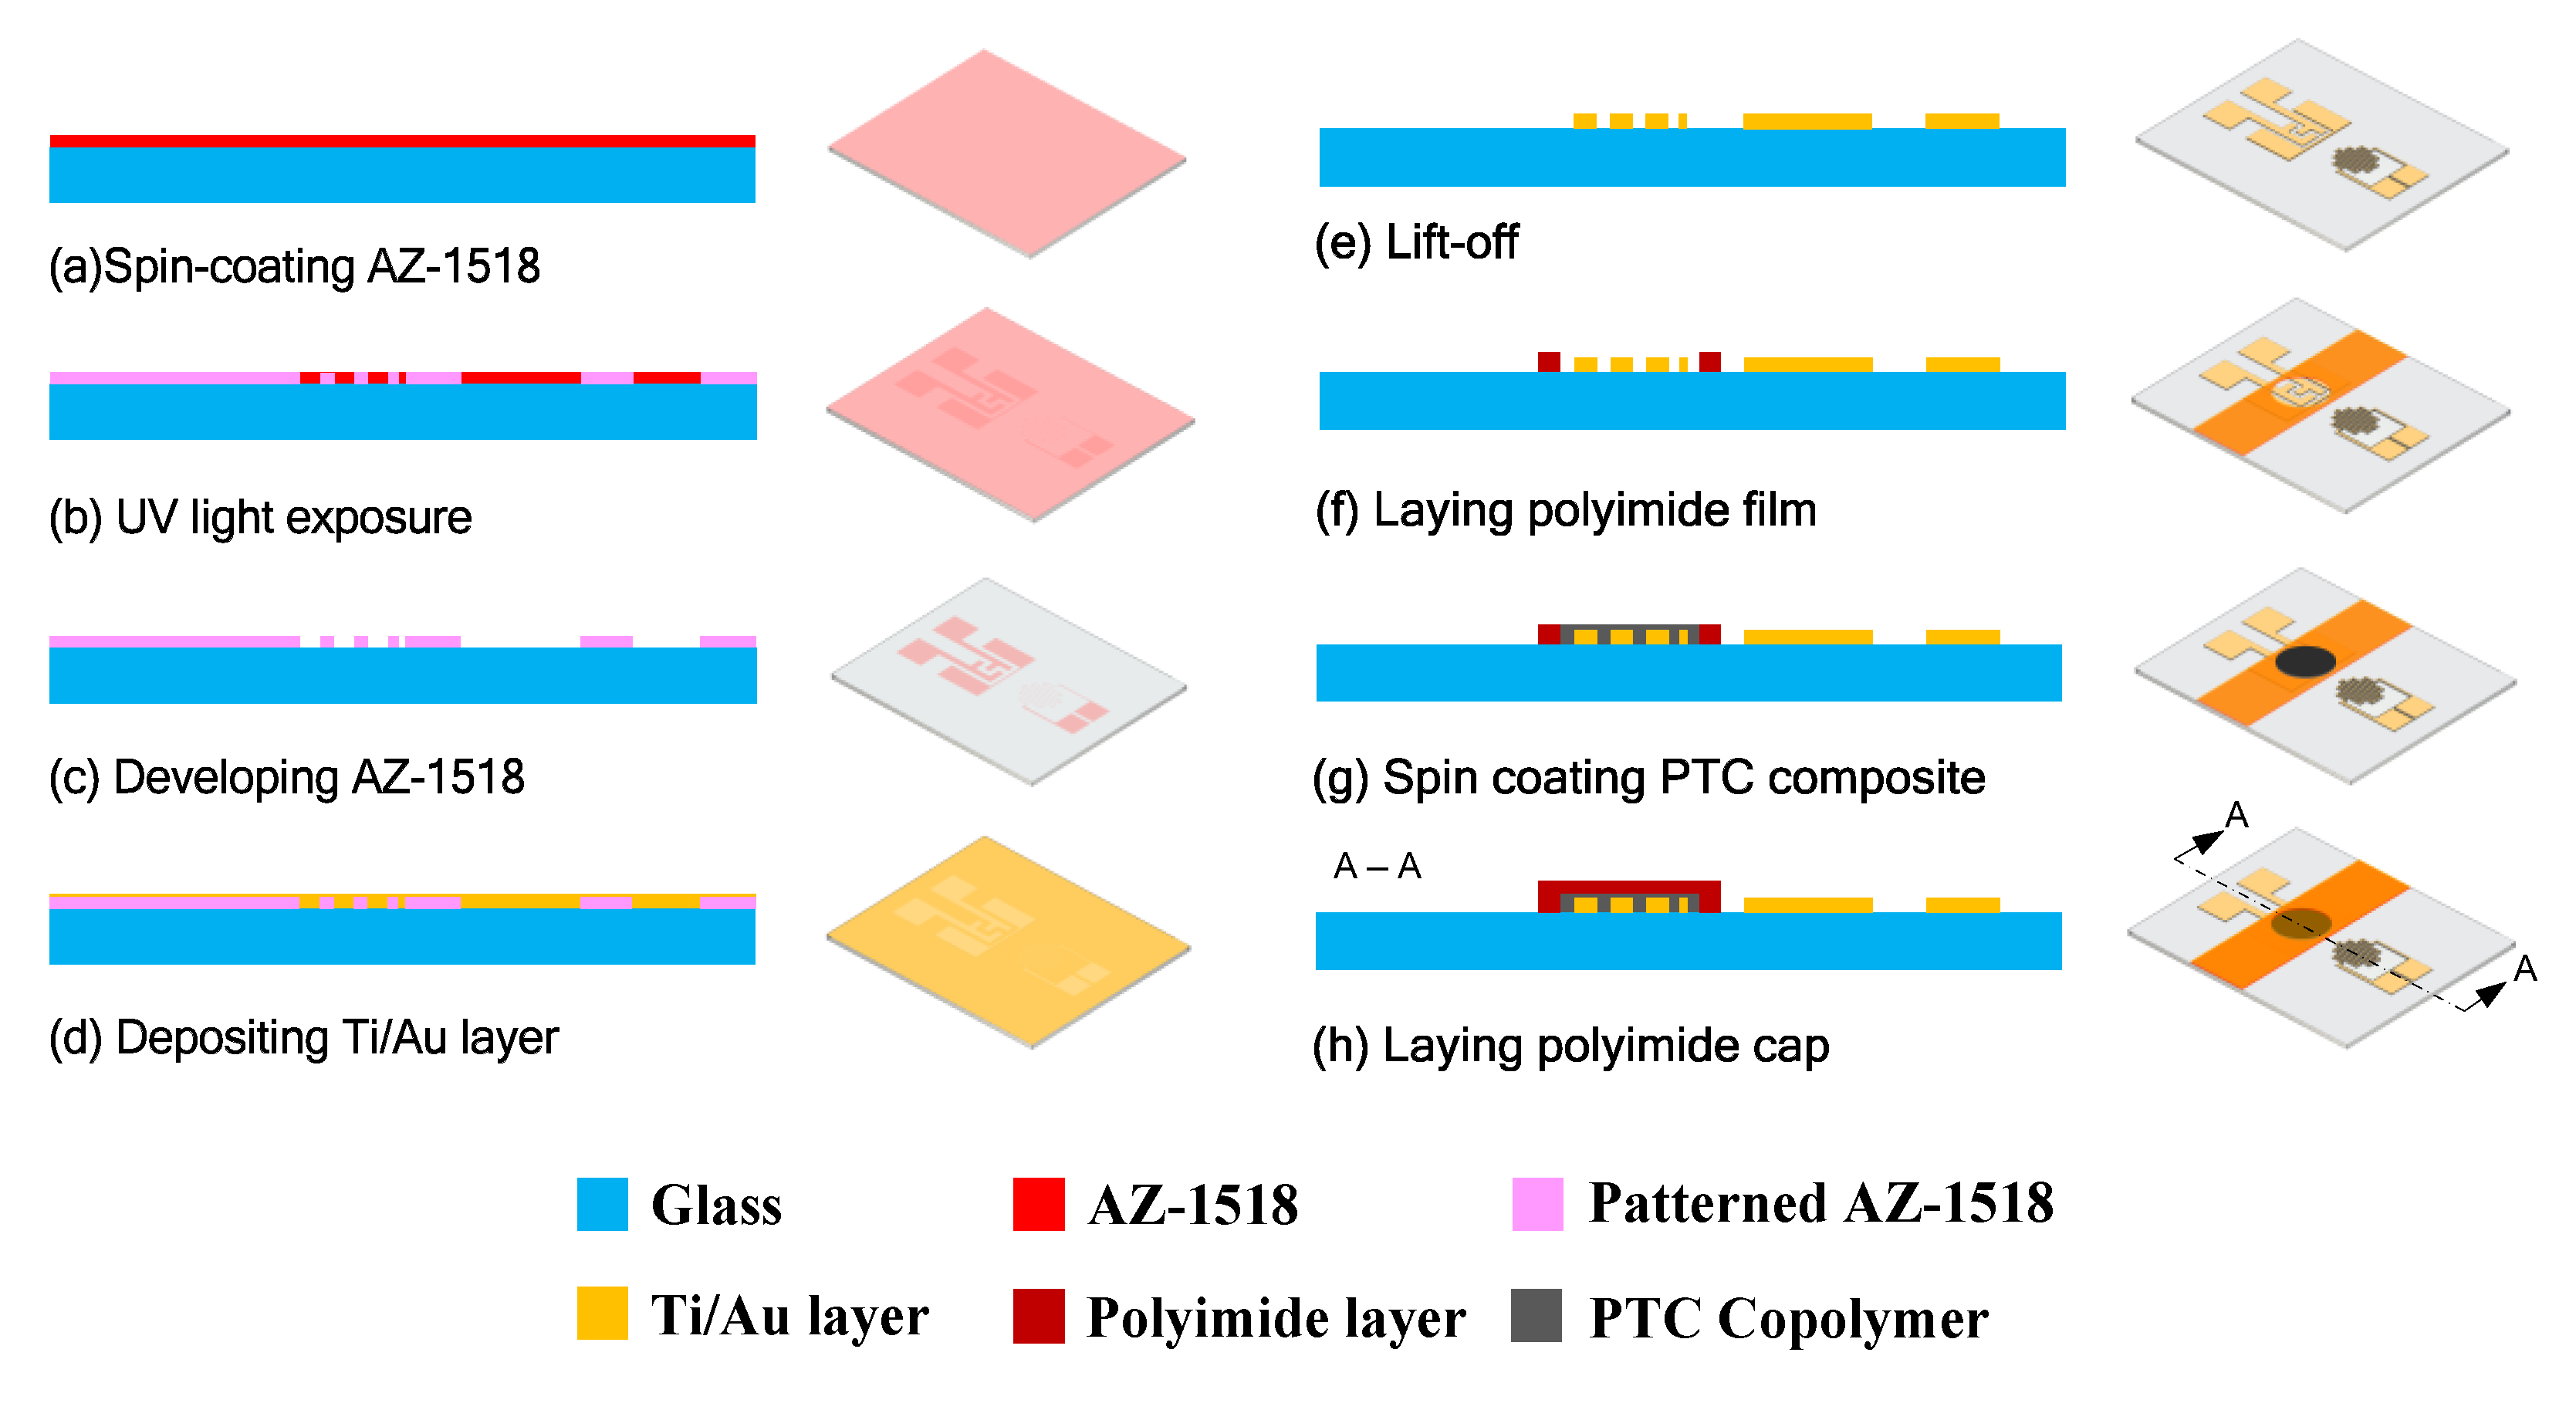
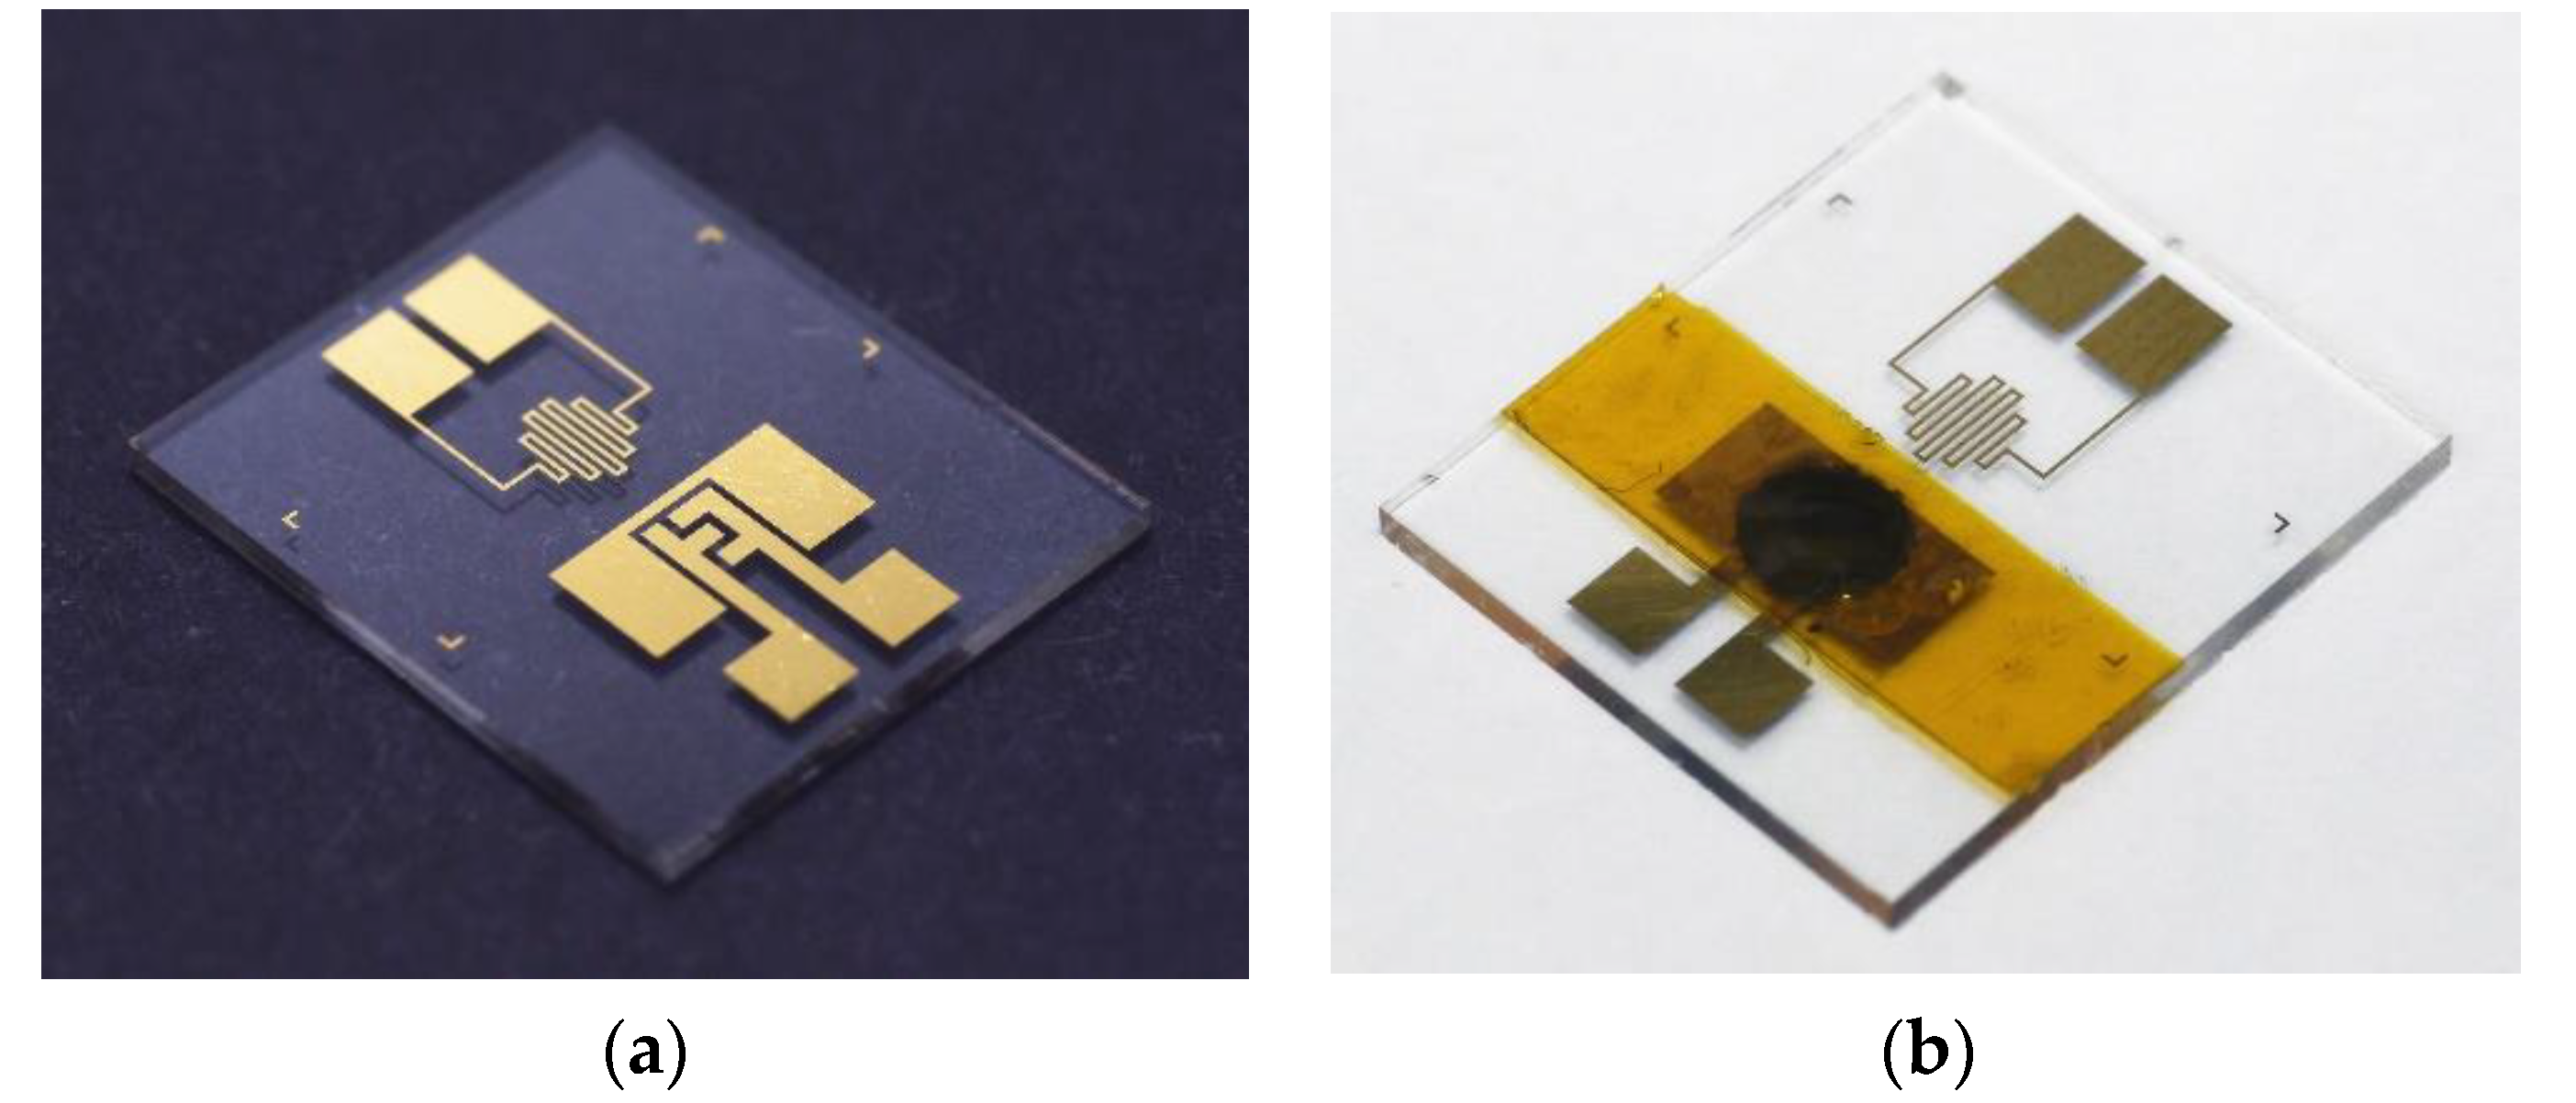
3. Device Fabrication

The synthesis process for acrylate-based PTC composites is illustrated in Figure 2. The PTC material used in the thermal oscillator was realized by dispersing the graphite (the conductive filler) with a semi-crystalline acrylate copolymer (the matrix). The preparation of the PTC composite was as follows. A semi-crystalline acrylate copolymer was fabricated by polymerizing two acrylate monomers with different alkyl side-chain lengths (20 mol% butyl acrylate (BA) and 80 mol% octadecyl acrylate (OA)), which was dispersed with 1.0 wt% 2,2-bis(hydroxymethyl)propionic acid (DMPA). Then, the copolymer was dissolved in an additional 100 wt% tetrahydrofuran (THF). The solution was thoroughly stirred using a magnetic stirrer for 1 h. Polymerization was carried out via exposure to 365 nm UV light (UVL-28EL series, 4 W) for 1 d. The synthesized semi-crystalline copolymer was mixed with graphite particles (2–3 μm in diameter) at 25 wt% using a magnetic stirrer. The organic solvent was then removed under vacuum in a desiccator for 1 d. Figure 3 shows the SEM images of the prepared PTC composite dispersed with graphite particles.
Figure 4 details the steps of the fabrication process of the proposed thermal oscillator. First, a photoresist (AZ 1518; MicroChem Co.) was spin coated at 4000 rpm on a glass wafer (Figure 4a) and patterned (Figure 4b,c). A Ti/Au layer was then deposited (Figure 4d) and patterned by a lift-off process (Figure 4e). The thicknesses of the titanium layer and the gold layer were 300 Å and 3000 Å, respectively. A polyimide film was laid around the interdigital electrode with a 55 µm-thick, 3 mm-diameter punched circular hole (Figure 4f). Then, the PTC composite was preheated and spin coated onto the interdigital electrodes (Figure 4g). Note that, during the process of spin coating the PTC composite, the PTC composite was preheated on a hot plate at 60 °C, which was much higher than the T m , to ensure that the composite was in a colloidal state and would therefore easily be filled into the polyimide circular hole. Finally, the PTC composite was encapsulated by using a polyimide tape as a top cover (Figure 4h).
Figure 5 shows the pictures of the fabricated devices. Figure 5a shows the glass substrate patterned with the microheater, interdigital electrode, and the C-shaped heat sink. The resistance of the microheater is approximately 25 Ω. The distance between the center of the heater and the center of the interdigital electrodes is 4 mm. The pitch between each interdigital electrode is 0.25 mm. The assembled thermal oscillator is shown in Figure 5b.

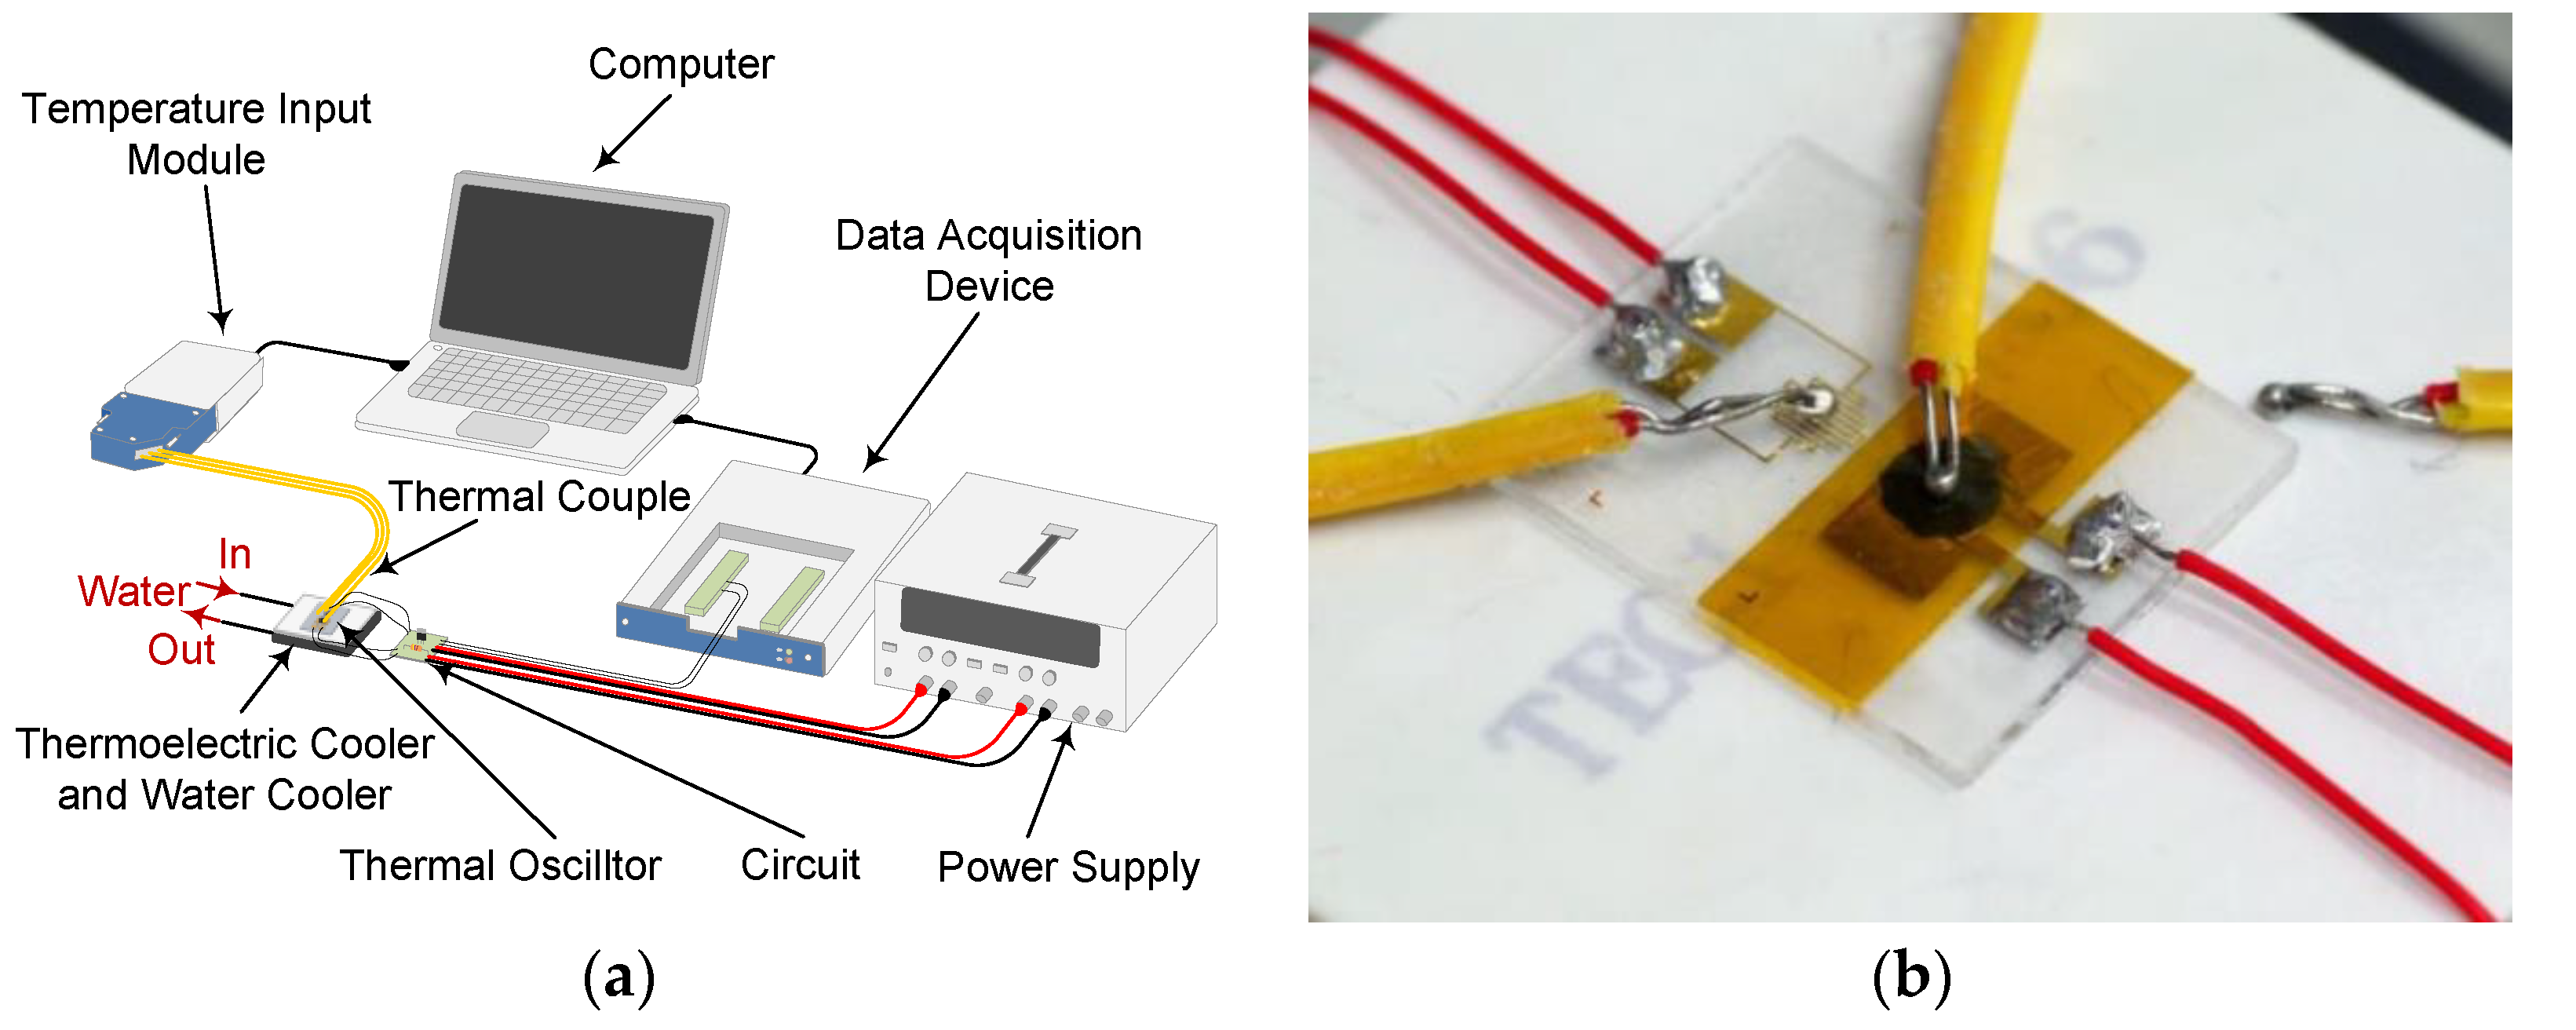
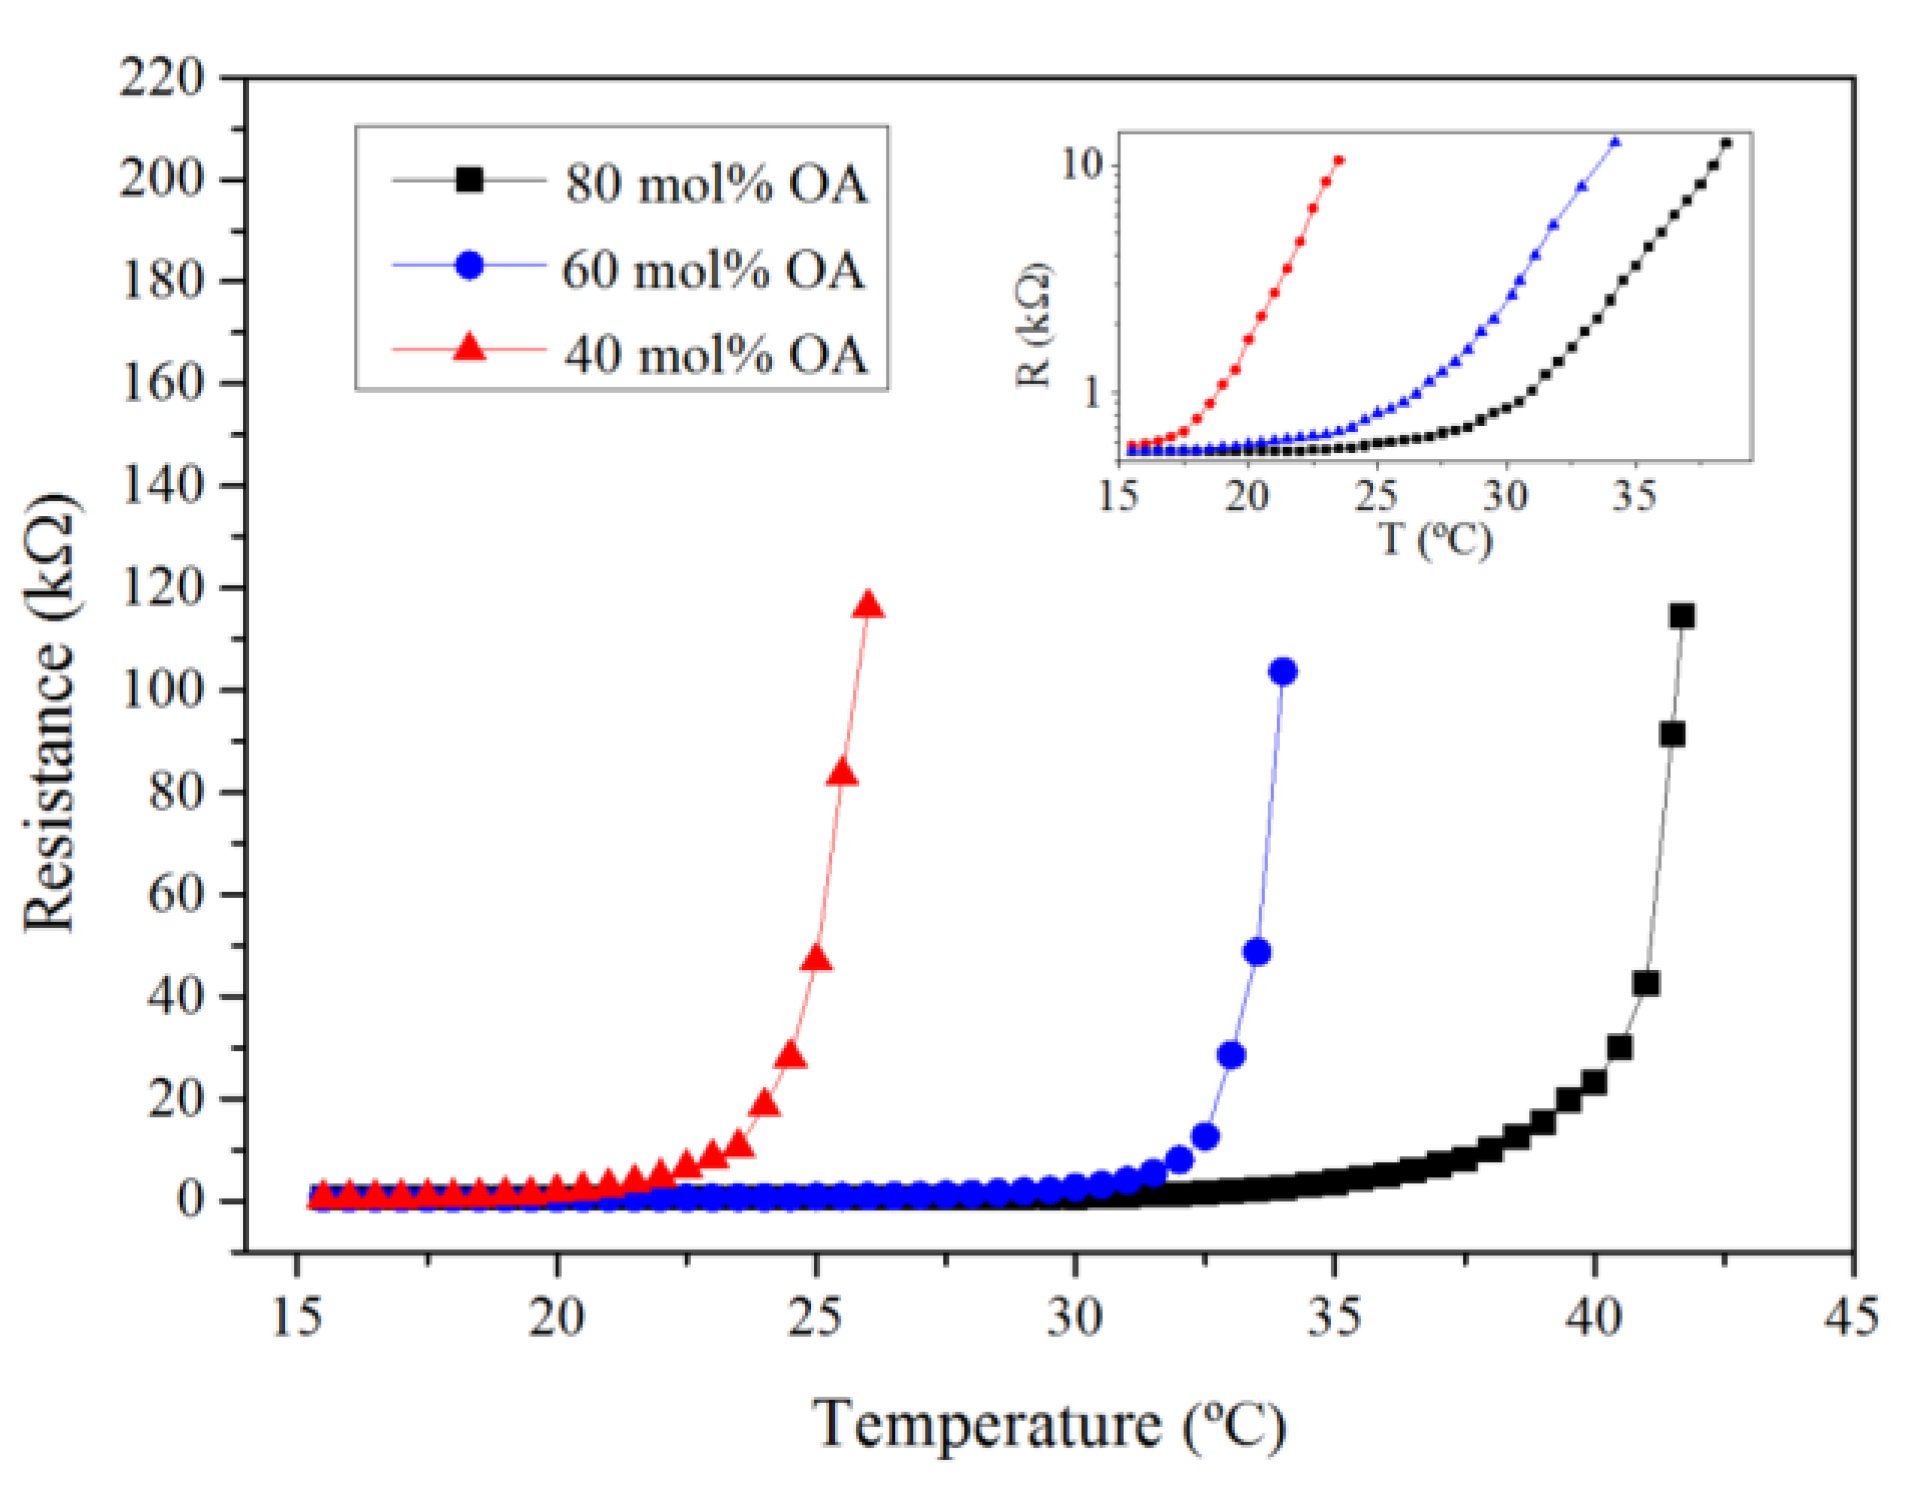
4. Measurement Results and Discussion

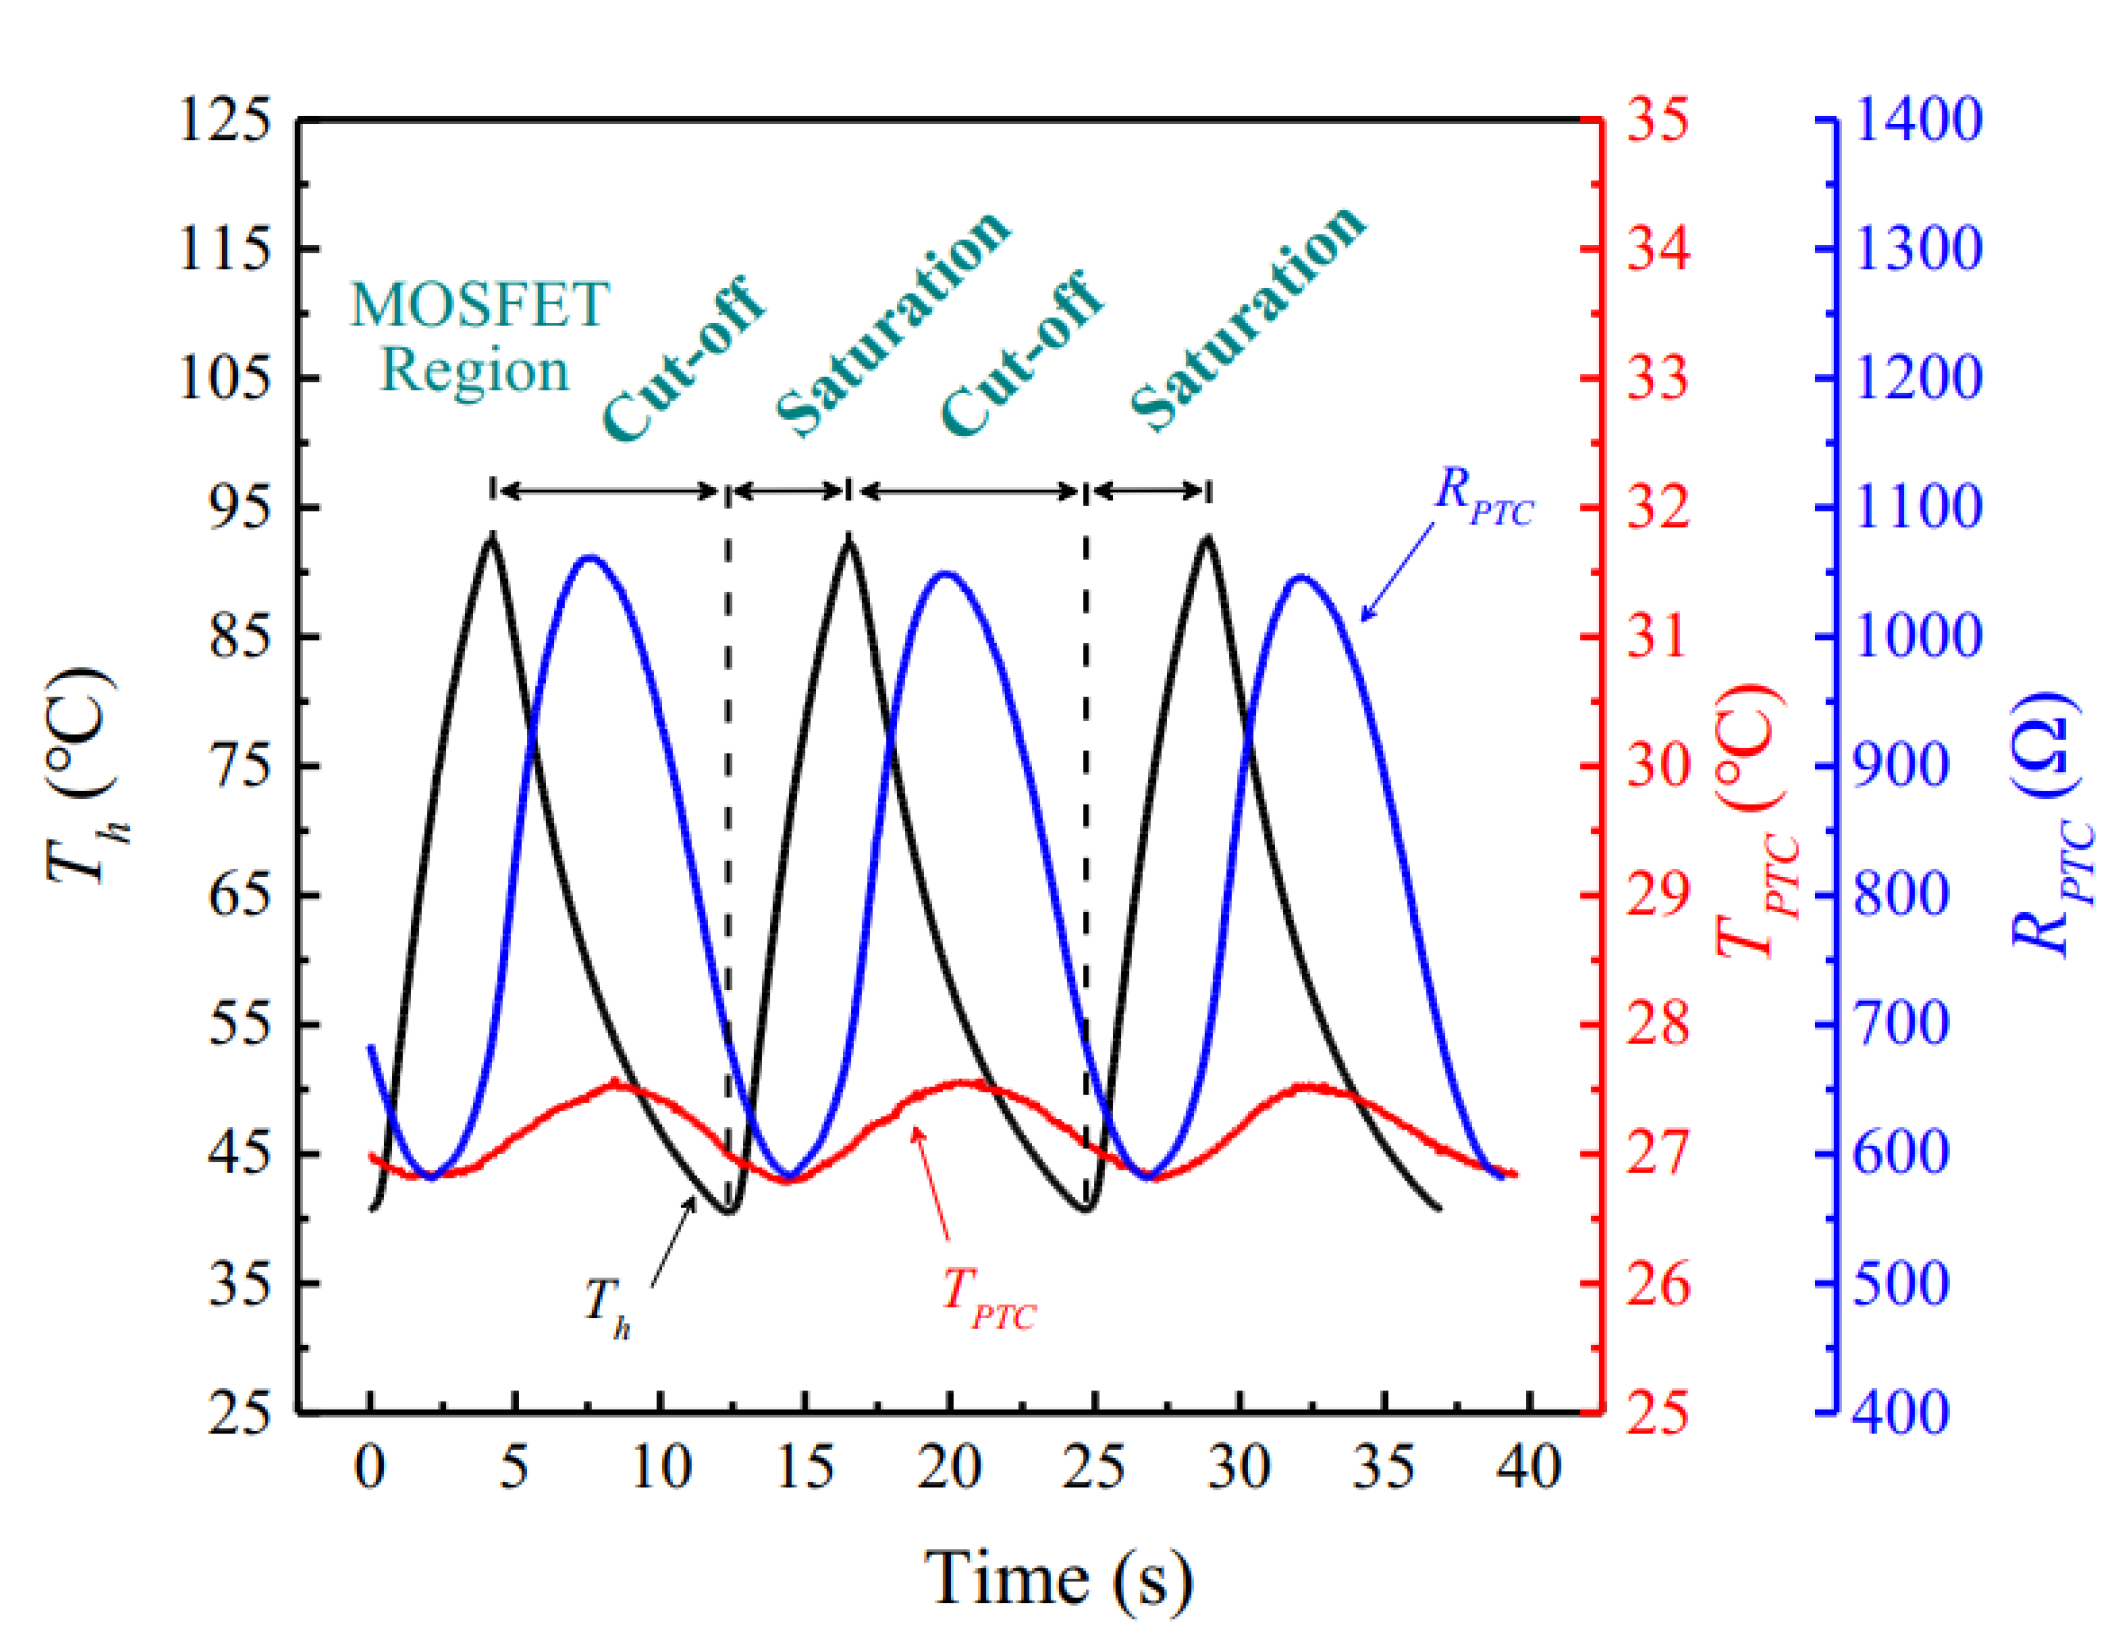
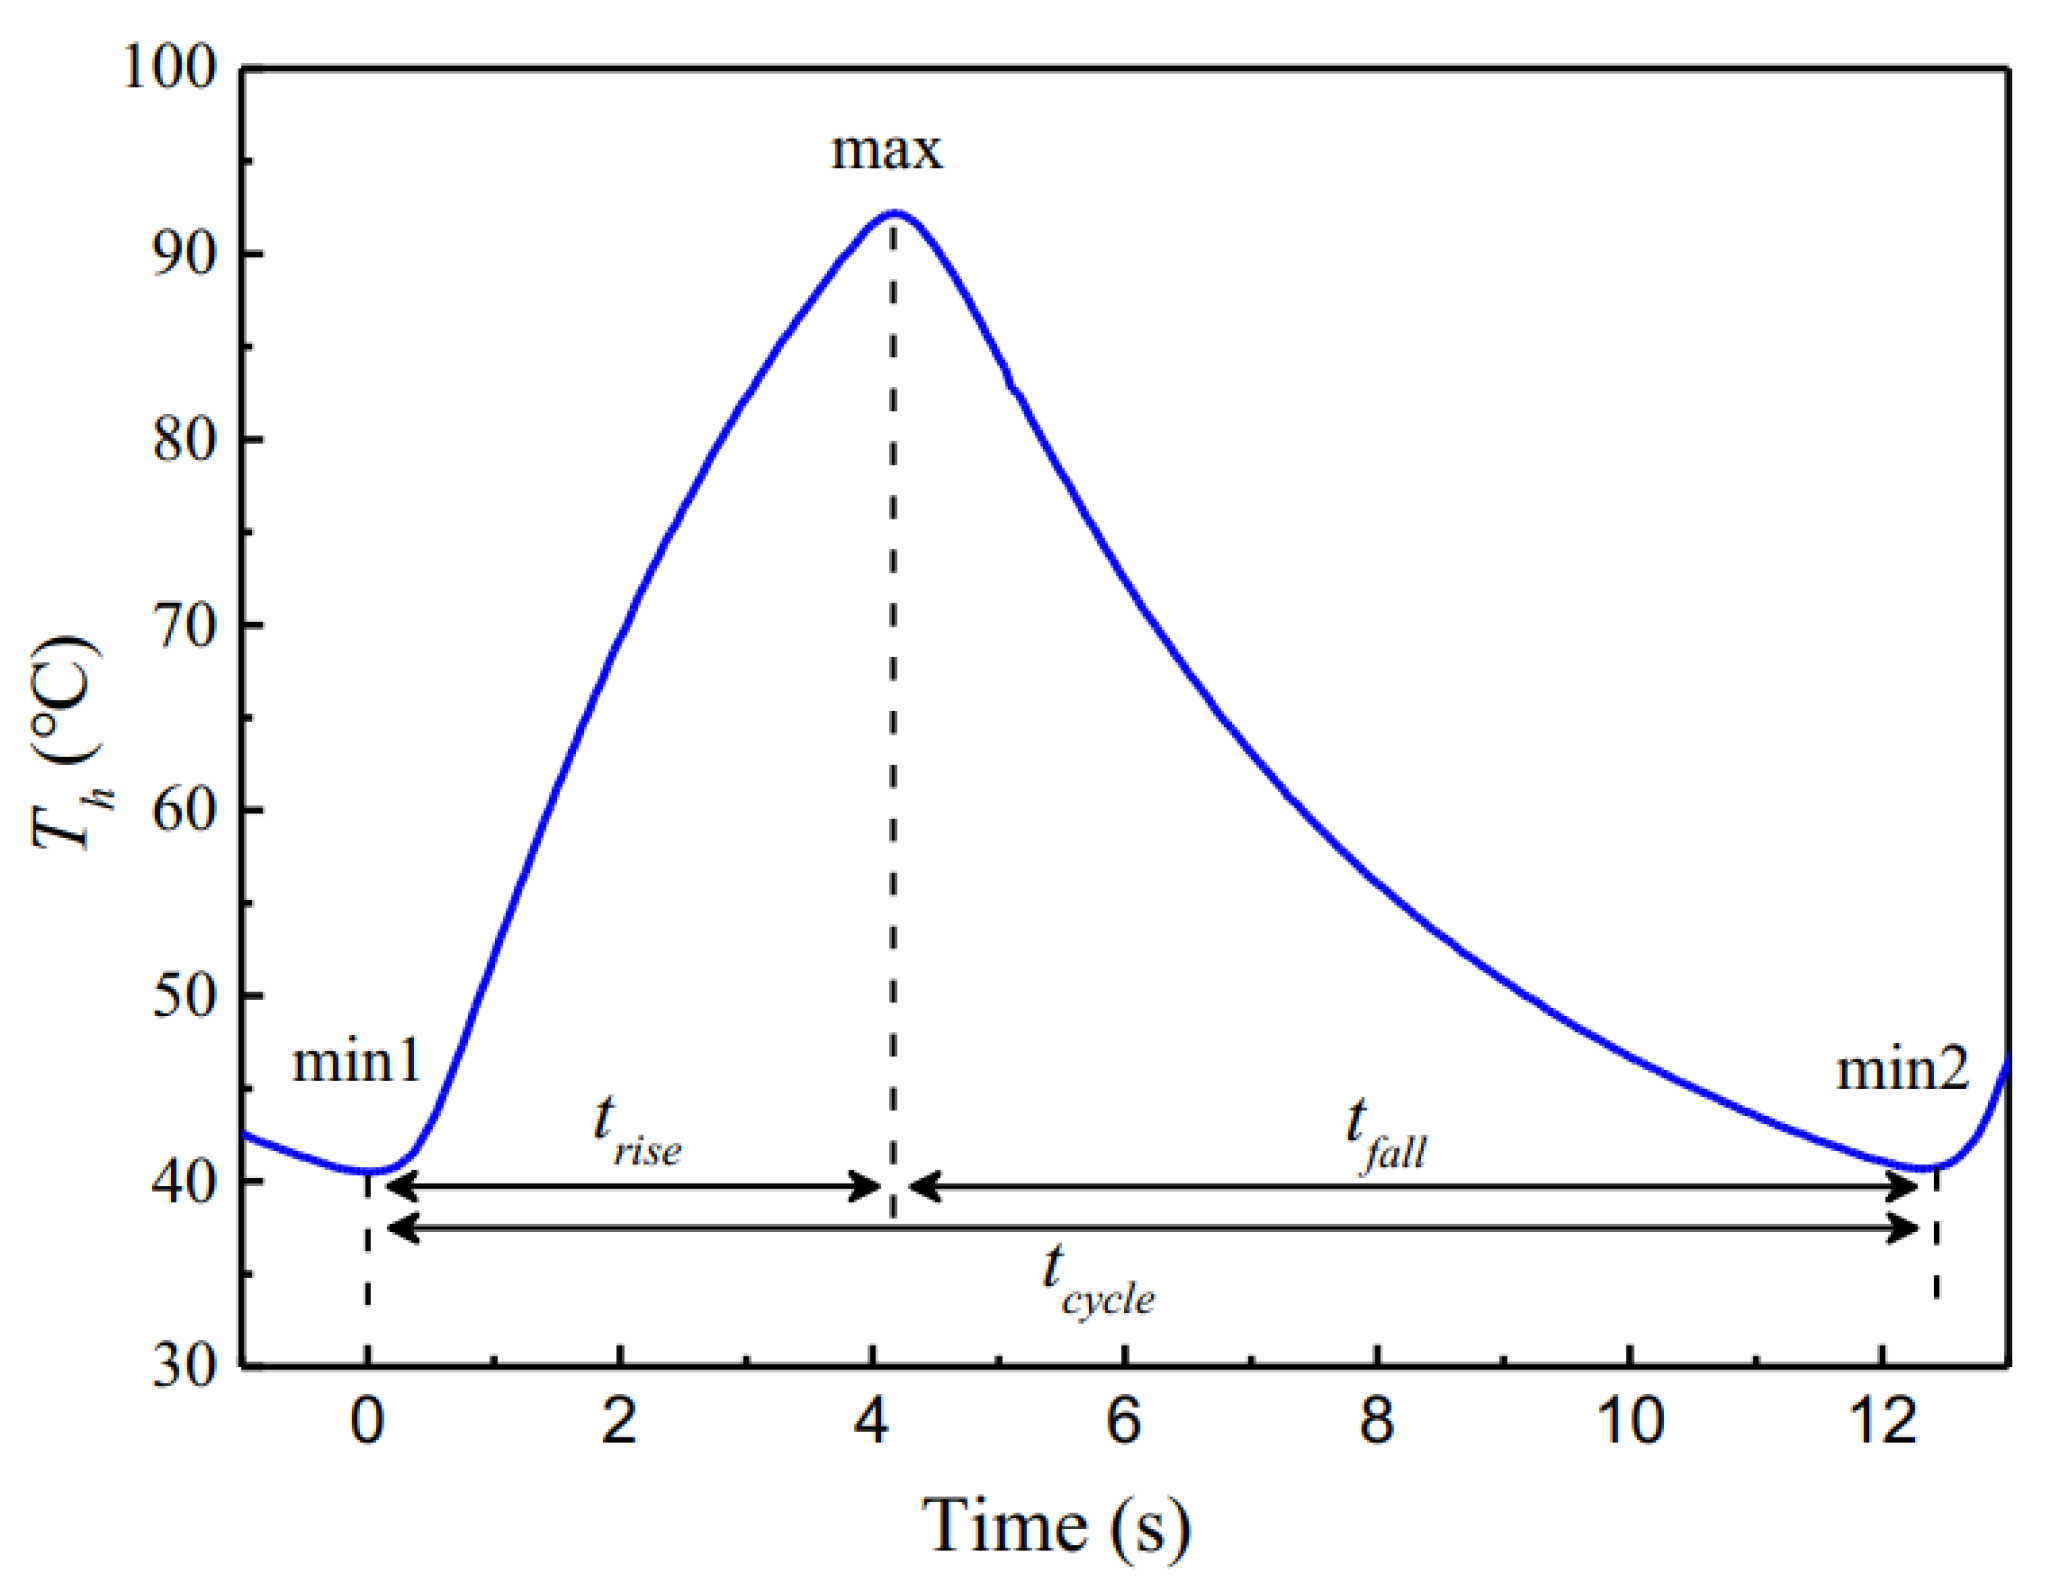
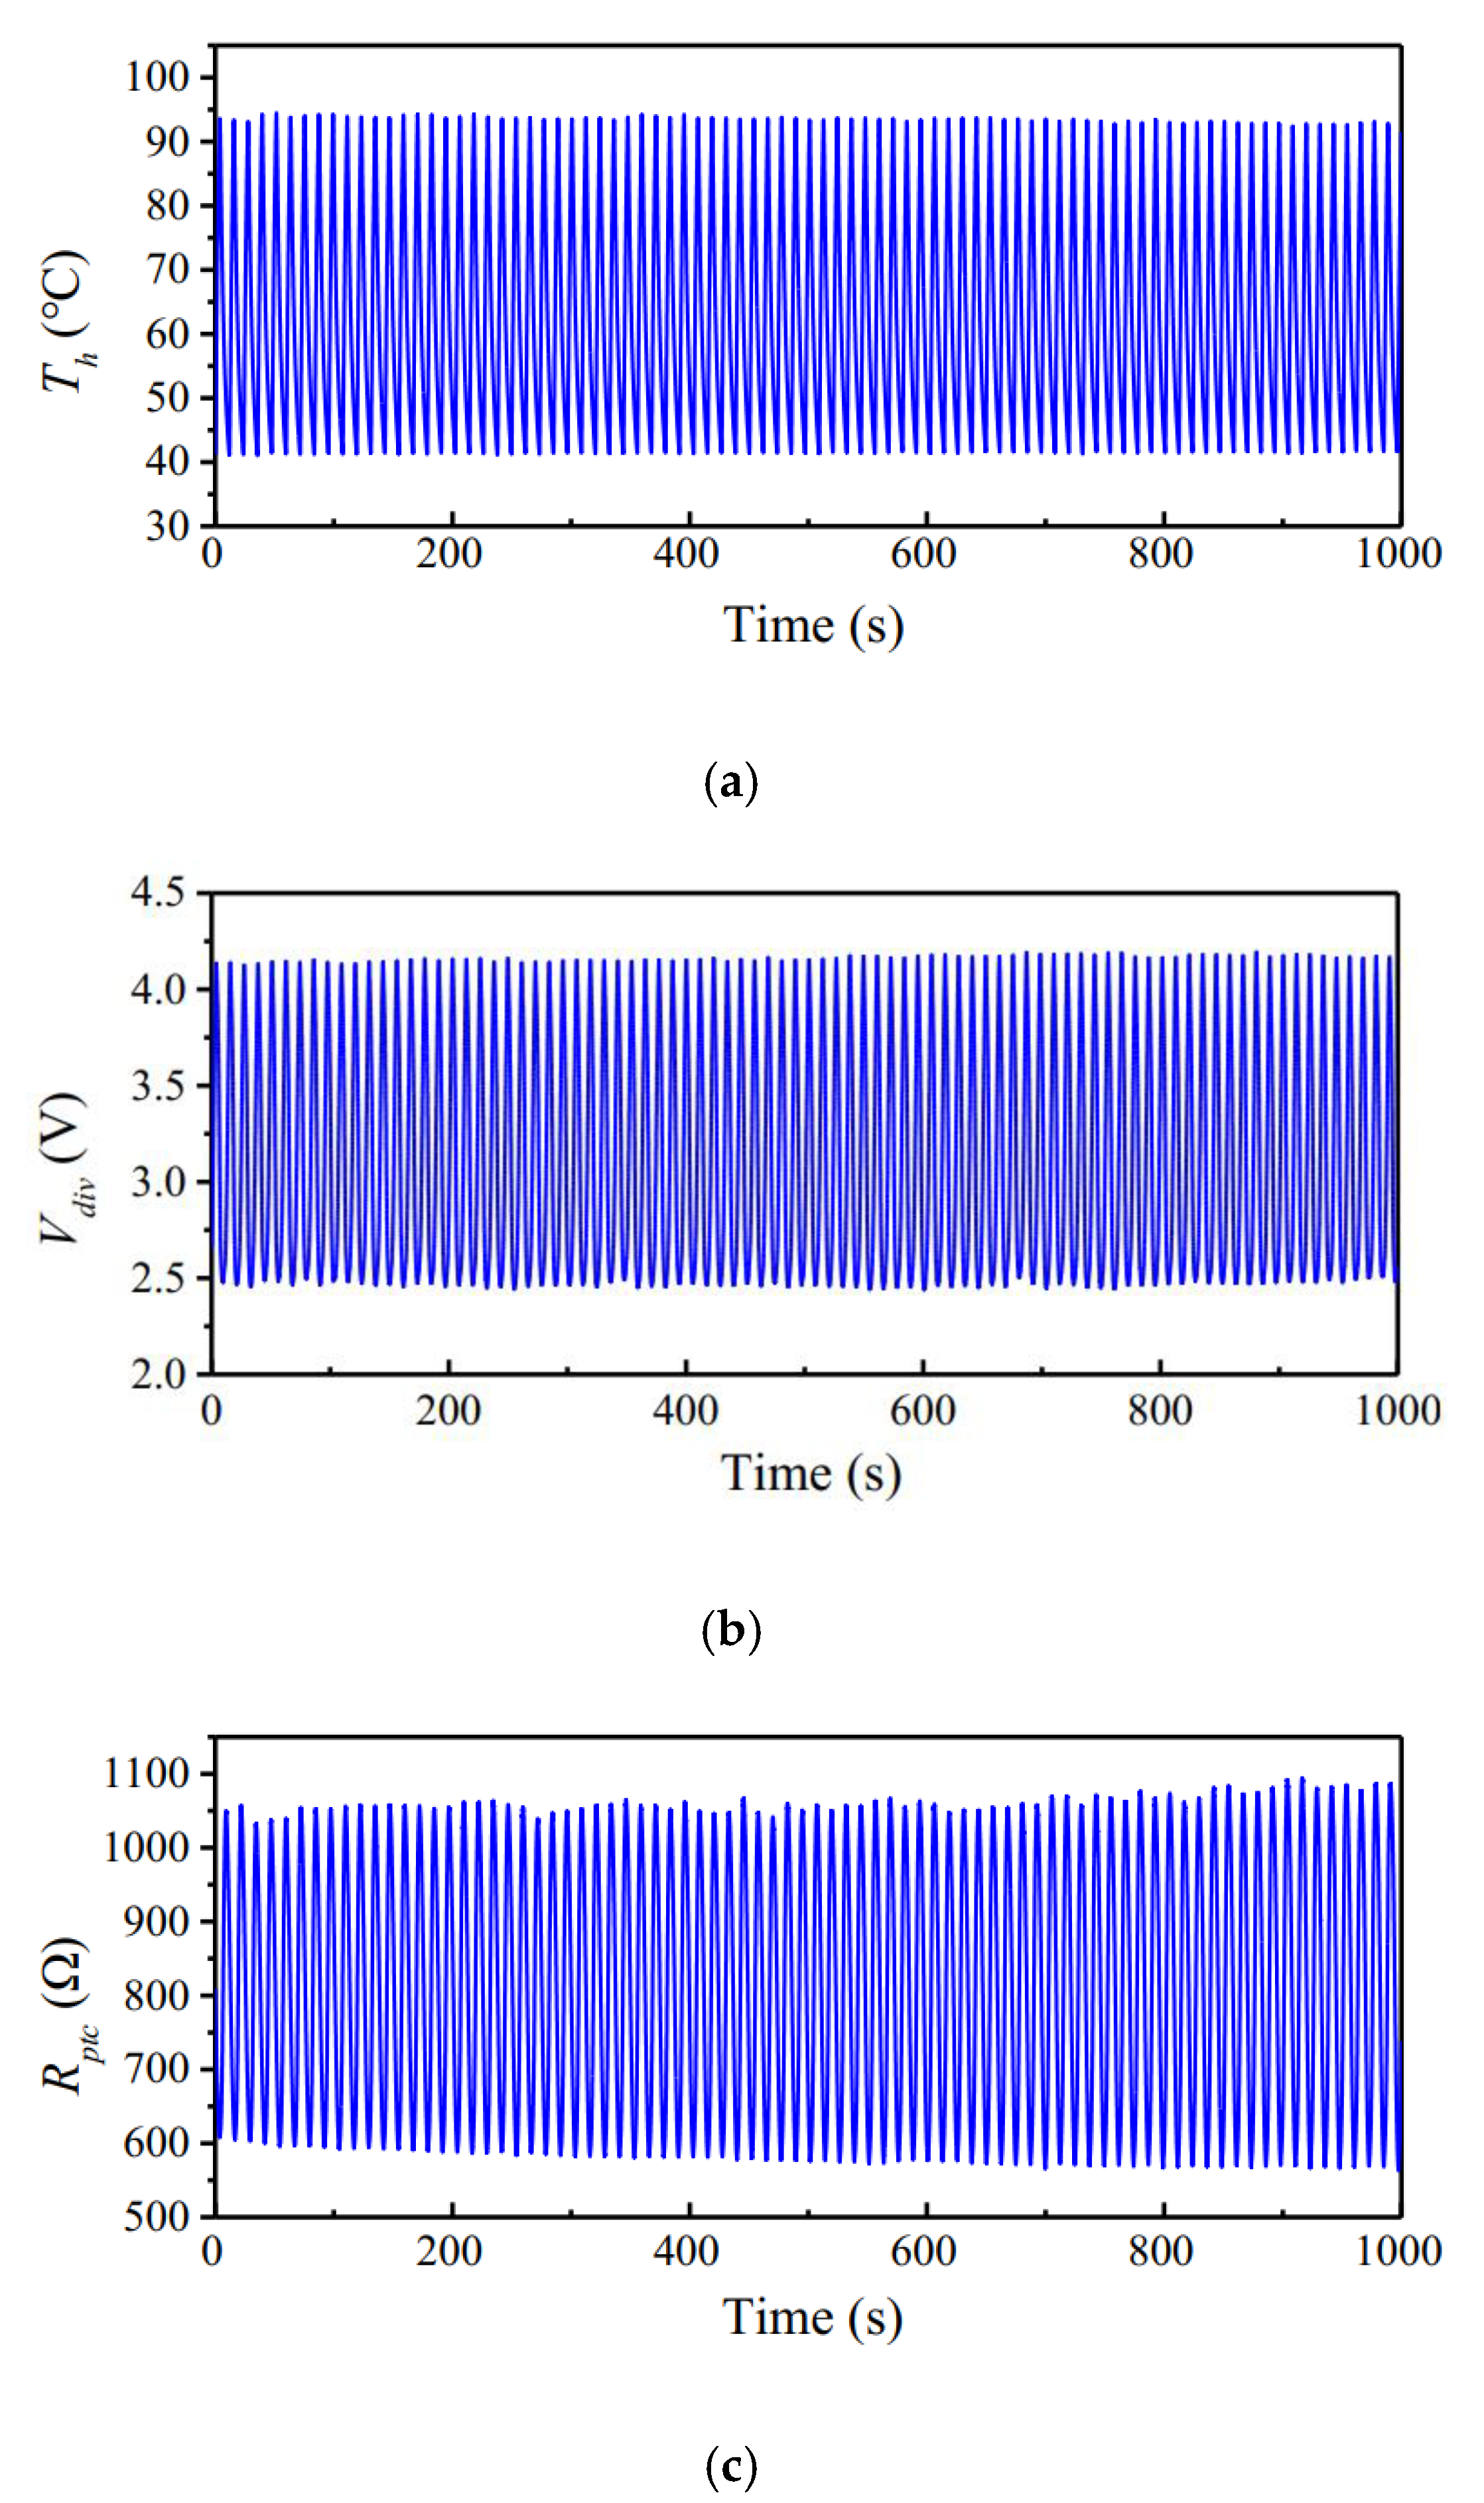
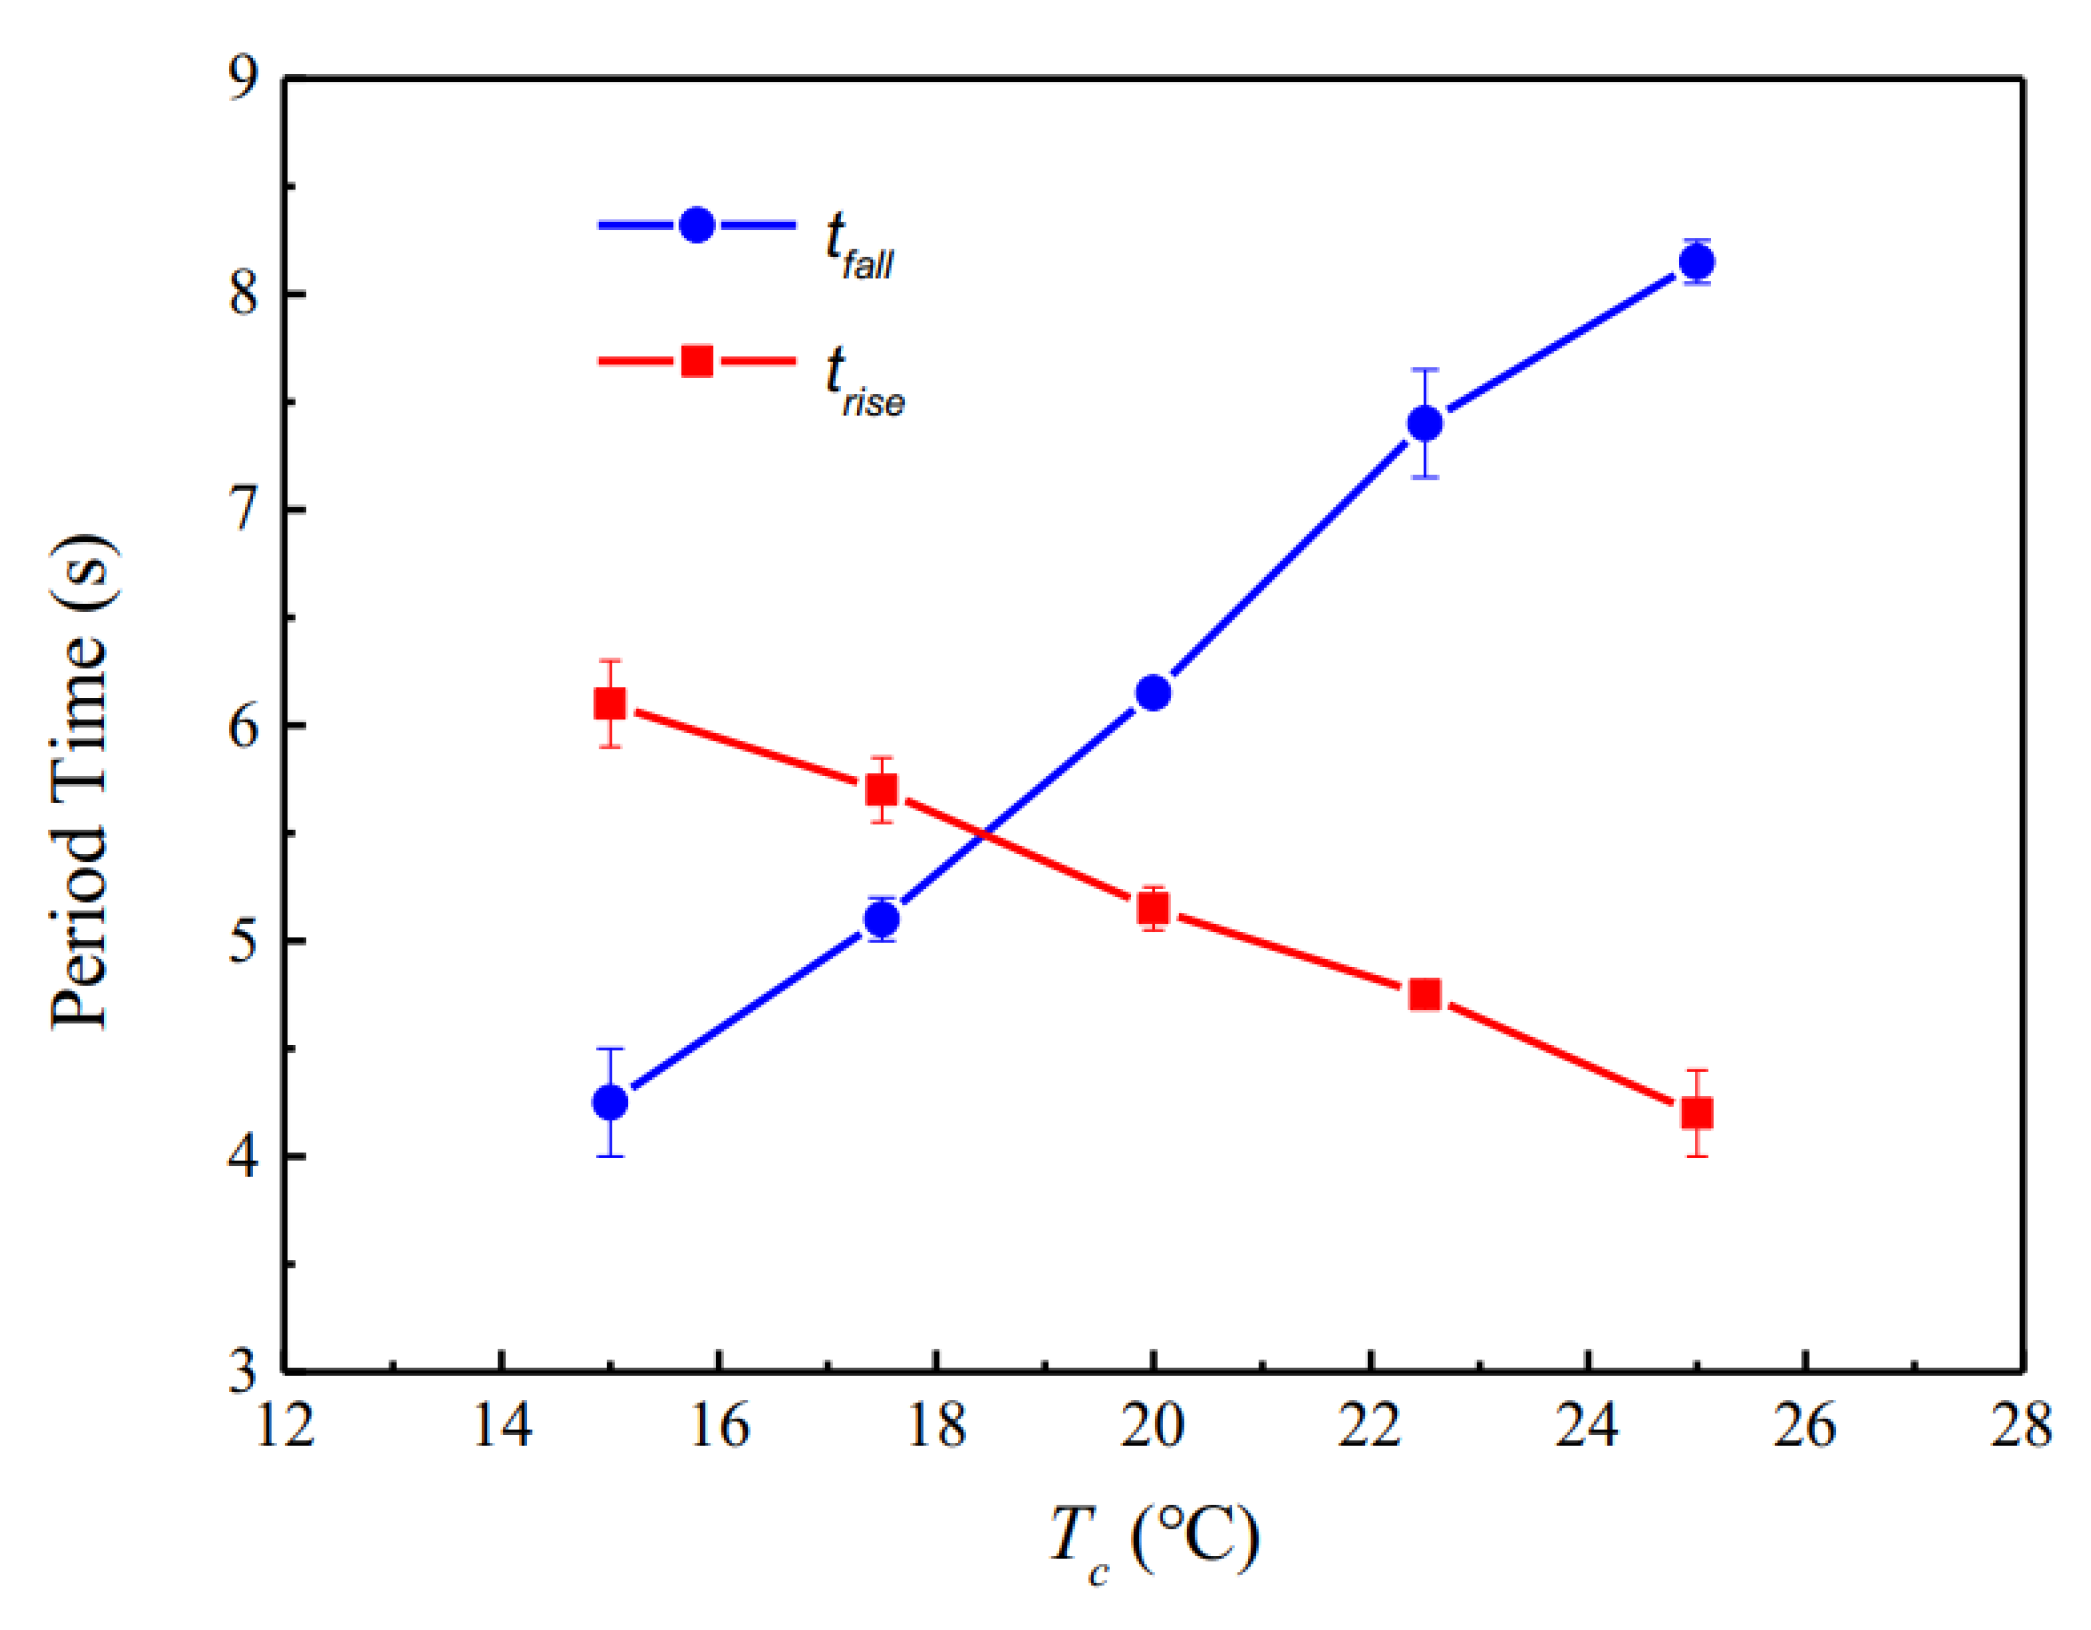
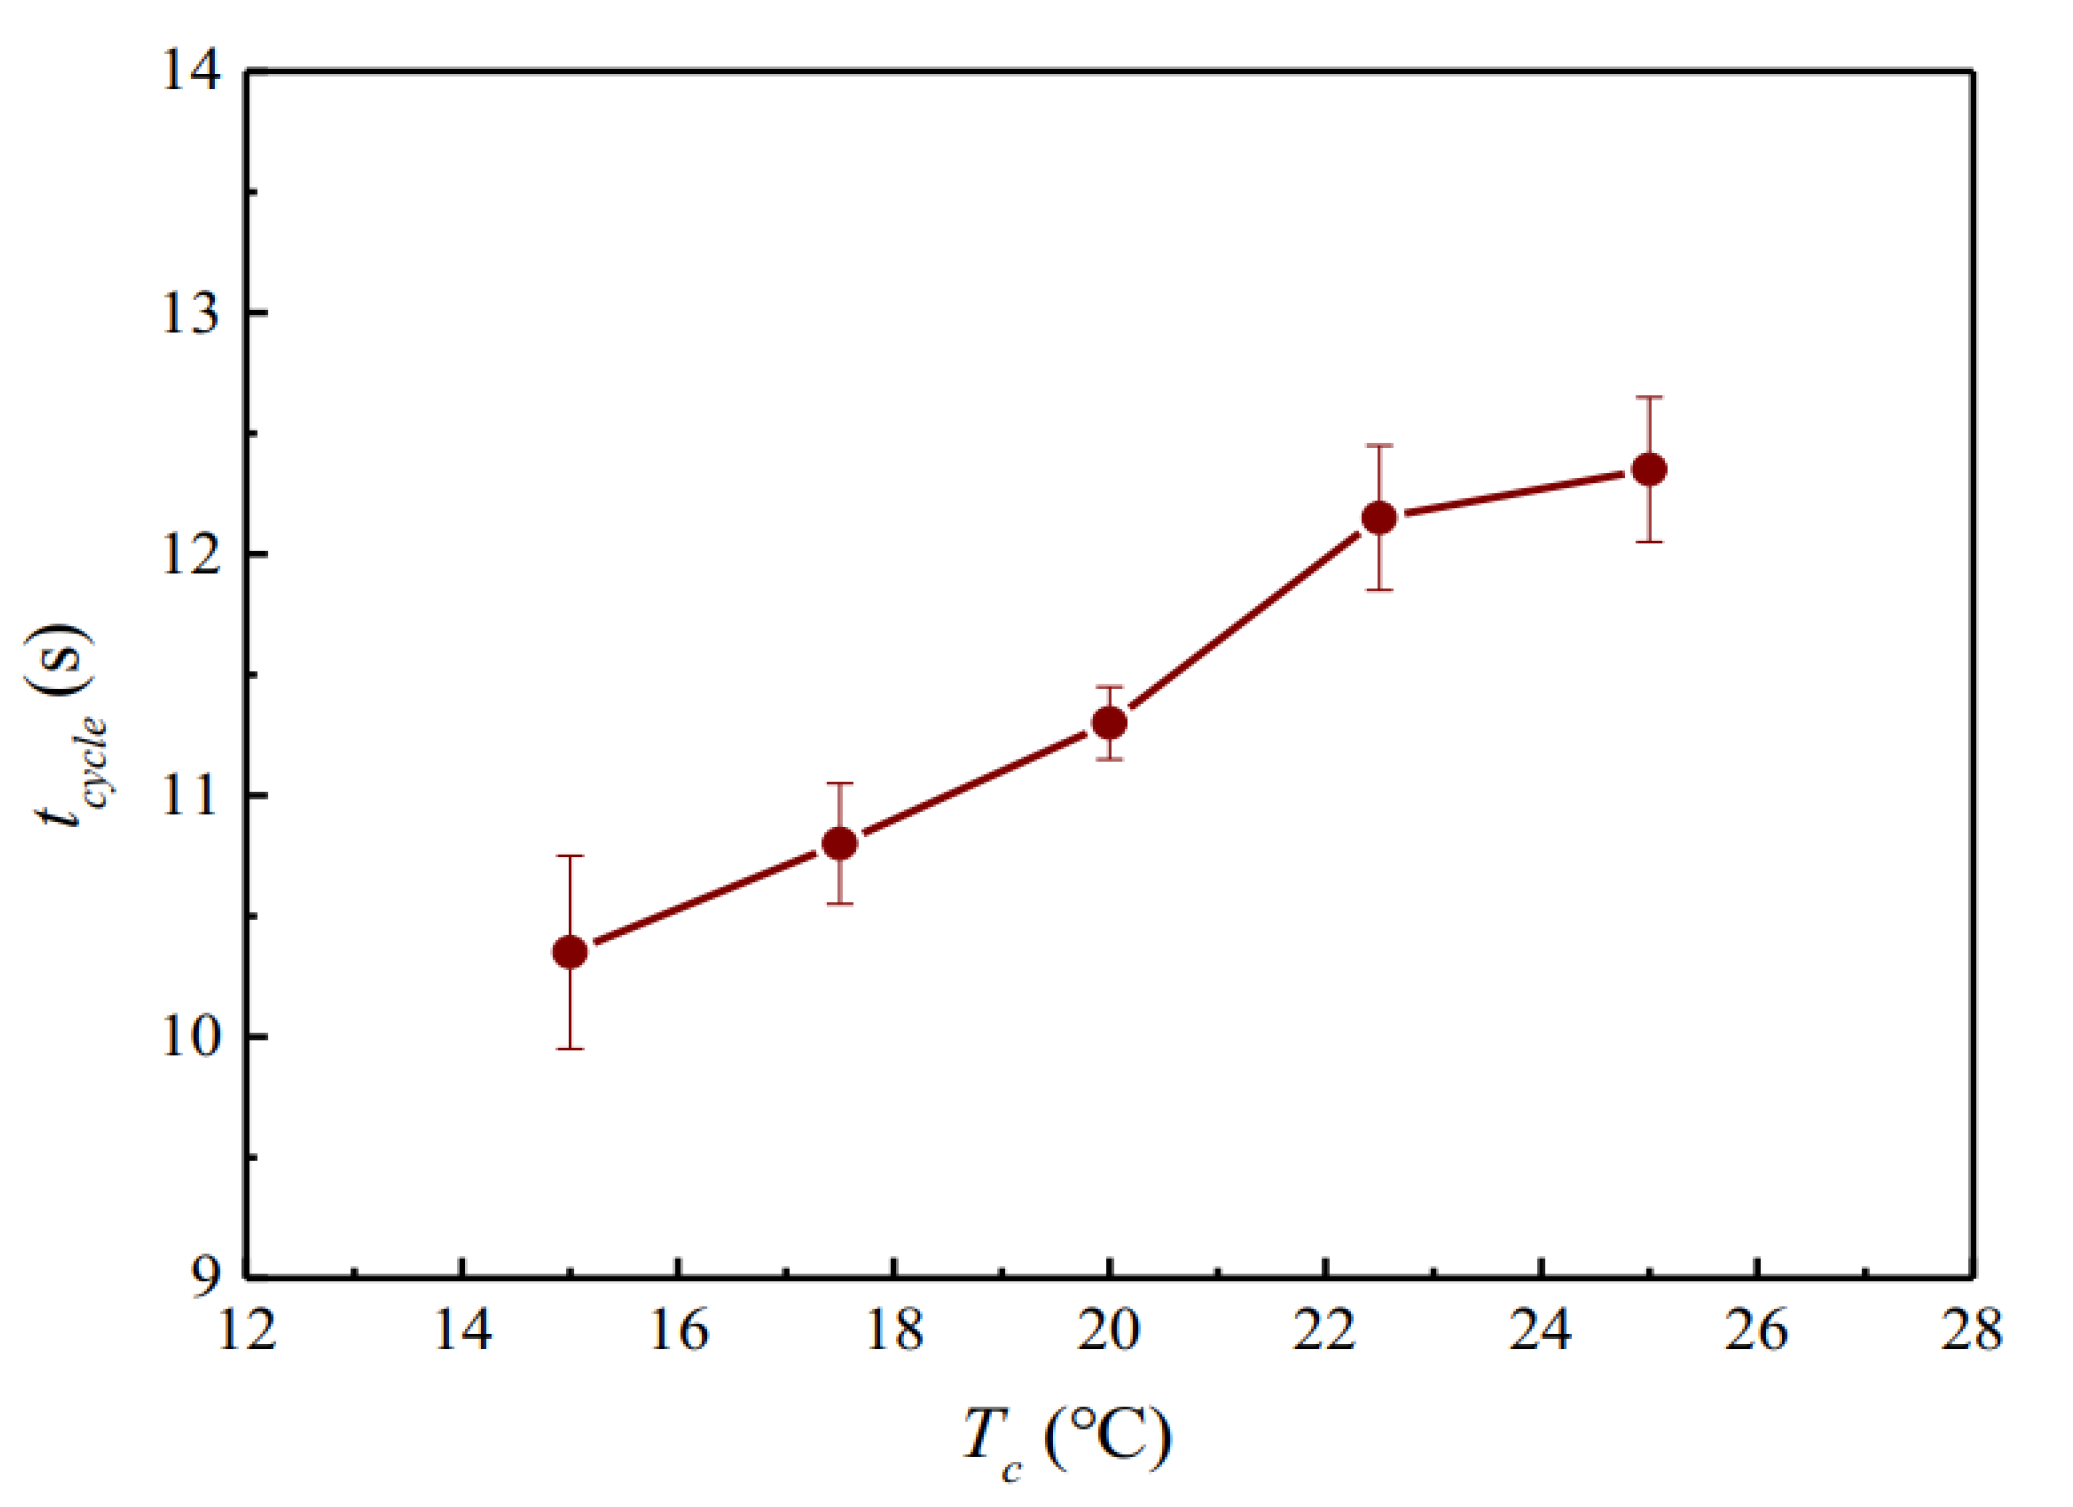
4.1. Transient Behaviors

Figure 6a illustrates the experimental setup for measuring the behaviors of the proposed thermal oscillator. In order to carefully control the boundary temperature for better characterization, the device was mounted on a thermoelectric cooler (TEC1-12706, Hebei I.T. Co.). The hot side of the thermoelectric cooler was water-cooled. The temperature of the cold side of the cooler could be adjusted by the applied voltage.
Three K-type thermocouples were used to measure the temperatures at the regions close to the PTC composite sensor ( T P T C ), the heater ( T h ), and the cold side of the thermoelectric cooler ( T c ), respectively.
The outputs of the thermocouples were acquired by a temperature input module (NI-9212, National Instruments Co.). The voltage drop across the divider resistor ( V d i v ) was measured by a data acquisition device (USB-6341, National Instruments Co.). By using Figure 1c, R P T C can be easily evaluated because V s , R d i v , and V d i v are given values. Figure 6b shows a photo of the measurement of the thermal oscillator with the thermocouples and cooler.
The initial resistances of the PTC composite sensor ( R P T C i n i ) and the microheaters (at 25 °C) were measured by using a multimeter. To confirm the fabrication reproducibility of the thermal oscillator, these measurements were repeated for two other PTC composite sensors and two microheaters from separate batches of fabrication. The results show that the initial resistances of the PTC composite sensors range from 310 Ω to 450 Ω, and the resistances of microheaters range from 24 Ω to 26 Ω.
The resistance vs. temperature curves for the devices with PTC films of different OA concentrations are shown in Figure 7. The graphite concentration was fixed at 25 wt%. Obviously, the resistivity of the material remained almost constant in the low-temperature region, but suddenly began to increase sharply when the temperature exceeded its T m . In addition, as shown in Figure 7, the T m of acrylate-based PTC materials is a strong function of OA concentration.
A PTC material with a T m lower than room temperature must be cooled to below room temperature in order to make a semicrystalline-to-amorphous transition, although heating is not required to make an amorphous-to-semicrystalline transition. On the other hand, a PTC material with a T m higher than room temperature can reach semicrystalline-to-amorphous transition with the assistance of the environment’s temperature.
It is quite simple to implement microheaters with other MEMS components monolithically, while active cooling devices are usually either bulky or difficult to integrate. Therefore, in order to avoid using an external highly efficient cooler, a PTC material with 80 mol% OA was chosen for the studies in the subsequent experiments.
Figure 8 shows the typical transient behavior of the proposed device with three consecutive cycles. V h and V s were 8.5 V and 7 V, respectively. T c was 25 °C, and R d i v was 400 Ω. As the device reached periodical steady state, T h oscillated from 40.7 °C to 92.5 °C. The temperature behaviors of the PTC temperature sensor lagged behind that of the heater by about 1/5 of a period, and T P T C stably oscillated between 26.8 °C to 27.6 °C. In addition, the corresponding R P T C , which was calculated by using the given values of V s , R d i v , and V d i v , is also shown in the figure. The oscillation period was 12.35 s.
A typical thermal oscillation cycle with a period ( t c y c l e ) of 10.55 s is shown in Figure 9. The rising time ( t r i s e ) and the falling time ( t f a l l ) are defined as the time interval from the lowest temperature to the highest temperature and that from the highest temperature to the lowest temperature, respectively.
We also studied the repeatability and drift of the proposed device by measuring the long-term transient responses for over 1000 cycles. Figure 10a represents a 1000 s (about 85 cycles) subset of the long-term test. As shown in the figure, the amplitude of thermal oscillation is about 51.7 °C, and the variation between each cycle is approximately 1.5%. Additionally, the figure shows that the drift was not obvious. These results indicate that the stability of the thermal oscillator was reasonably good.
Figure 10b–c show the measured V d i v and the calculated R P T C . It was observed that the phase transition of the PTC thermal sensor on the proposed thermal oscillator was accurately controlled for this long-term repeatability testing.

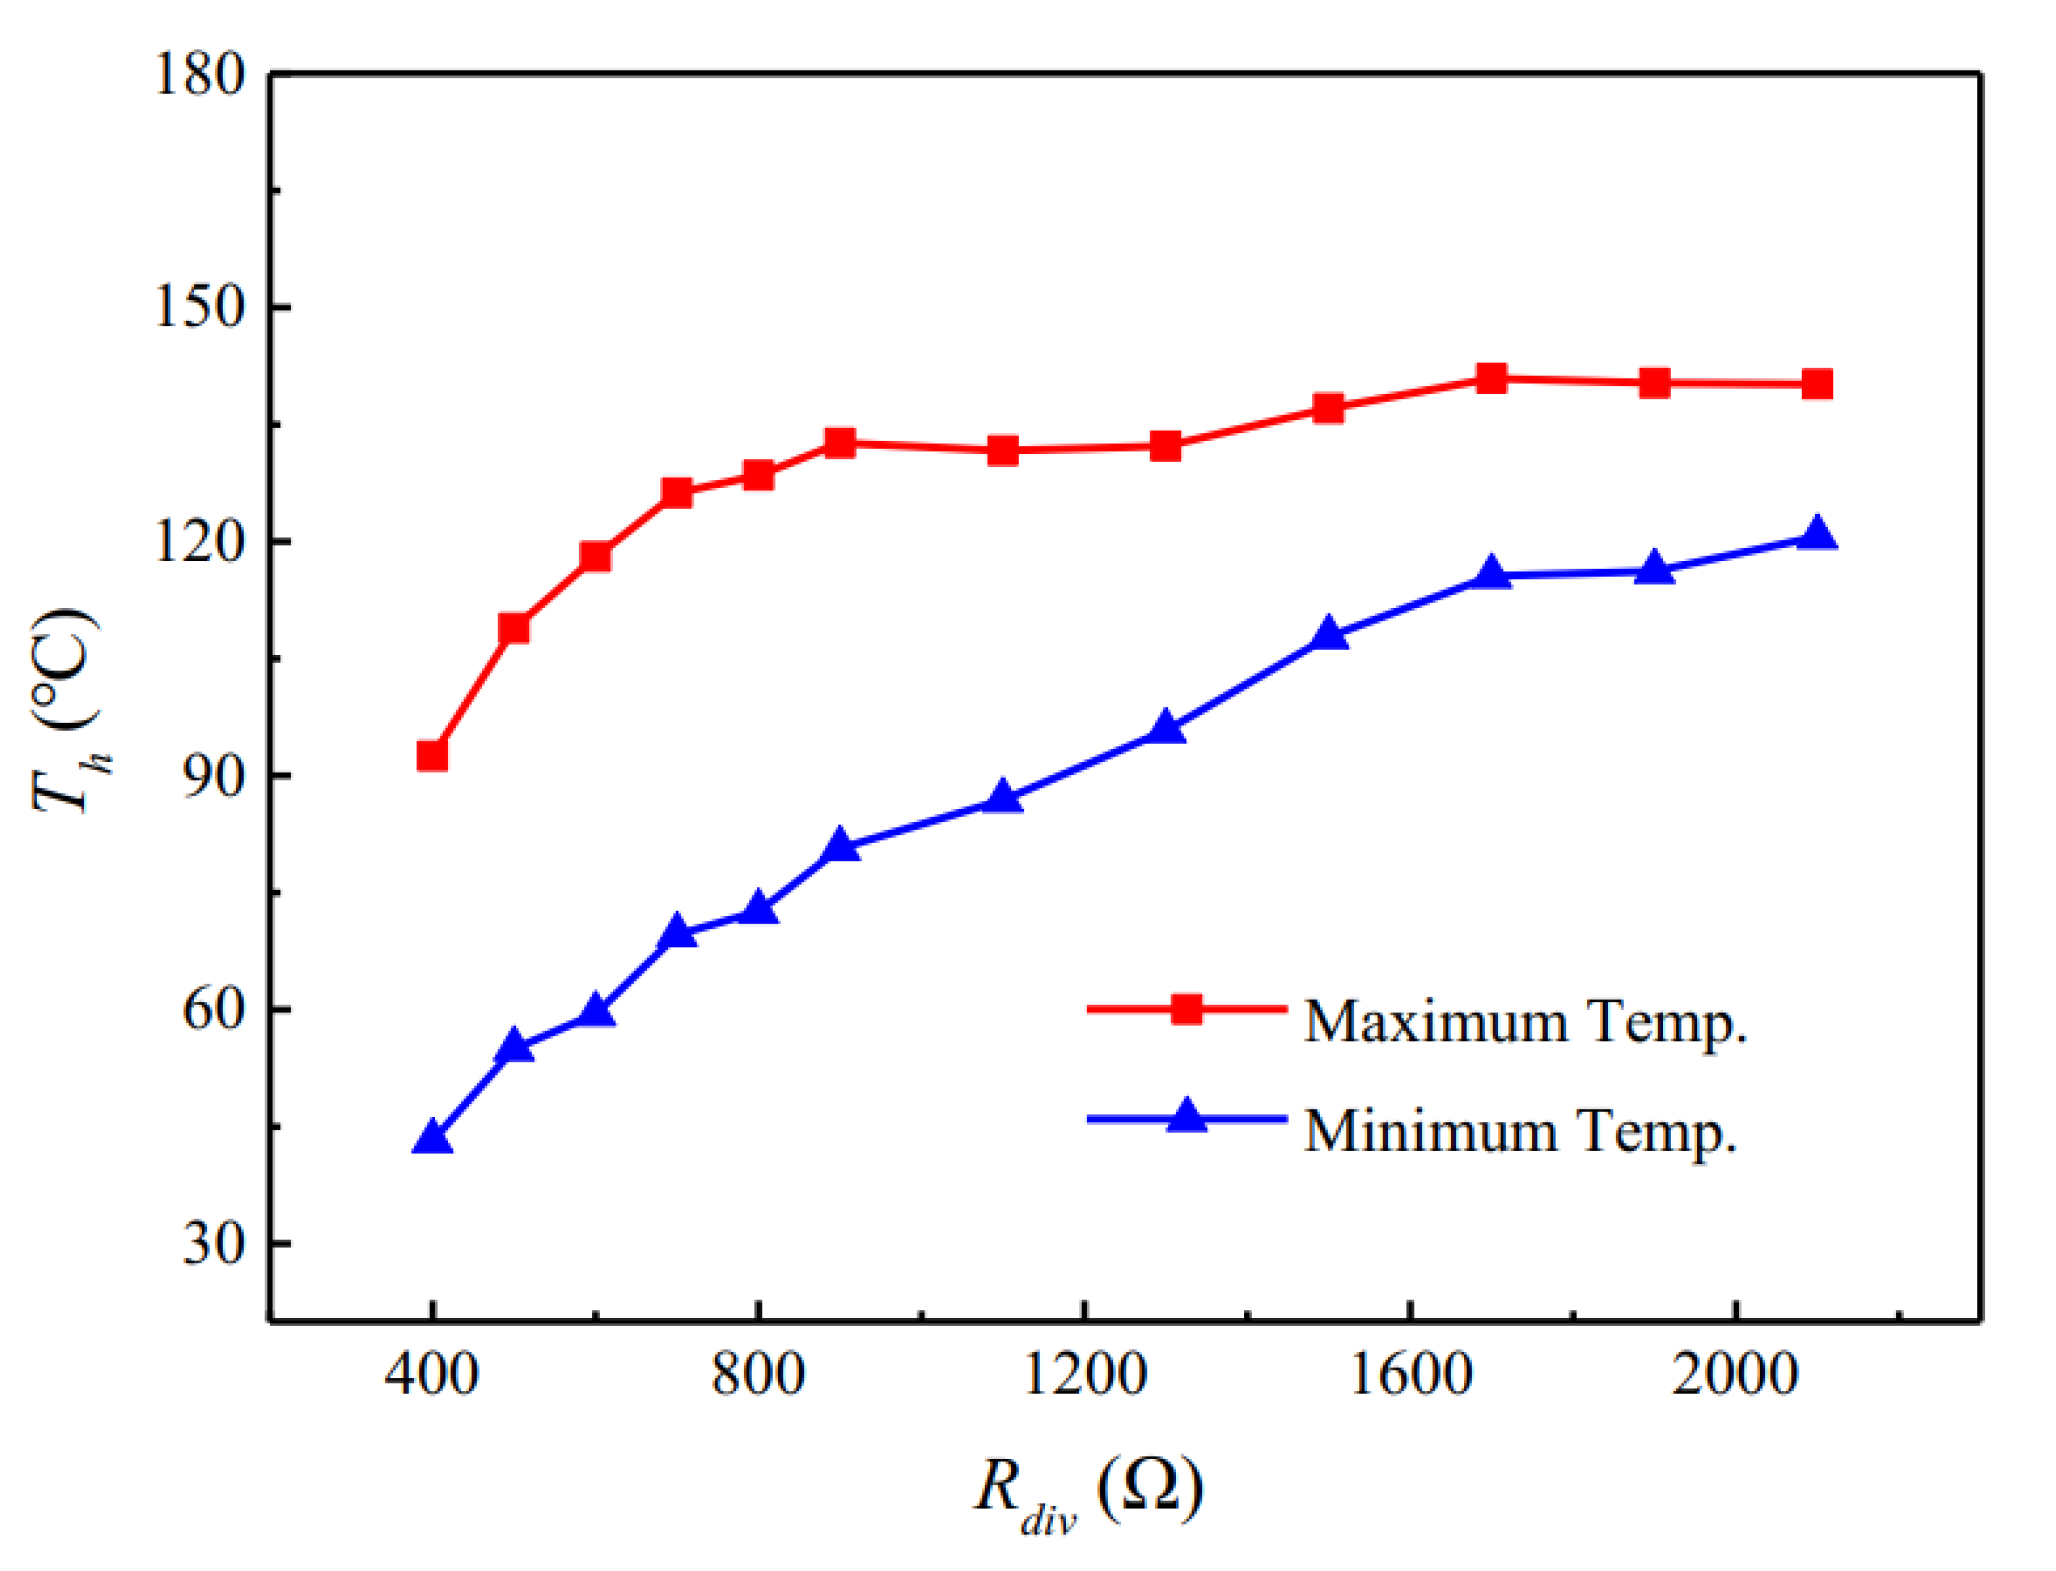
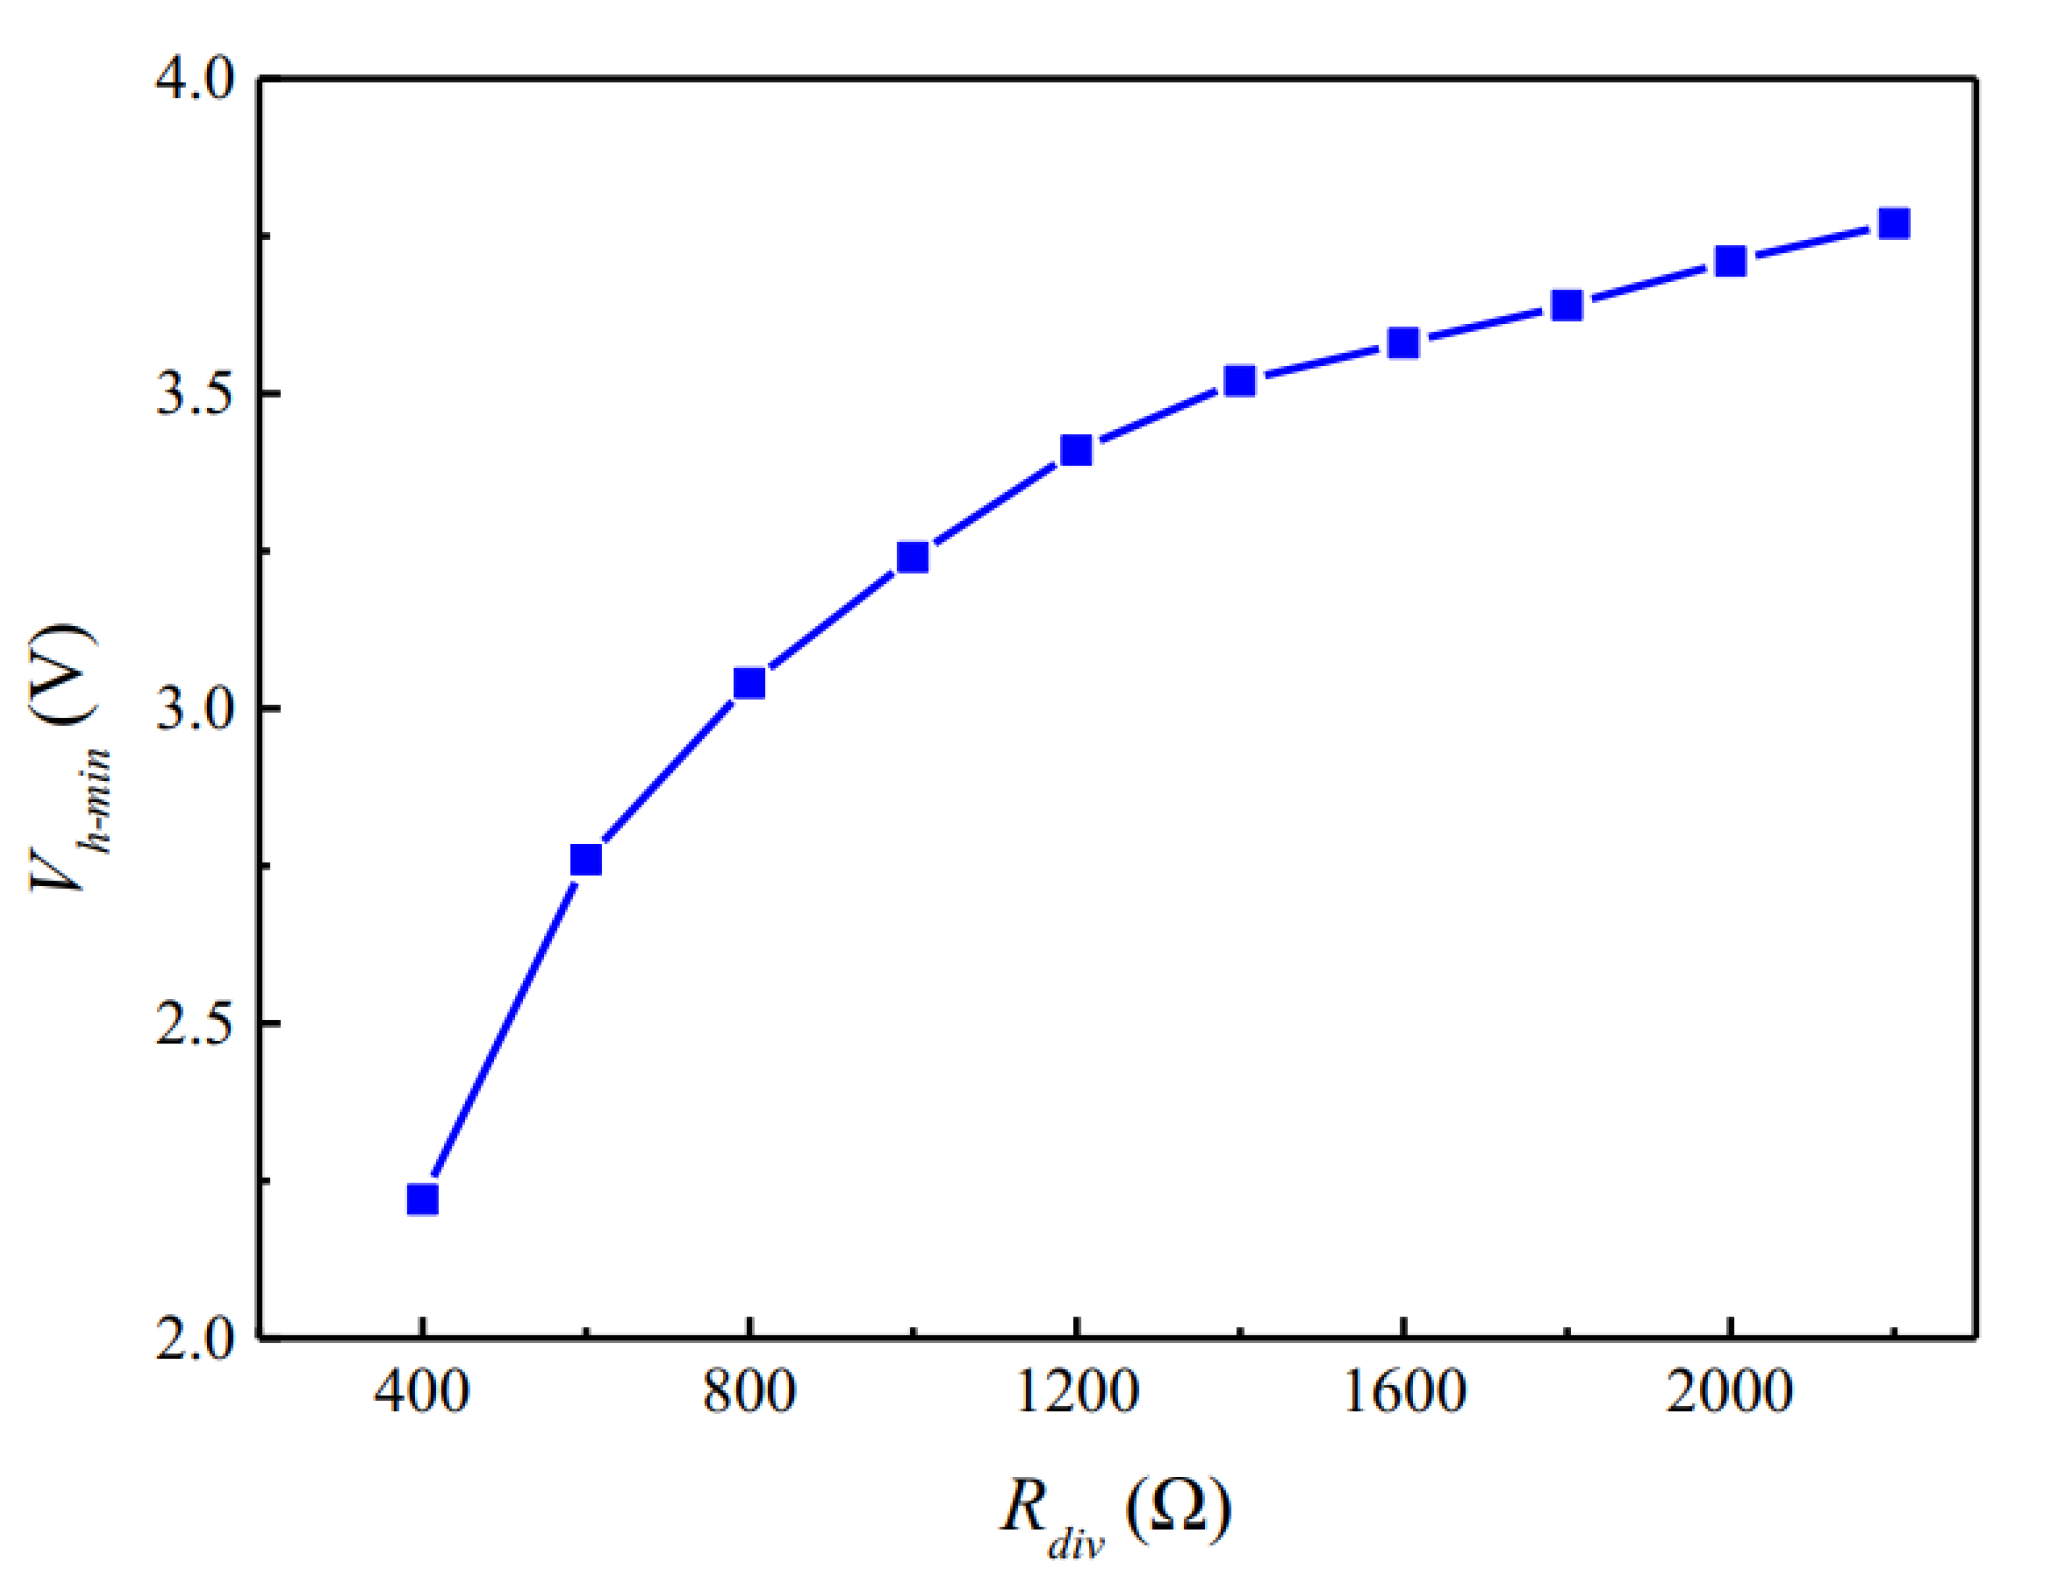
4.2. Discussions on Divider Resistance and Active Cooling

Figure 11 shows the relationship between the average maximum/minimum temperatures in an oscillation cycle and the R d i v , varied from 400 Ω to 2100 Ω. Note that the initial resistance of the PTC composite sensor at room temperature is about 400 Ω. By adjusting V s , the initial gate-to-source voltage (at 25 °C) of the MOSFET can be maintained at 4.2 V, which is slightly above the threshold voltage of the MOSFET to ensure that the MOSFET is in the saturation region at the beginning of the heating.
As shown in the figure, the minimum and maximum temperatures of each cycle increase as R d i v increases. The explanation is as follows. As R d i v is relatively small (e.g., around R P T C i n i , or 400 Ω), a minor increase in R P T C during heating can significantly decrease V d i v , which rapidly switches the MOSFET from the saturation region to the cut-off region. Therefore, the heating time is relatively short, which results in less heating, and the minimum and maximum temperatures are therefore relatively lower. As R d i v increases, the required change in R P T C for reducing V d i v to the value below the MOSFET threshold voltage becomes larger, and, therefore, a longer heating time is required, and the minimum and maximum temperatures become higher.
Figure 12 shows the minimum heating voltages ( V h min ) required to initialize oscillation for different R d i v . The conditions of the measurement are the same as those in Figure 11. As shown in Figure 12, V h min increases with R d i v . This is because a relatively larger R d i v requires a larger Δ R P T C to turn off the heater, which requires greater temperature variation on the PTC material, and therefore the required heating voltage ( V h ) becomes larger.
Figure 13 and Figure 14 show the effects of cooling by using a thermoelectric cooler. The relationships of t f a l l and t r i s e vs. T c are shown in Figure 13. Both relationships are quite linear. As T c decreases, the active cooling effect will be enhanced, and, therefore, t f a l l decreases. Simultaneously, t r i s e will increase because more heating is required. However, it is worth mentioning that the absolute value of the slopes of t f a l l vs. T c is larger than that of t r i s e vs. T c . This phenomenon leads to the results shown in Figure 14, which indicate that t c y c l e decreases as T c decreases.

5. Conclusions

In this paper, the development of a DC-driven electrothermal oscillator using an ultra-sensitive temperature-sensing acrylate composite is presented. The device consists of a microfabricated heater and an acrylate-based PTC composite temperature sensor. The oscillation of the device is enabled by the microheater self-switching on and off using the temperature sensor. The acrylate-based PTC composite was prepared by mixing a semi-crystalline acrylate copolymer with graphite particles. Fabricated PTC composites with different concentrations of OA were characterized. The measured results showed that the acrylate-copolymer-based sensor exhibited a resistance variation of about four orders of magnitude over a small temperature range of only 1.5 °C. Significant differences in resistance were also observed for PTC composites with different OA concentrations. The transient behaviors of different devices were also measured. Long-term stable temperature oscillation was observed, which indicates that the phase transition of the PTC material can be precisely controlled.

Author Contributions

Conceptualization, M.X., S.-W.C., and C.-C.Y.; Methodology, S.-W.C., M.X., and C.-C.Y.; Software, M.X. and S.-W.C.; Validation, M.X., S.-W.C., and C.-C.Y.; Writing—Original Draft Preparation, M.X.; Writing—Review & Editing, M.X. and Y.-J.Y.; Visualization, M.X. and S.-W.C.; Project Administration, Y.-J.Y.; Supervision, Y.-J.Y. All authors have read and agreed to the published version of the manuscript.

Funding

This research was funded in part by the Ministry of Science and Technology, Taiwan, R.O.C. (Contract No: 105-2221-E-002-126).

Acknowledgments

The authors would like to thank Kuo-Shen Chen from the Department of Mechanical Engineering of National Cheng-Kung University for his help on the device measurement. The authors would also like to thank Chuang-Yin Wang from the Department of Mechanical Engineering of National Taiwan University for his help on the fabrication of the devices.

Conflicts of Interest

The authors declare no conflict of interest.

References

  1. Zha, J.-W.; Zhang, B.; Li, R.K.Y.; Dang, Z.-M. High-performance strain sensors based on functionalized graphene nanoplates for damage monitoring. Compos. Sci. Technol. 2016, 123, 32–38. [Google Scholar] [CrossRef]
  2. Liu, H.; Li, Y.; Liu, Y.; Zheng, G.; Liu, C.; Shen, C.; Yan, X.; Guo, J.; Guo, Z. Electrically conductive thermoplastic elastomer nanocomposites at ultralow graphene loading levels for strain sensor applications. J. Mater. Chem. C 2016, 4, 157–166. [Google Scholar] [CrossRef]
  3. Wu, X.; Han, Y.; Zhang, X.; Lu, C. Highly sensitive, stretchable, and wash-durable strain sensor based on ultrathin conductive Layer@Polyurethane yarn for tiny motion monitoring. ACS Appl. Mater. Interfaces 2016, 8, 9936–9945. [Google Scholar] [CrossRef] [PubMed]
  4. Yurddaskal, M.; Erol, M.; Celik, E. Carbon black and graphite filled conducting nanocomposite films for temperature sensor applications. J. Mater. Sci. Mater. Electron. 2017, 11, 9514–9518. [Google Scholar] [CrossRef]
  5. Li, Y.; Liu, H.; Liu, Y.; Zheng, G.; Liu, C.; Chen, J.; Shen, C. Tuning of vapor sensing behaviors of eco-friendly conductive polymer composites utilizing ramie fiber. Sens. Actuators B Chem. 2015, 221, 1279–1289. [Google Scholar] [CrossRef]
  6. Song, W.-L.; Cao, M.-S.; Lu, M.-M.; Bi, S.; Wang, C.-Y.; Liu, J.; Yuan, J.; Fan, L.-Z. Flexible graphene/polymer composite films in sandwich structures for effective electromagnetic interference shielding. Carbon 2014, 66, 67–76. [Google Scholar] [CrossRef]
  7. Ma, P.-C.; Siddiqui, N.A.; Marom, G.; Kim, J.-K. Dispersion and functionalization of carbon nanotubes for polymer-based nanocomposites: A review. Compos. Part A Appl. Sci. Manuf. 2010, 41, 1345–1367. [Google Scholar] [CrossRef]
  8. Mamunya, Y.; Davydenko, V.; Pissis, P.; Lebedev, E. Electrical and thermal conductivity of polymers filled with metal powders. Eur. Polym. J. 2002, 38, 1887–1897. [Google Scholar] [CrossRef]
  9. Jiang, H.; Moon, K.-S.; Li, Y.; Wong, C.P. Surface functionalized silver nanoparticles for ultrahigh conductive polymer composites. Chem. Mater. 2006, 18, 2969–2973. [Google Scholar] [CrossRef]
  10. Pang, H.; Xu, L.; Yan, D.-X.; Li, Z.-M. Conductive polymer composites with segregated structures. Prog. Polym. Sci. 2014, 39, 1908–1933. [Google Scholar] [CrossRef]
  11. Frydman, E. Improvements in or Relating to Resistance Elements Having Positive Temperature/Resistance Characteristics. U.K. Patent 604,695, 16 November 1945. [Google Scholar]
  12. Kohler, F. Resistance Element. U.S. Patent 3,243,753, 29 March 1966. [Google Scholar]
  13. Ohe, K.; Naito, Y. A new resistor having an anomalously large positive temperature coefficient. Jpn. J. Appl. Phys. 1971, 10, 99–108. [Google Scholar] [CrossRef]
  14. Klason, C.; Kubát, J. Anomalous behavior of electrical conductivity and thermal noise in carbon black-containing polymers at Tg and Tm. J. Appl. Polym. Sci. 1975, 19, 831–845. [Google Scholar] [CrossRef]
  15. He, X.J.; Du, J.H.; Ying, Z.; Cheng, H.-M. Positive temperature coefficient effect in multiwalled carbon nanotube/high-density polyethylene composites. Appl. Phys. Lett. 2005, 86, 62112. [Google Scholar] [CrossRef]
  16. Chen, R.; Bin, Y.; Zhang, R.; Dong, E.; Ougizawa, T.; Kuboyama, K.; Mastuo, M. Positive temperature coefficient effect of polymer-carbon filler composites under self-heating evaluated quantitatively in terms of potential barrier height and width associated with tunnel current. Polymer 2012, 53, 5197–5207. [Google Scholar] [CrossRef]
  17. Liu, Y.; Zhang, H.; Porwal, H.; Tu, W.; Evans, J.; Newton, M.; Busfield, J.J.C.; Peijs, T.; Bilotti, E. Universal control on pyroresistive behavior of flexible self-regulating heating devices. Adv. Funct. Mater. 2017, 27, 1702253. [Google Scholar] [CrossRef]
  18. Skindhoj, J.; Glatz-Reichenbach, J.; Strumpler, R. Repetitive current limiter based on polymer PTC resistor. IEEE Trans. Power Deliv. 1998, 13, 489–494. [Google Scholar] [CrossRef]
  19. Yokota, T.; Inoue, Y.; Terakawa, Y.; Reeder, J.; Kaltenbrunner, M.; Ware, T.; Yang, K.; Mabuchi, K.; Murakawa, T.; Sekino, M.; et al. Ultraflexible, large-area, physiological temperature sensors for multipoint measurements. Proc. Natl. Acad. Sci. USA 2015, 112, 14533–14538. [Google Scholar] [CrossRef] [PubMed] [Green Version]
  20. Chen, J.; Tsubokawa, N. Novel gas sensor from polymer-grafted carbon black: Vapor response of electric resistance of conducting composites prepared from poly(ethylene-block-ethylene oxide)-grafted carbon black. J. Appl. Polym. Sci. 2000, 77. [Google Scholar] [CrossRef]
  21. Le, A.V.; Wang, M.; Noelle, D.J.; Shi, Y.; Qiao, Y. Mitigating thermal runaway of lithium-ion battery by using thermally sensitive polymer blend as cathode binder. J. Appl. Polym. Sci. 2017, 135, 45737. [Google Scholar] [CrossRef]
Figure 1. Illustration of the proposed DC-driven oscillator device. (a) Schematic of the thermal oscillator. (b) Resistivity–temperature characteristic of positive temperature coefficient (PTC) materials. (c) The circuit diagram. (d) Illustration of the self-switching on–off phenomenon.
Applsci 10 03825 g001
Figure 2. Preparation of the PTC composite.
Applsci 10 03825 g002
Figure 3. SEM images of the prepared acrylate PTC composite.
Applsci 10 03825 g003
Figure 4. Fabrication process for the proposed thermal oscillator.
Applsci 10 03825 g004
Figure 5. Fabrication results. (a) The bottom layer. (b) Assembled DC-driven thermal oscillator.
Applsci 10 03825 g005
Figure 6. (a) Illustration of experimental setup. (b) Measurement of the thermal oscillator with thermocouples and cooler.
Applsci 10 03825 g006
Figure 7. Thermal response of acrylate PTC composites.
Applsci 10 03825 g007
Figure 8. Transient behavior of the proposed device.
Applsci 10 03825 g008
Figure 9. Illustration of a typical heat cycle.
Applsci 10 03825 g009
Figure 10. The results of long-term tests for a 1000 s subset of the 7200 s duration test. (a) Result of T h . (b) Result of V d i v . (c) Result of R P T C .
Applsci 10 03825 g010
Figure 11. Relationship between the average maximum/minimum temperatures and the R d i v , varied from 400 Ω to 2100 Ω.
Applsci 10 03825 g011
Figure 12. The minimum V h for initializing oscillation at different R d i v .
Applsci 10 03825 g012
Figure 13. Measured rising time and falling time at different cooling temperatures.
Applsci 10 03825 g013
Figure 14. Measured period at different cooling temperatures.
Applsci 10 03825 g014

