Article

A Household Energy Efficiency Index Assessment Method Based on Non-Intrusive Load Monitoring Data

1
Key Laboratory of Smart Grid of Ministry of Education, Tianjin University, Tianjin 300072, China
2
Tianjin Electric Power Research Institute, State Grid Tianjin Electric Power Company, Tianjin 300384, China
*
Authors to whom correspondence should be addressed.
Appl. Sci. 2020, 10(11), 3820; https://doi.org/10.3390/app10113820
Submission received: 22 April 2020 / Revised: 27 May 2020 / Accepted: 27 May 2020 / Published: 30 May 2020
(This article belongs to the Collection Energy-efficient Internet of Things (IoT))

Abstract

:
Various countries in the world are vigorously developing energy-saving industries and attaching importance to the improvement of household energy efficiency, but it is difficult to evaluate user power consumption characteristics due to insufficient information and large data granularity. It is, however, possible to evaluate the energy efficiency of household users via non-intrusive load monitoring (NILM). This paper explores the energy efficiency assessment of residential users and proposes a household energy efficiency assessment method based on NILM data. An energy efficiency assessment index of residents is provided by analyzing factors that affect residents’ energy efficiency. This index is clear, operable, and easy to obtain and quantify. Based on NILM information, clustering, and comprehensive evaluation, as well as combining the entropy weight method with the Technique for Order Preference by Similarity to an Ideal Solution (TOPSIS), a user’s energy efficiency can be evaluated and analyzed. Some case studies are provided to verify the validity of the proposed method based on non-intrusive information, to analyze the characteristics and deficiencies of the user’s energy consumption, and to give corresponding energy recommendations.

1. Introduction

The rapid economic growth over the past few decades has been accompanied by a series of environmental problems. Along with the generalization of developing green electricity and low-carbon economy concepts, many countries are striving to build low-carbon economies that save energy and reduce emissions. Promoting the widespread use of renewable energy sources (RES) has become a common goal. Additionally, demand-side management (DSM) is often adopted to guide energy users to improve their electricity habits and reduce electricity costs. Thus, it is particularly important to improve the energy efficiency of residents by establishing energy efficiency evaluation index systems and evaluation methods. In this way, the level of household electricity consumption can be measured, and users can be guided to use electricity reasonably by providing a scientific basis for the optimal dispatch of DSM by electric power companies [1].
It has become a new goal of household energy management to improve users’ electricity habits, reduce electricity costs, and promote efficient application of new energy equipment through DSM. To achieve this goal, it is indispensable to collect power consumption information, such as electricity consumption, energy using period, and the type of energy, and to analyze users’ energy consumption habits, patterns, and conditions by excavating and examining data. In the process of user analysis, energy efficiency assessment can be conducted for different user groups to guide their rational use of electricity so as to reduce energy consumption by combining information on local climate, users’ conditions, and electricity prices. This will generate corresponding economic benefits and bring social benefits to the reform of the power system.
Some scholars have studied the assessment of energy efficiency and made fruitful achievements. For example, Amir et al. [2] introduced a process to rank buildings’ energy efficiency and calculate the confidence interval of their ranks by taking the effects of weather, seasonal changes, and lifestyle on household energy consumption into account. Additionally, Liu et al. [3] established an index system to assess the energy efficiency rating of enterprises from four aspects: economic energy efficiency, electric energy information, production information, and electric energy pollution, but they did not consider the factors of enterprise production scale. Qu et al. [4] established a household energy efficiency assessment system for household users’ electricity behavior and the characteristics of using electrical appliances. However, electromagnetism does not have a high impact on the electricity consumption of residents, or the relationship between them is not very certain. In a study by Ma et al. [5], the index system was divided into two levels, macro and micro, to analyze the energy consumption of enterprises, but the energy efficiency of users cannot be accurately indicated in the selection of indicators. Yoshiyuki et al. [6] introduced a city- or grid-scale residential energy end-use simulation model that focuses on the energy efficiency assessment of residential users from the perspective of energy conservation and emission reduction. An index system established by Zheng et al. [7] considered the use of distributed power by enterprise users. Tian et al. [8] took the impact of management of energy efficiency on energy efficiency in enterprises into account. Zhang et al. [9] built an integrated energy efficiency assessment system for large industrial users based on the hierarchical analysis structure. Heidari et al. [10] used the inventory model to analyze the energy efficiency potential of Swiss lighting. The results showed that LED lighting has a greater energy-saving potential. Xu et al. [11] identified 12 indicators that affect household energy consumption, including demographic, economic, individual, climatic, technical, lifestyle, and structural factors. The level of electricity consumption in Singapore was also analyzed in this paper. Zhang et al. [12,13] analyzed the effects of residential electricity prices, per capita GDP, population, cooling degree days, and rainfall on electricity consumption by Chinese residents. Monica et al. [14] considered different energy-saving measures—such as using insulation materials, changing lighting devices and refrigerators to reduce power consumption, and using renewable energy such as photovoltaics—and used multi-objective genetic algorithms to solve optimization problems in order to minimize Portugal’s residential energy consumption. Suástegui et al. [15] collected information on residential building features, energy use, and user’s income to assess energy efficiency. The evaluation results showed that by replacing air conditioners, users can reduce their electricity consumption by 32% annually, and income level is proportional to electricity consumption. In summer, the housing area is proportional to the electricity consumption. Li et al. [16] and Su et al. [17] studied factors that affect household energy efficiency other than household appliances, such as resident age, house ownership, and energy-saving rebound effects. As an essential element of modernizing power grids to form future smart grids, distributed generations (DGs) have developed rapidly in recent years [18]. Sepehr et al. [19] proposed a bottom-up method to study the random behavior of power users, which took into account the number of residents and the use of different equipment to get the behavior of residents. The evolution of smart distribution grids is driven by the rapid growth of distributed energy resources (DERs) [20]. The integration of DERs, such as DGs, distributed storage (DS), demand response (DR), electric vehicles (EVs), and microgrids (MGs), makes the distribution system more active [21]. Roberto et al. [22] summarized the existing energy efficiency assessment methods and tools. In their review, the assessment objects were mainly industrial systems, and the difficulty of energy data collection resulting in a lack of data was identified as a recurring problem. Thus, increasing the availability of data is important for improving the accuracy of data. Non-intrusive load monitoring (NILM) can be used to solve the problem of insufficient data, which can, in turn, effectively solve various problems caused by a lack of data and improve the accuracy of an energy efficiency assessment. Many researchers have analyzed the energy efficiency level of industrial users, but there are few papers on the energy efficiency assessment of ordinary residents. Moreover, some indicators are difficult to obtain, or it is difficult to assess their impacts on residential energy efficiency.
It is difficult to evaluate the power consumption characteristics of users due to insufficient information and large data granularity, which is the main problem addressed in this paper. With NILM data, the user’s power consumption information is integrated, and the energy efficiency analysis is performed. The power consumption information includes the user’s hourly power consumption, the hourly power consumption of household appliances, and the total power consumption. Through this information, this paper explores an energy efficiency assessment of residential users, constructs a family energy efficiency indicator system, and then proposes a household energy efficiency assessment method based on NILM data. This method can reflect upon the impacts of household population, area, and income on users’ electricity consumption; classify users according to user feature; unite the entropy weight method with the solution distance method to evaluate users’ energy efficiency; and finally give users suggestions through the target method. Compared with existing methods, this method has the following features:
(1) It can build a user portrait label system by studying the portrayal of each user. The integration of refined electricity consumption data and marketing data can accurately sketch out the user’s electrical behavior, and the power company can accurately conduct marketing for different users.
(2) It can make an evaluation index system for residents’ energy efficiency based on the main factors affecting residents’ energy efficiency. The evaluating indicator data for various influencing factors are easy to obtain because this system contains basic family information, the user’s energy consumption characteristics, residential energy efficiency, and the impact of distributed generation.
(3) There are a large number of identifiable electrical appliances and their unique properties in non-invasive load monitoring, so this paper provides a dimensionality reduction strategy based on the principal component analysis method, which classifies users through k-means, and the entropy weight method and TOPSIS method are combined to make a comprehensive and accurate analysis of power consumption manner.
The remaining content is organized as follows: Section 2 describes the framework and data sources of the energy efficiency assessment system; Section 3 presents the development of the energy efficiency assessment indicator system and evaluation method, and details the evaluation process; case studies and analytic results are reported in Section 4; and conclusions are drawn in Section 5.

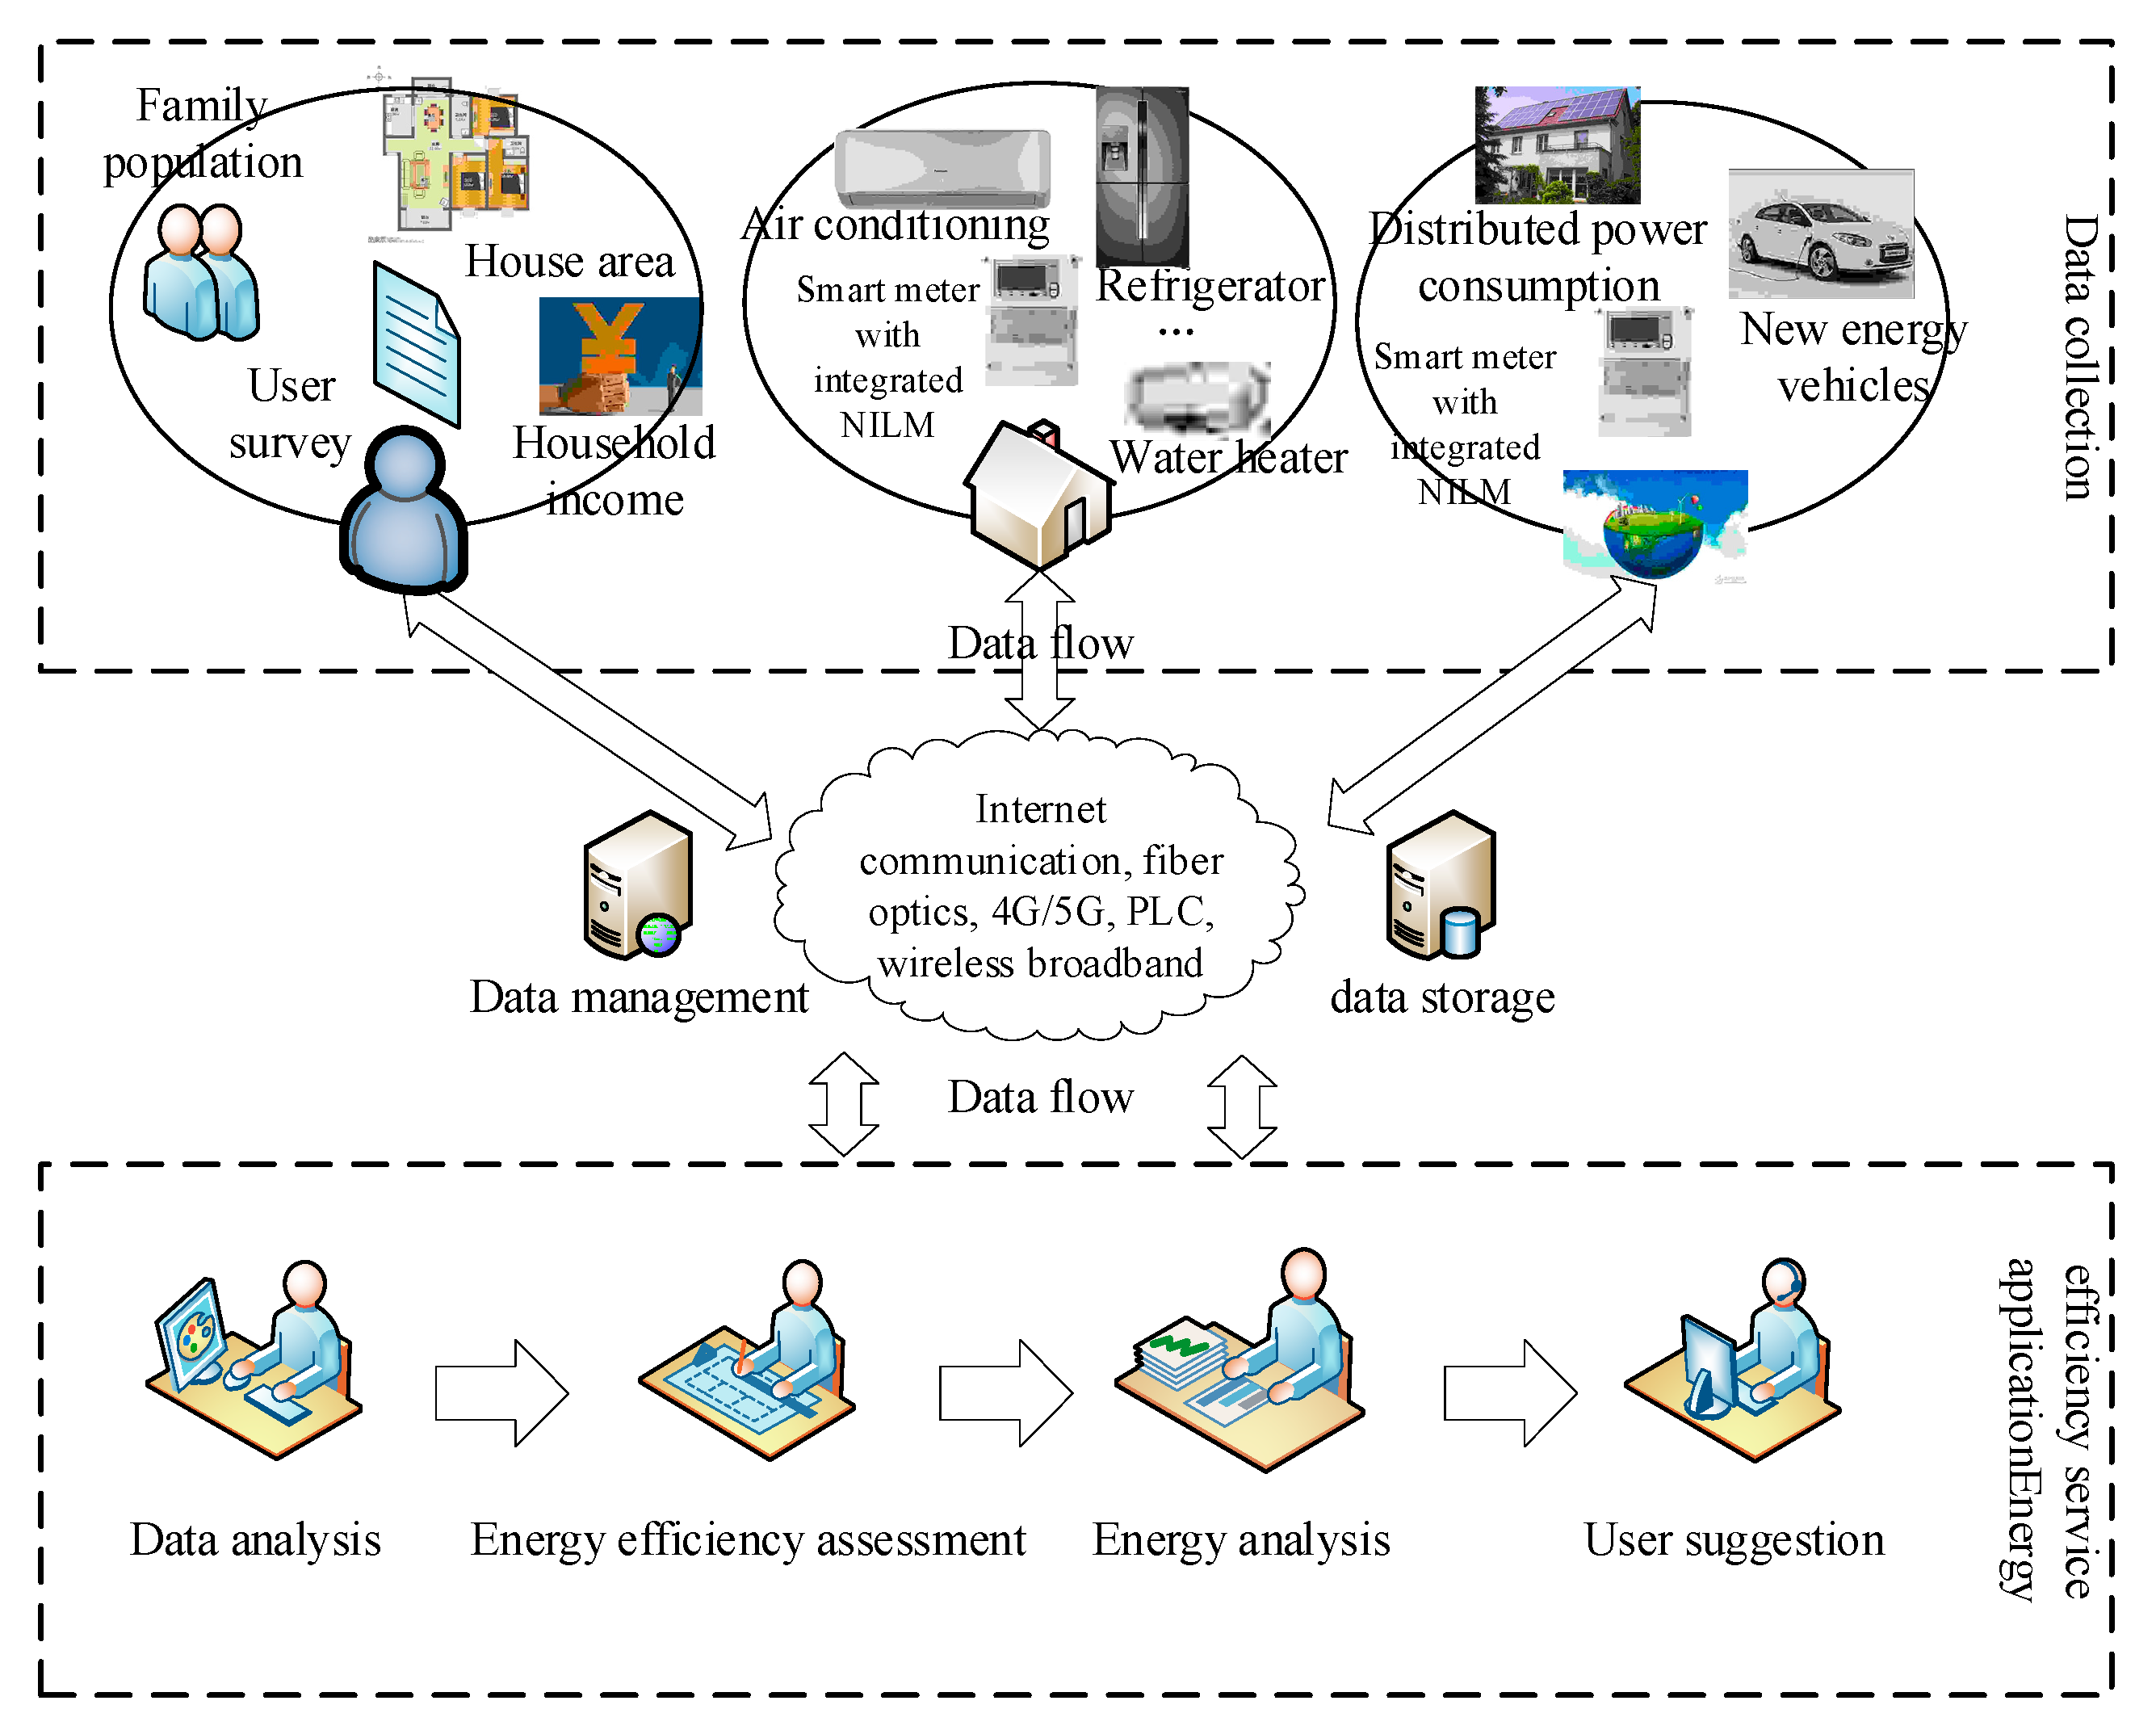
2. Household Energy Efficiency System Architecture and Data

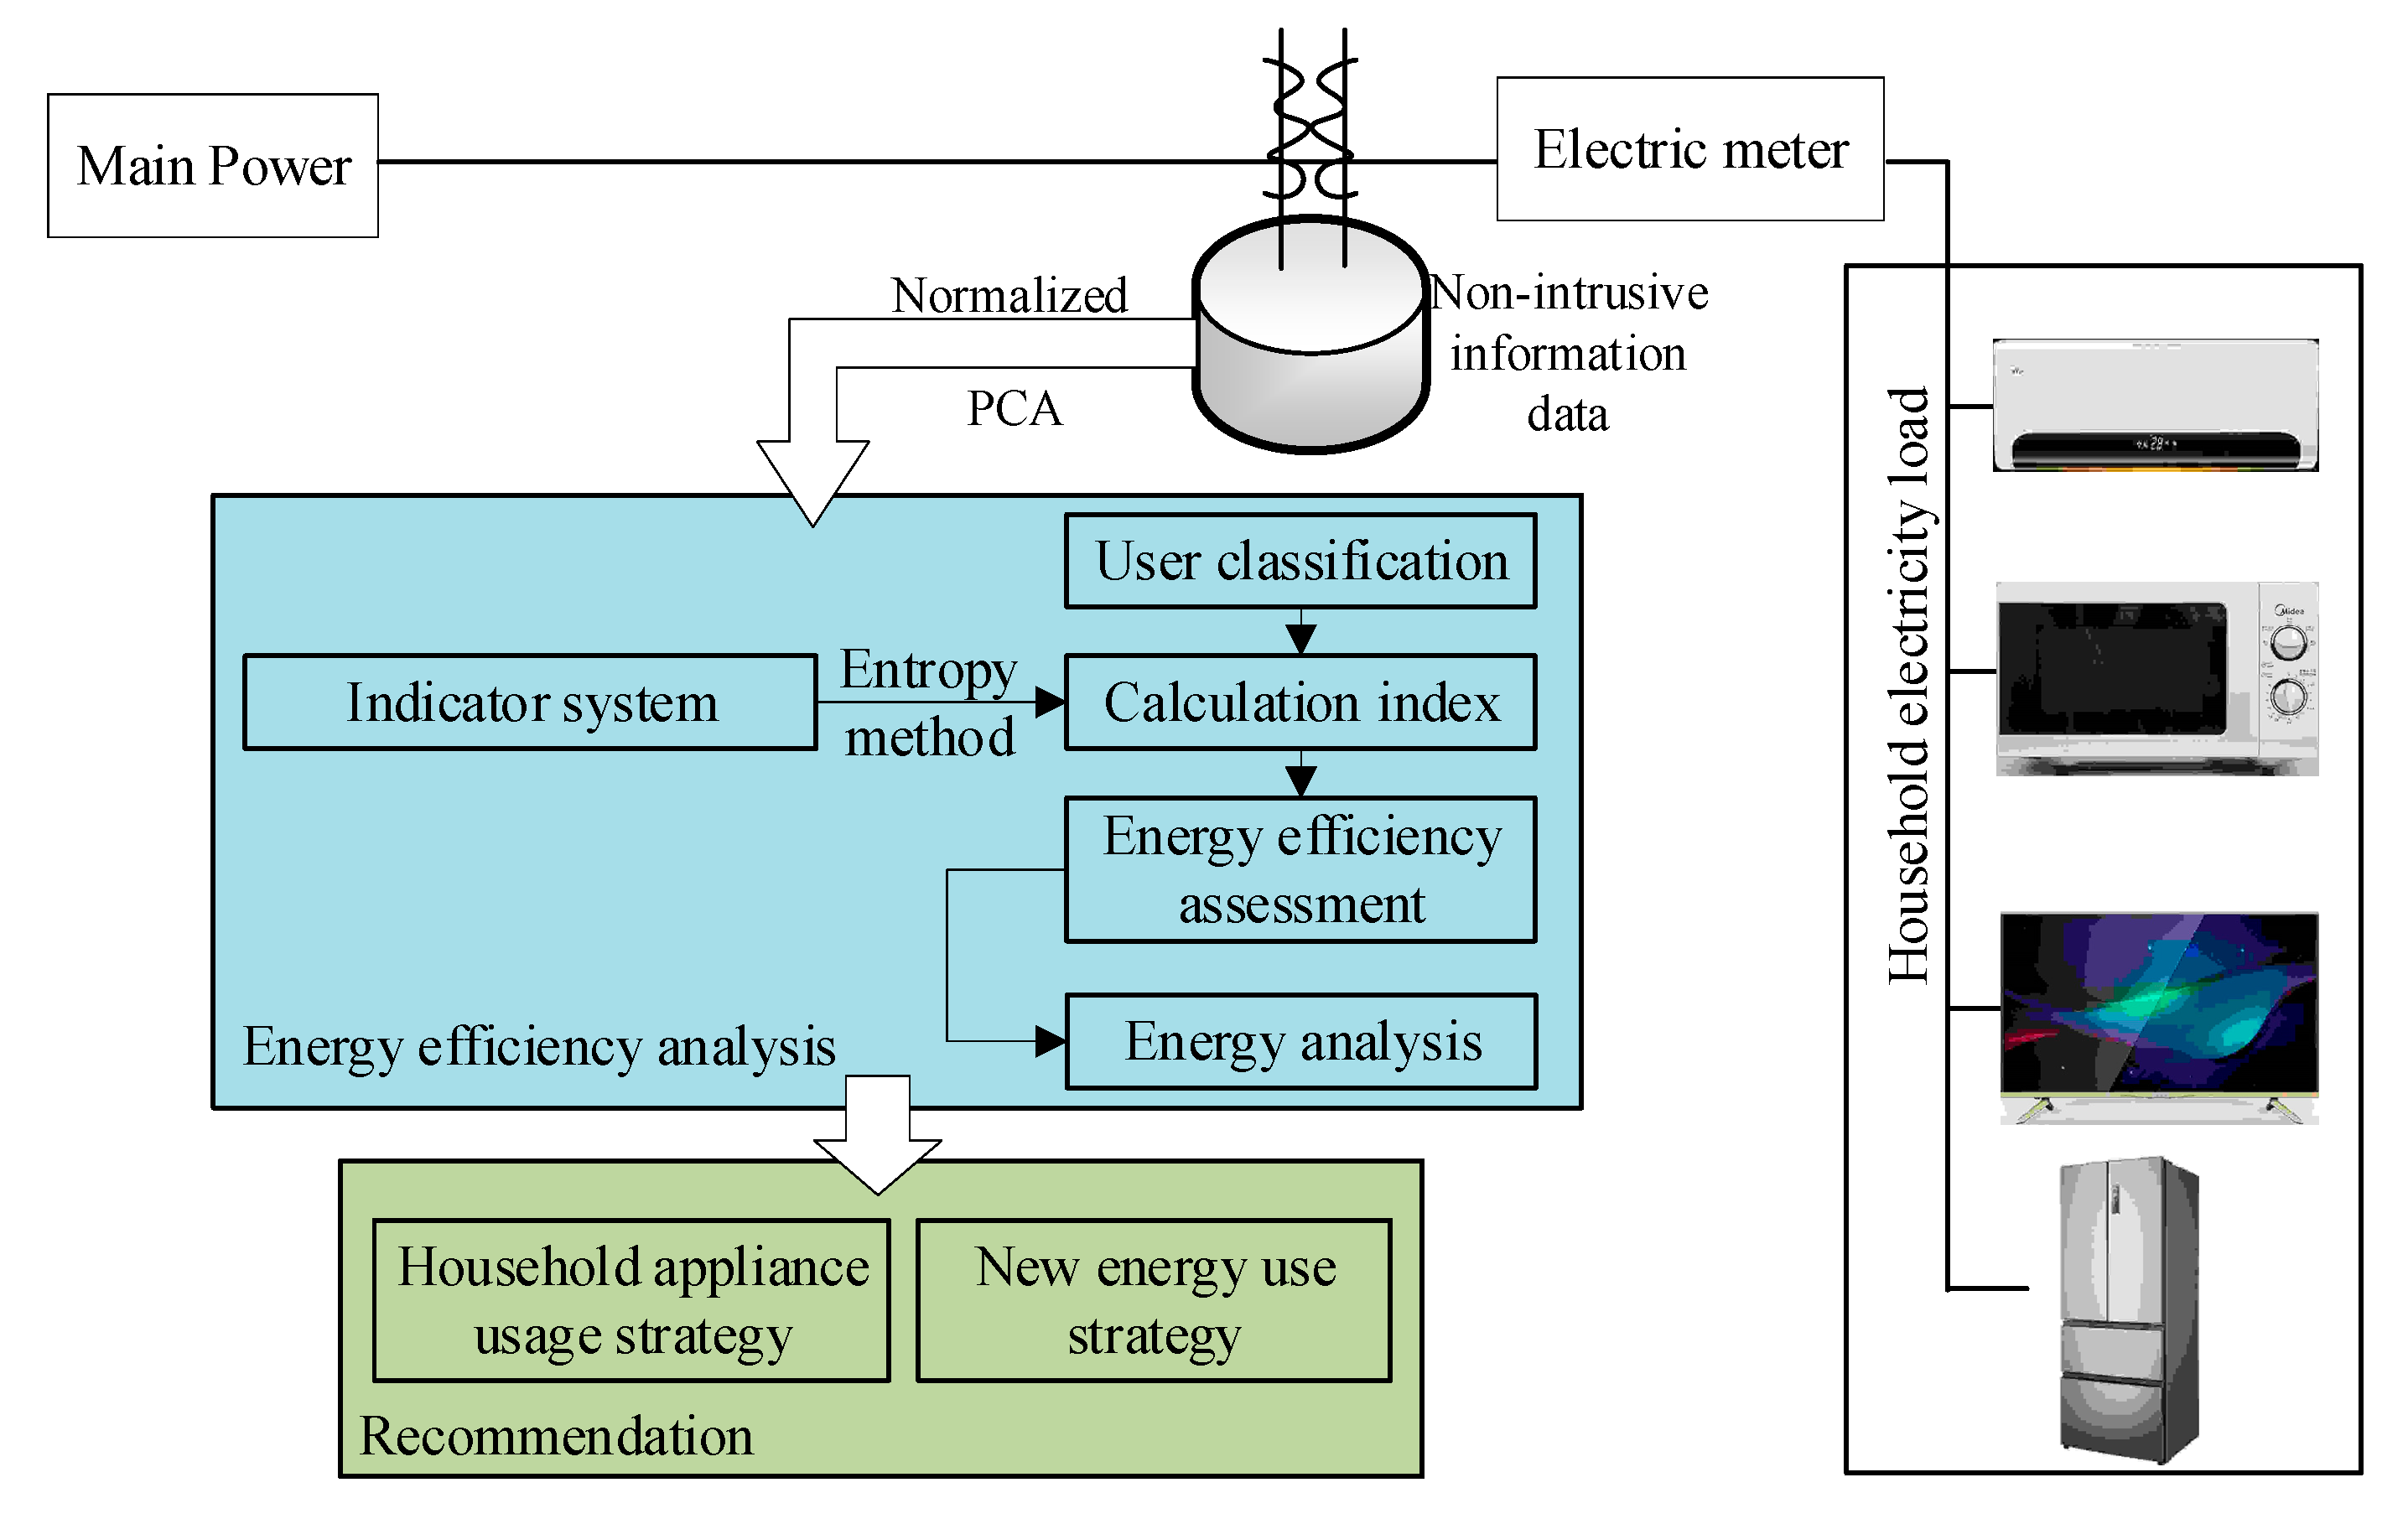
2.1. Energy Efficiency Assessment Framework

By assessing the energy efficiency of residential users, energy-saving suggestions and power value-added services can be provided to users, which can help power companies exploit power package services according to users’ features, assist governments in developing energy-saving and emission reduction plans, and serve as a reference for the dispatching work of electric power companies. Hence, power companies can motivate users to actively participate in grid demand-side management to minimize operating and maintenance costs.
As shown in Figure 1, the energy efficiency assessment framework for residential users is divided into two modules: data acquisition and energy efficiency service application. Energy service enterprises need to conduct surveys to collect basic household information, including information on permanent household residents, household income, and housing area. Smart meters with NILM technology are used to obtain energy consumption information, and this information is bidirectionally uploaded to a data center for data storage and management through internet, optical fiber, 4G or 5G, power line communication (PLC), or wireless broadband. The energy consumption and user information are evaluated through an energy efficiency service application so as to generate energy recommendations for the user. The system is mainly intended for power companies or power selling companies. Power companies can adjust the power sales strategy according to the results.

2.2. Data

At present, power load monitoring is divided into intrusive and non-intrusive approaches. Non-intrusive load monitoring is simple to install and makes it convenient to collect and analyze data.
NILM technologies are becoming mature with the improvement of advanced metering infrastructure (AMI). Load identification, for example, uses load signal decomposition to non-intrusively obtain load information [23]. Figure 2 shows the energy efficiency assessment structure based on NILM.
The NILM equipment (Tianjin Qiushi TransEnergy Technologies Co., Ltd., Tianjin, China) is installed at the entrance of the home grid gateway, and the Hidden Markov Model (HMM) is used to model the total load and its internal electrical equipment. Therefore, the NILM problem can be expressed as a decoding problem of HMM and then solved by the improved Viterbi algorithm [24].
This method can reduce the number of state sequences that the ordinary Viterbi algorithm needs to traverse and calculate the complexity. The NILM information is subjected to energy efficiency analysis after principal component analysis (PCA) and standardization processing. Finally, household equipment power consumption and new energy consumption strategies can be obtained through the analysis. At present, the NILM can detect the energy consumption of 51 household appliances. However, NILM equipment suppliers will continuously analyze the characteristics of electrical appliances on the market and update the electrical appliance feature library. If a new appliance is added, the NILM equipment supplier will match the feature library. By constantly updating the NILM feature library, more electrical appliances will be identifiable. If a new appliance is not identified, NILM will alert the equipment supplier, and then the equipment supplier will carry out feature analysis and add it to the feature library.
Non-intrusive information data is subjected to energy efficiency analysis through normalization and PCA. First, it is necessary to classify the users. Then, the entropy weight method is used to combine the same type of electrical data, and the energy consumption of the distributed power source is determined to calculate the index. Finally, power use suggestions are generated according to the results of the comprehensive evaluation.
The eigenvalues obtained from the steady-state load current include the peak value, standard deviation (SD), root mean square (RMS) value, and the number of wave peaks (valleys). These eigenvalues can be used as the load signature (LS) characteristics and provide a vital basis for load identification. Waveform and eigenvalues from the steady-state load current of some types of home appliance equipment are shown in Figure 3 (the red line is the wave peak, the black line is the wave trough, the green line is the RMS, and the yellow line is the SD). Table 1 shows the characteristic values of each load.
The maximum, minimum, RMS, and SD of current can be used as LS characteristics of the load to identify a single load. In the implementation process, the feature-additive criterion (FAC) proposed in [25,26] is utilized. The formula of FAC is as follows:
Ω j ( t + Δ t ) = Ω j ( t ) + f l , j = ( i = 1 K f i , j ) + f l , j ,
where f i , j represents the eigenvalue j of load i . Ω j ( t ) represents the sum of the eigenvalues j of K loads operating simultaneously at time t . If the load l is working within time t + Δ t and the satisfying condition, the characteristics of f i , j satisfy the conditions of FAC, meaning the additive decomposition line load can be used. The unknown mixed load can be directly decomposed into different types of load according to the characteristic values of the database. If the eigenvalue is not satisfied, the load type can be set directly according to the eigenvalue of the history or sample database.

3. Household Energy Efficiency Assessment Method Based on NILM Data

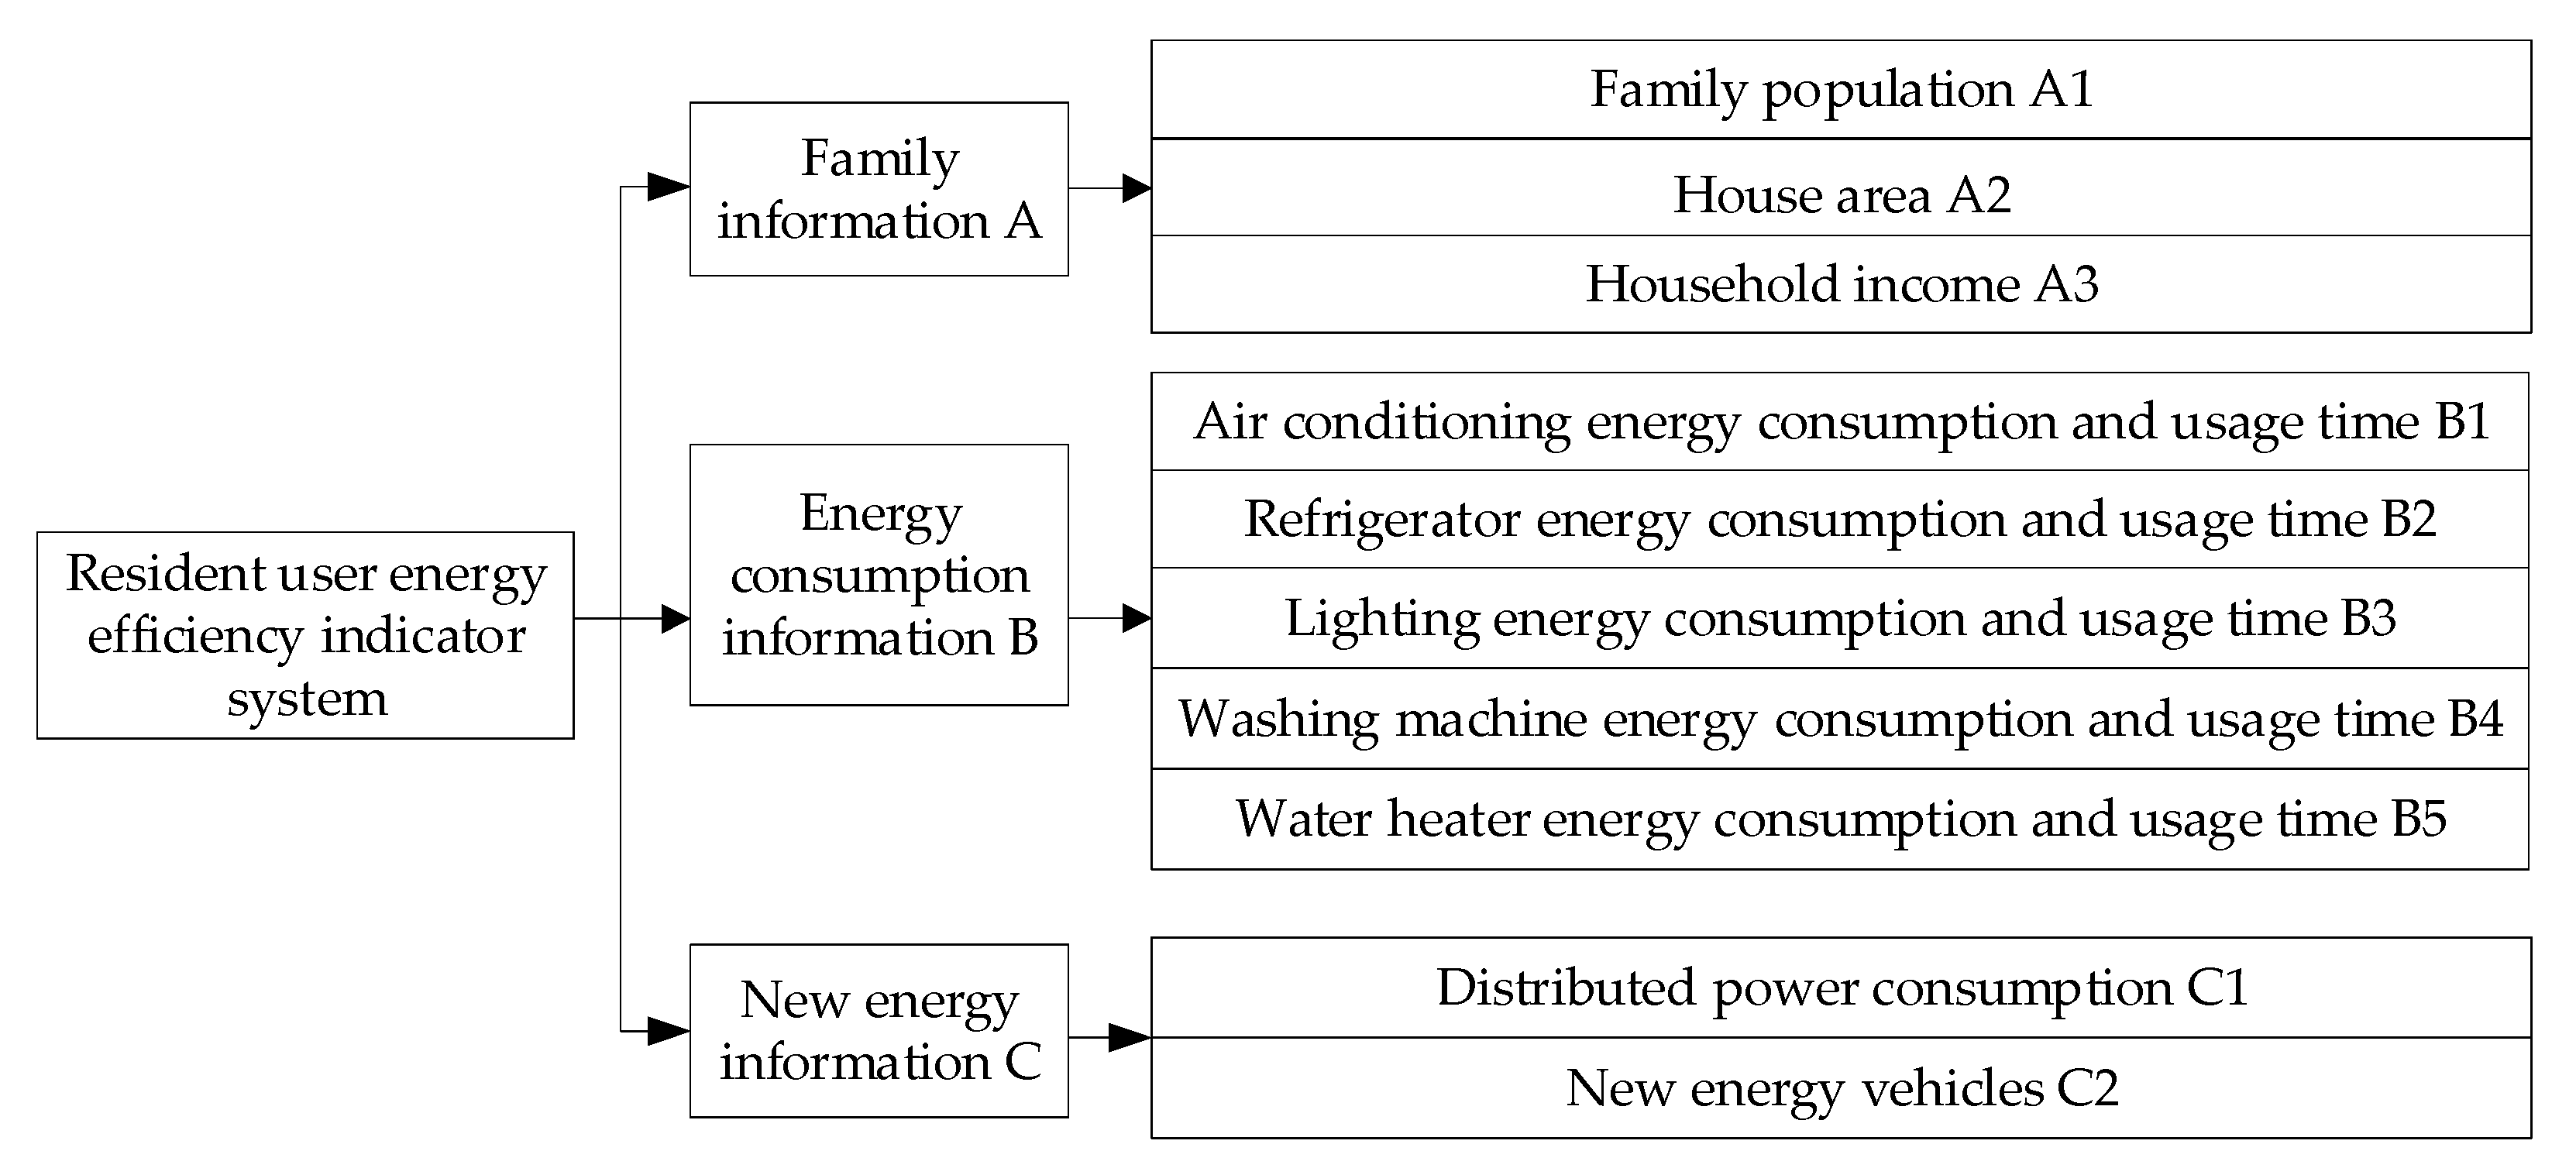
3.1. Construction of Family Energy Efficiency Indicator System

An energy efficiency assessment is affected by many factors, including non-electric factors. If only considering energy consumption factors, the assessment accuracy is likely to be low, which may impede the process of determining the reference value of users’ electricity consumption. For example, the demand for electricity varies among different households and cannot be generalized.
A residential user’s energy efficiency index system based on factors affecting user energy efficiency is established in this paper, and it is divided into three types of first-grade indexes: household information, energy consumption information, and new energy information. As shown in Figure 4, the secondary indicators contain more detailed metrics that can be set based on different geographical variables and the characteristics of the user.

3.1.1. Family Information

Population size is crucial to electricity consumption. This is because, under normal circumstances, if other conditions remain unchanged, energy consumption will rise with the increase in a population. Floor space will also have an impact on household electricity consumption. In general, larger housing areas require more electrical equipment, such as lighting and air conditioning, which results in more electricity consumption. In addition, personal income is closely related to residential electricity use. Higher per capita household income is often accompanied by greater demand for electricity services, such as increased ownership of washing machines and air conditioners, which are frequently used, as well as other high-power electrical appliances that cause unnecessary waste. Thus, the empirical results show that income is the main factor determining electricity demand. The overlap between the family information indicators is minimized in order to reflect the family situation more comprehensively and concisely. Family information A is mainly obtained through questionnaires, which are distributed by the power grid company in the pilot area to all users in the network. When the user’s basic information needs to be added or updated, the user can log into their personal account to update their information.

3.1.2. Energy Consumption Information

NILM classifies electrical appliances by using the power change information generated by electrical switches during state switching. Based on this information, it estimates the categories and quantities of household appliances, matches the types of electrical appliances in the established feature library, and obtains the energy consumption and time period of the electrical appliances. Through integrating NILM technology into smart electricity meters and using the two-parameter recursive least squares estimation method, as well as the double-variable forgetting factor strategy in line with the development trend of AMI to estimate the errors of electricity meters online [27], the accuracy of the electricity information acquired will be higher, and more types of electrical appliances will be identifiable.
Using the proposed index system, the energy consumption information of household appliances is determined based on non-intrusively measured information, including the energy consumption and usage period of common household appliances. This provides a comprehensive, structured, and concise reflection of household electricity consumption. In this paper, the energy consumption information includes users’ consumption and usage period of 51 household appliances, such as air conditioners, refrigerators, light fixtures, washing machines, and water heaters. Daily energy consumption information was compiled for different households and electric appliances.

3.1.3. New Energy Information

At present, electric vehicles and distributed energy supply systems (both examples of new energy) are becoming more and more popular, and their features of less pollution, large storage capacity, and cost-saving are attractive to consumers. However, the use of electric vehicles puts pressure on the grid load, and the use of plug-in electric vehicles (PEV) can provide frequency regulation services [28]. Power grid companies can conduct demand-side management according to fluctuating needs; so, it is necessary to conduct an energy efficiency assessment of users that charge with charging piles.
Although the installation rate of new energy in China is fairly low, due to the strong support of national policies, there are more electric cars on the street now, and the installation of a distributed power supply will be gradually popularized in the future.
This paper considers the impact of new energy on residential users and reflects the energy usage of households comprehensively. Connecting controllable conventional loads with various new energy storage components and demand-side response means is a method that can adapt to the increasing regulation demands of power systems [29]. There are two kinds of distributed generation: wind power generation and solar power generation. The installation of distributed generation requires registration with the power company, and the C1 indicator in Figure 4 can be obtained from the customer data of the power grid company. Electric vehicles powered by distributed power sources are the way forward in energy consumption as they can reduce reliance on fossil fuels. The energy consumption of electric vehicles (C2) is regarded as a measure to improve home energy efficiency.

3.2. Household Energy Efficiency Evaluation

TOPSIS and visekriterijumsko kompromisno rangiranje (VIKOR) [30] are two kinds of decision-making methods, but the latter requires a criterion weight coefficient and criterion value to be determined, which is difficult to achieve in practical decision-making. However, the TOPSIS method has become mature, and many decision-making problems are solved by TOPSIS. Therefore, this paper adopts a more mature TOPSIS method for comprehensive evaluation.
The current mainstream methods for determining index weights are analytic hierarchy process (AHP) and entropy. However, AHP is greatly influenced by subjectivity; different experts have different opinions on the weights of the indicators, and different households have different characteristics of electricity consumption for household users. If AHP is adopted, its subjective nature will lead to large errors. The entropy method is more objective, depending on the data itself.
The evaluation system has an evaluation index system, adopts k-means to cluster users, classifies users into five different types according to family information A in Figure 4, and adopts the entropy value method to weight the indicators. Finally, TOPSIS is used to conduct a comprehensive evaluation of users so as to obtain corresponding evaluation scores. According to the result of clustering, different types of users or users of the same type are classified and calibrated. This approach is an effective way to obtain the weak links of energy use in households and give corresponding suggestions by comparing the differences in energy use among the different households.
In this paper, the data is preprocessed to delete abnormal and invalid data. Because the existing data in this paper is limited, Monte Carlo simulation is used to obtain more data. Monte Carlo is a calculation algorithm that relies on repeated random sampling [31]. It approximates the expected result of the total data by simulating a large new sample based on the real data.
Most homes have a certain number of electrical appliances, such as a refrigerator, washing machine, and air conditioner, which need to be uniformly processed and combined according to Equation (2) for assessment.
P i = j = 1 n p j ,
where P i is the power of the i -type appliance and P i is the power of the same type of appliance.
The use of new energy may not reduce energy consumption, but for household expenditure, environmental protection, and other aspects, new energy is the best power choice. This paper quantifies the new energy utilization efficiency to calculate the energy ratio of new energy, which is the ratio of energy consumption of new energy output to total energy consumption of the family, shown in Equation (3):
η = k = 0 m P k P Σ ,
where P k is the energy consumption of a new energy supply system (e.g., photovoltaic or wind power). When k = 0 , it means that the family is without DGs, and P Σ is the total energy consumption of the household.
According to the power characteristics [32] above, the user is classified by K-Means [33], and similar users use the entropy weight method and TOPSIS [34,35,36,37] to evaluate the energy efficiency of the users.

3.2.1. Entropy Weight Method

The entropy weight method [38,39] is a method to determine the corresponding weight size of each index by comparing the amount of the information it can provided. The steps to determine the weight of an indicator using the entropy weight method are as follows:
(1)
Calculate the entropy of the j -th indicator
e j = k i = 1 n p i j ln p i j ,
where p i j is the characteristic weight of the i -th evaluated object under the j -th index and k > 0 , e j > 0 is equal to p i j = 1 / n , e j = k ln n if x i j is equal for a given j .
(2)
Calculate the difference coefficient ratio of the indicator
g j = 1 e j .
The larger g j is, the more important the indicator is.
(3)
Determine the weight coefficient
w j = g j / j = 1 m g j , j = 1 ,   2 ,   ,   m .

3.2.2. TOPSIS

TOPSIS is a multi-attribute decision analysis method that sorts a finite number of evaluation indexes by their proximity to the ideal target and evaluates the relative merits of the existing analysis objects. The main steps of the TOPSIS evaluation method are as follows:
(1)
Let the decision matrix be A = ( a i j ) m × n , normalize the attribute values, and set the normalized decision matrix B = ( b i j ) m × n , where
b i j = a i j i = 1 m a i j 2 , i = 1 , 2 , , m ; j = 1 , 2 , , n .
(2)
Construct a weighted canonical matrix C = ( c i j ) m × n . The weight vector is w = [ w 1 , w 2 , w n ] T , then
c i j = w j b i j , i = 1 , 2 , , m ; j = 1 , 2 , , n .
(3)
Determine the positive ideal solution C + and the negative ideal solution C :
c j + = { max ( c i j ) , j   is   benefit   indicator min ( c i j ) , j   is   cost   indicator
c j = { max ( c i j ) , j   is   cost   indicator min ( c i j ) , j   is   benefit   indicator
The larger the value of the evaluation index, the better the benefit indicator. The smaller the evaluation index, the better the cost indicator.
(4)
Calculate the distance from each scheme to the positive (negative) ideal solution:
s i + = j = 1 n ( c i j c j + ) 2 , i = 1 , 2 , , m ,
s i = j = 1 n ( c i j c j ) 2 , i = 1 , 2 , , m .
(5)
Calculate the comprehensive evaluation value:
f i + = s i s i + + s i , i = 1 , 2 , , m .
Finally, the user’s ranking is obtained according to the order of f i + ‘s ranking scheme from large to small.

3.3. Application of Energy Efficiency Indicators for Households

3.3.1. Analysis of Measures Based on Energy Efficiency Indicators of Households

The integrated energy management of residential buildings aims to minimize the energy cost of households and improve the self-absorption of renewable electricity production through load transfer [40]. In this paper, the use of household appliances is analyzed to improve energy efficiency and reduce the cost of household energy. After the completion of the energy efficiency assessment, users will receive an assessment score. According to the assessment score, energy efficiency ranking can be conducted among the same type or different types of users. In addition, the ranking results can be used to conduct benchmarking of the users and to give personalized energy saving suggestions by analyzing the differences among users.
According to the assessment results, the indicators in the new energy information are analyzed to investigate whether the improvement of energy efficiency by the new energy equipment is significant, or suggestions are put forward for the households installing distributed generation systems from the perspective of household expenditure. The analysis of the charging of electric vehicles is mainly to investigate whether the charging period is reasonable or not, and recommendations should be given if it is unreasonable. In the case that the new energy equipment is not installed in the home, users can be recommended to install it according to the actual situation.

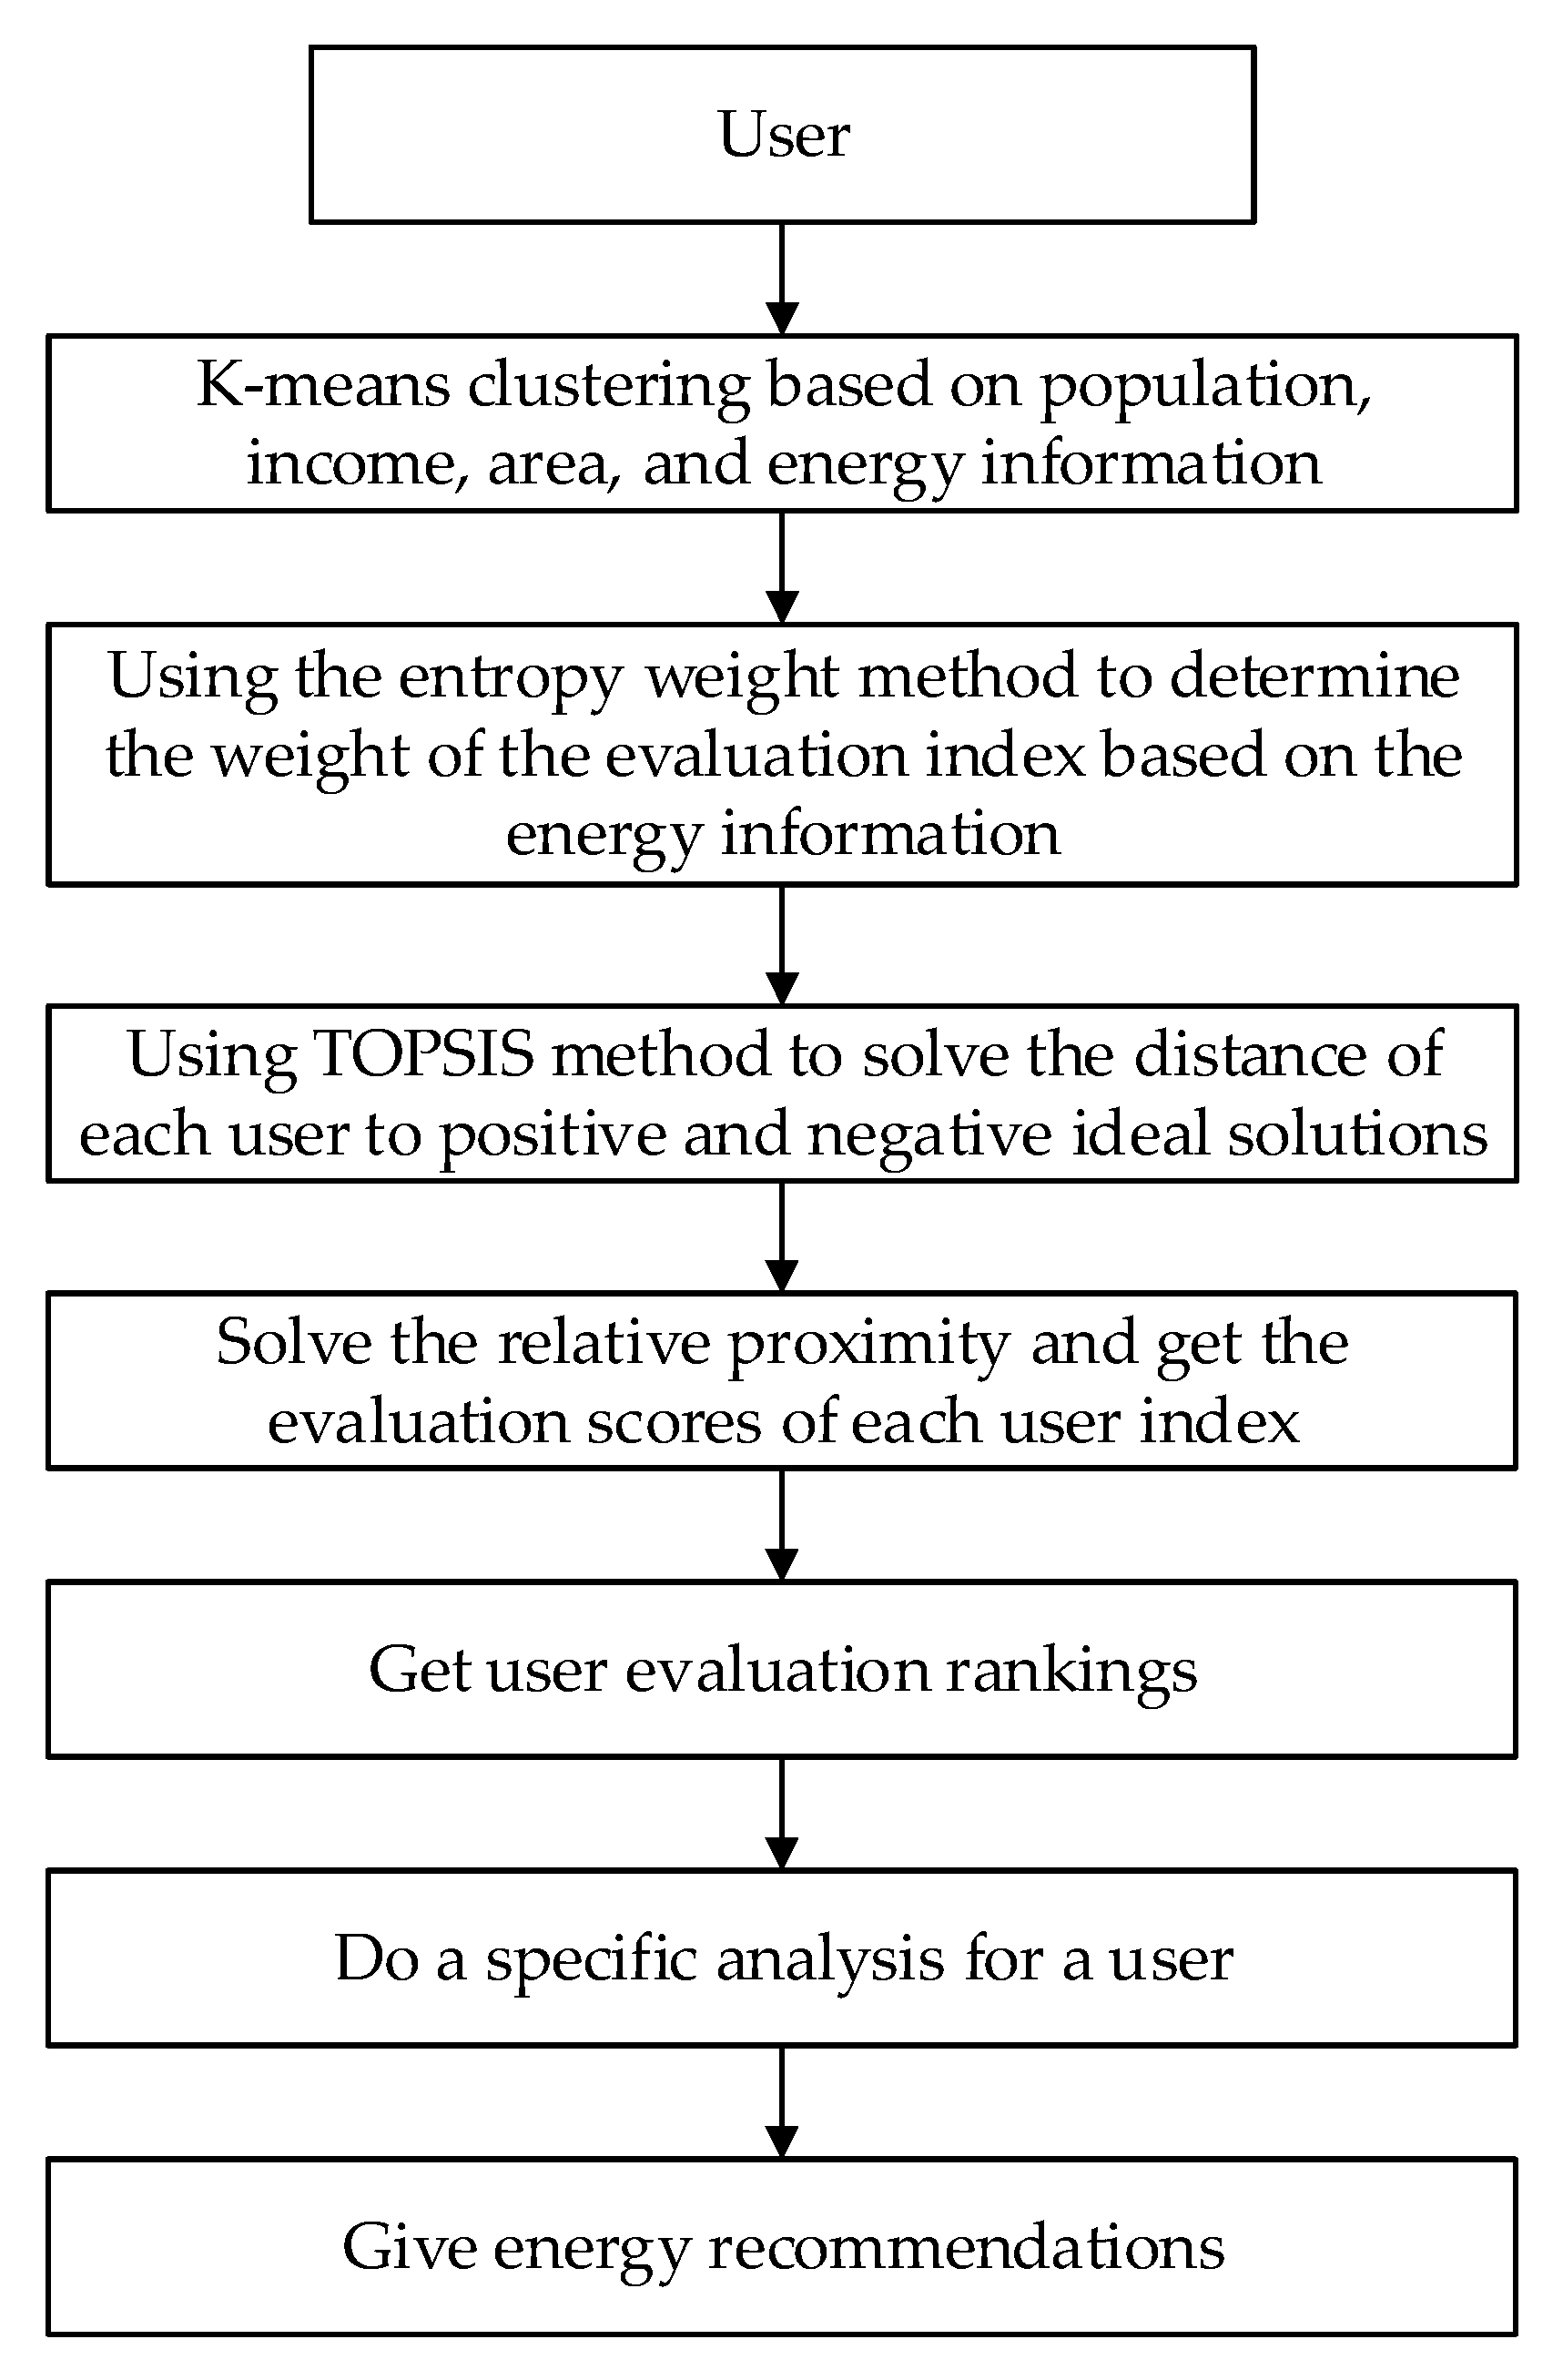
3.3.2. Energy Efficiency Assessment Process

Based on the above, a flowchart of the energy efficiency evaluation for residential users as shown in Figure 5 is obtained. Users are classified according to user features and non-invasive information, and comprehensively evaluated by the TOPSIS method. The weight of each index in the energy consumption information and the new energy information is determined by the entropy weight method. A specific analysis of the user should be given based on the assessment results. Through the horizontal and vertical standard, the potential energy-use problems of the household should be analyzed, and energy-use suggestions should be given.
Based on the family information index, the ability to analyze specific problems is improved, and the differences between different types of users are distinguished. Relevant energy recommendations can be given according to the specific conditions of the users. The accuracy and credibility of the evaluation are improved based on non-intrusive information. Furthermore, the possibility of adopting energy suggestions is further improved, which can greatly reduce unnecessary energy consumption to improve energy efficiency and provide effective help for demand-side management of power companies. The new energy information index is helpful to improve the utilization rate of clean energy. Therefore, users will consider using more clean energy by vertical and horizontal comparison, and energy efficiency will be greatly improved.

4. Case Study

The current experimental data is the daily electricity consumption data of 20 users within 30 days, including the electricity consumption information of about 51 different electrical appliances obtained by NILM. The family population, income, area, and other information are obtained randomly in the text by the simulation method. Among them, the population range is (1, 5), family income range is (10,000, 30,000) yuan, and house size range is (70, 120) square meters. Therefore, the relevant family information can be obtained through user surveys in practical applications. The example in this paper is completed on a personal computer with a CPU of i3-3.90GHz and a memory of 12GB. Meanwhile, this paper uses MATLAB for algorithm simulation, and all experimental data are processed by MATLAB (R2018a, MathWorks, Tianjin, China, 2018).
The energy efficiency evaluation model is an online operation mode, and the evaluation interval is usually 7 to 30 days. The sampling period of the experimental data in this article is 15 min, which corresponds to the 96-point load data in one day. At present, NILM equipment can detect the usage of 51 different electrical appliances, and the installation of the equipment is still in the pilot stage. Therefore, data on 20 users recorded for more than a year were selected, and 30 days’ worth of data were selected as the experimental data. An energy efficiency assessment can be regarded as a “value-added service” provided by the grid company. To ensure the integrity of the user survey data, pilot users need to fill out user survey reports under the guidance of the grid company.
Active power and reactive power are the most commonly used steady-state electrical characteristics in non-invasive load decomposition. To some extent, the usage of load can reflect the user’s electricity consumption behavior, while the probability distribution of the load’s state behavior can provide key characteristic information. In Figure 6, the active power scatter diagram is drawn according to the obtained data of six typical loads for two weeks, with a period of 24 h to show the electrical characteristics and behavior rules of each load. The darker the scatter color, the greater the number of superimposed data points.
As can be seen from Figure 6, there are certain differences in the power characteristics of household load, which can be used to realize non-invasive load decomposition. Different functions and usage habits of the load equipment reflect the unique state behavior rules in each time period throughout the day. For example, dishwashers are typically used before or after meals, and the TV is often turned on in the afternoon or evening.
Figure 7 shows a load decomposition diagram of different types of appliances. The sample period of the electrical data collected during the characteristic analysis of the electrical appliances in the NILM equipment is 1 s. In (a), six types of refrigerators have various load features, and (b) shows the power levels of different types of microwave ovens. Thus, in accordance with the characteristics of load power, it is essential to improve the accuracy of the energy efficiency assessment by fully applying the time characteristics of the equipment and user habits.

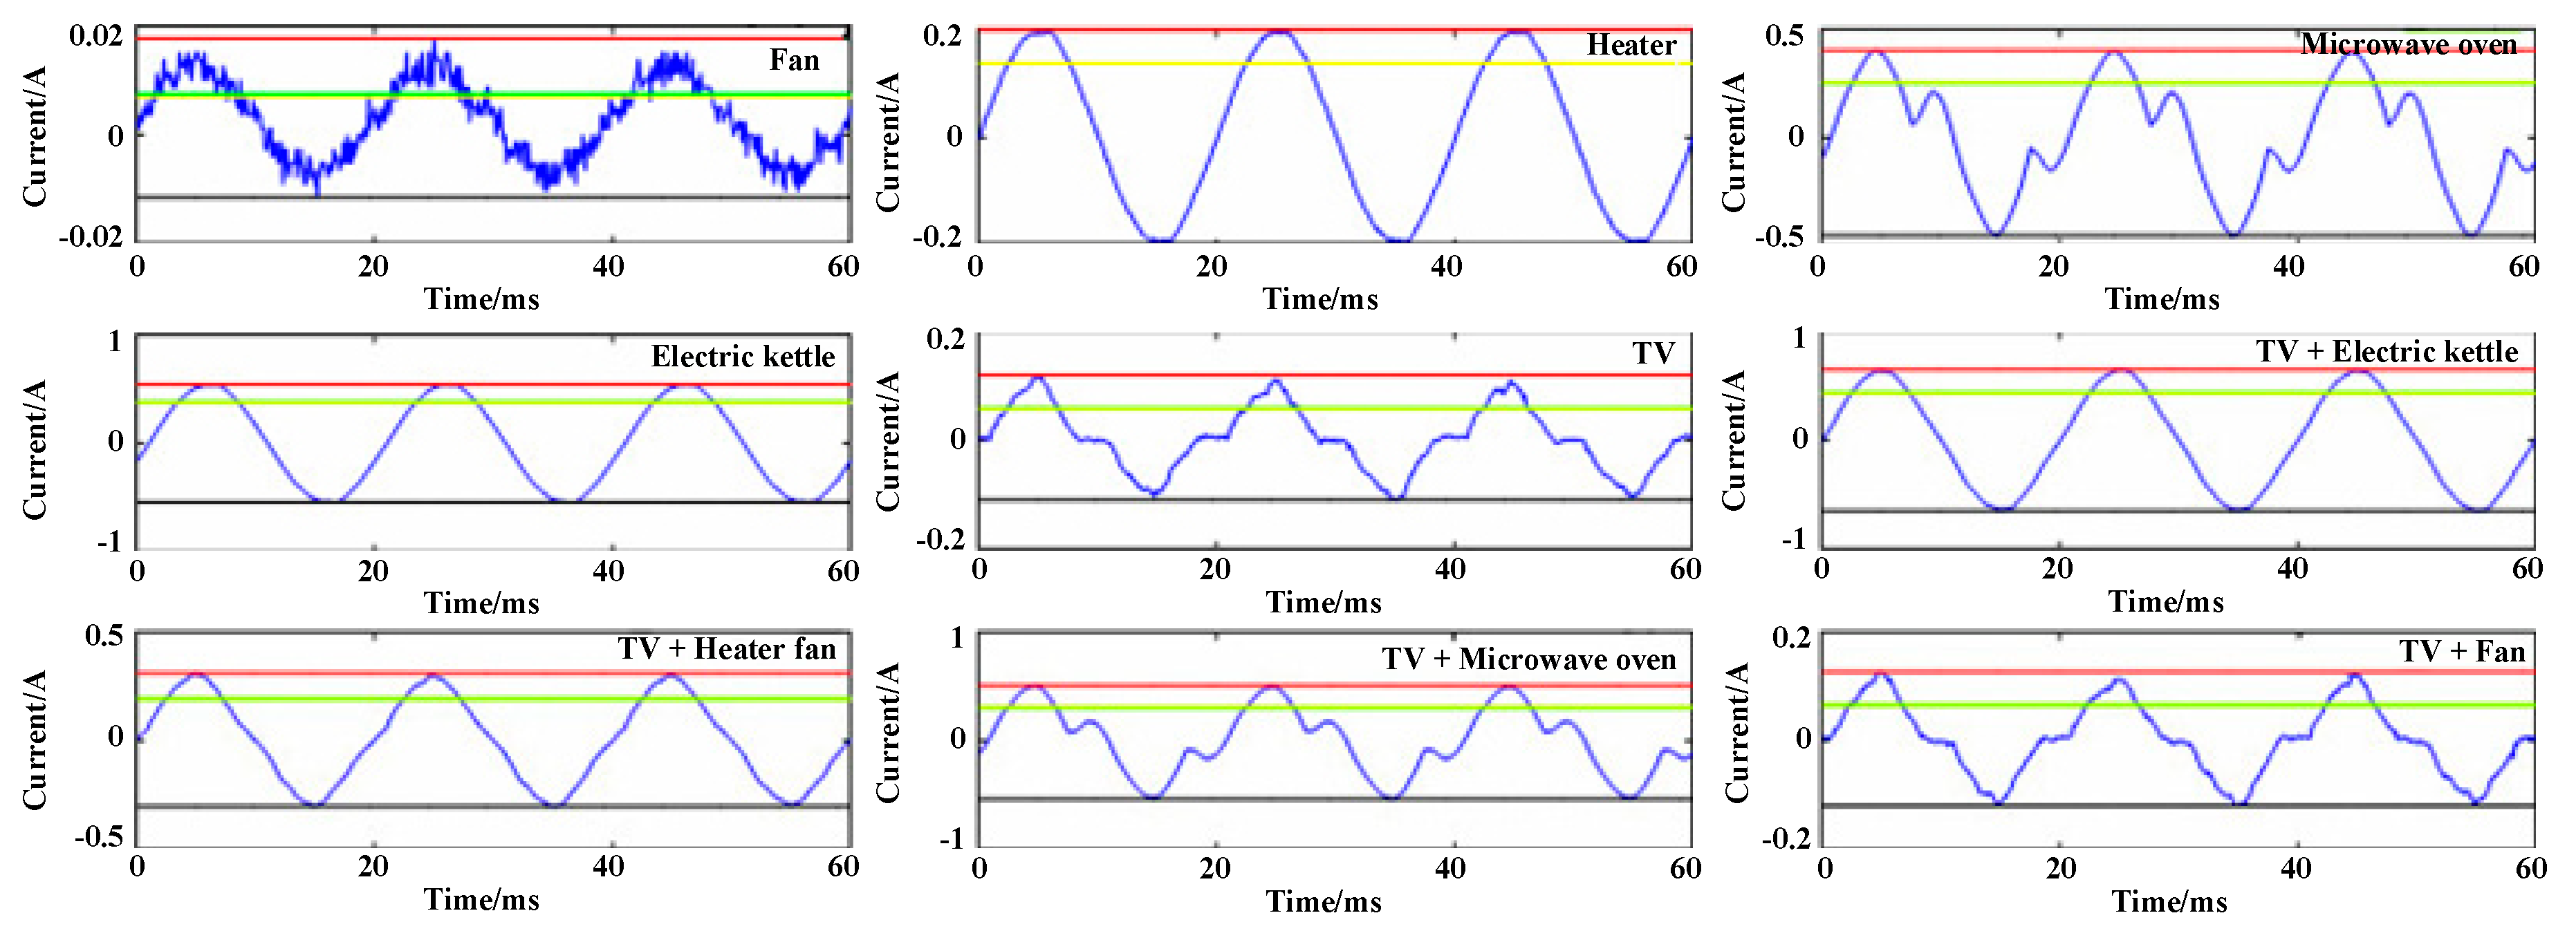
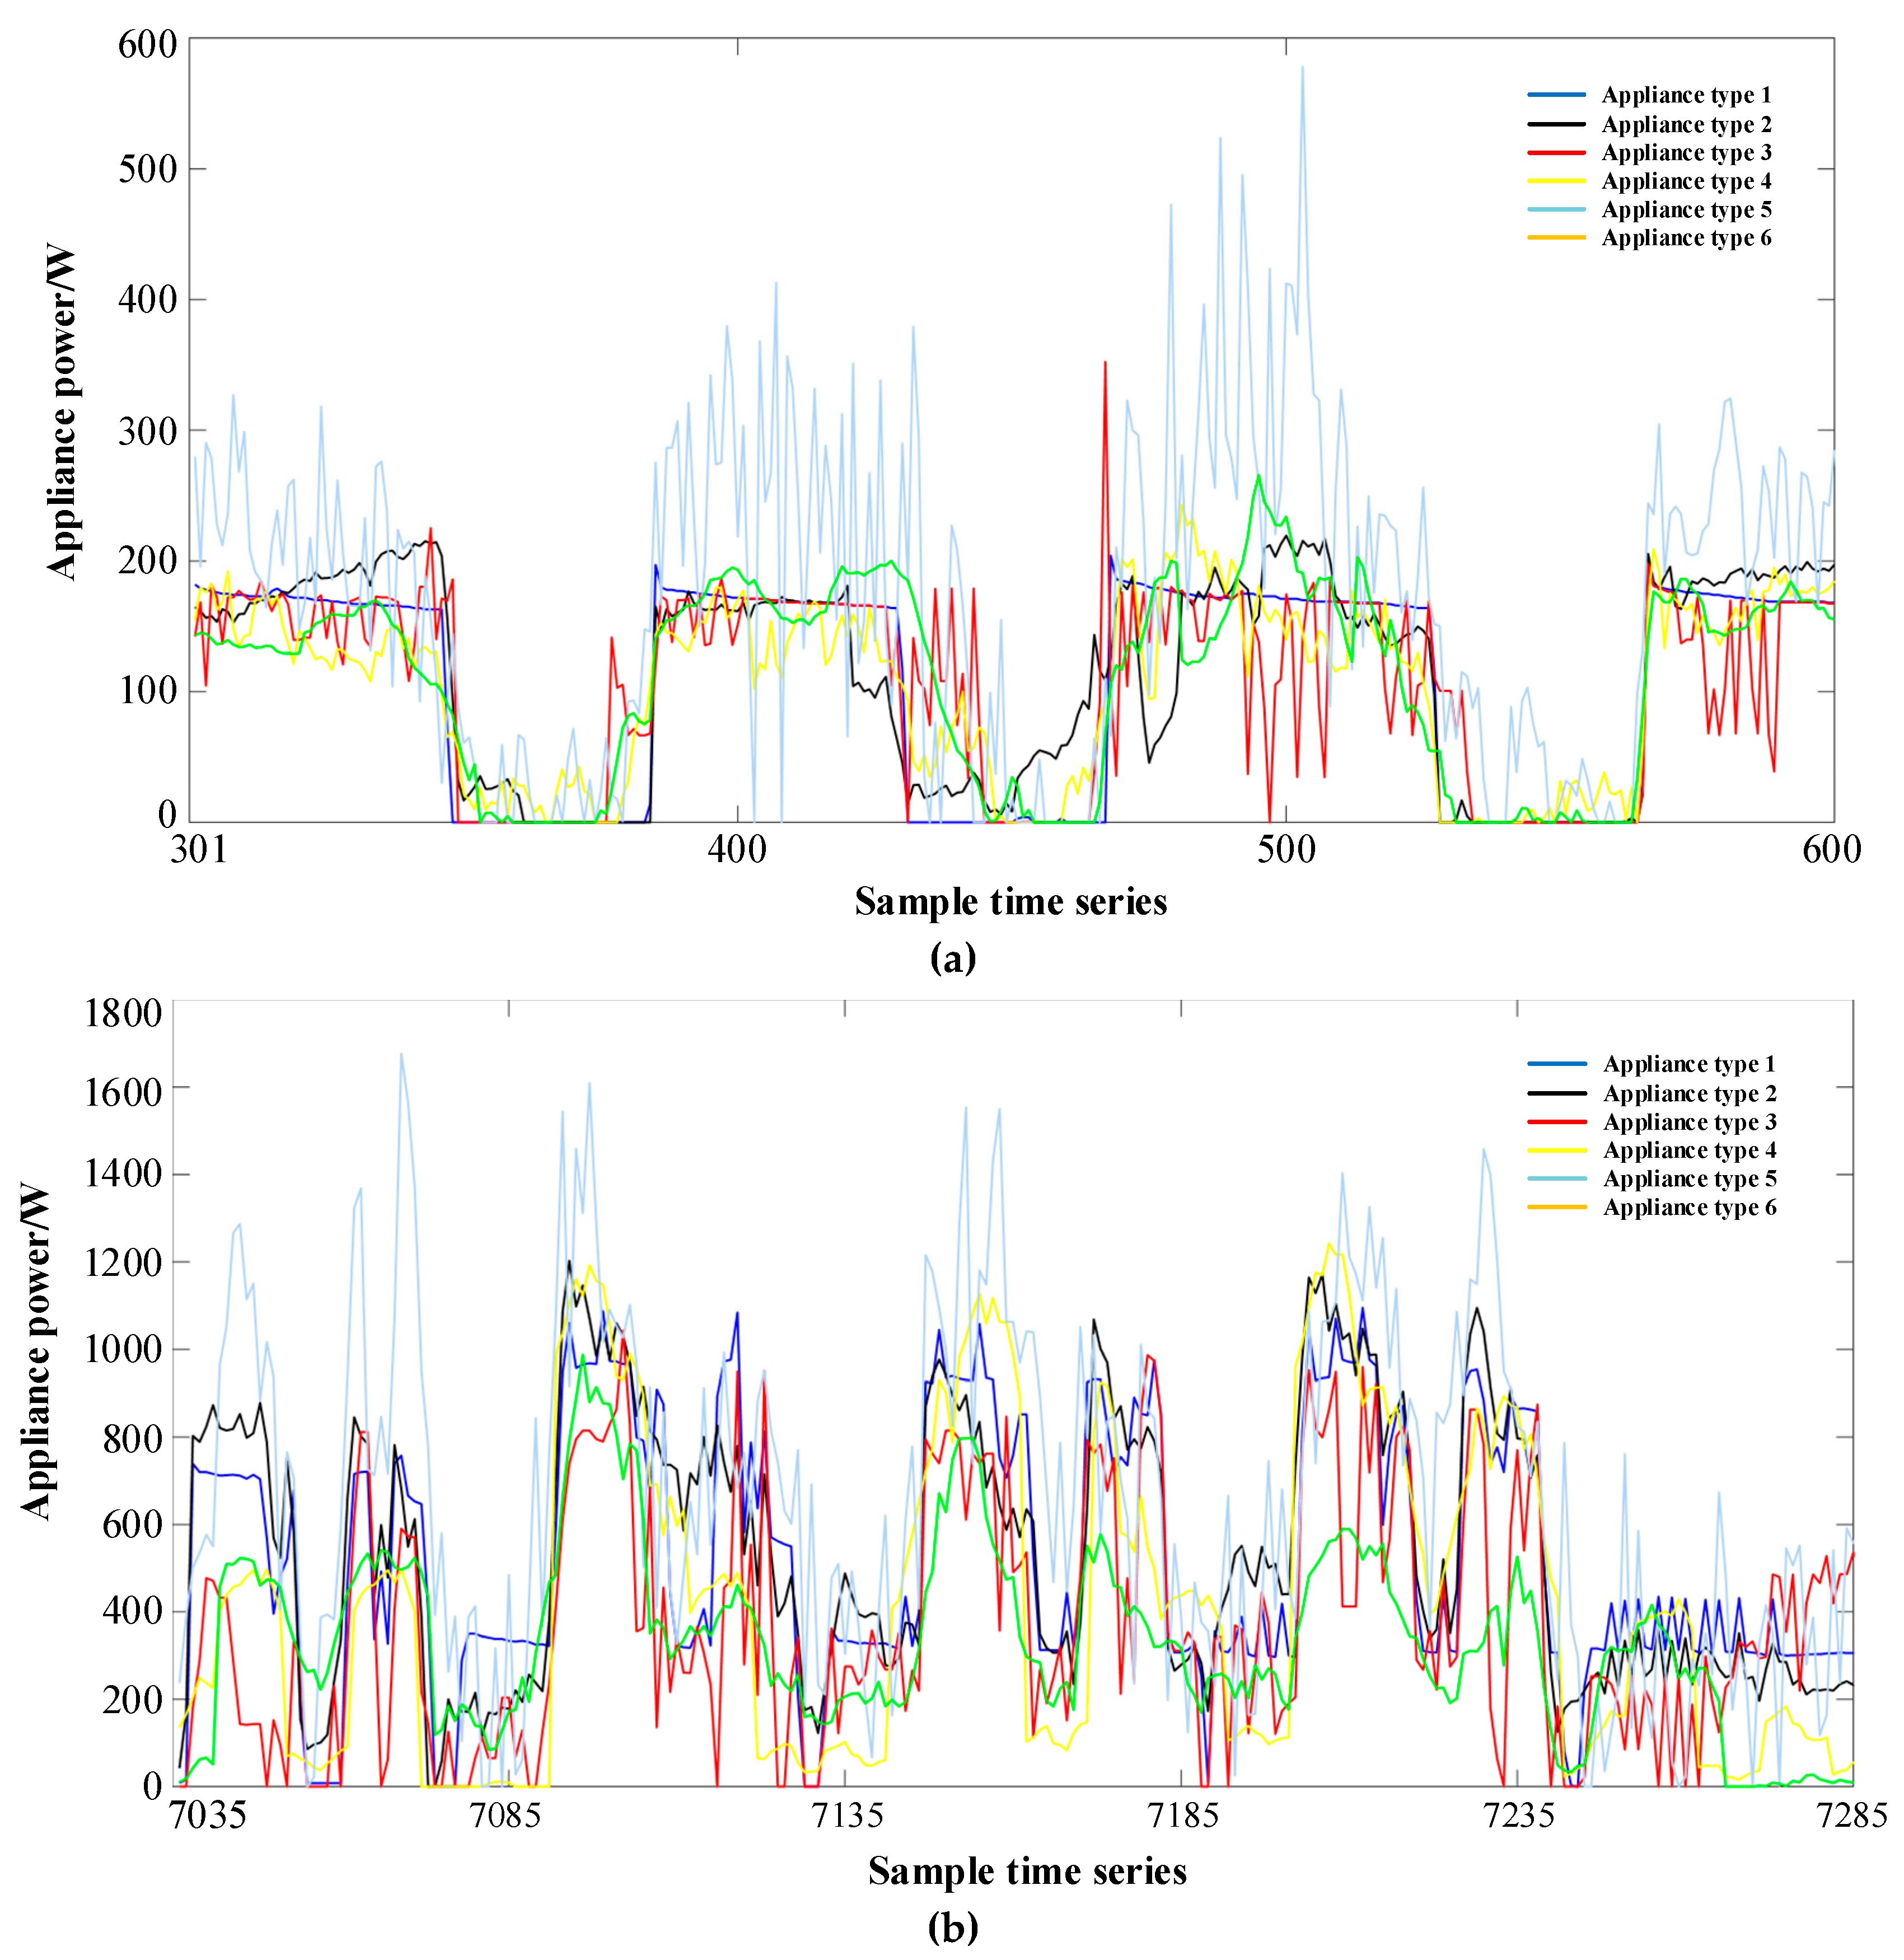
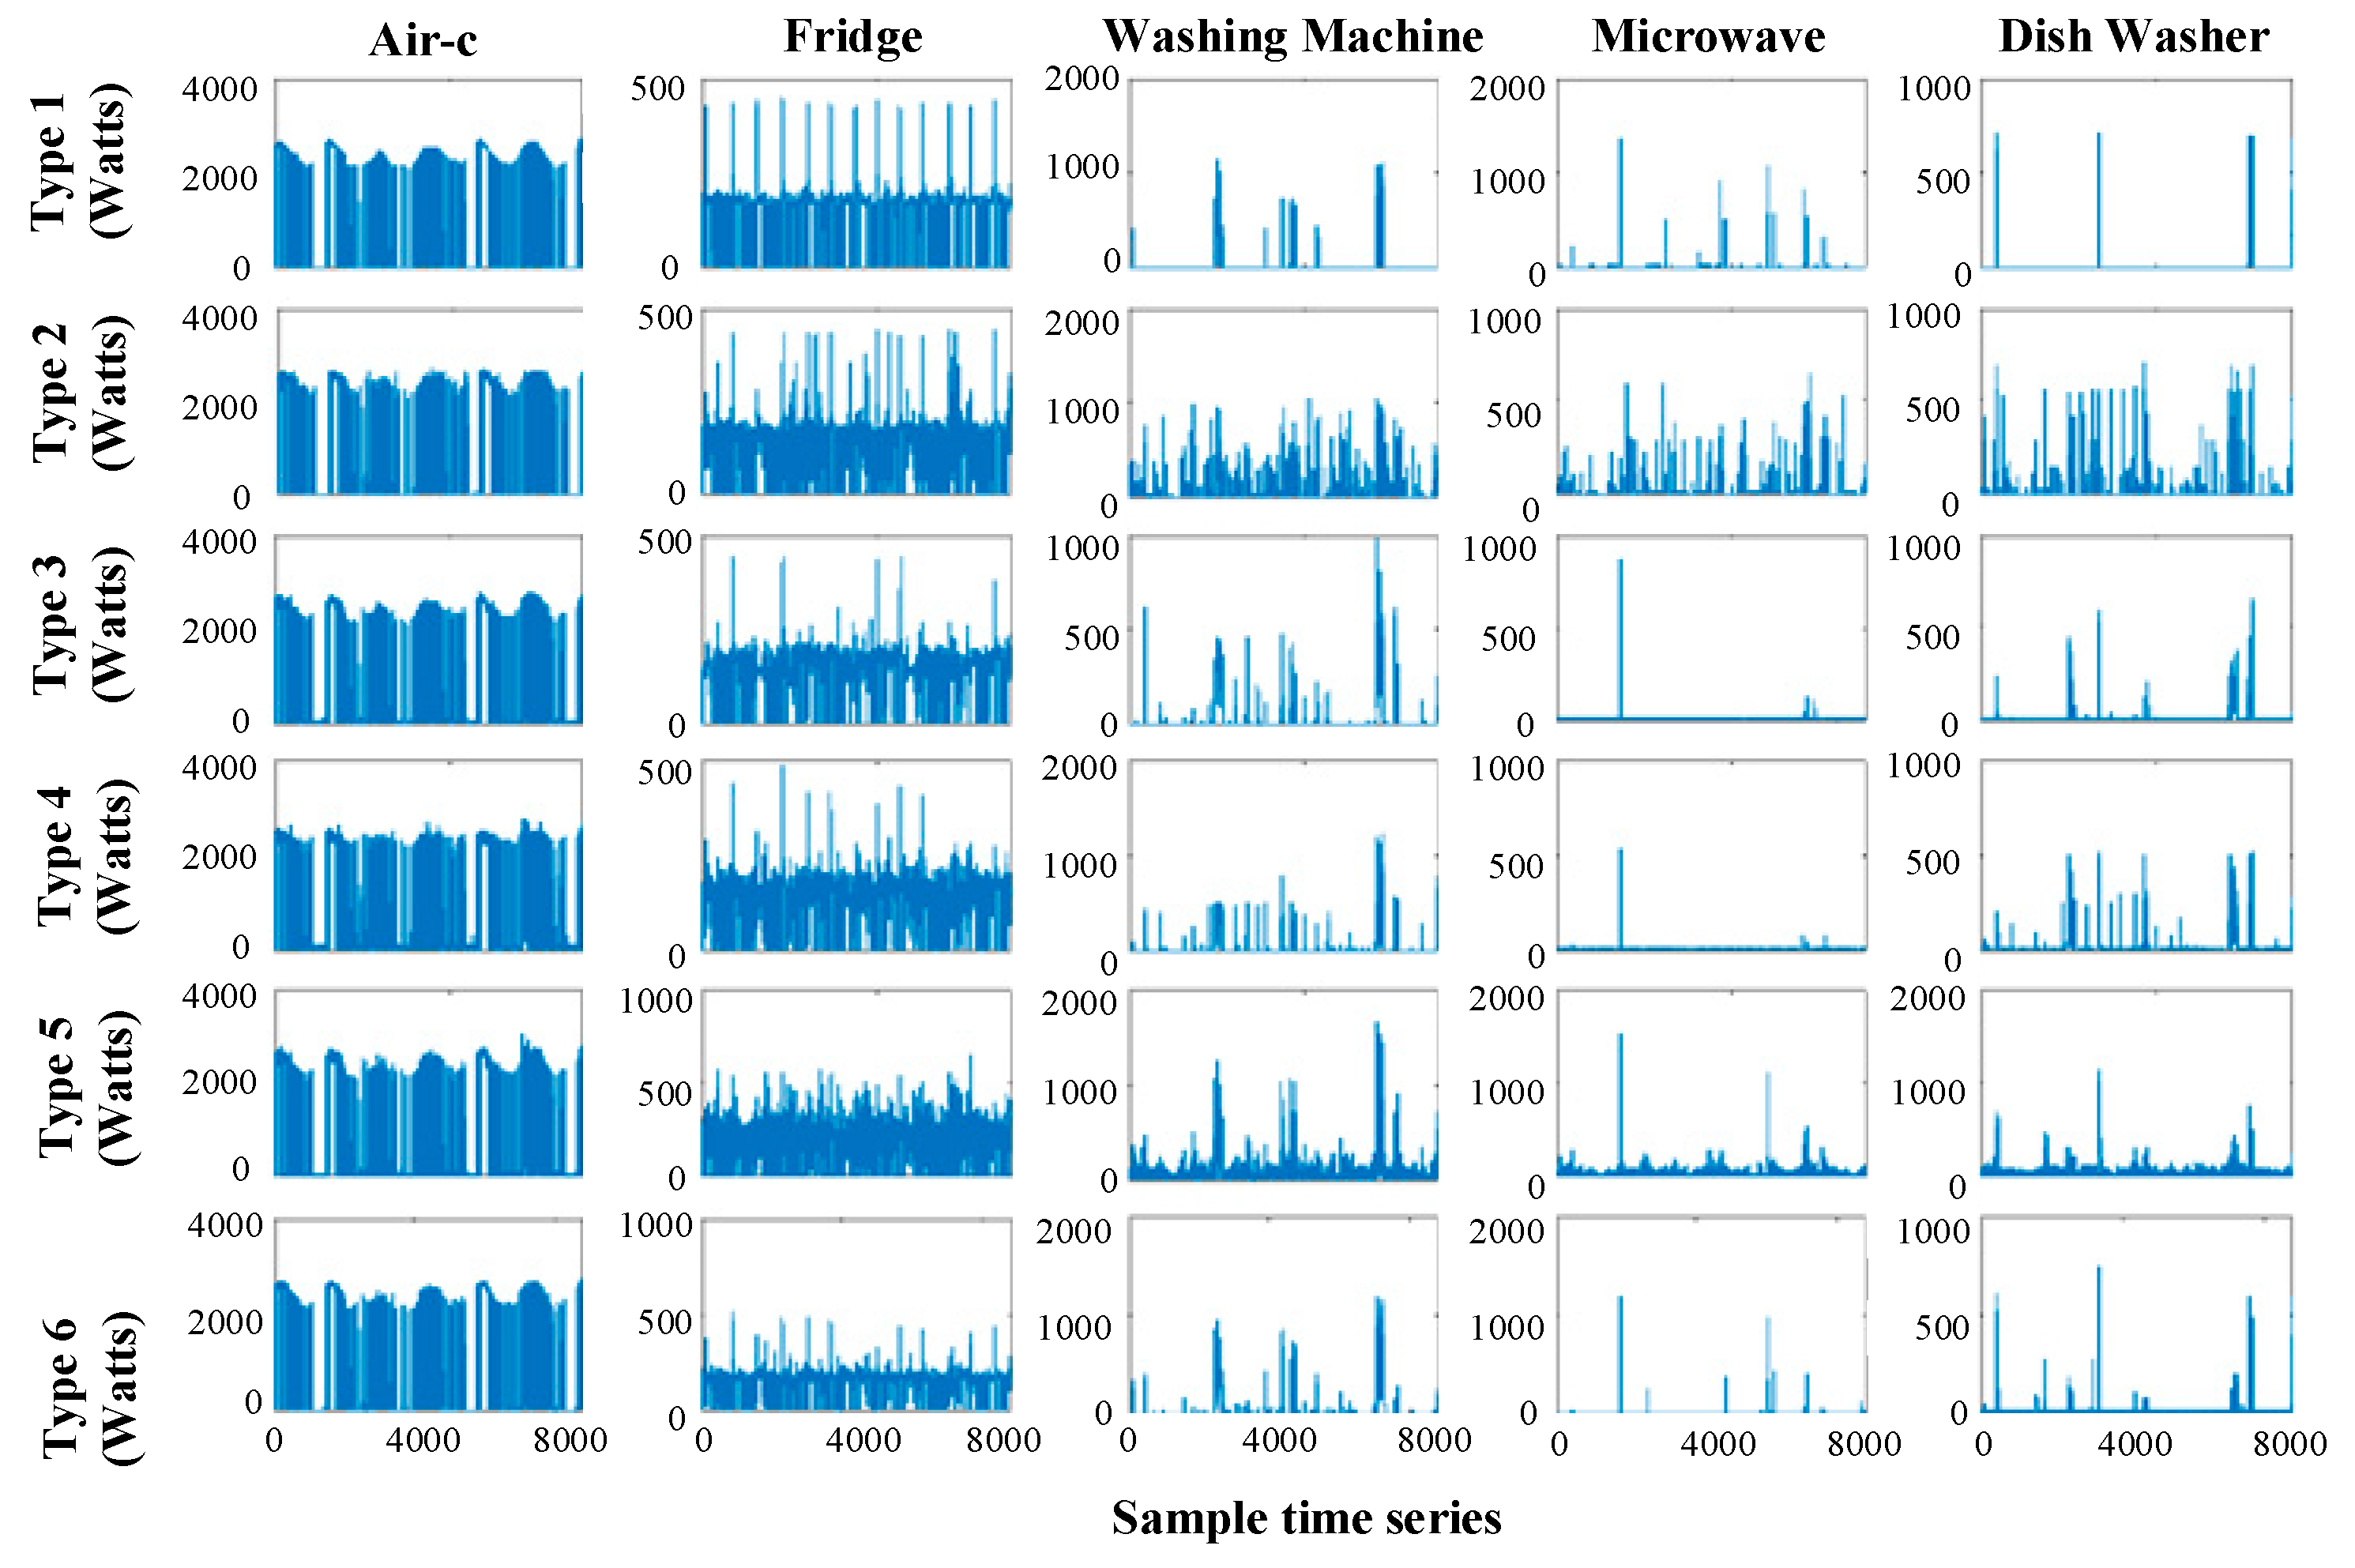
4.1. Data Preprocessing

All the electricity consumption data used in this paper were provided by NILM equipment, so the sampling period was 15 min. The user’s personal information was filled in and entered into the database by the user, which was mainly stored and analyzed in Excel. In the experiment data, 51 types of electrical household appliances commonly used in the home were included, such as air conditioners, refrigerators, televisions, water heaters, and washing machines. The names of the appliances are listed in Appendix A.
First of all, the original data were filtered, and all the zero data were deleted. After deletion, there were 20 available users. In addition, the Monte Carlo simulation method was used to simulate the electricity consumption data of ordinary users. Due to the limited data in this paper, the data of only 20 users could be obtained. If only these 20 users are analyzed, the number of samples will be small, the clustering error will be large, and the classification result may not be accurate. Thus, we considered extending the simulation to the data. However, insufficient data expansion is also likely to lead to inaccurate classification results. If the data expansion is large and the computer hardware is limited, the analysis will be slow and clustering results will not be obtained quickly. In summary, the data was expanded to 400 pieces by Monte Carlo simulation in this paper.
Normalize raw data by Equation (14):
Z = x μ σ ,
where x is the initial value of the data, μ is the population mean, and σ is the population standard deviation.
PCA and cluster analysis together form one of the most convenient and efficient methods for dealing with multivariate and high-dimensional systems in modern multivariate statistical analysis. In this paper, because there is too much electrical information in the evaluation index, it is necessary to reduce the dimension by PCA and then use cluster analysis to classify the user for further evaluation and analysis.

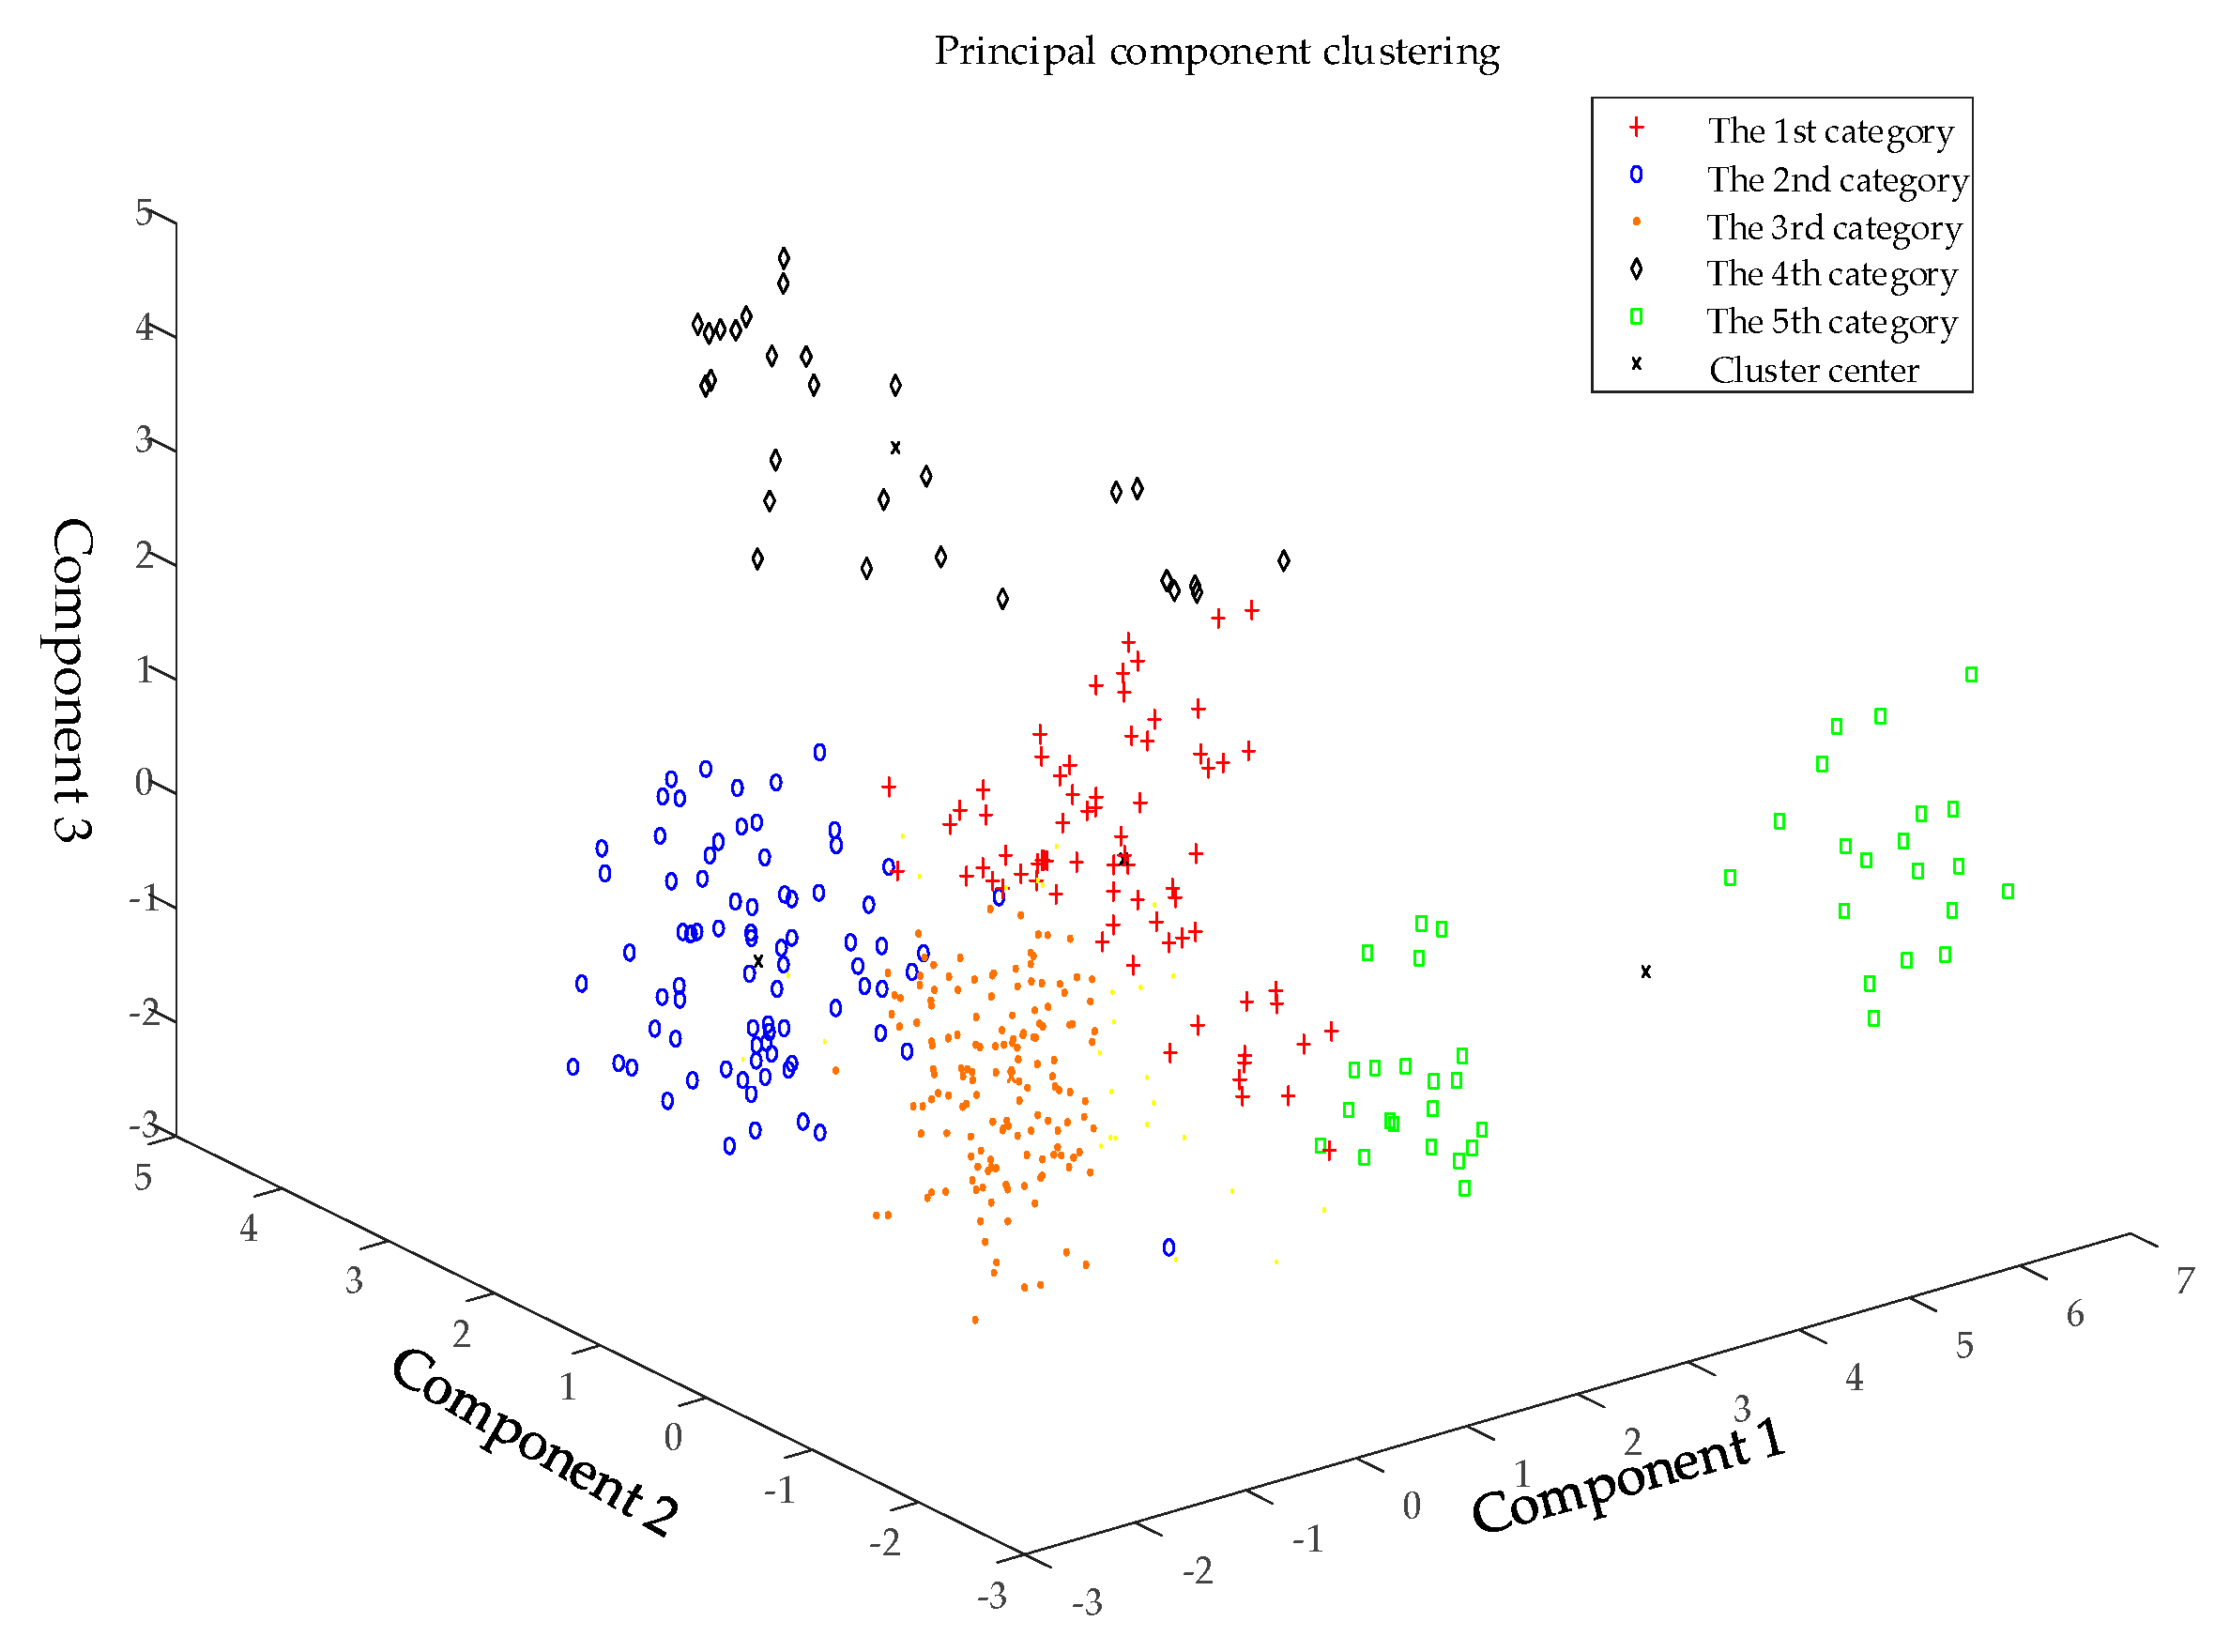
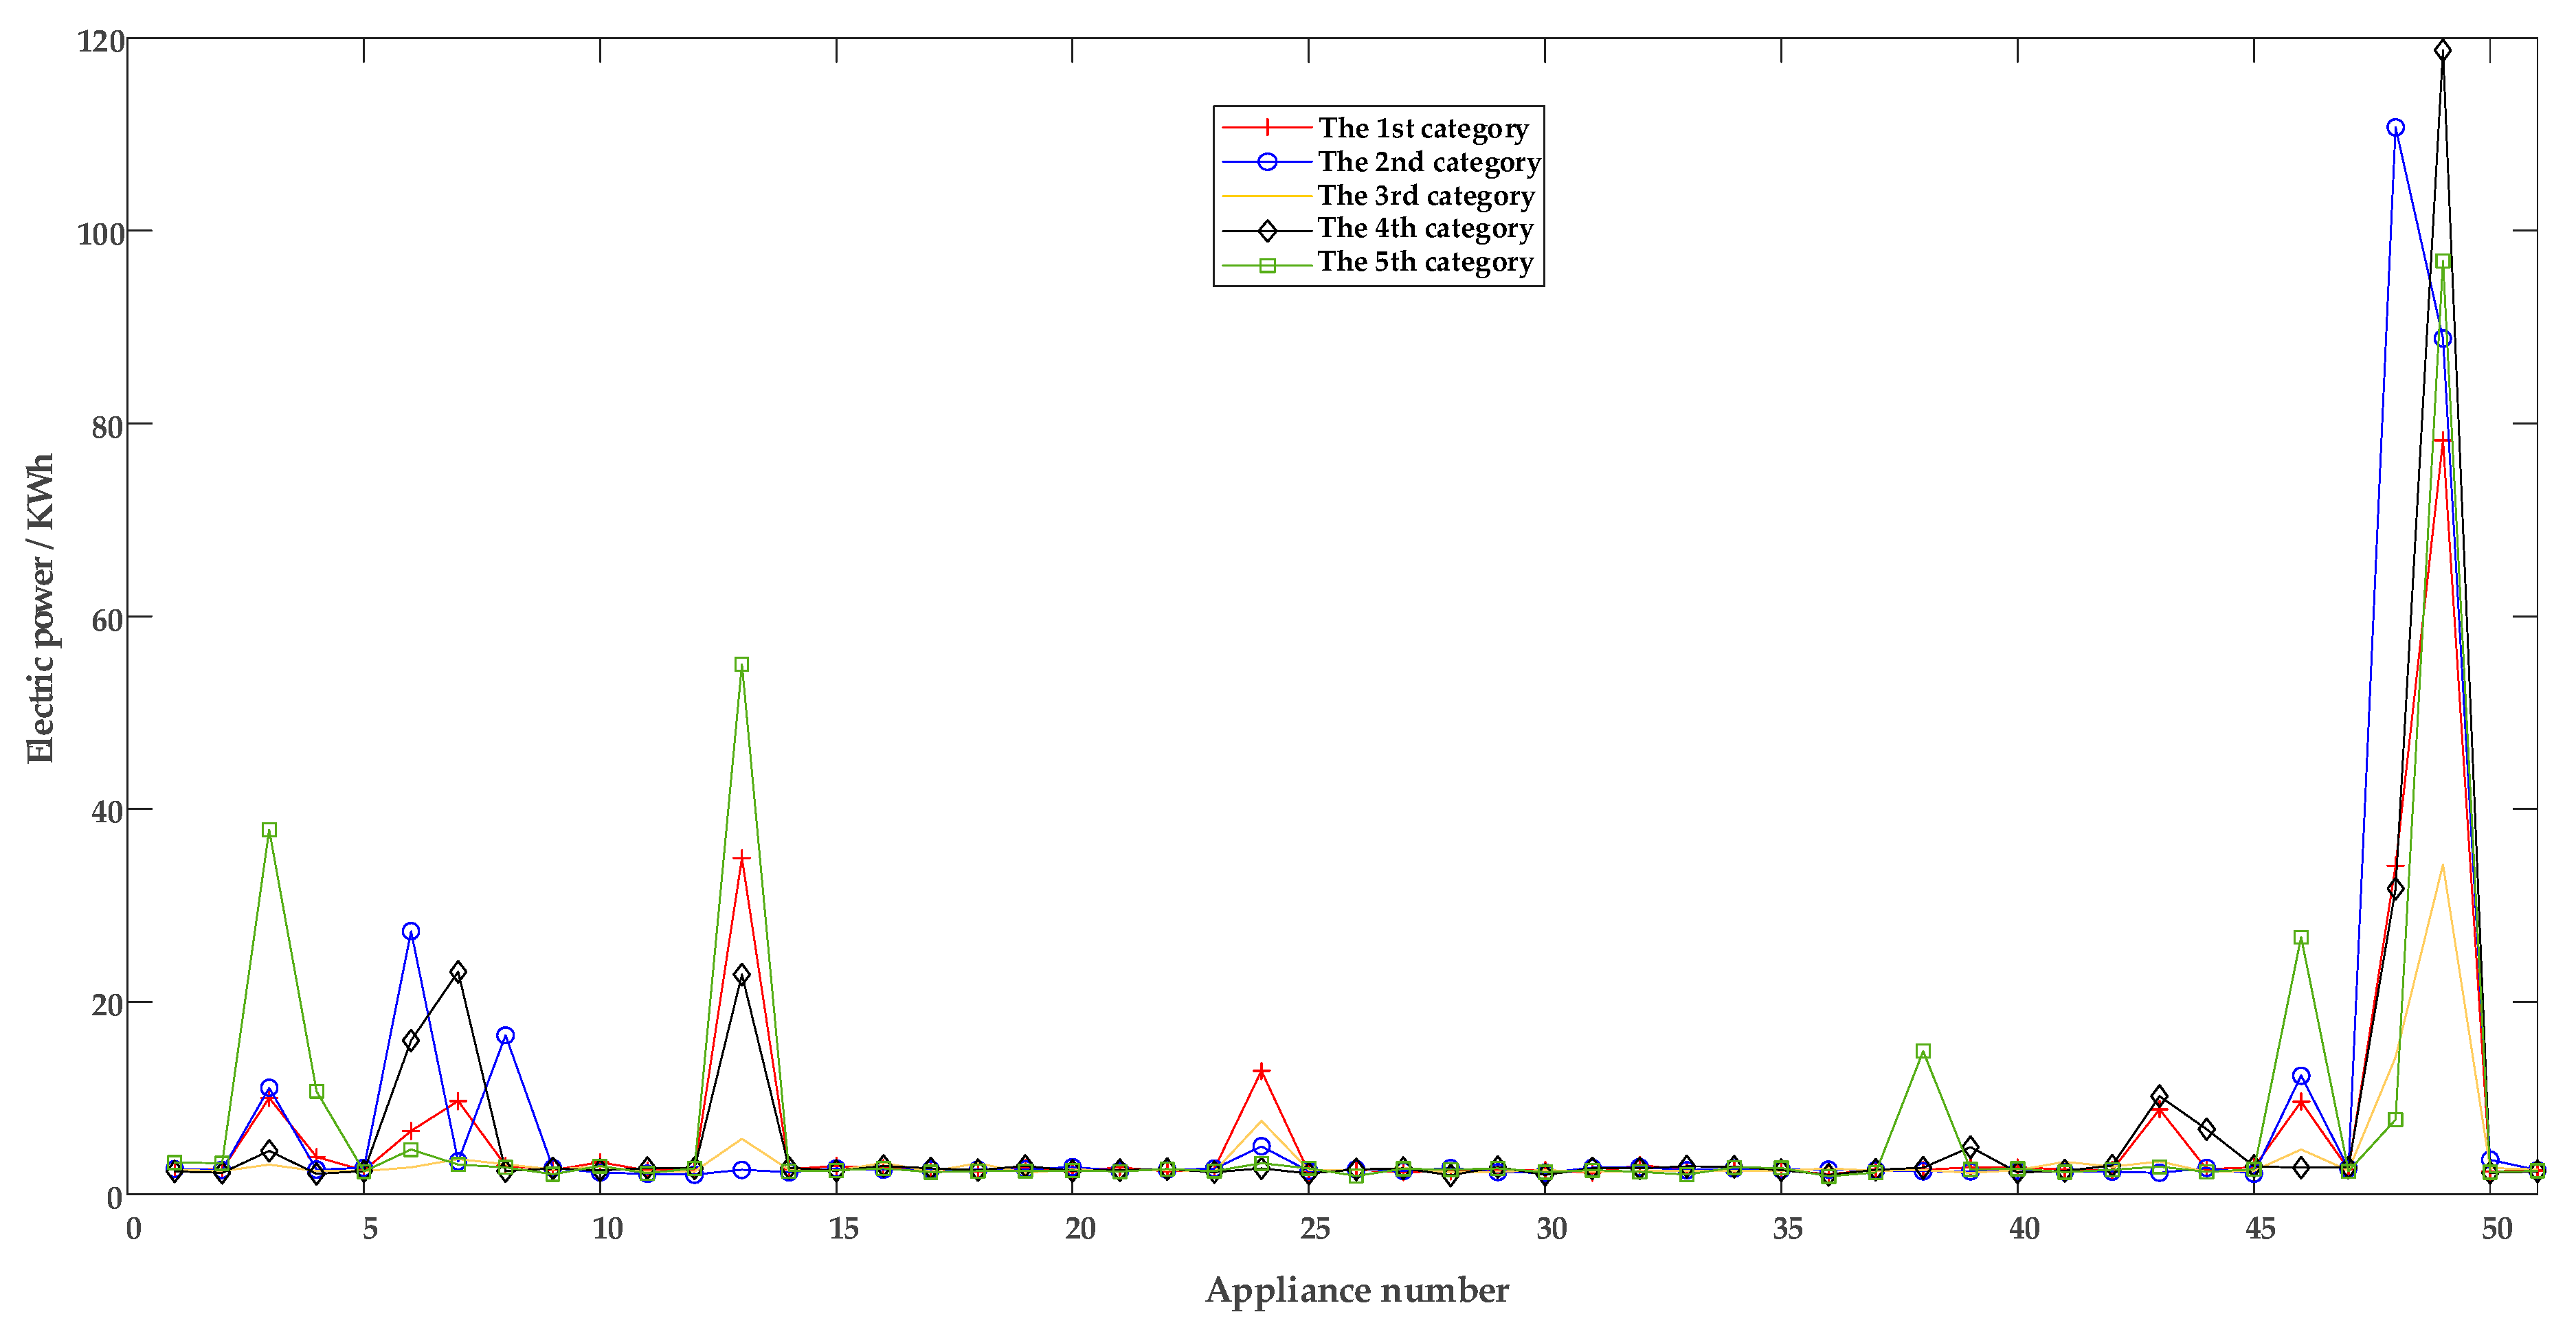
4.2. Cluster Analysis

After PCA processing and analysis of its cumulative variance contribution rate, the first three principal components contain most of the information of the original data set. Therefore, fewer principal components can be used to represent the original data set to achieve dimensionality reduction. After dimensionality reduction, k-means is used to cluster the principal components of the PCA to obtain the user clustering results as shown in Figure 8. After PCA dimensionality reduction, users are divided into five categories by k-means. Some users in the 5th category are similar to those in the 1st, 2nd, and 3rd categories, but others are quite different. The 4th category is different from the other groups and has the fewest users.
Figure 9 is the cluster center curve of the electricity data from each electrical appliance of five types of users. From the trend of the curve, it can be seen that the energy usage for all kinds of consumer electrical appliances is roughly the same. For example, there is an increasing trend for electrical appliances No. 3, No. 13, and No. 24, whereas there is low power consumption for electrical appliances No. 25 through to No. 36. It is worth noting that the power consumption by users in the 2nd category for electrical appliances No. 6 through to No. 8 is higher than that by users in the 3rd category or 5th category, which can be analyzed in the subsequent energy efficiency analysis, and corresponding power consumption suggestions can be given. The description of each appliance is presented in Appendix A. The power consumption of the users in the 1st category is mainly for electrical appliances No. 13, No. 24, and No. 49. Users in the 5th category use more electricity for conventional appliances than other types of users. Users in the 2nd category and 4th category have similar characteristics of electricity consumption for conventional electrical appliances, and the electricity consumption for electrical appliance No. 48 (air conditioner) is relatively prominent. In the subsequent energy efficiency analysis, the rationality of electricity consumption of these two types of users can be analyzed emphatically, and corresponding suggestions for electricity consumption can be given. Compared with other types of users, users in the 3rd category consume less power for electrical appliance No. 48 (air conditioner).
Table 2 shows the specific characteristics of various users, including power consumption, household population, and income. It can be seen that the average power consumption of the 3rd category is the lowest. The power consumption levels of the 2nd category and 5th category are both relatively high, so it is necessary to examine the energy consumption levels of these two types of users and to give corresponding energy recommendations. Since the average energy consumption of the 3rd category users is low, and the family population and house area in Table 2 are at the same level, such types of users can be defined as the “business trip group”. The cluster center of the five types of users has a small gap, and the main difference lies in the user’s energy consumption. The energy consumption levels of users in the 1st category and 4th category are similar. Users in the 4th category have a lower household income, while users in the 1st category have a lower household income and lower population income level.
There are five categories of users: 2nd category—high energy consumption; 1st category—medium and high energy consumption; 4th category—medium energy consumption; 5th category—medium and low energy consumption; and 3rd category—low energy consumption.
The energy consumption levels of five appliances—air conditioners, refrigerators, washing machines, microwave ovens, and dishwashers—were analyzed, and the load decomposition effects are shown in Figure 10. It can be seen that the load decomposition power of microwave ovens, washing machines, and other equipment is quite volatile, but that of air conditioners, refrigerators, and other types of equipment is less differentiated. For each kind of electrical appliance, the load decomposition effect is significant. For electrical appliances with a lower frequency of use, a more accurate load decomposition can be achieved.

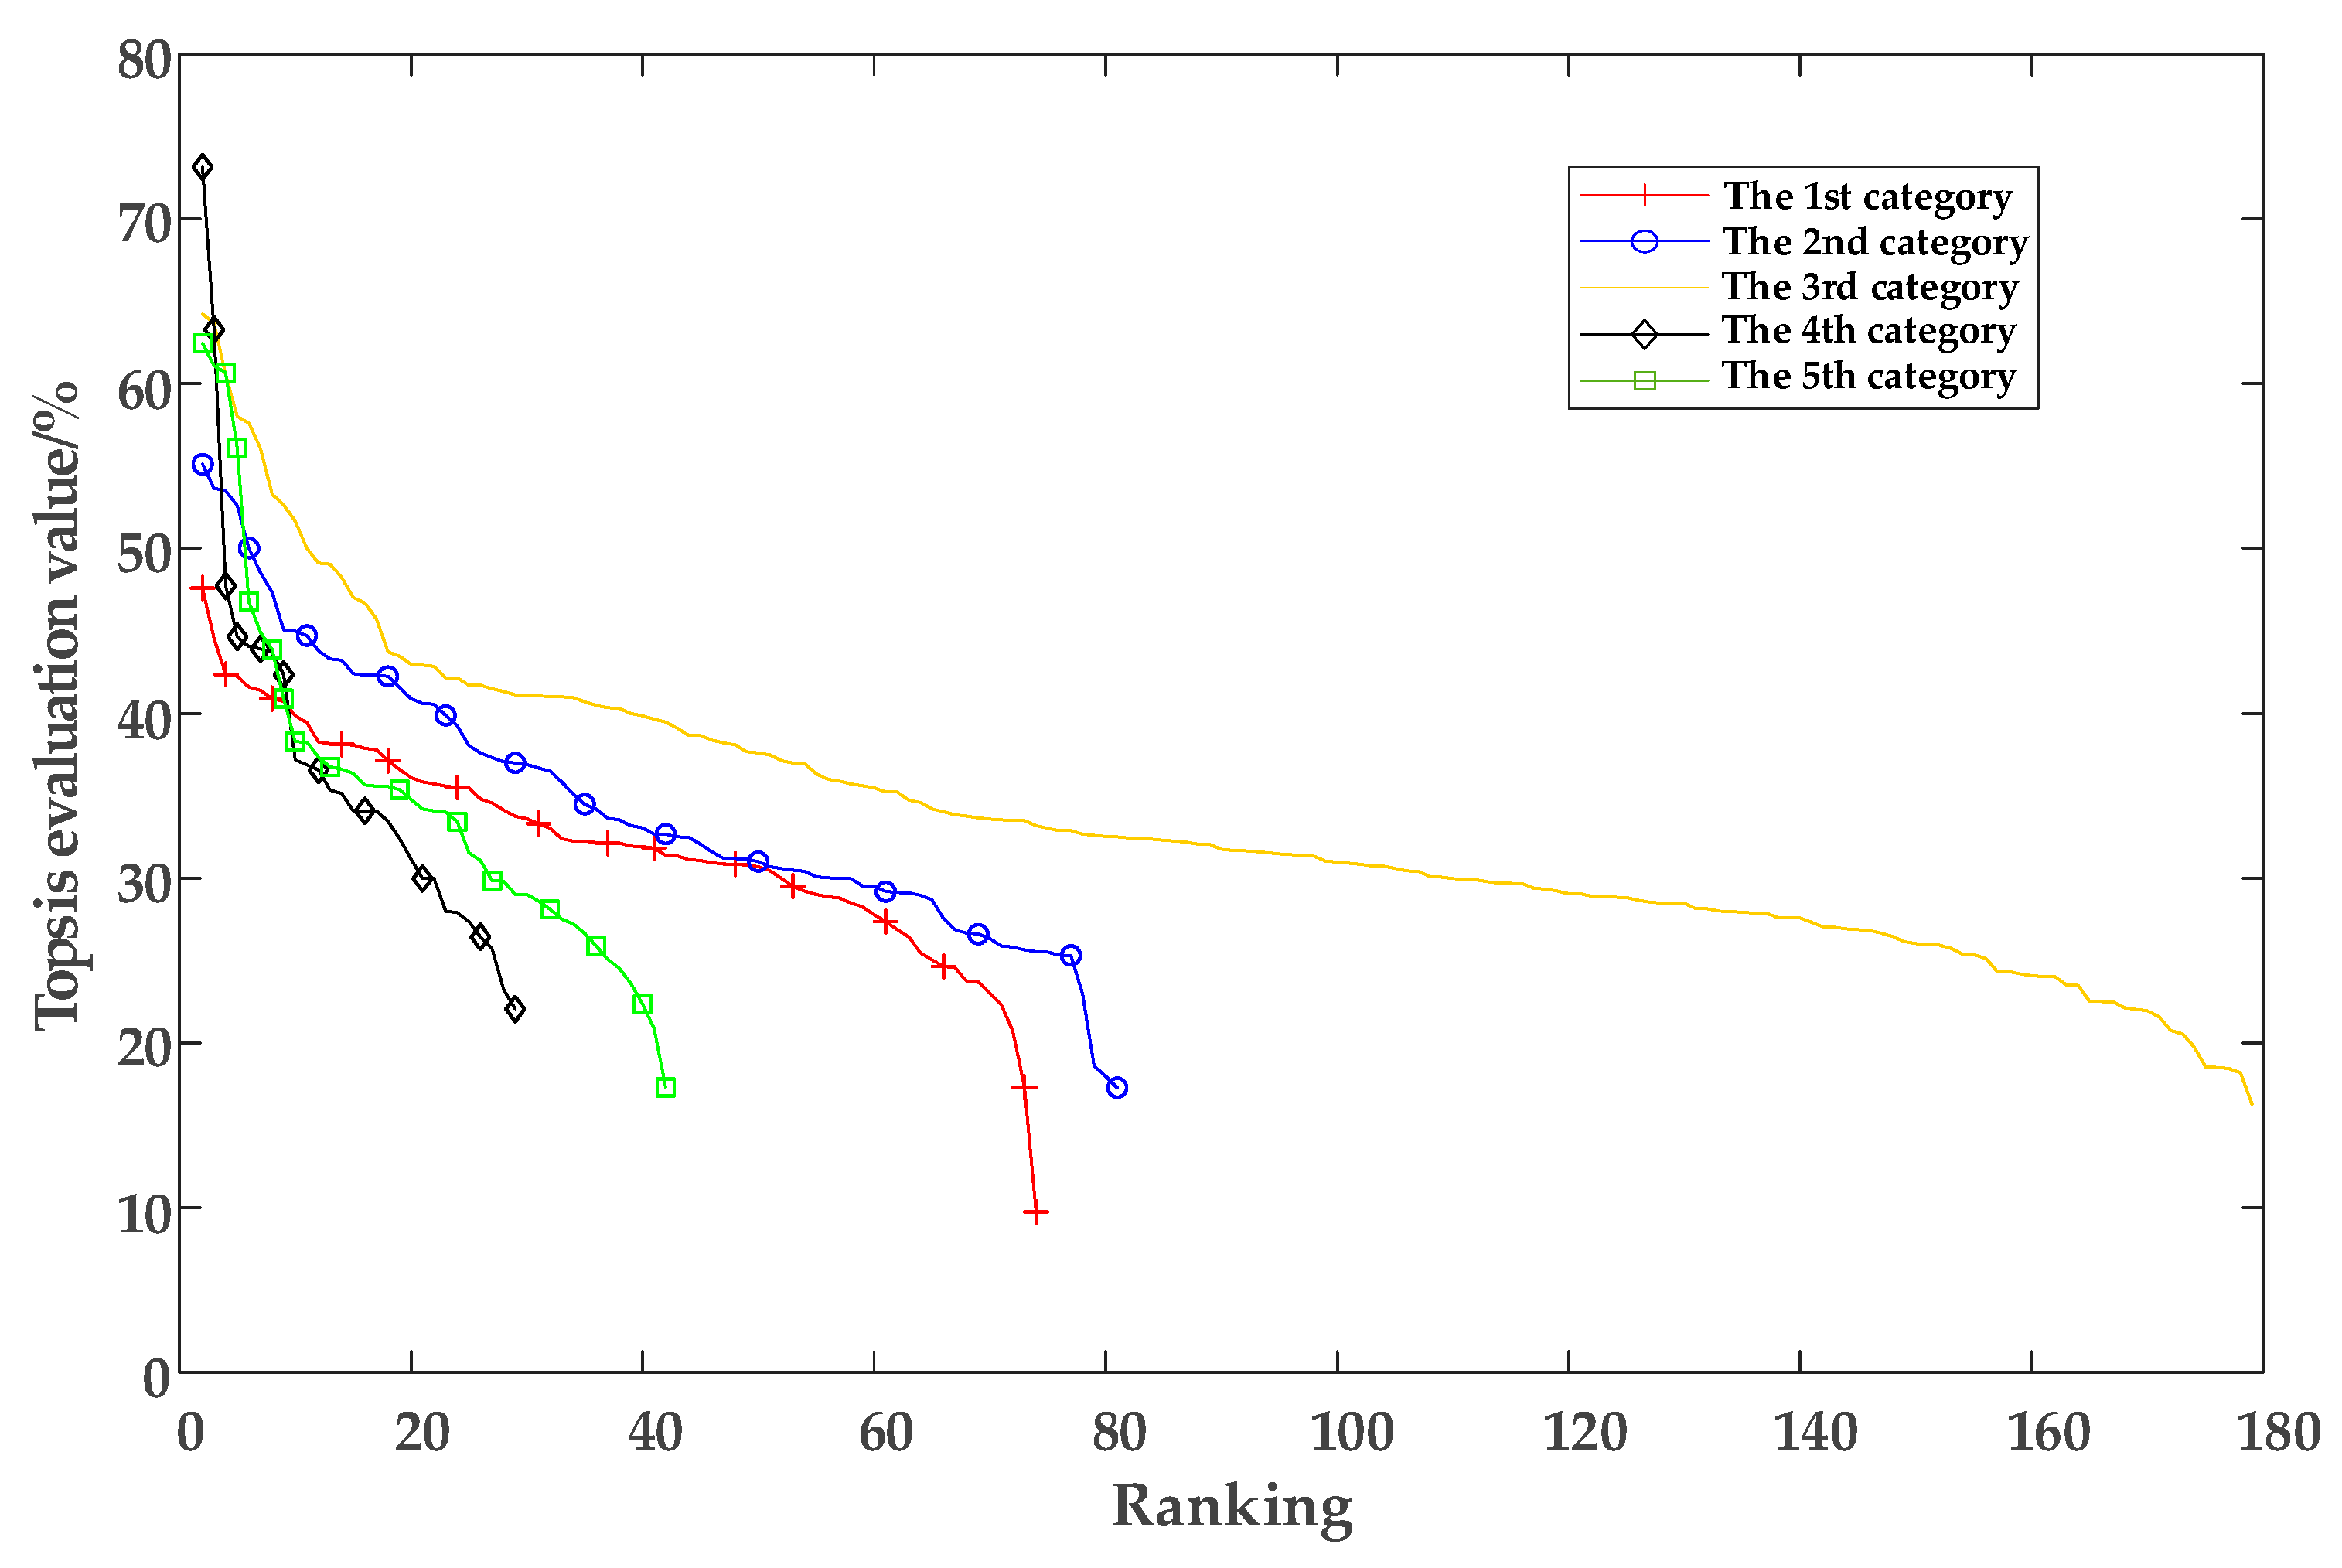
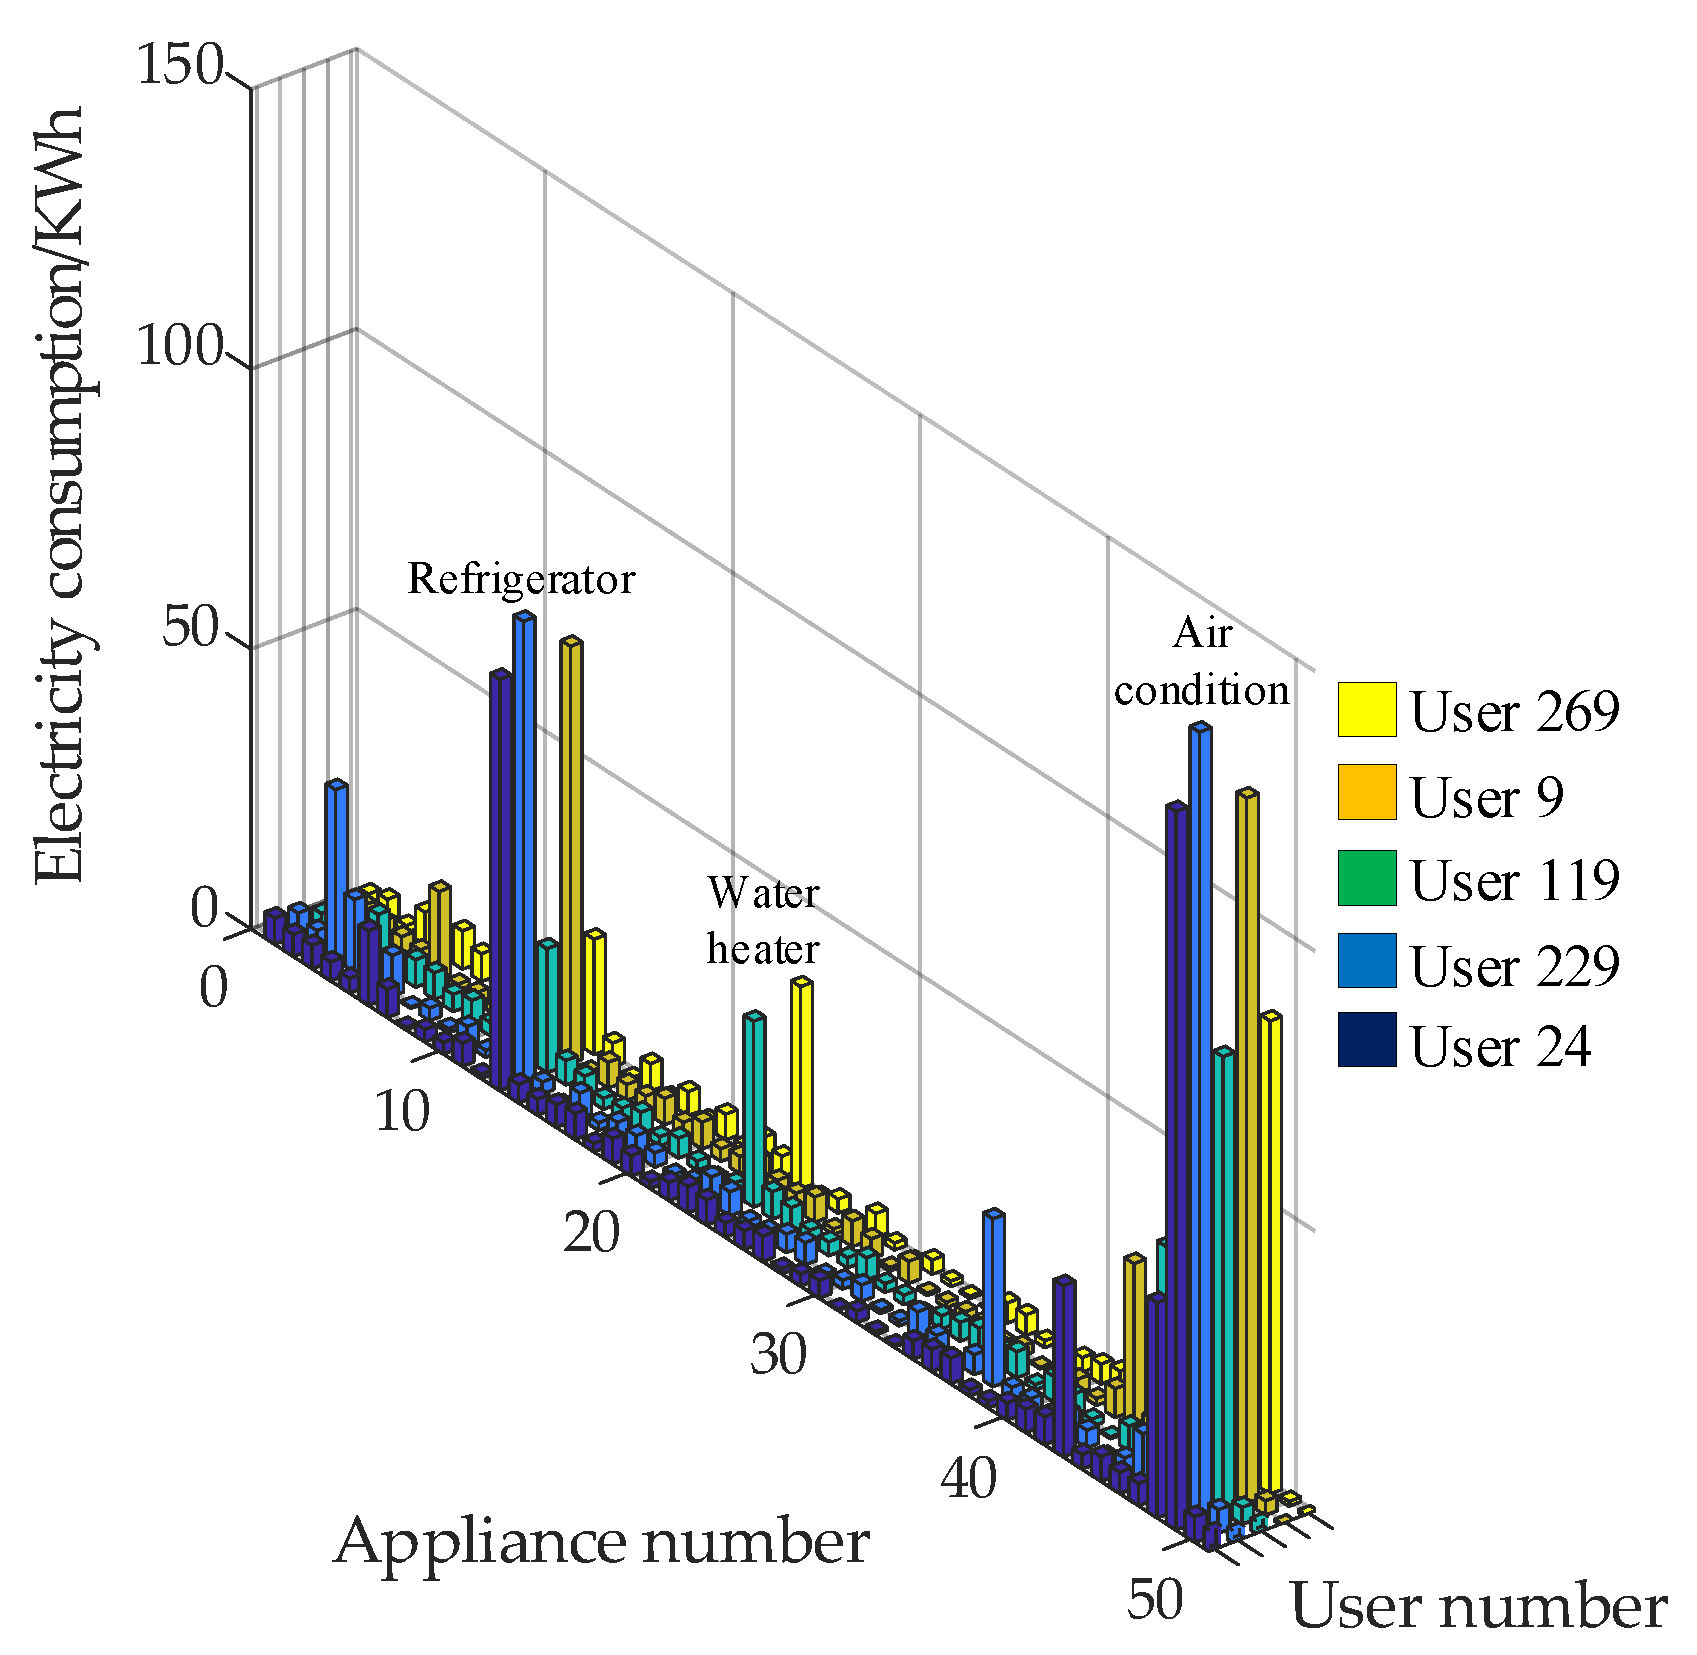
4.3. Energy Efficiency Assessment

The weight coefficients are obtained according to Equations (3)–(5) to determine the weights of the indicators. The scores of the final TOPSIS evaluations are obtained from Equations (6)–(12), and the TOPSIS evaluation scores for each category are shown in Figure 11.
According to Figure 11, energy efficiency analysis is performed for various users. On the whole, the evaluation scores of each family are low, so areas of improvement can be easily identified to increase energy efficiency. It can be seen that the maximum number of users in the 3rd category is above 15 points.
The number of users in the 1st category and 2nd category is large, and the overall score is lower than that in the 3rd category. However, it can be seen from the characteristics of all kinds of users that the population of the 1st category is the lowest at about two people, and the income level of the 2nd category is the highest. The energy usage of the 1st category and 2nd category users should be analyzed emphatically, as there may be unreasonable energy usage, such as leaving lights on in unoccupied rooms. The users in the 4th category have the smallest family size and income but a high energy deficit, which results in this category having the lowest sample number.

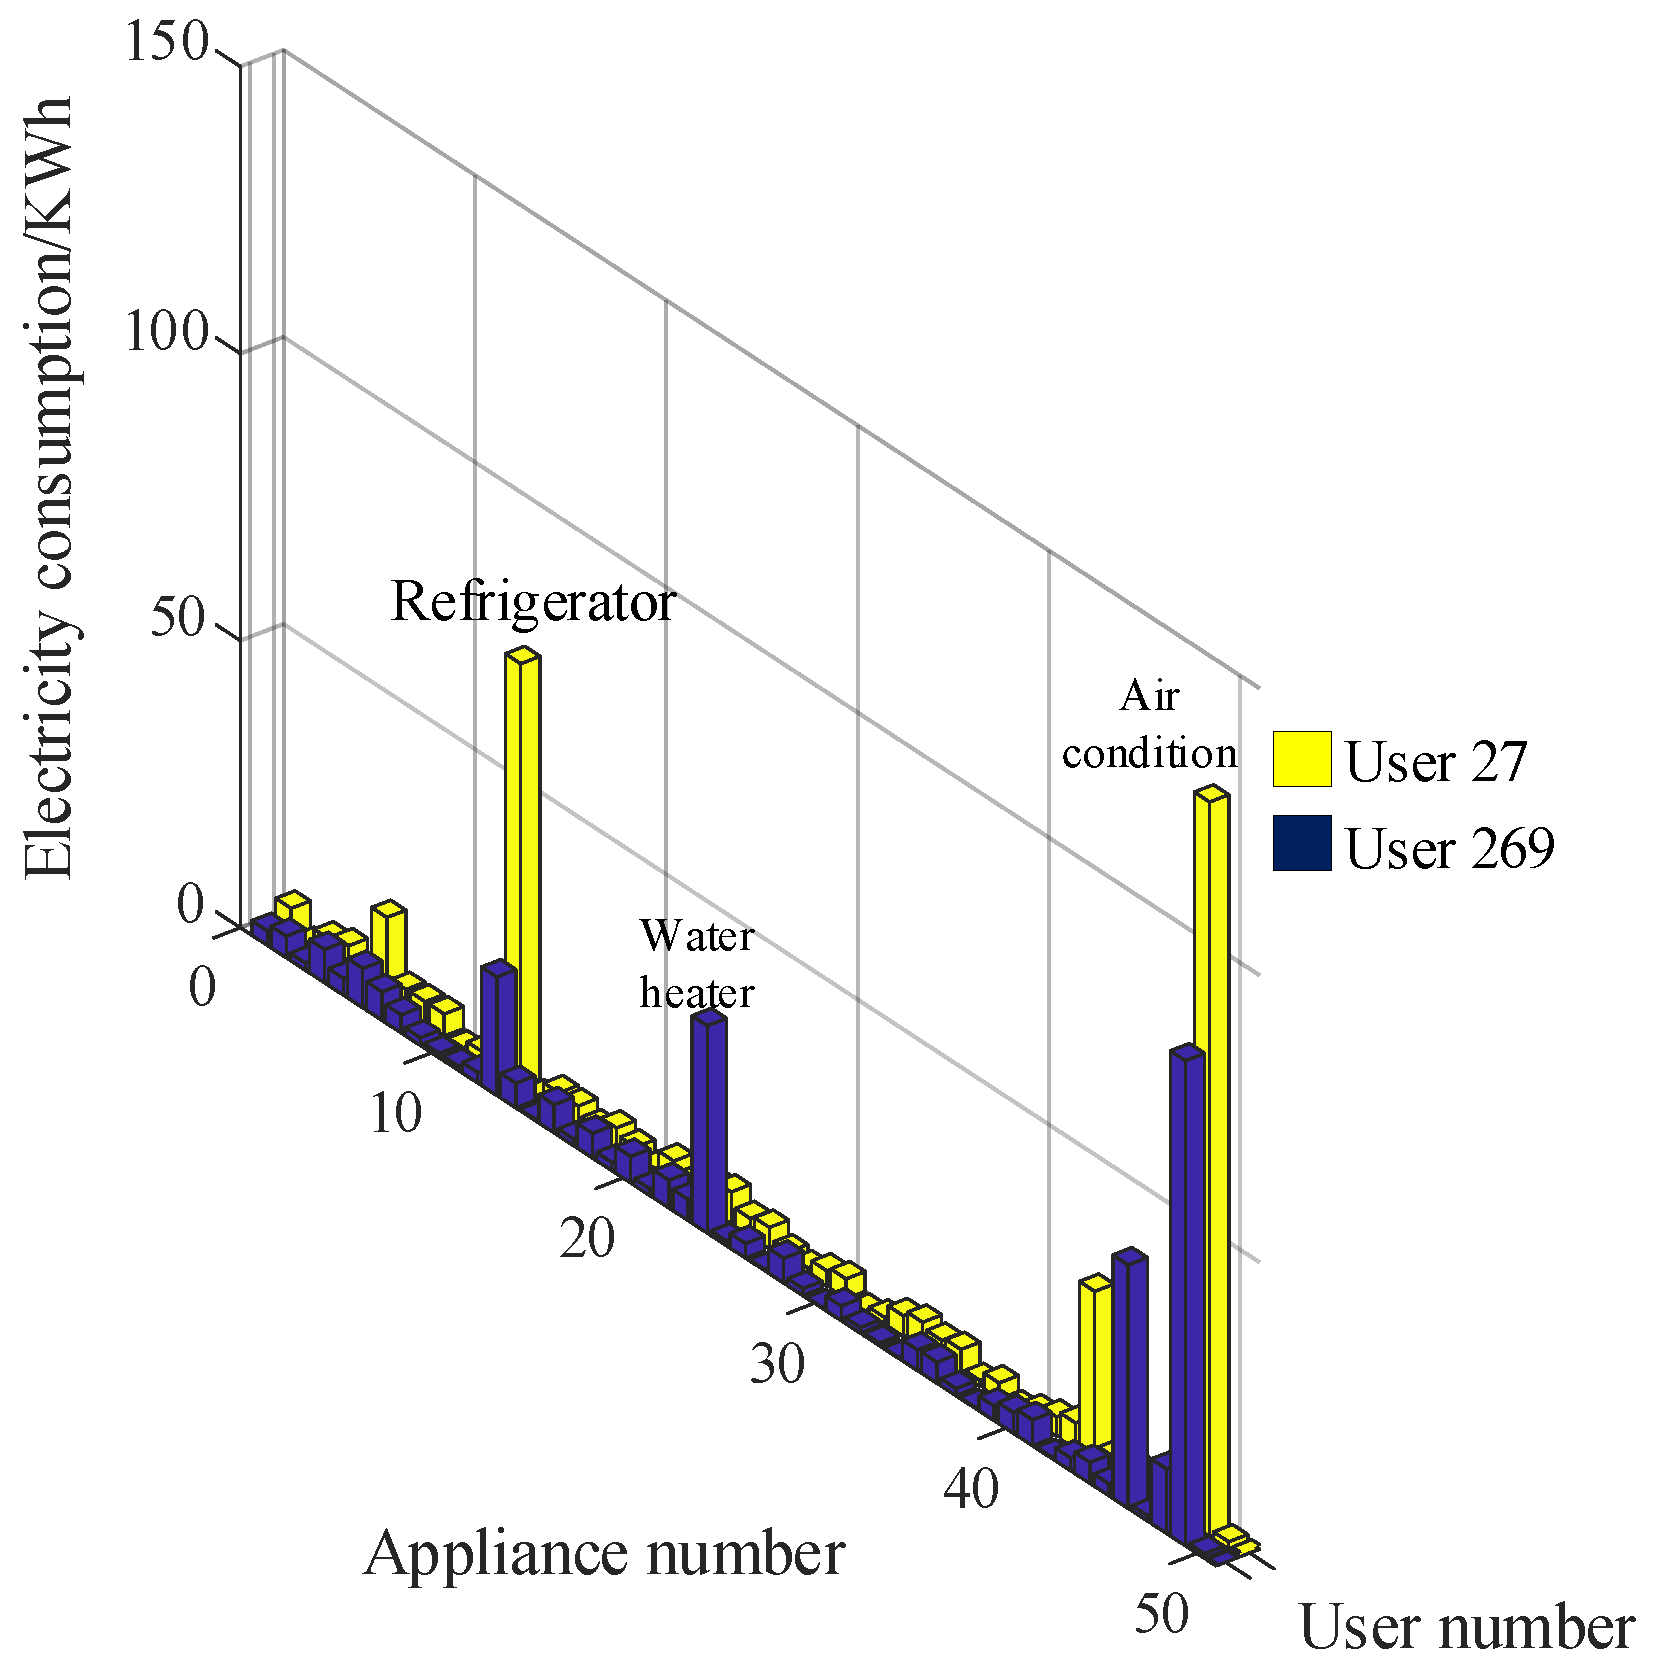
4.4. Power Suggestion

Firstly, the energy difference between different types of users should be determined, and then the users whose scores ranked first in each category of users should be selected for comparison. The energy line diagrams of the five categories of users are shown in Figure 12.
On the whole, the distribution of energy used by various electrical appliances among different types of users is roughly the same. Among them, the energy used by user 119 is significantly lower than that of other users, and the energy consumption of the electrical appliances increases slightly. The energy usage of user 269 is similar to that of the other users, but the clustering results are different due to population, area, and income; so, user 269 has a high score among all the users. Compared with user 269 and user 119, users 24, 229, and 9 consume more energy for electric appliance No. 13 (refrigerator) and electric appliance No. 49 (air conditioner). Therefore, it should be further investigated whether the users’ appliances have a standby mode or if users are leaving lights on in unoccupied rooms. In addition, some households do not consume energy for electric appliance No. 24 (water heater); so, it can be inferred that these households likely use natural gas rather than electricity to generate hot water.
Next, the standard can be compared among users of the same type to analyze the difference in energy use. Figure 13 shows the line graph of energy use of users 269 and 27 in users of Category 5.
It can be seen from Figure 13 that among users of the same type, the energy consumption trend is similar, and the difference is the energy consumption status of some specific appliances. The low-cost users can use higher energy than high-score users, such as user 269 and user 27. User 27 generates a large amount of electricity during the process of using electrical appliances No. 49 (air conditioner), electrical appliance No. 13 (refrigerator), and electrical appliance No. 24 (water heater). The user may be advised to make power adjustments according to the user’s own situation, such as reducing unnecessary use of electrical appliances and replacing old electrical appliances with more efficient options.

5. Conclusions

Aiming at the development of an intelligent energy-using society, this paper proposes a method of energy efficiency index analysis for household users based on NILM data. Through theoretical research and case analysis, some conclusions are obtained as follows:
(1) A household energy efficiency evaluation index system was constructed, which combines data on family population, household income, housing area, and electrical energy consumption, and the use of NILM data improves the accuracy for delineating a user’s power behavior.
(2) The entropy weight method and TOPSIS method were combined to make a comprehensive and accurate analysis of the power consumption manner, which would help a power company to carry out targeted and efficient marketing for different users, and also increase the service level for power supply.
(3) Combining the analysis results of the energy efficiency indicators, household users could understand the weak points of their own energy efficiency and improve their household electricity efficiency by changing the energy-use mode.
Moreover, along with the development of the economy, users may have more and more demands on energy, and their using habits will differ. Under the new circumstances, the characteristics of energy consumption should be continuously combined with the current user demand, and the existing index system and algorithm should be constantly improved. Especially in the era of data explosion, the evaluation method should be appropriately adjusted considering the problems caused by data volume.

Author Contributions

Conceptualization, S.Z. (Shijian Zhu) and X.K.; methodology, S.Z. (Shijian Zhu) and X.K.; software, S.Z. (Shijian Zhu), X.K. and S.Z. (Siqiong Zhang); validation, S.Z. (Shijian Zhu), X.H. and S.Z. (Siqiong Zhang); formal analysis, S.Z. (Shijian Zhu), X.K. and S.L.; investigation, S.Z. (Shijian Zhu), X.H. and S.Z. (Siqiong Zhang); resources, X.H. and S.L.; data curation, Y.L. and X.H.; writing—original draft preparation, S.Z. (Shijian Zhu), X.K. and S.Z. (Siqiong Zhang); writing—review and editing, S.Z. (Shijian Zhu), X.K. and X.H.; visualization, S.Z. (Shijian Zhu) and S.Z. (Siqiong Zhang);supervision, X.K. and X.H.; project administration, Y.L.; funding acquisition, Y.L. All authors have read and agreed to the published version of the manuscript.

Funding

This research was funded by the National Key Research and Development Program of China (2016YFB0901104); and the National Natural Science Foundation of China under Grant (51877145).

Acknowledgments

The formulation of the experimental scheme and the measurement and recording of the experimental data in this paper were completed with the support of the staff of State Grid Tianjin Electric Power Company, and State Grid Jiangsu Electric Power Company.

Conflicts of Interest

The authors declare no conflict of interest.

Nomenclature

NILMNon-intrusive load monitoringTOPSISTechnique for order preference by similarity to an ideal solution
RESRenewable energy sourcesDSMDemand-side management
DGsDistributed generationsDERsDistributed energy resources
DSDistributed storageDRDemand response
EVsElectric vehiclesMGsMicrogrids
PLCPower line communicationAMIAdvanced metering infrastructure
HMMHidden Markov modelPCAPrincipal component analysis
SDStandard deviationLSLoad signature
PEVPlug-in electric vehicleVIKORVisekriterijumsko Kompromisno Rangiranje
AHPAnalytic hierarchy processRMSRoot mean square
FACFeature-additive criterion

Appendix A

IDElectricity appliancesIDElectricity appliancesIDElectricity appliances
1Printer18Vacuum cleaner35Ironing machine
2Soymilk machine19Rangehood36Heating small appliances
3Washing machine20Humidifier37Kitchen treasure
4Microwave oven21Air purifier38Electromagnetic equipment
5Induction cooker22Juicer39Heating
6High-Speed Blender23TV40Air heater
7Lamp24Water heater41Oven
8Computer25Projector42Rice cooker
9Drinking fountain26Electric fan43Pressure cooker
10Electric kettle27Exhaust fan44Stewpan
11Electric heater28Disinfection cabinet45Health pot insulation
12Hairdryer29Bathroom master46Electric heating equipment
13Refrigerator30Electric iron47Electric furnace
4Electric oven31Coffee machine48Home theater
15Rice cooker32Electric health pot49Air conditioner
16Electric pressure cooker33Cooking machine50Dishwasher
17Electric cookers34Electric kitchenware51Dehumidifier

References

  1. The State Council on the Issuance of the “13th Five-Year” Comprehensive Work Plan for Energy Conservation and Emission Reduction Notice. 2016. Available online: http://www.gov.cn/zhengce/content/2017-01/05/content_5156789.htm (accessed on 7 May 2020).
  2. Amir, K.; Ram, R.; Martin, F. Ranking appliance energy efficiency in households: Utilizing smart meter data and energy efficiency frontiers to estimate and identify the determinants of appliance energy efficiency in residential buildings. Energy Build. 2015, 99, 220–230. [Google Scholar] [CrossRef]
  3. Liu, P.; Ding, T.; Yang, Y.; Zou, Z. Integrated Demand Response for a Load Serving Entity in Multi-Energy Market Considering Network Constraints. Appl. Energy 2019, 250, 512–529. [Google Scholar] [CrossRef]
  4. Qu, C.Y.; Wang, C.; Pan, F. Household electricity energy efficiency assessment in smart power utilization environment. Adv. Technol. Electr. Eng. Energy 2015, 34, 61–67. [Google Scholar] [CrossRef]
  5. Ma, L.X.; Zhu, R. Research on real time energy efficiency assessment and intelligent rating method. Electron. Sci. Technol. 2015, 28, 1–4. [Google Scholar] [CrossRef]
  6. Shimoda, Y.; Taniguchi-Matsuoka, A.; Inoue, T.; Otsuki, M.; Yamaguchi, Y. Residential energy end-use model as evaluation tool for residential micro-generation. Appl. Therm. Eng. 2017, 114, 1433–1442. [Google Scholar] [CrossRef]
  7. Zheng, S.M.; Li, Z.M.; Peng, X.G.; Deng, X.K. Hierarchical synthetic evaluation method for energy efficiency of power users. Guangdong Electr. Power 2017, 30, 106–111. [Google Scholar] [CrossRef]
  8. Tian, H.P.; Du, S.S.; Han, X.H.; Yuan, D. Assessment of power integrated energy efficiency for industrial enterprise users based on ahp-entropy method. Smart Grid 2015, 3, 112–118. [Google Scholar] [CrossRef]
  9. Zhang, J.Z.; Chen, X.Y.; Xu, S.M.; Liu, S.; Liao, Y.C.; Yu, K. Electricity utilization evaluation of large industrial users based on AHP and entropy method. Power Syst. Clean Energy 2017, 33, 57–63. [Google Scholar] [CrossRef]
  10. Heidari, M.; Majcen, D.; Van Der Lans, N.; Floret, I.; Patel, M.K. Analysis of the energy efficiency potential of household lighting in Switzerland using a stock model. Energy Build. 2018, 158, 536–548. [Google Scholar] [CrossRef]
  11. Xu, X.Y.; Ang, B.W. Analysing residential energy consumption using index decomposition analysis. Appl. Energy 2014, 113, 342–351. [Google Scholar] [CrossRef]
  12. Zhang, Y.J.; Peng, H.R. Exploring the direct rebound effect of residential electricity consumption: An empirical study in China. Appl. Energy 2017, 196, 132–141. [Google Scholar] [CrossRef]
  13. Wang, Z.; Zhu, H.; Ding, Y.; Zhu, T.; Zhu, N.; Tian, Z. Energy efficiency evaluation of key energy consumption sectors in China based on a macro-evaluating system. Energy 2018, 153, 65–79. [Google Scholar] [CrossRef]
  14. Eskander, M.M.; Sandoval-Reyes, M.; Silva, C.A.; Vieira, S.M.; Sousa, J.M. Assessment of energy efficiency measures using multi-objective optimization in Portuguese households. Sustain. Cities Soc. 2017, 35, 764–773. [Google Scholar] [CrossRef]
  15. Macías, J.S.; Tello, C.P.; Ramírez, A.A.; Arista, A.L.; Almaguer, H.M.; Escobedo, P.R.; Puente, A.R. Assessment of electrical saving from energy efficiency programs in the residential sector in Mexicali, Mexico. Sustain. Cities Soc. 2018, 38, 795–805. [Google Scholar] [CrossRef]
  16. Li, J.; Richaed, E.J. Modelling household energy consumption and adoption of energy efficient technology. Energy Econ. 2018, 72, 404–415. [Google Scholar] [CrossRef] [PubMed]
  17. Su, Y.W. Residential electricity demand in Taiwan: Consumption behaviour and rebound effect. Energy Policy 2019, 124, 36–45. [Google Scholar] [CrossRef]
  18. Kong, X.; Bai, L.; Hu, Q.; Li, F.; Wang, C. Day-ahead optimal scheduling method for grid-connected microgrid based on energy storage control strategy. J. Mod. Power Syst. Clean Energy 2016, 4, 648–658. [Google Scholar] [CrossRef] [Green Version]
  19. Sepehr, M.; Eghtedaei, R.; Toolabimoghadam, A.; Noorollahi, Y.; Mohammadi, M. Modelling the electrical energy consumption profile for residential buildings in Iran. Sustain. Cities Soc. 2018, 41, 481–489. [Google Scholar] [CrossRef]
  20. Heydt, G.T.; Chowdhury, B.H.; Crow, M.L.; Haughton, D.; Kiefer, B.D.; Meng, F.; Sathyanarayana, B.R. Pricing and control in the next generation power distribution system. IEEE Trans. Smart Grid 2012, 3, 907–914. [Google Scholar] [CrossRef]
  21. Bai, L.Q.; Wang, J.H.; Wang, C.S. Distribution Locational Marginal Pricing (DLMP) for Congestion Management and Voltage Support. IEEE Trans. Power Syst. 2018, 33, 4061–4073. [Google Scholar] [CrossRef]
  22. Menghi, R.; Papetti, A.; Marconi, M.G.M. Energy efficiency of manufacturing systems: A review of energy assessment methods and tools. J. Clean. Prod. 2019, 240, 118276. [Google Scholar] [CrossRef]
  23. Yu, Y.X.; Liu, B.; Luan, W.P. Nonintrusive Residential Load Monitoring and Decomposition Technology. South. Power Syst. Technol. 2013, 7, 1–5. [Google Scholar]
  24. Chen, H.C.; Liu, B.; Yan, W.P.; Li, Q.S. Modified Viterbi Algorithm for Nonintrusive Load Monitoring. Proc. Csu-Epsa 2017, 29, 84–88. [Google Scholar] [CrossRef]
  25. Liang, J.; Ng, S.K.; Kendall, G.; Cheng, J.W. Load signature study V part I: Basic concept, structure and methodology. IEEE Trans. Power Deliv. 2010, 25, 551–560. [Google Scholar] [CrossRef]
  26. Bai, L.; Jiang, T.; Li, F.; Chen, H.; Li, X. Distributed Energy Storage Planning in Soft Open Point Based Active Distribution Networks Incorporating Network Reconfiguration and DG Reactive Power Capability. Appl. Energy 2018, 210, 1082–1091. [Google Scholar] [CrossRef]
  27. Kong, X.Y.; Ma, Y.Y.; Zhao, X.; Li, Y.; Teng, Y. A Recursive Least Squares Method with Double-Parameter for Online Estimation of Electric Meter Errors. Energies 2019, 12, 805. [Google Scholar] [CrossRef] [Green Version]
  28. Ke, X.D.; Wu, D.; Lu, N. A Real-Time Greedy-Index Dispatching Policy for Using PEVs to Provide Frequency Regulation Service. IEEE Trans. Smart Grid 2019, 10, 864–877. [Google Scholar] [CrossRef]
  29. Yong, C.; Kong, X.; Chen, Y.; Cui, K.; Wang, X. Multi-objective Scheduling of an Active Distribution Network Based on Coordinated Optimization of Source Network Load. Appl. Sci. 2018, 8, 1888. [Google Scholar] [CrossRef] [Green Version]
  30. Liao, H.; Xu, Z.; Zeng, X.J. Hesitant Fuzzy Linguistic VIKOR Method and Its Application in Qualitative Multiple Criteria Decision Making. IEEE Trans. Fuzzy Syst. 2014, 23, 1343–1355. [Google Scholar] [CrossRef]
  31. Adrian, V.; Thomas, J.S.; James, A. The Effect of Noisy Fair Value Measures on Bank Capital Adequacy Ratios. Account. Horiz. 2013, 27, 693–710. [Google Scholar] [CrossRef]
  32. Lu, J.; Zhu, Y.P.; Peng, W.H.; Sun, Y. Feature selection strategy for electricity consumption behaviour analysis in smart grid. Autom. Electr. Power Syst. 2017, 41, 58–63. [Google Scholar] [CrossRef]
  33. Liu, G.Y.; Yang, J.; Hao, Y.; Zhang, Y. Big data-informed energy efficiency assessment of China industry sectors based on K-means clustering. J. Clean. Prod. 2018, 183, 304–314. [Google Scholar] [CrossRef]
  34. Liu, Y.Q.; Wang, S. Evaluation of the Operation Index of Power Plant Based on Entropy Weight TOPSIS Method. Electr. Power Sci. Eng. 2016, 32, 39–43. [Google Scholar] [CrossRef]
  35. Jiang, Y.G.; Zhang, J.; Asante, D.; Yang, Y. Dynamic evaluation of low-carbon competitiveness (LCC) based on improved Technique for Order Preference by similarity to an Ideal Solution (TOPSIS) method: A case study of Chinese steelworks. J. Clean. Prod. 2019, 217, 484–492. [Google Scholar] [CrossRef]
  36. Rashidi, K.; Cullinane, K.A. Comparison of fuzzy DEA and fuzzy TOPSIS in sustainable supplier selection: Implications for sourcing strategy. Expert Syst. Appl. 2019, 121, 266–281. [Google Scholar] [CrossRef]
  37. Meng, D.; Shao, C.; Zhu, L. Ethylene cracking furnace TOPSIS energy efficiency evaluation method based on dynamic energy efficiency baselines. Energy 2018, 156, 620–634. [Google Scholar] [CrossRef]
  38. Yang, W.; Xu, K.; Lian, J.; Ma, C.; Bin, L. Integrated flood vulnerability assessment approach based on TOPSIS and Shannon entropy methods. Ecol. Indic. 2018, 89, 269–280. [Google Scholar] [CrossRef]
  39. Tang, P.Z.; Chen, D.; Hou, Y.S. Entropy method combined with extreme learning machine method for the short-term photovoltaic power generation forecasting. Chaos. Solitons Fractals 2016, 89, 243–248. [Google Scholar] [CrossRef]
  40. Honold, J.; Kandler, C.; Wimmer, P.; Schropp, B.; Reichle, R.; Gröne, M.; Bünemann, M.; Klein, J.; Kufner, M. Distributed integrated energy management systems in residential buildings. Appl. Therm. Eng. 2017, 114, 1468–1475. [Google Scholar] [CrossRef]
Figure 1. Residential user energy efficiency assessment framework.
Applsci 10 03820 g001
Figure 2. Energy efficiency assessment structure diagram based on NILM technology.
Applsci 10 03820 g002
Figure 3. Waveform and characteristic values of the steady-state load current of some types of household appliances.
Applsci 10 03820 g003
Figure 4. Resident user energy efficiency indicator system.
Applsci 10 03820 g004
Figure 5. Resident user energy efficiency assessment process.
Applsci 10 03820 g005
Figure 6. Time distribution of typical load power.
Applsci 10 03820 g006
Figure 7. Power decomposition of different types of electrical appliances. (a) Refrigerator; (b) Microwave oven.
Applsci 10 03820 g007
Figure 8. User clustering graph after PCA dimension reduction.
Applsci 10 03820 g008
Figure 9. Five types of users’ electrical energy consumption clustering center curve.
Applsci 10 03820 g009
Figure 10. Comparison of the load power of different types of equipment.
Applsci 10 03820 g010
Figure 11. TOPSIS evaluation result trend.
Applsci 10 03820 g011
Figure 12. User comparison between different categories.
Applsci 10 03820 g012
Figure 13. Comparison between users of the same type.
Applsci 10 03820 g013
Table 1. Characteristic values of the steady-state operation.
ParameterFanHeaterMicrowave OvenElectric KettleTVNumber of Wave Peaks
Max0.01780.19990.40490.54500.12093
Min−0.0115−0.1937−0.4484−0.5388−0.10963
RMS0.00760.13770.25420.38450.05946
SD0.00710.13780.25430.38480.05943
Table 2. User characteristics of each type in the clustering result.
I. TypesAverage Electrical Energy Consumption (kWh)Family PopulationHouse Area (m2)Household Monthly Income (RMB)
1st category6.2028519,000
2nd category7.56311026,000
3rd category3.6917018,000
4th category6.8139013,000
5th category7.15410023,000

