Article

Comparative Analysis of Energy Consumption, Indoor Thermal–Hygrometric Conditions, and Air Quality for HVAC, LDAC, and RDAC Systems Used in Operating Rooms

1
Administration Center, Chang Gung Medical Foundation, Taoyuan 333008, Taiwan
2
Department of Engineering Management, Chang Gung Memorial Hospital, Taoyuan 333008, Taiwan
3
Graduate Institute of Clinical Medical Sciences, College of Medicine, Chang Gung University, Taoyuan 333323, Taiwan
4
Department of Respiratory Therapy, College of Medicine, Chang Gung University, Taoyuan 333323, Taiwan
5
Department of Respiratory Care, Chang Gung University of Science and Technology, Chiayi 613016, Taiwan
6
Department of Obstetrics and Gynaecology, Taipei Chang Gung Memorial Hospital, Taipei 105406, Taiwan
*
Author to whom correspondence should be addressed.
Appl. Sci. 2020, 10(11), 3721; https://doi.org/10.3390/app10113721
Submission received: 1 May 2020 / Revised: 23 May 2020 / Accepted: 24 May 2020 / Published: 27 May 2020

Abstract

:
As controlling temperature and humidity is crucial for maintaining comfort and preventing microbial growth, operating rooms (ORs) are the most energy-intensive areas in hospitals. We aimed to evaluate the energy consumption of three dehumidification air conditioning systems used in ORs and their corresponding air quality for ORs at rest. This study selected three ORs using a conventional heating, ventilation, and air conditioning (HVAC) system; a liquid desiccant air conditioning (LDAC) system; and a rotary desiccant air conditioning (RDAC) system, respectively. The indoor thermal–hygrometric conditions, air quality, and energy consumption of the ORs were monitored in this study. The median levels of relative humidity (RH) were 66.7% in the OR using the conventional HVAC system, 60.8% in the OR using the LDAC system, and 60.5% in the OR using the RDAC system. The median daily total energy consumption of the RDAC system (10.1 kWh/m2) and LDAC system (11.8 kWh/m2) were 28.12% and 16.54% lower, respectively, than that of the conventional HVAC system (14.1 kWh/m2). The PM≥0.5 levels and airborne bacterial concentrations in the ORs met the ISO 14644-1 Class 7 standard and China’s GB50333-2013 standard, respectively. The RDAC system was clearly superior to the LDAC and conventional HVAC systems in terms of energy consumption.

1. Introduction

Surgical site infections are common in hospital settings [1] and can be caused by many factors, including ventilation [2]. Fungal growth problems have always existed in hot and humid areas [3]. Some postoperative patients with fungal infections in hospitals were reported due to the discharge of fungal spores from contaminated air conditioning systems [3,4]. The American Society of Heating, Refrigerating and Air-Conditioning Engineers (ASHRAE)/American Society of Health Care Engineering (ASHE) Standard 170, Canadian Standards Association (CSA) Z317.2-15 standard, and Facility Guidelines Institute (FGI) requirement all suggest a minimum ventilation rate, air temperature, and relative humidity (RH) for operating rooms (ORs) [5,6,7].
The indoor humidity level was associated with human thermal comfort [8], indoor air quality [9], and the operating efficiency of the air conditioning system [10]. Environmental monitoring and control are important issues in healthcare settings to ensure the health and safety of patients and medical staff. To minimize infection risk and maintain human thermal comfort, the ASHRAE/ASHE Standard 170 suggests the levels of temperature/RH in ORs [5]. The ASHRAE “HVAC Design Manual for Hospitals and Clinics” [11] also recommends the level of design parameters in the ventilation system of an OR. The dehumidification systems used in hospitals include conventional HVAC, LDAC and RDAC. Conventional HVAC systems lower the temperature of mixed air (outdoor and return air) through the air conditioning of chilled water coils below the dew point temperature to remove moisture (latent heat removal) [12]. This system tends to lower the temperature of mixed air, which must then be warmed using heated water coils to meet temperature and comfort requirements, thus wasting energy. Since conventional HVAC systems may not effectively control the temperature of outflow chilled water, their usage likely increases the RH of a room [12]. Furthermore, the conventional HVAC system uses the vapor-compression recycled design, whose refrigerant may be associated with global warming. Therefore, LDAC and RDAC systems are recommended for ventilation [13].
In contrast, LDAC systems have such advantages as high dehumidification efficiency, low energy consumption, and a dehumidification efficiency not affected by time [14,15]. In hot and humid areas, the LDAC system has been proposed as an alternative system due to its advantages, such as removal of the air latent load and pollutants from the process air and reduction of electrical energy [15]. These advantages are also present in RDAC systems [16]. Lithium chloride is the commonly used desiccant because of its property of low vapor pressure and stability [15] as well as its thermo-chemically synergistic kill effect (up to 99.99%) on anthrax spores and their surrogates [17]. Thus, the LDAC system is similar to a wet dust collector to filter airborne particulate matters [15]. These LDAC systems transfer and disperse water molecules from the high partial pressure of water vapor to the low partial pressure of water vapor to achieve moisture transmission and dehumidification (latent heat processing) [14]. A salt or triethylene glycol solution is used to adjust the liquid desiccant concentration and temperature in order to achieve dehumidification. A typical LDAC system is divided into dehumidification and regeneration sides. When moist air enters the dehumidification side, it comes into contact with the low-temperature dehumidified liquid (with low vapor pressure) to perform heat exchange and expel dry warm air. Then, the moisture (now high-temperature humidified moisture with high vapor pressure) flows to the regeneration side where it comes into contact with the airflow from this side and discharges the humidity into the air to achieve the regeneration of the solution [15].
In 2010, Dai et al. concluded that RDAC systems consume less energy and are more environmentally friendly than conventional HVAC systems [9]. These RDAC systems are generally installed with a desiccant wheel assembly with a high moisture absorption ability in the air-handling unit (AHU) [18]. In an RDAC system, the desiccant wheel is used to enhance the dehumidification performance of a traditional cooling coil. The operation concept of the RDAC system which was used in our study involves a differed enthalpy wheel and a heat-regenerated wheel. The desiccant wheel can absorb water vapor from the air downstream of the cooling coil and then add it back into the air upstream of the coil where the coil removes water through condensation. When the desiccant wheel rotates into the mixed air stream, the desiccant can release water vapor into the air due to it being exposed at a much lower relative humidity (typically 40% to 60%). The characteristics of the desiccant let the wheel be regenerated at low temperatures and do not require the second regeneration air stream. Thus, RDAC systems can save cooling and reheat energy [16].
Medical needs impose strict requirements for uninterrupted and specialized 24-h air conditioning, making hospitals among the most energy-intensive buildings. Furthermore, as ORs have specific air quality requirements, their ventilation conditions are even more stringent, making them among the most energy-intensive areas within hospitals [19,20,21]. According to the US Energy Information Administration (EIA), HVAC systems account for 30% of the total energy consumption in commercial buildings [22]. The air conditioning systems provide relatively high airflow to hospital ORs and then the energy consumption of ORs increases [23].
To date, few studies have assessed the energy consumption of different dehumidification air conditioning systems, or the indoor thermal–hygrometric conditions and air quality characteristics of ORs at rest, while using different dehumidification systems. Therefore, in this study, we evaluated the energy consumption of the different dehumidification air conditioning systems used in Taiwanese ORs and evaluated the air quality of ORs at rest.

2. Materials and Methods

2.1. Study Location

This study selected to examine three ORs in the Linkou Chang Gung Memorial Hospital in Northern Taiwan. These three different ORs included (1) a trauma OR using a conventional HVAC system with a make-up AHU (defined as overcooled mixed air below the dew point temperature which removes sufficient moisture by using low temperature chilled water (about 6 to 7 °C)) (ss-10, mine quality, Hsinchu, Taiwan) and a regular AHU (ss-37, mine quality, Hsinchu, Taiwan); (2) a trauma OR using an LDAC system with a make-up AHU (ss-10, mine quality, Hsinchu, Taiwan), a liquid desiccant dehumidifier (DT-S 6, Ducool, Haifu, Israel), and a regular AHU (ss-37, mine quality, Hsinchu, Taiwan); and (3) an otorhinolaryngology (ENT) OR using an RDAC system (CLCP 025,Trane, Taoyuan, Taiwan) (Figure 1). The three ORs at rest were categorized as ISO 14644-1 Class 7. The two trauma ORs measured 6.6 (L) × 5.43 (W) × 3.0 (H) m (volume 107.59 m3), while the ENT OR measured 6.42 (L) × 5.43 × 3.0 (H) m (volume 119.12 m3). Each OR had four return air vents capable of returning 85% of the total circulating airflow. The return air filter was cleaned weekly, and the high-efficiency particulate air filter (HEPA filter) was changed annually. The indoor thermal–hygrometric design conditions were set at 19–23 °C for temperature and 55%–65% for RH.

2.2. Indoor Thermal–Hygrometric Conditions and Air Quality Monitoring

We sampled the air in each OR 10 times during the study period (August 2016 to July 2017), for 4 consecutive hours (8:00 to 12:00 a.m.) each time, with no change in clinical ventilation frequency (30 ACH). The washout period of the ORs was at least 12 h before indoor air sampling. During the sampling period, the ORs were at rest (no patients or medical personnel were allowed inside) but the dehumidification air conditioning systems were still in operation as in active ORs. The sampling instruments were placed at least 1 m from the wall and 100 cm from the ground to simulate the position of the operation zone.
The measurement of the indoor thermal–hygrometric conditions and air quality in the ORs included air temperature, RH, CO2, PMs, and airborne bacteria. Air temperature, RH, and CO2 were measured using a direct-reading thermo-hygrometer (TSI, Q-TRAKTM Indoor Air Quality Meter 7575, Shoreview, MN, USA). The accuracy of the thermo-hygrometer was ±0.5 °C in the range of 0–60 °C for temperature; ±3% in the range of 5%–95% for RH; and ±3.0% in the range of 0–5000 ppm for CO2. The sampling frequency was once per 1 min. Suspended particulate (PM≥0.5, PM10, PM2.5, PM1) concentrations were measured using a portable particulate monitor (Model 1.109; Grimm Labortechnik Ltd., Ainring, Germany). The accuracy of the particulate monitor was ±2% in the range of 1 to 2 × 10⁹ particles/m3 for number concentration and ±5% in the range of 0.1–105 μg/m3 for mass concentration. The sampling frequency was once per 6 s. Airborne bacterial concentrations were monitored using a one-stage cascade impactor (N6; Andersen Samplers, Atlanta, GA, USA) using the parallel duplicate method. The flow rate for airborne bacterial sampling was 28.3 L per minute (LPM), with a sampling time of 5 min, using a 45 mL tryptic soy agar (TSA) culture medium (DIFCO, Franklin Lakes, NJ, USA). The sampled bacterial culture medium was placed in a constant-temperature incubator at 35 ± 1 °C for 48 ± 2 h, and we used a positive hole conversion table to calculate the number of airborne bacteria [24]. Dividing that number by the sampling flow rate and time allowed us to obtain the airborne bacterial concentration. A 10% blank test was conducted to ensure experimental quality. All instruments were properly calibrated to ensure accuracy.
To evaluate the relationship between the ambient thermal–hygrometric conditions and energy consumption of different dehumidification air conditioning systems, this study collected the hourly data of ambient air temperature and relative humidity from the air quality monitoring station nearest the study hospital for a year. The air monitoring data quality was inspected regularly by Taiwan’s Environmental Protection Agency to ensure data accuracy.

2.3. Energy Consumption

As above mentioned, during the air sampling period (August 2016 to July 2017), this study also collected the data of energy consumption in the three ORs with different dehumidification air conditioning systems. Energy consumption monitoring of the dehumidification air conditioning systems included energy consumption on both the air (fan, heat pump, and other equipment) side and water side. The former was directly measured using a direct-reading digital multimeter (ADTEK, CPM-20, New Taipei City, Taiwan) to record electricity consumption (kWh). Meanwhile, for the latter, the thermal energy related to the chilled and hot water sides were directly measured using a calorimeter (including the flow meter and water supply/return thermometer) (Willes, EL1000 + WL500S-CY, Bristol, UK). The calorimeter was used with the electromagnetic induction principle. The accuracy of the calorimeter was ±0.2% of readings in the measurement range of 0.1−12 m/s for bi-directional flow, current, and pulse output. Two pumps for delivering the liquid desiccant in the LDAC system and the heater for regeneration in the RDAC were also included to record electricity consumption. Data were recorded every 15 min for a year, regardless of whether ORs were in use or not (i.e., at night or on holidays).
The energy consumption values of the chilled water sides were converted into electricity consumption (kWh) using the following formula:
Y (kWh) = a (kW)/b (3.51 kW/RT) × c (0.85 kWh/RT)
where Y = electricity consumption, a = thermal power related to chilled water, b = conversion factor from RT to kW, and c = operating efficiency of chilled water.
In this study, the energy consumption of the dehumidification air conditioning system in each OR was calculated using electricity consumption divided by the area of the OR.

2.4. Statistical Analysis

All data were analyzed using SPSS version 25.0 statistical software (SPSS, Inc., Chicago, IL, USA), and statistical graphs were plotted with GraphPad Prism 6.0 software (GraphPad Software, Inc., San Diego, CA, USA). The level of significance was set as 0.05. The p value meant the probability of test results was observed at least as extreme as the results assumed that the null hypothesis was correct. The daily energy consumption of the different chilled water coils, heating coils, and fans were compared using the Kruskal–Wallis and Mann–Whitney U tests, which were also used to compare the differences in temperature, RH, CO2 concentration, suspended particulate concentration, and airborne bacterial concentration. The Spearman correlation test was used to analyze changes in the air quality of the ORs. Furthermore, we adopted the Spearman correlation test to evaluate the relationship between ambient temperature/RH and the daily total energy consumption of the dehumidification air conditioning systems. The Spearman correlation coefficient (rs) is a nonparametric measure of rank correlation between two variables. A simple linear regression analysis was used to determine how ambient temperature and RH impacted on the log-transformed daily total energy consumption of the ORs with different dehumidification air conditioning systems.

3. Results

The median air temperature of the OR using the RDAC system (20.40 °C) was significantly higher than that of the OR using the conventional HVAC system (19.68 °C, p < 0.01) and the one using the LDAC system (19.44 °C, p < 0.01) (Table 1). The median indoor RH of the OR using the RDAC system (60.49%) and that of the OR using the LDAC system (60.84%) were significantly lower than that of the OR using the conventional HVAC system (66.73%, p < 0.01). The CO2 concentration of the OR using the LDAC system (421.20 ppm) was significantly higher than that of the OR using the conventional HVAC system (357.51 ppm, p < 0.01) and the one using the RDAC system (408.88 ppm, p = 0.026). The PM≥0.5 concentration of the OR using the conventional HVAC system (101.53 particles/L, p < 0.01) and that of the OR using the LDAC system (88.08 particles/L, p < 0.01) were significantly higher than that of the OR using the RDAC system (21.33 particles/L). Similar results were found for PM10, PM2.5, and PM1 in the three ORs. The median concentrations of airborne bacteria were 46.34–56.42 colony forming units (CFU)/m3 in the operating areas and 59.80–112.87 CFU/m3 in the surrounding areas of the three ORs using the different dehumidification air conditioning systems. No difference in airborne bacterial concentration was observed in the operating or surrounding areas of the three ORs.
For the indoor thermal–hygrometric conditions and air quality parameters of the OR using the conventional HVAC system, the indoor air temperature was negatively correlated with RH level (rs = −0.624, p < 0.01), RH was negatively correlated with CO2 (rs = −0.769, p < 0.01), and PM≥0.5 was positively correlated with PM10, PM2.5, and PM1 (rs = 0.793–0.981, p < 0.01) (Table 2). For the OR using the LDAC system, air temperature was negatively correlated with RH (rs = −0.732, p < 0.01) and CO2 (rs = −0.521, p < 0.01), while PM≥0.5 was positively correlated with PM10, PM2.5, and PM1 (rs = 0.678–0.953, p < 0.01). For the OR using the RDAC system, temperature and RH were negatively correlated (rs = −0.629, p < 0.01), while CO2 was positively correlated with PM≥0.5 (rs = 0.422, p < 0.01), PM10 (rs = 0.321, p = 0.043), PM2.5 (rs = 0.395, p = 0.012), and PM1 (rs = 0.345, p = 0.029); PM10 was also positively correlated with both PM2.5 and PM1 (p < 0.01). The airborne bacterial concentration in the OR using the RDAC system was positively correlated with PM10 (rs = 0.779, p < 0.01) and PM2.5 (rs = 0.681, p = 0.03), but not for the other systems.
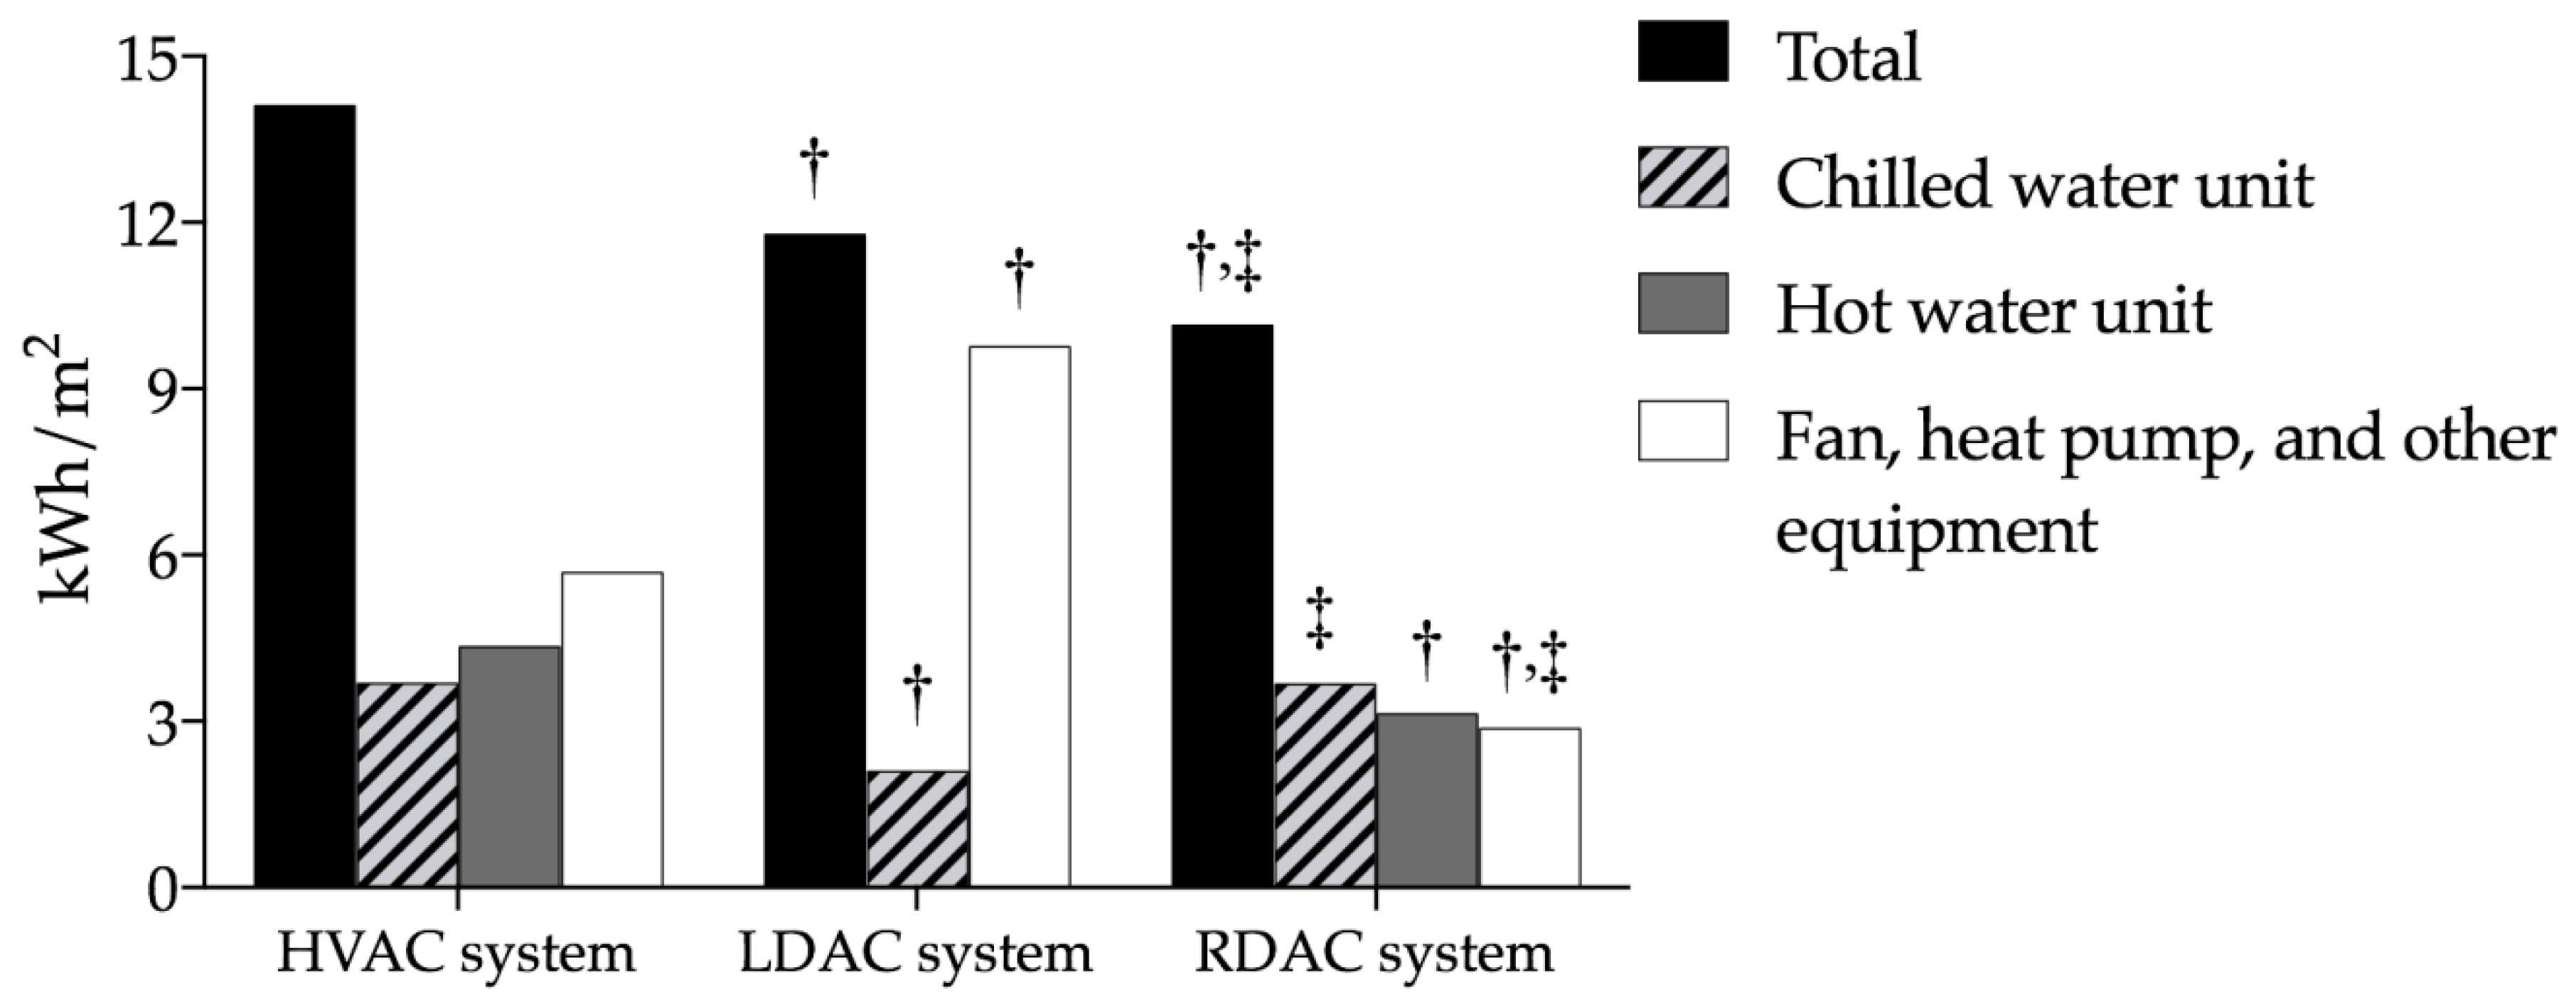
The annual total energy consumption of the conventional HVAC system (176,007.8 kWh) was higher than both the LDAC system (146,781.1 kWh) and the RDAC system (140,782.8 kWh). The median daily total energy consumption of the HVAC system (14.1 kWh/m2) was significantly higher than that of the LDAC system (11.8 kWh/m2, p < 0.01) and the RDAC system (10.1 kWh/m2, p < 0.01) (Figure 2). The median daily energy consumption of the chilled water unit in the LDAC system (2.1 kWh/m2) was significantly lower than that in the HVAC system (3.7 kWh/m2, p < 0.01) and that in the RDAC system (3.7 kWh/m2, p < 0.01) (Figure 2). The median daily energy consumption of the hot water unit in the conventional HVAC system (4.4 kWh/m2) was slightly higher than that in the RDAC system (3.1 kWh/m2, p = 0.326). Furthermore, the median daily energy consumption of the fan, heat pump, and other equipment in the LDAC system (9.8 kWh/m2) was significantly higher than that in the HVAC system (5.7 kWh/m2, p < 0.01) and that in the RDAC system (2.9 kWh/m2, p < 0.01).
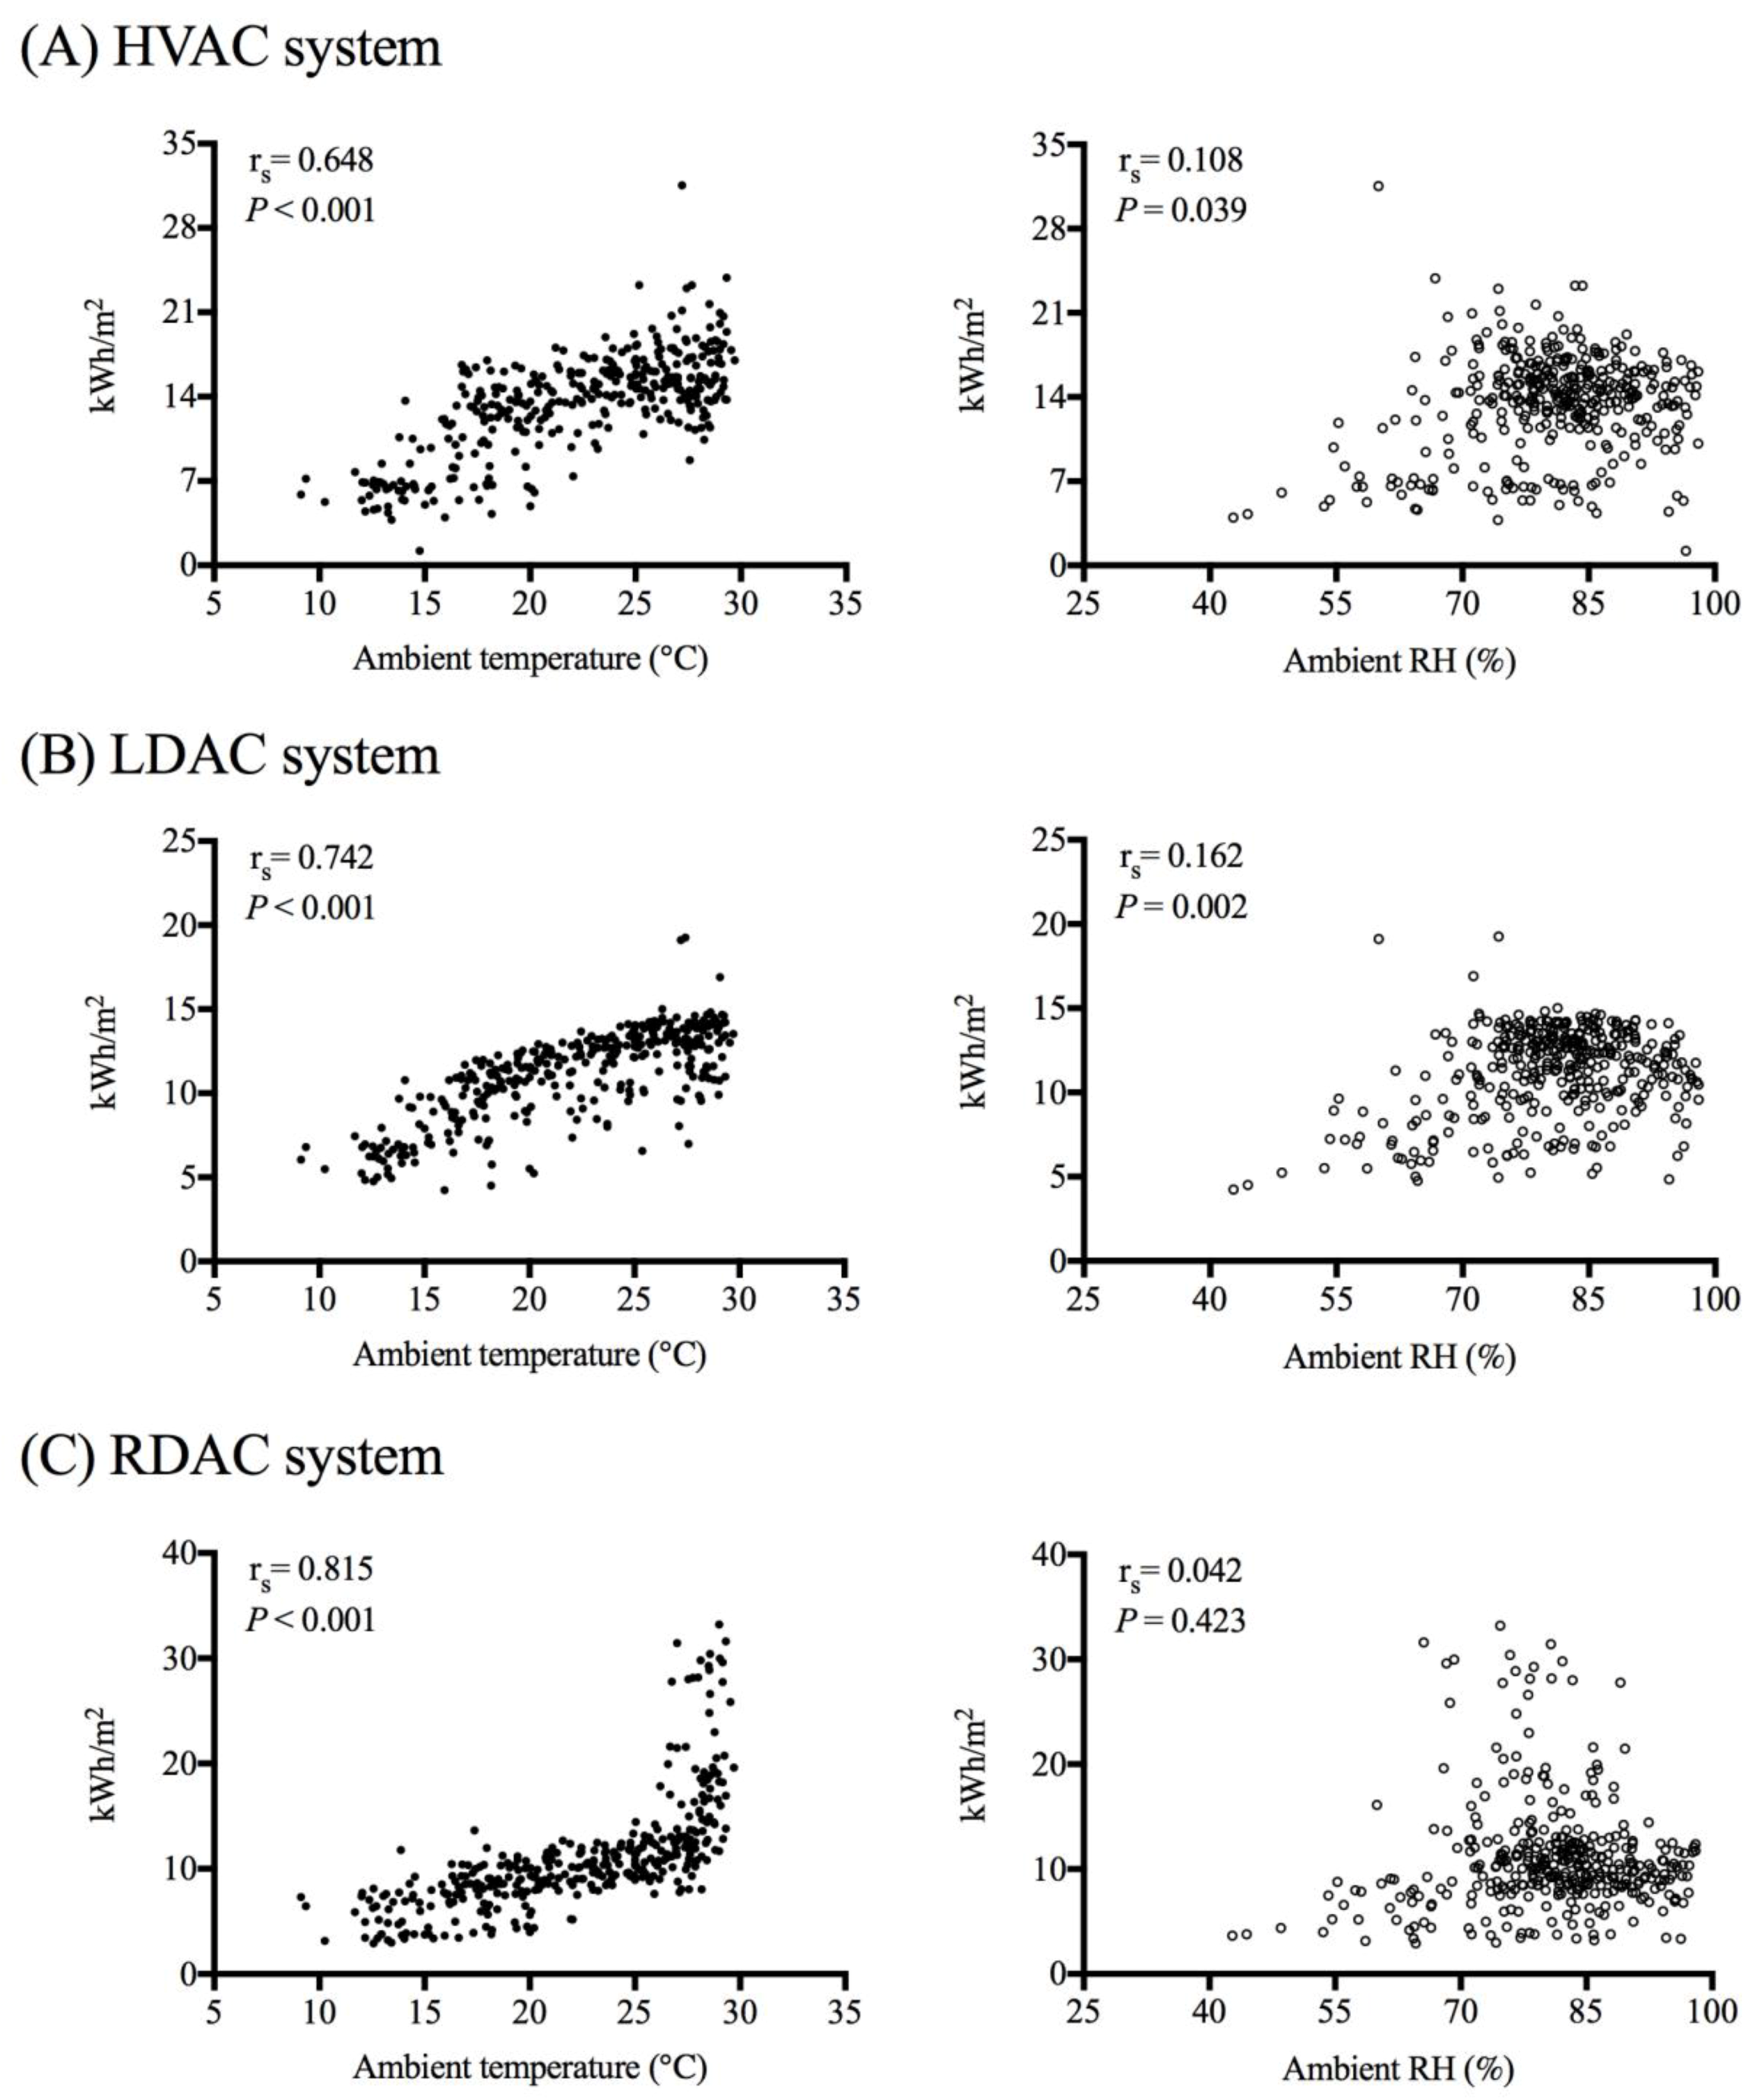
As shown in Figure 3, the daily ambient temperature had moderate to strong associations with the daily total energy consumption of the conventional HVAC system (rs = 0.648, p < 0.001, Figure 3A), LDAC system (rs = 0.742, p < 0.001, Figure 3B), and RDAC system (rs = 0.815, p < 0.001, Figure 3C). Furthermore, the daily total energy consumption of the conventional HVAC system (rs = 0.108, p = 0.039, Figure 3A) and the LDAC system (rs = 0.162, p = 0.002, Figure 3B) had a very weak association with the daily ambient RH level. The regression analysis showed that the increase in ambient temperature led to a significant increase in the log-transformed daily total energy consumption in the ORs (HVAC system: regression coefficient [β1] = 0.044, p < 0.001; LDAC system: β1 = 0.017, p < 0.001; RDAC system: β1 = 0.029, p < 0.001). Additionally, an increased ambient RH caused an increased log-transformed daily total energy consumption in the OR that was using the LDAC system (β1 = 0.004, p = 0.002).

4. Discussion

Energy is usually wasted in the subcooling and reheating process in the traditional air conditioning system. The energy recovery wheel integrated system consumed 17.24% less energy than the simple reheat air conditioning system [3]. The primary energy saving of the desiccant-based wheel HVAC systems was up to 20%–25% compared to the conventional HVAC systems when considering the value of chillers with different energy efficiency ratios [25]. The proposed innovative concentrating photovoltaic and thermal system with a desiccant cooling system allowed greater energy savings (74%) in the primary energy required than the conventional system [26]. Our analytical results show that the daily total energy consumption of RDAC system was similar to that of the energy recovery wheel integrated system and less than that of the conventional HVAC system, which was a simple cooling and reheating air conditioning system [25]. Our results indicate that RDAC systems are more energy efficient than either conventional HVAC or LDAC systems. In the past, Thomas has recommended immediately improving the operating efficiency of the chilled water unit in an air conditioning system if it exceeded 1 kWh/RT [27]. The operating efficiency of the chilled water unit of all three systems in this study was 0.85 kWh/RT, indicating good equipment quality. In this study, the volume occupied by the RDAC system was the lowest, followed by the conventional HVAC and LDAC systems. As both the RDAC and LDAC systems could meet air quality requirements while achieving energy-saving goals, replacing LDAC systems with RDAC systems would conserve space, which is often an important consideration in hospital infrastructure. Additionally, this study found that the median daily energy consumption of the fan, heat pump, and other equipment in the LDAC system was the highest, followed by the conventional HVAC system and the RDAC system. A possible reason was to have additionally configured in series with the AHU in the LDAC system.
To maintain the necessary degree of cleanliness in ORs, ASHRAE/ASHE recommends that the ventilation frequency should be maintained at 20 ACH or above, much higher than the ventilation rates (2–15 ACH) elsewhere in hospitals, and the air conditioning system must be equipped with two filter banks including the first minimum efficiency reporting value (MERV) (7) and the second MERV (14) to ensure the cleanliness of the OR [5]. Besides, the ASHRAE/ASHE Standard 170 indicated that the minimum recommended ventilation frequency of external air is 4 ACH, twice the external air exchange frequency of 2 ACH in other spaces within hospitals [5]. OR temperatures must be carefully controlled as overly high temperatures can cause medical personnel to sweat (which is not conducive to infection control) while too-low temperatures can cause patients undergoing long surgeries to suffer body temperature loss [28,29]. Most building codes have strict requirements on RH levels as aquatic bacteria such as Legionella spp. are less likely to survive below 35% RH, while many non-bacterial species, such as fungi and viruses, thrive in high humidity environments [30]. In Taiwan, the energy consumption of air conditioning systems accounts for 48%–55% of the total energy consumption in medium and large-sized hospitals [31]. Since Taiwan is located in a subtropical region with a damp-heat climate, Taiwanese hospitals have a particular need to reduce their air conditioning energy consumption while maintaining their ORs’ thermal–hygrometric and air quality requirements.
The temperature and RH levels of the RDAC and LDAC systems were more in line with the ASHRAE/ASHE Standard 170 (temperature 20–24 °C, RH 20%–60%) [5], and both met the French RH standard (<65%) set in 2003 [32]. Although the RH level of the conventional HVAC system exceeded these standards, this did not affect the measured airborne bacterial concentrations, similar to the results of Wan et al. [33]. The three air conditioning systems were different in the air conditioning thermal load. Furthermore, the dew point temperature in the conventional HVAC system cannot be lower than the temperature of the chilled coils unit, limiting the system’s efficiency. However, RDAC systems can successfully break this barrier as they are integrated into a solid dehumidification system. In general, RDAC systems need to be installed with regenerative heating equipment [34,35,36]. The system studied here was made of activated alumina, a hygroscopic material that can be regenerated even if the temperature is reduced to 23.9 °C and has a strong affinity for water vapor in a high RH environment. The efficiency of the moisture-absorbing material in this system can also be regenerated by the return air of the air conditioning system and it is more energy efficient (20%–25% energy reduction) with regard to regeneration than other materials that generally need to be heated above 60 °C [16]. In our study, the ambient temperature had a significant influence on the total energy consumption of conventional HVAC, LDAC, and RDAC systems. Therefore, choosing an energy-saving dehumidification air conditioning system for ORs is very important, especially in the subtropical region of Taiwan.
In this study, the median concentration of PM≥0.5 in all three dehumidification air conditioning systems met the ISO 14644-1 Class 7 standard (median concentration of PM≥0.5 lower than 3.52 × 10⁵ particles/m3, or 352 particles/L) [37]. Meanwhile, the airborne bacterial concentration in the operating areas and surrounding areas met China’s GB50333-2013 standard (concentrations in operating areas of <75 CFU/m3 and in surrounding areas of <150 CFU/m3) [29], but it did not meet the UK standards for an OR at rest (35 CFU/m3) [38]. Therefore, more studies are necessary to assess the concentration distribution and influencing factors of airborne bacteria in Taiwanese ORs. We observed no correlation between indoor temperature and airborne bacterial concentration, differing from Fu Shaw et al. We found no significant correlation between RH and airborne bacterial concentration, but according to the suggestion of the ASHRAE/ASHE Standard 170, the RH level should be carefully controlled to prevent the risk of microbial growth [5]. The RH levels in the LDAC and RDAC systems were positively correlated with the suspended particulate concentrations, while no correlation was found for the conventional HVAC system. According to Wang’s findings, this shows that the air-handling processors with LiCl solution had an obvious filtration efficiency for PM5 [39]. This study found that there was no correlation between airborne bacterial concentration and particle concentration in ORs using HVAC systems. This result was similar to a French study [40]. This study dealt with a limited number of ORs with different dehumidification air conditioning systems; thus, increasing the sample size should be considered in further studies. Overall, our results suggest that hospitals should regularly assess the efficiency of their dehumidification air conditioning systems to maintain satisfactory indoor thermal–hygrometric conditions and air quality and achieve energy conservation.

5. Conclusions

Hospital ORs need much higher ventilation frequency and more carefully controlled indoor temperatures and RH than other areas of hospitals. The PM≥0.5 and airborne bacterial concentrations in the ORs at rest achieved by all three systems met both the ISO and Chinese standards. The total energy consumption of the RDAC system was the lowest, followed by the LDAC system and the conventional HVAC system. The ambient air temperature was significantly associated with the total energy consumption of the different dehumidification air conditioning systems in the ORs. The increase in ambient temperature can significantly predict an increased log-transformed daily total energy consumption in the ORs with different dehumidification air conditioning systems. The ambient RH was also an important predictor of the log-transformed daily total energy consumption in the OR that was using the LDAC system.

Author Contributions

Conceptualization, T.-Y.C. and G.-H.W.; Methodology, C.-C.L. and G.-H.W.; Formal Analysis, T.-Y.C., C.-T.C. and F.-J.W.; Investigation, F.-J.W. and C.-T.C.; Visualization, T.-H.P.; Writing—Original Draft Preparation, F.-J.W., C.-T.C. and G.-H.W.; Writing—Review & Editing, T.-H.P. and G.-H.W.; Project Administration, T.-Y.C.; Funding Acquisition, T.-Y.C. and G.-H.W. All authors have read and agreed to the published version of the manuscript.

Funding

This research was funded by Chang Gung Medical Foundation, Taiwan, grant numbers BMRP441 and CORPG3D0042 and the APC was funded by Chang Gung Medical Foundation, Taiwan.

Conflicts of Interest

All authors declare no conflicts of interest relevant to this article.

Abbreviations

The following abbreviations are used in this manuscript:
ACHair changes per hour
AHUair-handling unit
CFUcolony forming unit
CO2carbon dioxide
CSACanadian Standards Association
EIAEnergy Information Administration
FGIFacility Guidelines Institute
HEPAhigh-efficiency particulate air
HVACheating, ventilation, and air conditioning
LDACliquid desiccant air conditioning
LPMliter per minute
LiCllithium chloride
MERVminimum efficiency reporting value
ORsoperating rooms
PMsparticulate matters
RTrefrigeration ton
RDACrotary desiccant air conditioning
RHrelative humidity
TSAtryptic soy agar

References

  1. Magill, S.S.; Edwards, J.R.; Bamberg, W.; Beldavs, Z.G.; Dumyati, G.; Kainer, M.A.; Lynfield, R.; Maloney, M.; McAllister-Hollod, L.; Nadle, J.; et al. Multistate point-prevalence survey of health care-associated infections. N. Engl. J. Med. 2014, 370, 1198–1208. [Google Scholar] [CrossRef] [PubMed] [Green Version]
  2. CDC (Centers for Disease Control), Guideline for Prevention of Surgical Site Infection. 1999. Available online: https://www.cdc.gov/hai/pdfs/SSIguidelines.pdf (accessed on 5 July 2018).
  3. Yau, Y.H.; Ng, W.K. A comparison study on energy savings and fungus growth control using heat recovery devices in a modern tropical operating theatre. Energy Convers. Manag. 2011, 52, 1850–1860. [Google Scholar] [CrossRef]
  4. Kelkar, U.; Bal, A.M.; Kulkarni, S. Fungal contamination of air conditioning units in operating theatres in India. J. Hosp. Infect. 2005, 60, 81–84. [Google Scholar] [CrossRef] [PubMed]
  5. American Society of Heating, Refrigerating and Air-Conditioning Engineers. ANSI/ASHRAE/ASHE Standard 170-2017: ASHRAE/ASHE Standard Ventilation of Health Care Facilities; Society of Heating, Refrigerating and Air-Conditioning Engineers (ASHRAE): Atlanta, GA, USA, 2017. [Google Scholar]
  6. Burril, G.D.; Snell, R.; Bagworth, S.; Belanger, R.J.; Bogdan, S.; Bonavota, D.; Carson, W.D.; Dixon, R.; Drolet, C.; Ellinas, L.; et al. Special Requirements for Heating, Ventilation and Air-Conditioning (HVAC) Systems in Health Care Facilities; CSA Standard: Z317.2-15; Canadian Standards Association: Toronto, ON, Canada, 2015. [Google Scholar]
  7. The Facilities Guidelines Institute. Facilities Guidelines Institute Status Update: Guidelines for Design and Construction of Health Care Facilities. 2018. Available online: http://www.fgiguidelines.org (accessed on 5 September 2019).
  8. Vellei, M.; Herrera, M.; Fosas, D.; Natarajan, S. The influence of relative humidity on adaptive thermal comfort. Build. Environ. 2017, 124, 171–185. [Google Scholar] [CrossRef]
  9. Fu Shaw, L.; Chen, I.H.; Chen, C.S.; Wu, H.H.; Lai, L.S.; Chen, Y.Y.; Wang, F. Factors influencing microbial colonies in the air of operating rooms. BMC Infect. Dis. 2018, 18, 4. [Google Scholar] [CrossRef] [Green Version]
  10. Yufeng, Z.; Zhaoji, W.; Mingyang, Z.; Jinbo, M.; Ling, J.; Fulin, W. Smart indoor humidity and condensation control in the spring in hot-humid areas. Build. Environ. 2018, 135, 42–45. [Google Scholar]
  11. American Society of Heating, Refrigerating and Air-Conditioning Engineers (ASHRAE). HVAC Design Manual for Hospitals and Clinics; American Society of Heating, Refrigerating and Air-Conditioning Engineers (ASHRAE): Atlanta, GA, USA, 2013. [Google Scholar]
  12. ASHRAE (American Society of Heating, Refrigerating and Air-Conditioning Engineers). Heating, Ventilating, and Air-Conditioning Systems and Equipment; SI Ed.; American: Atlanta, GA, USA, 2012. [Google Scholar]
  13. Goetzler, W.; Zogg, R.; Young, J.; Johnson, C. Energy Savings Potential and RD&D Opportunities for Non-Vapor-Compression HVAC Technologies; Technical Report for Energy Efficiency and Renewable Energy: Washington, DC, USA, 2014. [Google Scholar]
  14. Mei, L.; Dai, Y.J. A technical review on use of liquid-desiccant dehumidification for air-conditioning application. Renew. Sustain. Energy Rev. 2008, 12, 662–689. [Google Scholar] [CrossRef]
  15. Fu, H.X.; Liu, X.H. Review of the impact of liquid desiccant dehumidification on indoor air quality. Build. Environ. 2017, 116, 158–172. [Google Scholar] [CrossRef]
  16. TRANE. CDQ™ Desiccant Dehumidification. 2019. Available online: https://www.trane.com/content/dam/Trane/Commercial/global/products-systems/equipment/air-handling/air-handler-options/CLCH-PRB020-EN_1110_CDQ_EB.pdf (accessed on 15 April 2019).
  17. Slayzak, S.J.; Anderson, R.S.; Judkoff, R.D.; Blake, D.M.; Vinzant, T.B.; Ryan, J.P. Using Liquid Desiccant as a Regenerable Filter for Capturing and Deactivating Contaminants. U.S. Patent 7,306,650, 11 December 2007. [Google Scholar]
  18. Dai, Y.J.; Li, Y.; Wang, R.Z.; Ge, T.S. Technical development of rotary desiccant dehumidification and air conditioning: A review. Renew. Sustain. Energy Rev. 2010, 14, 130–147. [Google Scholar] [CrossRef]
  19. Gormley, T.; Markel, T.A.; Jones, H.; Greeley, D.; Ostojic, J.; Clarke, J.H.; Abkowitz, M.; Wagner, J. Cost-benefit analysis of different air change rates in an operating room environment. Am. J. Infect. Control 2017, 45, 1318–1323. [Google Scholar] [CrossRef]
  20. Cubí Montanyà, E.; Salom Tormo, J.; Garrido Soriano, N. Indoor environmental quality and infection control in surgery rooms: Code requirements vs performance motivation. A critical review. HvacR Res. 2014, 20, 643–654. [Google Scholar] [CrossRef]
  21. Constantinos, A.B.; Elena, D.; Athina, G. HVAC and indoor thermal conditions in hospital operating rooms. Energy Build. 2007, 39, 454–470. [Google Scholar] [CrossRef]
  22. Goetzler, W.; Shandross, R.; Young, J.; Petritchenko, O.; Ringo, D.; McClive, S. Energy Savings Potential and RD&D Opportunities for Commercial Building HVAC Systems (No. DOE/EE-1703); Navigant Consulting: Burlington, MA, USA, 2017. [Google Scholar]
  23. Ozyogurtcu, G.; Mobedi, M.; Ozerdem, B. Economical assessment of different HVAC systems for an operating room: Case study for different Turkish climate regions. Energy Build. 2011, 43, 1536–1543. [Google Scholar] [CrossRef] [Green Version]
  24. Macher, J.M. Positive-hole correction of multiple-jet impactors for collecting viable microorganisms. Am. Ind. Hyg. Assoc. J. 1989, 50, 561–568. [Google Scholar] [CrossRef]
  25. Angrisani, G.; Minichiello, F.; Sasso, M. Improvements of an unconventional desiccant air conditioning system based on experimental investigations. Energy Convers. Manag. 2016, 112, 423–434. [Google Scholar] [CrossRef] [Green Version]
  26. Renno, C.; D’Agostino, D.; Minichiello, F.; Petito, F.; Balen, I. Performance analysis of a CPV/T-DC integrated system adopted for the energy requirements of a supermarket. Appl. Therm. Eng. 2019, 25, 231–248. [Google Scholar] [CrossRef]
  27. Thomas, H. All-Variable Speed Centrifugal Chiller Plants. Ashrae J. 2001, 43, 43–53. [Google Scholar]
  28. Katz, J.D. Control of the Environment in the Operating Room. Anesth. Analg. 2017, 125, 1214–1218. [Google Scholar] [CrossRef]
  29. NHFPC (National Health and Family Planning Commission of China). Architectural Technical Code for Hospital Clean Operating Department GB50333-2013. 2013. Available online: http://www.sdnicc.com/UploadFile/file/20140716/20140716141216_3410.pdf (accessed on 5 July 2018).
  30. Al-Benna, S. Infection control in operating theatres. J. Perioper. Pract. 2012, 22, 318–322. [Google Scholar] [CrossRef]
  31. Bureau of Energy, Ministry of Economic Affairs, R.O.C. Hospital Energy Conservation Technical Manual. 2016. Available online: http://www.ecct.org.tw/ReadFile/?p=Knowledge&n=dd74e7eb-05c4-45d5-a65c-c0bd58f34a3b.pdf (accessed on 23 March 2019).
  32. L’ASPEC. NF S 90351: Quels changements 2003–2013. 2013. Available online: http://aspec.fr/wp-content/uploads/tableaux_evolution-NF-S-90351-2013-2003.pdf (accessed on 2 July 2019).
  33. Wan, G.H.; Chung, F.F.; Tang, C.S. Long-term surveillance of air quality in medical center operating rooms. Am. J. Infect. Control 2011, 39, 302–308. [Google Scholar] [CrossRef]
  34. Stephen, D.W.; Mark, G.; Roger, R.; Thorsten, S.; Abdullah, G.; Dae-Young, L. Characterization of desiccant wheels with alternative materials at low regeneration temperatures. Int. J. Refrig. 2011, 34, 1786–1789. [Google Scholar] [CrossRef]
  35. Weiwei, L.; Zhiwei, L.; Reinhard, R.; Ye, Y. Energy consumption analysis on a dedicated outdoor air system with rotary desiccant wheel. Energy 2007, 32, 1749–1760. [Google Scholar]
  36. Mandegari, M.A.; Pahlavanzadeh, H. Introduction of a new definition for effectiveness of desiccant wheels. Energy 2009, 34, 797–803. [Google Scholar] [CrossRef]
  37. ISO (International Organization for Standardization). Cleanrooms and Associated Controlled Environments. Part 1: Classification of Air Cleanliness by Particle Concentration; ISO standard 14644-1:1999; International Organization for Standardization: Geneva, Switzerland, 2015. [Google Scholar]
  38. The Stationery Office. Department of Health/Estates and Facilities Division. Health Technical Memorandum 03-01: Specialised Ventilation for Healthcare Premises: Part A—Design and Installation. 2007. Available online: https://assets.publishing.service.gov.uk/government/uploads/system/uploads/attachment_data/file/144029/HTM_03-01_Part_A.pdf (accessed on 23 March 2019).
  39. Wang, S.L. Pilot Study of Indoor Air Quality of Liquid Desiccant Air Conditioning. Master’s Thesis, Guangzhou University, Guangzhou, China, 2007. [Google Scholar]
  40. Landrin, A.; Bissery, A.; Kac, G. Monitoring air sampling in operating theatres: Can particle counting replace microbiological sampling? J. Hosp. Infect. 2005, 61, 27–29. [Google Scholar] [CrossRef] [PubMed]
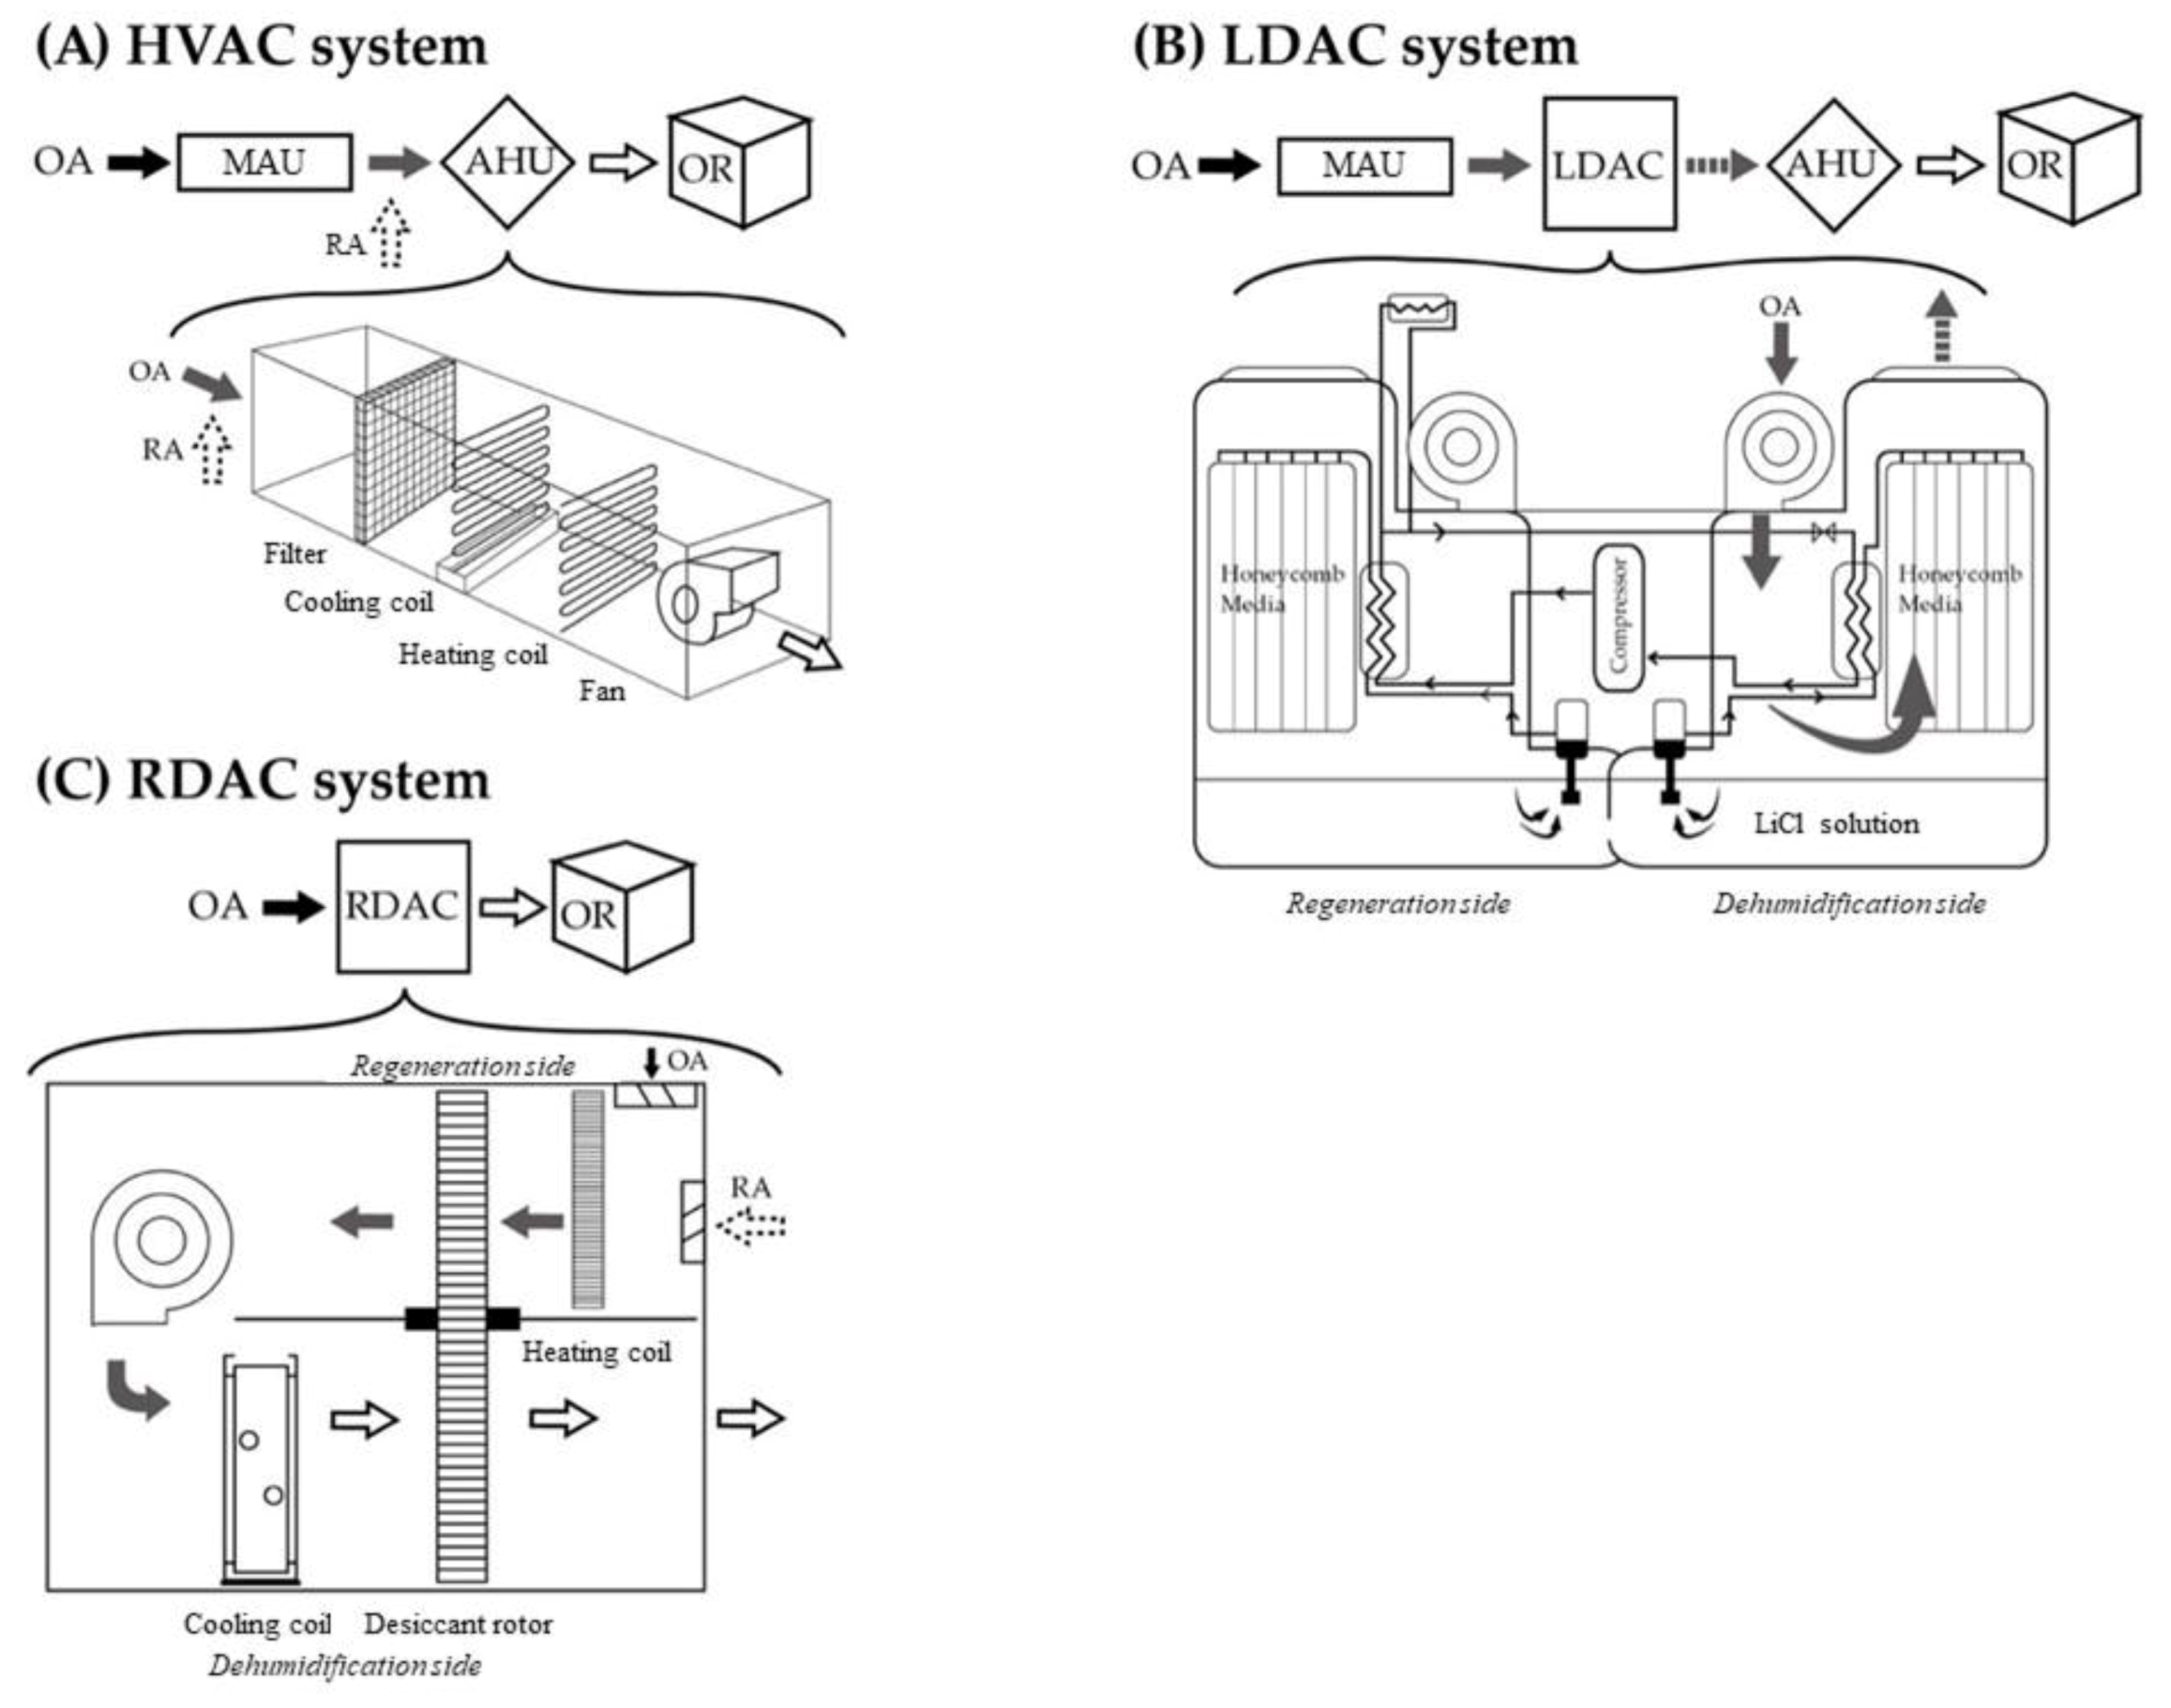
Figure 1. Design diagram of conventional heating, ventilation, and air conditioning (HVAC) (A), liquid desiccant air conditioning (LDAC) (B), and rotary desiccant air conditioning (RDAC) (C) systems. OA: outdoor air, RA: return air, MAU: make-up air unit, AHU: air-handling unit, OR: operating room.
Applsci 10 03721 g001
Figure 2. Daily energy consumption in HVAC, LDAC, and RDAC systems. †: compared to HVAC system, p < 0.01; ‡: compared to LDAC system, p < 0.01.
Applsci 10 03721 g002
Figure 3. Association between daily ambient temperature/RH and daily total energy consumptions of HVAC (A), LDAC (B), and RDAC (C) systems.
Applsci 10 03721 g003
Table 1. Indoor thermal–hygrometric conditions and air quality of the operating rooms with different dehumidification air conditioning systems.
AC SystemsHVAC SystemLDAC SystemRDAC Systemp Value
Parameters
MeanMedian25–75 percentilesMeanMedian25–75 percentilesMeanMedian25–75 percentiles
Temperature, °C19.7319.68(19.40–20.01)19.4419.44(18.74–19.79) 20.5120.40(19.93–20.83) †,‡<0.001
RH, %65.1466.73(62.99–67.85)59.7860.84(59.44–62.68) 55.9060.49(47.96–63.31) <0.001
CO2, ppm344.90 357.51(302.29–383.34)427.49421.20(405.08–440.73) 412.32408.88(401.16–420.46) †,‡<0.001
PM≥0.5, particles/L161.22 101.53(31.60–173.89)146.0088.08(12.71–172.95)107.091.33(11.12–48.60) †,‡<0.001
PM10, μg/m31.310.58(0.28–1.76)0.980.68(0.10–1.00)0.530.14(0.06–0.33) †,‡<0.001
PM2.5, μg/m30.46 0.31(0.12–0.56)0.350.33(0.07–0.50)0.400.07(0.04–0.15) †,‡<0.001
PM1, μg/m30.21 0.12(0.01–0.20)0.150.13(0.01–0.24)0.330.01(0–0.02) †,‡<0.001
Airborne bacteria, CFU/m3
Operating area109.7150.75(24.98–69.38)133.1756.42(35.44–110.86)50.0138.26(32.54–79.90)0.671
Surrounding area154.13 112.87(43.73–219.75)152.5083.51(49.29–121.84)104.6759.80(45.45–167.43)0.887
: compared to HVAC system, p < 0.01. : compared to LDAC system, p < 0.05. HVAC system: heating, ventilating, and air conditioning system: LDAC system: liquid desiccant air conditioning system; RDAC system: rotary desiccant air conditioning system.
Table 2. Associations of indoor thermal–hygrometric conditions and air quality indices in the ORs with different dehumidification air conditioning systems.
(1)(2)(3)(4)(5)(6)(7)(8)
HVAC system
  (1) Temperature1
  (2) RH−0.624 **1
  (3) CO20.468 **−0.769 **1
  (4) PM≥0.5−0.0360.232−0.1231
  (5) PM100.0300.165−0.0930.965 **1
  (6) PM2.50.0020.197−0.1450.981 **0.974 **1
  (7) PM10.0020.182−0.2360.862 **0.793 **0.888 **1
  (8) Airborne bacteria−0.2190.467−0.685 *0.5760.3210.5230.5711
LDAC system
  (1) Temperature1
  (2) RH−0.732 **1
  (3) CO2−0.521 **0.335 *1
  (4) PM≥0.5−0.0050.2630.1521
  (5) PM10−0.1170.2160.2190.895 **1
  (6) PM2.5−0.1330.321 *0.2820.953 **0.924 **1
  (7) PM1−0.2150.464 **0.349 *0.851 **0.678 **0.843 **1
  (8) Airborne bacteria−0.0060.3580.1640.1270.3210.2000.2011
RDAC system
  (1) Temperature1
  (2) RH−0.629 **1
  (3) CO2−0.228−0.0771
  (4) PM≥0.5−0.407 **0.393 *0.422 **1
  (5) PM10−0.366 *0.380 *0.321 *0.930 **1
  (6) PM2.5−0.392 *0.383 *0.395 *0.954 **0.967 **1
  (7) PM1−0.418 **0.362 *0.345 *0.816 **0.694 **0.786 **1
  (8) Airborne bacteria−0.3330.370−0.1390.5640.779 **0.681 *0.3741
*: p < 0.05, **: p < 0.01. HVAC system: heating, ventilating, and air conditioning system; LDAC system: liquid desiccant air conditioning system; RDAC system: rotary desiccant air conditioning system.