Passive Radio-Frequency Identification Tag-Based Indoor Localization in Multi-Stacking Racks for Warehousing


1
Major in Industrial Quality Engineering, Daegu Haany University, 1 Haanydaero, Gyeongsan, Gyeongsangbuk-do 38610, Korea
2
Global Service Management (GSM), Graduate School of Business, Sogang University, 35 Baekbeom-ro, Mapo-gu, Seoul 04107, Korea
3
Department of Industrial Systems and Management, National University of Singapore, 1 Engineering Drive 2, Singapore 117576, Singapore
*
Author to whom correspondence should be addressed.
Appl. Sci. 2020, 10(10), 3623; https://doi.org/10.3390/app10103623
Submission received: 13 March 2020
/
Revised: 18 May 2020
/
Accepted: 22 May 2020
/
Published: 23 May 2020
(This article belongs to the Special Issue Big Data and AI for Process Innovation in the Industry 4.0 Era)
Abstract
:Radio-frequency identification (RFID) technology-based real-time indoor location awareness has been widely studied. In this paper, a passive RFID-based indoor inventory localization method for small and medium-sized enterprises (SMEs) is proposed to effectively manage their indoor inventory tracking in terms of the multi-stacking racking (MSR). To achieve this, we introduce a concept of reference tags and a calculation of measurement for the distance between the RFID reader and reference tag to improve the accuracy of the item location recognition. To illustrate the efficacy and applicability of the method, an empirical case study that applies it to an electronic device manufacturing company is conducted. It was noted that there was no significant difference in the location awareness rate of the proposed system compared with the existing active RFID-based methods. Also, it is demonstrated that the construction can be relatively inexpensive in terms of identifying the location of the items loaded in MSR and relatively narrow areas using a passive tag. This advantage makes it suitable for SMEs that have issues with large-scale facility investment, applying the method to compare the location difference between the registered location information in the inventory system and the actual location of the item in the rack.
1. Introduction
A location-based service identifies the location of persons or objects through location awareness technology and then provides the necessary information [1]. In general, the Global Positioning System (GPS) is widely used for identifying the location of objects but has a disadvantage in that the location of objects in indoor areas cannot be grasped because the signals cannot reach there from the satellite. Furthermore, the deployment of GPS is expensive in terms of the automated tracking of individual material items [2].
Real-time locating system (RTLS) technology has been used as an alternative in indoor areas for the location-based service. Various technologies, including wireless LAN (IEEE 802.11b or Wi-Fi) [3], radio-frequency identification (RFID) [4], ZigBee [5], ultra-wideband (UWB) [6], infrared rays [7], and ultrasonic waves [8], are utilized for RTLS implementation. Recently, RTLS technology has been widely used for data management and localization in warehousing, where RFID is the most commonly used system for locating the stock [9,10].
RFID is divided into two types, active and passive, depending on whether the tag is capable of reading and writing data and has its own power supply (battery). The active RFID type has the advantages of having its own battery, being capable of bidirectional communication with the RFID reader, and being able to transmit over long distances of over 3 m, whereas its disadvantages include having higher costs than the passive type and a limited operation time (i.e., average from 5 to 10 years) because it has its own battery [11]. Meanwhile, the passive RFID type has the merits of a simple and semi-permanently available structure, because it is powered through the radio signal from the RFID reader, and lower costs, and its disadvantage is its limited communication range because it mainly involves backscattering communication. As the active RFID type can store its own location information and transmit it to the receiver, most studies on RFID technology-based inventory location awareness have focused on the deployment of active RFID for tracking without localization [12,13,14] or tracking with localization [15].
Small and medium-sized enterprises (SMEs) account for 99% of all businesses and for between 50% and 60% of value added. Almost one in three people is employed in a micro firm with fewer than 10 employees and two in three in an SME. In many regions and cities, SMEs have been the main drivers of job creation and often contribute to the identity and social cohesion of local communities [16]. Most SMEs have utilized multi-stacking racking (MSR) capable of multi-stage loading to efficiently manage their warehousing due to the lack of warehouse space and the difficulty in expanding and securing the scale of the warehouse. MSR-based inventory management allows many items to be stored in a narrow space. However, accurately identifying and managing stock locations through warehouse management, which frequently involves changing the stock location in the MSR, can be cumbersome and difficult. Thus, many SMEs desire to introduce a warehouse management system (WMS) that enables effective MSR stock location management. However, the WMS system is out of reach for many SMEs because introducing such a system requires a large amount of financial investment. For this reason, many SMEs have not adopted automated WMS and continue to manually manage their inventory location. Overall, although introducing cutting-edge technology for inventory location management is important for SMEs, more practical methods are needed to effectively manage inventory location information at a low cost.
Most RFID-based indoor location tracking methods have incorporated active RFID, which enables tags to transmit the location information to an RFID reader. However, active RFID is more expensive to deploy and maintain than passive RFID, which can be an issue for many SMEs. Therefore, this study focuses on how SMEs can effectively manage their MSR indoor inventory tracking at a relatively lower cost, with the development of a practical algorithm used in tandem with the proven warehousing technology. To achieve this goal, we propose a passive RFID-based inventory location identification method that involves the introduction of a concept of reference tags, which are used as a reference point in relation to the stock loaded in MSR. To illustrate the efficacy and applicability of the proposed approach, an empirical case study involving an electronics device manufacturing company in South Korea was conducted.
The main contribution of this paper is that it demonstrates how passive RFID can be used by SMEs to identify the location of the stock loaded in MSR as part of a low-cost WMS. To the best of the authors’ knowledge, no research has been conducted on inventory location recognition using passive RFID in terms of narrow warehousing areas incorporating MSR. Although Tesoriero et al. [17] and Montaser and Moselhi [18] presented a low-cost indoor location identification and material tracking methodology for large areas, such as construction projects, using passive RFID, the method was unsuitable for identifying inventory items located in narrow areas with MSR. Of note, this research only provides item location information in terms of where an item is located within the MSR and does not cover the exact location coordinates of the item.
The remainder of the paper is organized as follows. Section 2 outlines the RFID system and describes the RFID-based location recognition methods. Section 3 introduces the MSR item location awareness using the passive RFID type. Section 4 then presents the findings of our study obtained through the practical experimental results. Finally, Section 5 provides the conclusions.
2. Research Background
2.1. Introduction to RFID
RFID is the generic term for information-identifying systems using radio-waves. Unlike the barcode system, RFID identifies tag information through non-contact recognition and is attracting attention as a next-generation technology to replace the barcode system. The RFID system is composed of an interrogator, RFID tags, and a server computer (i.e., middleware). The main purpose of the interrogator is requesting the identification of each tag in the reading area (i.e., recognition area), where the interrogator corresponds to an RFID reader connected with an antenna. The RFID reader connected with an antenna generates radio-waves toward the tags periodically or continuously to scan them and interprets radio-wave signals as meaningful information. This periodicity for generating radio-waves is typically referred to as the recognition interval and is interpreted as how often the RFID reader generates radio-waves to scan the tags for a specific time (times/sec.).
The tag (transponder) is an electronic component that includes an electronic circuit and an ultra-small built-in antenna and can store user-defined information in its mounted circuit, which can then be exchanged through an external antenna. An RFID tag supports a larger set of unique IDs than a barcode and can incorporate additional data, such as manufacturer and product type. Moreover, it can measure environmental factors, such as temperature. The antenna transmits and receives data between the tags and the RFID reader and activates or deactivates the tags by sending a radio signal to them, whereas the server computer processes the data identified by the tags. An RFID system can freely change the tag data and simultaneously recognize a large number of tags, but it cannot be modulated and is reusable [19,20,21].
RFID tags can be divided into two types, passive and active, depending on the power resource requirement. Active tags require a power source, either by being connected to a powered infrastructure or by using energy stored in an integrated battery. One example of an active tag is the transponder attached to an aircraft that identifies its national origin. However, the batteries make the cost, size, and lifetime of active tags impractical for the retail industry. By contrast, the lifetime of a passive tag is limited by the stored energy in relation to the number of read operations the device must undergo. Nonetheless, the passive tag is of interest because it does not require batteries or maintenance, and it also has an indefinite operational life and is small enough to fit onto a practical-sized adhesive label. In sum, the active tag has its own built-in power resource, which allows for its own processing and for being distanced from the RFID reader, but the operation time of the power resource is limited and the cost is high. Meanwhile, the passive tag is operated by the electric field from the antenna without the need for a direct power supply, which is advantageous, as the lifespan is semi-permanent, and the cost is lower than that of the active tag. However, its recognition distance is short. Of note, this research defines the RFID active type in terms of active tag-utilizing systems and the RFID passive type in terms of passive tag-utilizing systems to avoid any confusion.
The tags are classified into low frequency, high frequency, ultra-high microwave, and microwave depending on the radio-frequency band. The tags have been applied to various fields depending on their radio-frequency band. For example, 125 and 134 kHz tags are used in livestock product distribution management, process automation, and access cards, whereas 13.56 MHz tags are used for transportation and credit cards. Meanwhile, 433.92 MHz tags are classified as active tags and are usually applied to container terminals and real-time location tracking systems, whereas 860–960 MHz tags are applied to logistics distribution and material and process management and have a wide range of uses at low cost. Finally, 2.45 GHz tags are used to prevent passport counterfeiting. In this study, a 900 MHz tag is used because warehouse management targets the location recognition of inventory items.
2.2. RFID-Based Indoor Location Identification Methods
To identify the location of an object using RFID, the following methods are regarded as the most popular: (1) a method using the arrival time of radio waves, (2) a method using the intensity of the signal, and (3) a method of recognizing the zone location. The first of these methods can be classified into time of arrival (TOA) and time difference of arrival (TDOA) [22]. TOA uses active tags and involves an algorithm that calculates the position of the tags using the arrival time of signals transmitted from three or more antennas [23]. TDOA also uses active tags and involves an algorithm that identifies the position of a tag by measuring the arrival time difference among the signals transmitted and received between two or more antennas and the tags. TOA and TDOA have accurate location recognition because they use the arrival time and time difference among the signals between the active tags and each antenna. However, precise time synchronization between the antenna and active tags is required to accurately identify the position of the tags. As a precise measuring device is required for this time synchronization, constructing a system for managing a warehouse where a plurality of item positions must be identified is expensive. For this reason, applying the TOA and TDOA algorithms for identifying the position of the multiple items in the warehouse is costly [24].
The main advantages of active RFID are that the tag has a built-in power source and can store its own location information and then transmit it to the RFID reader. Therefore, active RFID-based localization systems (LSs) have been researched in terms of various applications [25,26,27,28,29,30]. The method involving the intensity of the signal is based on the principle that the intensity of the signal between the active tag and antenna becomes weaker as the distance between the tag and antenna increases. Washington University in the United States proposed a method known as “SpotON” to calculate the distance between the antenna and tag based on the intensity of the signal between the two apparatus [31]. LANDMARC [13] is the most common active RFID-based localization system, which uses the concept of a reference tag to determine the position of a tag using the distance between the former and the latter. There are several variations of LANDMARC such as [32] and [33]. Sue et al. [32] applied the LANDMARC idea on regional localization instead of coordinates. Jin et al. [33] showed how to reduce the computational overhead with a higher locating accuracy than LANDMARC. However, although these methods are simple to implement, the position information is inaccurate because the intensity of the signal can be easily changed due to the influence of obstacles within the vicinity.
Hahnel et al. [34] proposed the earliest passive RFID-based LS for the location sensing of mobile robots in indoor areas, with the robots equipped with passive RFID antennas and a laser scanner. Elsewhere, Chatopadhyay et al. [35] proposed a passive UHF (Ultra-high frequency) RFID-based indoor LS using a neural network and KNN (K-nearest neighbors) algorithms to predict the location of a tag of interest. Meanwhile, Liu et al. [36] used a mobile RFID reader equipped with cameras with the image-recordable RFID reader service found to provide better location information for specific objects. With the use of a mobile camera for one targeted object, the possible physical location is narrowed down based on multiple images that record various times for the object. For their part, Nemmaluri et al. [37] used a fixed RFID reader within a specific monitoring area. In a smart space, such as an office or home, a system, known as the Sherlock system, focuses on the localization of a human being who has a passive RFID tag. One of the features of this system is that the reader’s antenna sweeps the monitoring area through various panning, tilting, and power-leveling movements to detect an object. Following this, the location of the specific object is estimated by a steerable camera.
DiGiampaolo and Martinelli [38] developed a two-step localization algorithm for a robot that patrols a warehouse and localizes objects on shelves using RFID technology, whereas González et al. [39] presented a method for reading a group of RFID tags among a larger group of tags and showed that the method reduced the number of group readings required to identify the tags, compared with existing methods involving expensive computational time. Elsewhere, Liu et al. [40] proposed a tag searching mechanism for effectively ascertaining a specific tag set time with high accuracy in a large-scale RFID system. Although many studies have suggested methods for tracking the location of objects indoors using passive RFID, our approach enables locating the inventory in narrow spaces incorporating MSR.
3. Inventory Location Identification Framework in MSR
This study aims to provide a comprehensive inventory location identification framework utilizing passive RFID in terms of MSR for low-cost WMSs in SMEs. As shown in Figure 1, the proposed framework consists of two steps, the configuration of the tag information and the identification of the inventory location, which form the backbone of the framework. Step 1 attaches the reference tag to the center of each MSR zone, registers the mapping information between the reference tag and its physical MSR location, and sets up the recognition preferences for improving the accuracy of the inventory location identification (Section 3.1). Step 2 then scans the stock in the MSR, temporarily stores the recognized information in a database, and identifies the inventory location based on the proposed algorithm (Section 3.2).
3.1. Configuration of Tag Information
This step starts by attaching the reference tags to the center of each MSR zone. The reference tag is used as the location recognition identifier with a known location within a predefined physical MSR zone, and the locations of the stock items are identified by referring to their adjacent reference tag’s location. The reference tag has a unique identification code (UID) that provides the location of specific spaces, locating any item in the MSR. Thus, we must know the UID associated with the location area it occupies. To obtain the UID, we must physically assign a UID to the location information of the specific area and implement a mechanism to retrieve this identification. The RFID reader scans the reference tags attached to the MSR and retrieves the UID of the reference tag. This UID is then sent through a wireless communication network to the LS server. The LS server is responsible for mapping the UID to the physical location of the reference tag. To map the reference tag’s UID to the physical location in the MSR, the mapping information for all reference tags should be registered into the database implemented at the LS server in advance. The relationship between the RFID reader and LS is based on a client–server scheme, where the client represents the RFID reader and the server represents the LS where the location information is presented. A Wi-Fi connection is used to communicate the client and the server and is based on the transmission control protocol and Internet protocol suite (TCP–IP). To better understand this, let us suppose that there is an MSR with four zones. When a reference tag with a UID of ee0010 is attached to Zone #1, the mapping information can be defined as {ee0010, Zone 1}. The mapping information is then registered in the database through the LS.
To refer to the reference tag as the location identifier of other stock items, we must adjust the recognition range of the RFID reader. To better understand, let us consider the example shown in Figure 2. When the RFID reader generates radio waves through the connected antenna, the recognizable range of the RFID reader ( or ) depends on the propagation angle ( or ) and intensity that are related to the radio-wave reaching distance ( or ). Generally, the propagation angle and intensity of the RFID reader are slightly different depending on the manufacturer and RFID type. If the propagation angle can be constantly fixed, then the recognizable range may vary depending on the distance between the RFID reader and target of identification ( or ). This study uses a propagation angle control device to artificially fix the wave angles. In Figure 2, let RFID reader 1 and RFID reader 2 have the same propagation angle ( = ), and let RFID reader 1 be closer to the targets of identification (i.e., the tags) than RFID reader 2 ( < ). T is the center distance between two adjacent reference tags. Suppose that the RFID reader can read tags that are reachable regardless of the distance between the reader and a tag, and all the tags are within reader range while T is set to be a constant. The recognition range of RFID reader 1 is smaller than that of RFID reader 2 ( < ). That is, the recognizable range () can be adjusted by varying the distance between the RFID reader and targets () while simultaneously fixing the propagation angle of the RFID reader. Here, we set the measurement distance so that should be approximately less than 2T ( ⪅ 2T) to refer to the reference tag as an identifier. As a result, the measurement distance is more likely to be determined at , rather than , because is less than 2 T in Figure 2.
In terms of geometry, should be approximately less than 2T ( ⪅ 2T) to identify one reference tag. Let be the maximum reachable distance of the radio wave generated from the RFID reader to the target. Again, in terms of geometry, and can be obtained by Equations (1) and (2) based on the triangulation method.
By substituting into , can be summarized as Equation (3), which exactly corresponds with Equation (4) by transferring Rh to the left side. Thus, the measurement distance between the RFID reader and tags is determined to be within Rh. To better understand this function, let us assume that θ is 90° and two reference tags are attached to each MSR zone at 2 m intervals (i.e., T = 2m). The measurement distance is then determined to be within .
3.2. Indentification of Inventory Location
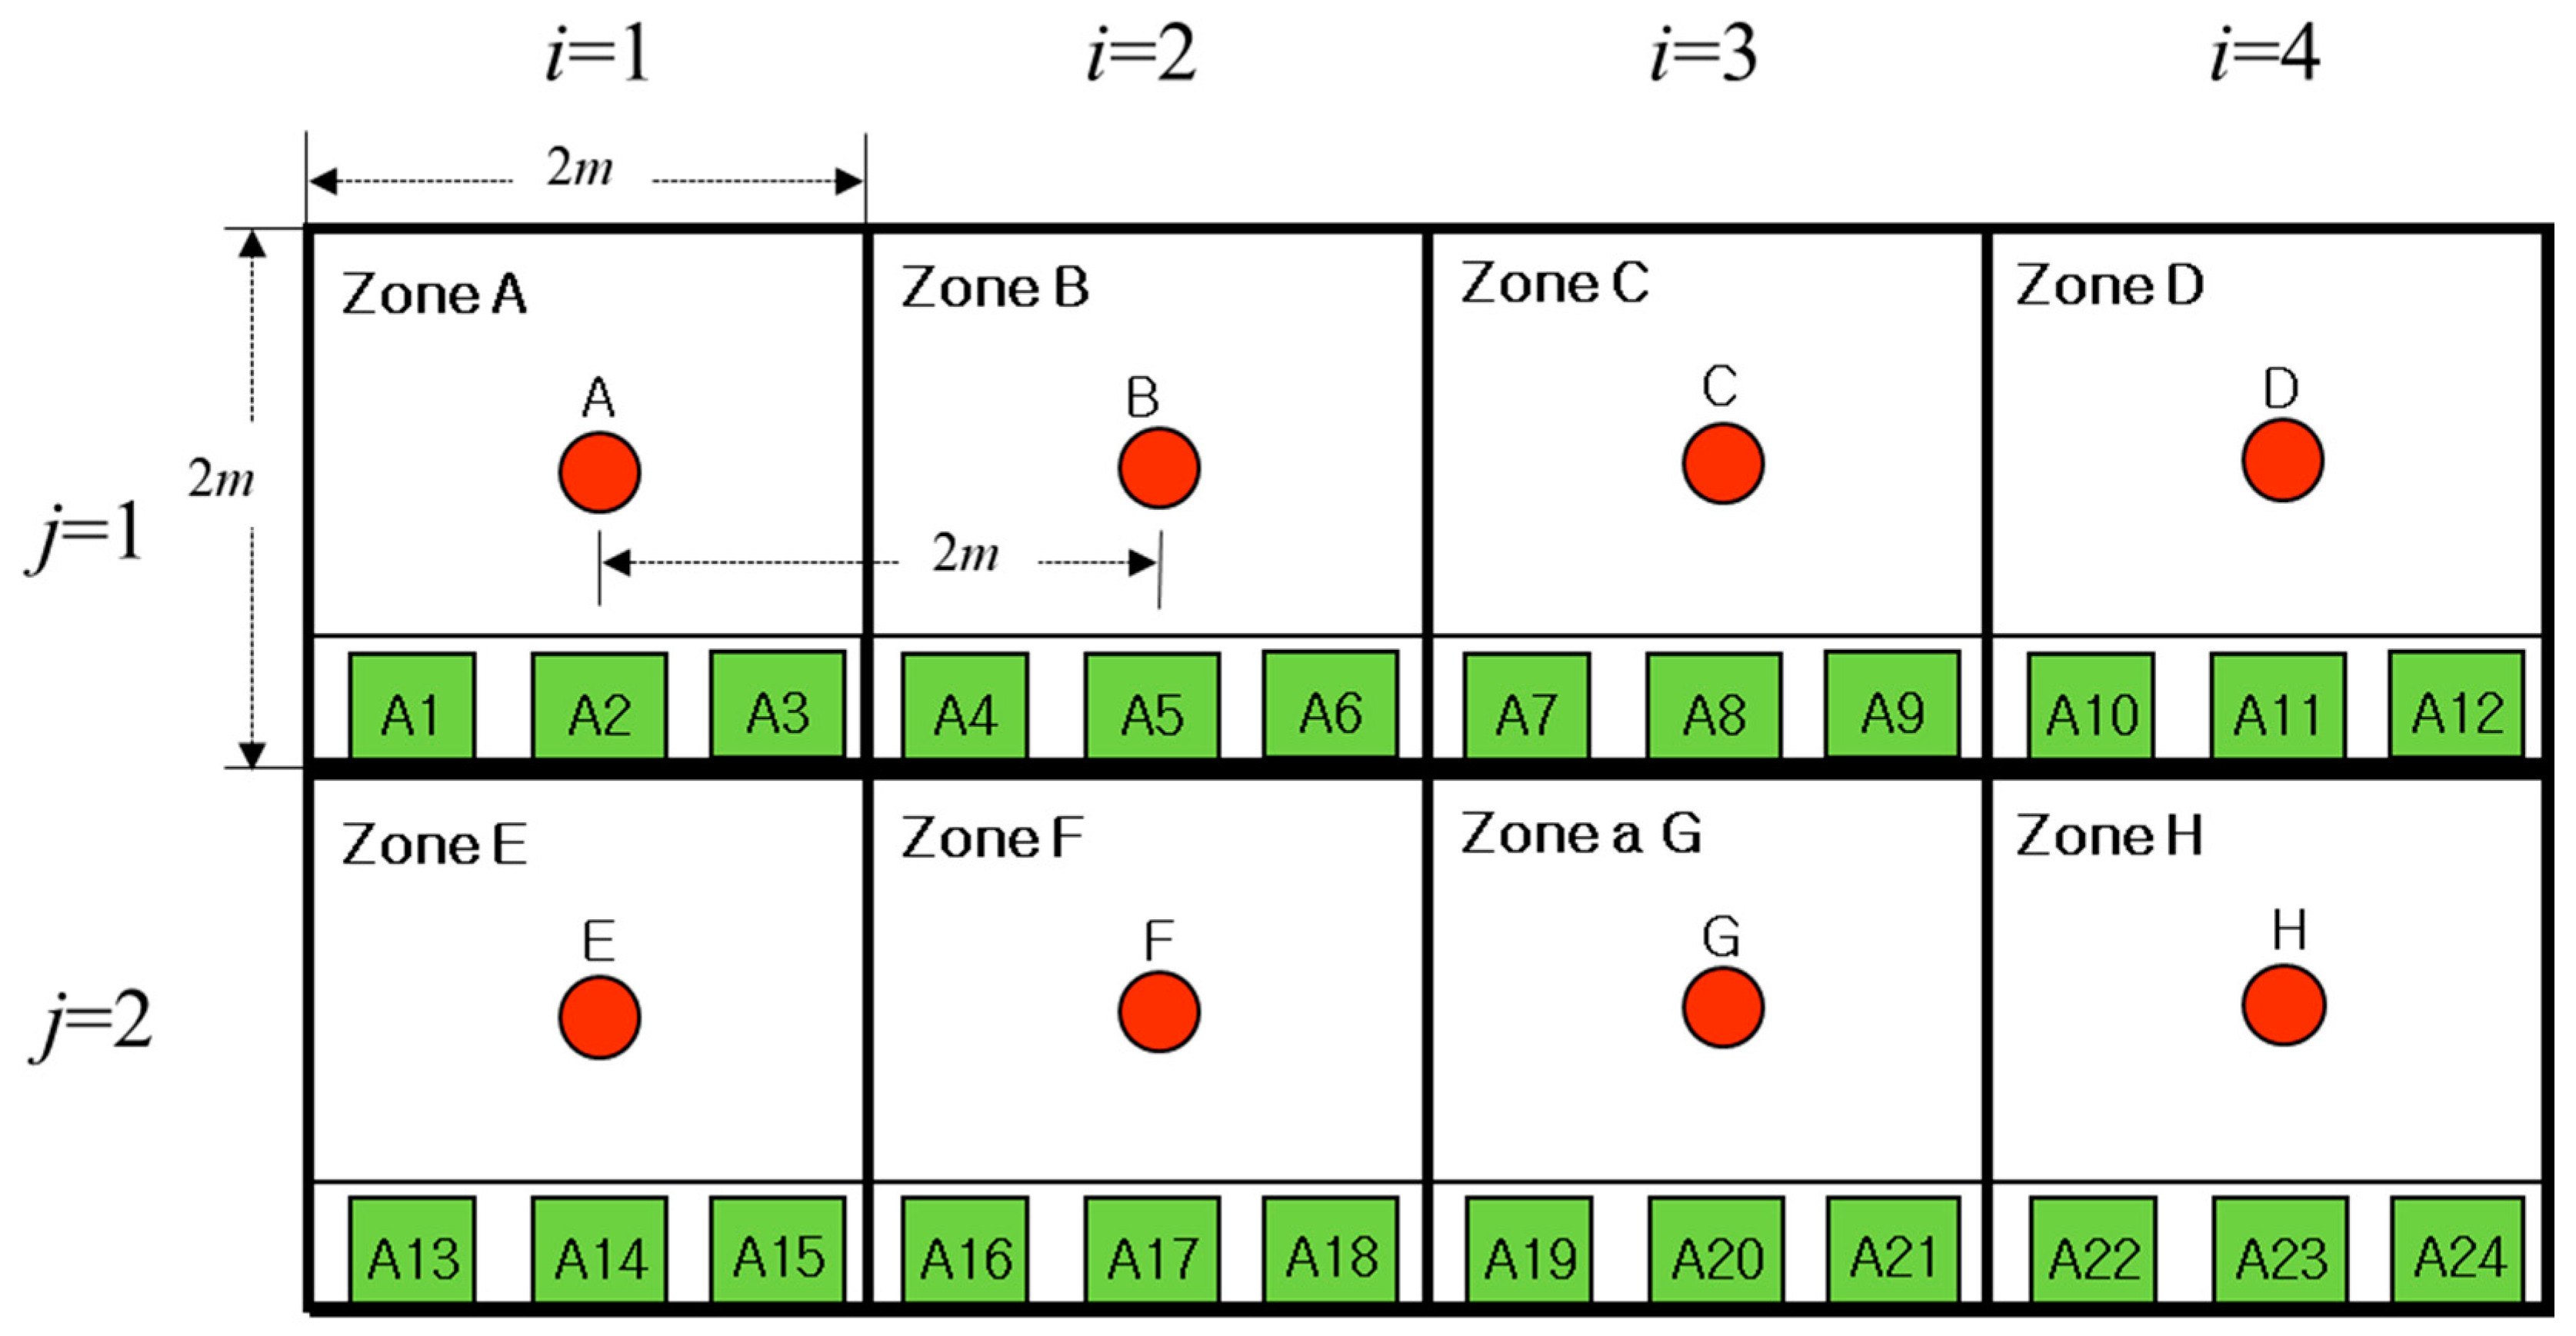
Each stock item has a unique tag, and this study uses tags to denote stock items in the same sense. Once the measurement distance is set, the RFID reader scans the stock from the top-left to the bottom-right of the MSR (the tag scanning sequence of the RFID reader will be described in detail in this section) by moving from one zone to another. Note that the RFID reader looks straight ahead at the target zone and would be positioned perpendicular to the reference tag in each zone when scanning. The RFID reader keeps its predetermined measurement distance when scanning stocks and also keeps a constant recognition speed while moving in zones in order to improve identification accuracy. Figure 3 depicts an example where three stocks are loaded in each MSR zone consisting of i columns and j rows. To improve the accuracy of item location identification, items are loaded on one line within each zone, as shown in Figure 3. denotes the zone of the i-th column and the j-th row in the rack, that is, and denote zones A and B, respectively. The red circles represent the reference tags attached to the center of each zone, and the green rectangle represents the stock item with its unique tag. Reference tags A and B, which are attached to and , respectively, are used as the location identifiers of the stock items {A1, A2, A3} in and the stock items {A4, A5, A6} in , respectively.
The items located in each zone are identified by the following Algorithm 1.
| Algorithm 1. Inventory location identification |
| Index: i: Index of column (i = 1 ,.., I) j: Index of row (j = 1, …, J) N: Number of the item loaded in each zone of the MSR c: Index of the radio-wave generation of the RFID reader in the j-th row (c = 1 ,…, C) Parameters: = A set of recognized tags when the RFID reader generates the c-th radio wave (i.e., the RFID reader performs the c-th scanning) in the j-th row of the rack = A set of recognized tags in which only one reference tag exists among . (Note that only the first recognized has to be selected if there are several ) = [Decision value] A set of identified item locations in Method: Step 1: Set T according to the distance between two adjacent reference tags attached to the MSR. Step 2: Calculate according to Equation (2) and set the measurement distance of the RFID reader within . Step 3: Set the tag recognition interval of the RFID reader, recognizing speed, and Step 4: Set i = 1 and j = 1, scan the tag information of the stock, and distinguish among . Step 5: Set = . Step 6: Exclude the reference tags and from : = − − reference tags. While c = C do{ c = c + 1 Exclude from : − If the number of stocks in = N, then let i = i + 1 and go to Step 5 }. Step 7: If i = I, then let j = j + 1, i = 1, c = 1, and go to Step 5. Stopping rule: If i = I and j = J, then the algorithm terminates. |
In step 4 of the algorithm, the scanning sequence is as follows. As shown in Figure 3, the RFID reader scans the tag information of the stock by visiting zones in sequence from to for the first row with a constant tag recognition speed and interval. If there is no recognizable stock after the RFID reader completes scanning , the RFID reader scans the stock’s tag information for the second row in the same direction (i.e., from to ). The recognized stock tag information is then temporarily stored in the LS database.
To better understand this function, we can illustrate the concrete steps using the example shown in Figure 3. Let us assume that the mapping information of the reference tags is stored in the LS database in advance. As the width of each zone is 2 m, if we attach the reference tags to the center of each zone, then the distance between two adjacent reference tags becomes 2 m (i.e., T = 2 m). According to Equation (4), is calculated as 1 m, that is, the measurement distance of the RFID reader is determined to be within 1 m. Let us then set the tag recognition interval of the RFID reader, recognizing speed, and to 2 times/sec (= 0.5 sec), 1 m/sec, and 90°, respectively. As mentioned in Section 2.1, the recognition interval means the frequency at which the RFID reader generates radio-waves to scan the tag and the recognizing speed means the pace at which the RFID reader travels to scan the tag. The outcomes of recognized stock tags could stem from the combination of the number of reference tags and , displayed in Table 1. If there are several , then only the first recognized has to be considered. Distinguishing among is very important because the former is used to locate the stocks by referring to the mapping information of the reference tag in the same zone. When we distinguish , , , and , as presented in Table 1, , , , and , which have only one reference tag, can be selected. Here, while , , and have only one reference tag, “D” can be considered , the first recognized, and should be selected as . The stock items in each zone are identified based on .
Then, we can substitute into , and exclude the reference tag and , which is an already recognized set of stock, from . For example, {A, A1, A2, A3, A4} of is substituted into , and then is replaced with {A1, A2, A3, A4} by excluding the reference tag A and , which has a null value. Then, we can set c to 1, and increase c by 1 and exclude from , while c equals C. If the number of stock items remaining in is equal to N, then becomes , and the process is repeated on the next column or row. If the location of the stock items in each zone is identified for all rows and columns in the rack, then the algorithm terminates. For example, {A1, A2, A3, A4, A5} of are excluded from {A1, A2, A3, A4, A5} of . The number of stock items remaining in is zero and is smaller than N = 3. Thus, {A, A2, A3, A4, A5, A6, B} of are excluded from {A1, A2, A3, A4, A5} of continuously. As the remaining stock in is {A1} and its number is smaller than N, {B, A3, A4, A5, A6, A7} of are excluded from continuously. As the remaining stock in is {A1, A2} and its number is smaller than N, {B, C, A4, A5, A6, A7, A8} of are excluded from continuously. As {A1, A2, A3} remains in and its number is equal to N, is assigned to . The items in are identified as {A1, A2, A3}; that is, stocks A1, A2, and A3 are located in . Subsequently, to identify the stock in , the reference tag is excluded and {A1, A2, A3} of are preferentially excluded from ; then is {A4, A5, A6, A7}. As the number of stock items in is not equal to N, is excluded from , and the remaining stock in is null. As the number of stock items in is smaller than N, is excluded from , and then the remaining stock in is {A4}. As the number of stock items in is smaller than N, is excluded from , and then the remaining stock in is {A4, A5}. As the number of stock items in is smaller than N, is excluded from , and then the remaining stock in is {A4, A5, A6}. Because the number of items in is equal to N, the stock in is identified as {A4, A5, A6}; that is, stock items A4, A5, and A6 are located in . and are identified in the same way.
4. Experiment and Discussion
To demonstrate the proposed method, we applied it to an electronic device manufacturing company in Busan, South Korea and verified the location awareness of the items in the MSR. The portable XCODE IU9030 RFID reader with a frequency of 900 MHz was used. The XCODE IU9030 has a recognition range of 2–3 m (tag dependent), and the recognition rate is over 10 tags/sec. The air interface protocol supports the EPC Class 1, Gen2, ISO18000-6B, and the corresponding tag is the passive type, operated at a 900 MHz band frequency. The proposed algorithm was implemented by Visual C++ programming language at Visual Studio 2015. We considered an MSR of 216 cm in width and 144 cm in length, consisting of two rows and three columns, and each zone was a 72 × 72 cm square. When we attached the reference tags to the center of each zone, the distance between the adjacent reference tags (T) could be calculated as 72 cm, which is equal to the width of the zone. The propagation angle of the RFID reader () was set at 125°, with aluminum foil placed in front of the RFID reader to fix the propagation angle at this value. As can be seen from many studies, metal and aluminum foils can block propagations. This study attached an aluminum conical structure to the RFID reader with an angle of 125°, as shown in Figure 4, to control the propagation angle of the RFID reader.
The experiment proceeded in two parts. First, we tested the accuracy of the reference tag recognition by checking the recognition of the tags in accordance with the change in measurement distance. In addition, we tested the recognition accuracy in terms of inventory location by changing the number of stock items to be loaded in each zone and the tag recognition interval of the RFID reader. Second, we evaluated and verified the accuracy of the location identification by comparing the locations of the stock items identified by the proposed method with the actual locations. In order to enhance the experiment, we have developed a prototype embedding the proposed algorithm.
4.1. Results for the Accuracy of the Measurement Distance and Inventory Location Recognition
With values of 125° in and 72 cm in T, and were calculated as less than or equal to 1.4 m and 38.06 cm by Equations (3) and (4), respectively; that is, the measurement distance between the RFID reader and the tags should be less than or equal to 38.06 cm. The UIDs for the three reference tags of areas 1-1, 1-2, and 1-3 were e0008f4, 0000617, and f000897, respectively. The experiment aimed to evaluate the recognition accuracy of the reference tag for area 1-2 (UID: 0000617), by means of the RFID reader, when the measurement distance was increased in 5 cm intervals from 20 cm to 60 cm. The MSR layout for the experiment is presented in Figure 5. The tests were replicated 30 times, and the average recognition results are plotted in Figure 6. Only the reference tag of area 1-2 was recognized when the measurement distance was increased from 20 cm to 40 cm. Thus, only the targeted reference tag can be recognized without the recognition of other adjacent reference tags when the measurement distance is set to be less than or equal to 38.06 cm. However, the chance of recognizing the adjacent reference tags is significantly increased when the measurement distance is more than 45 cm. Therefore, this experiment shows that the estimated measurement distance is practically applicable to the identification of the inventory locations of stock items with great recognition rates for passive RFID tags.
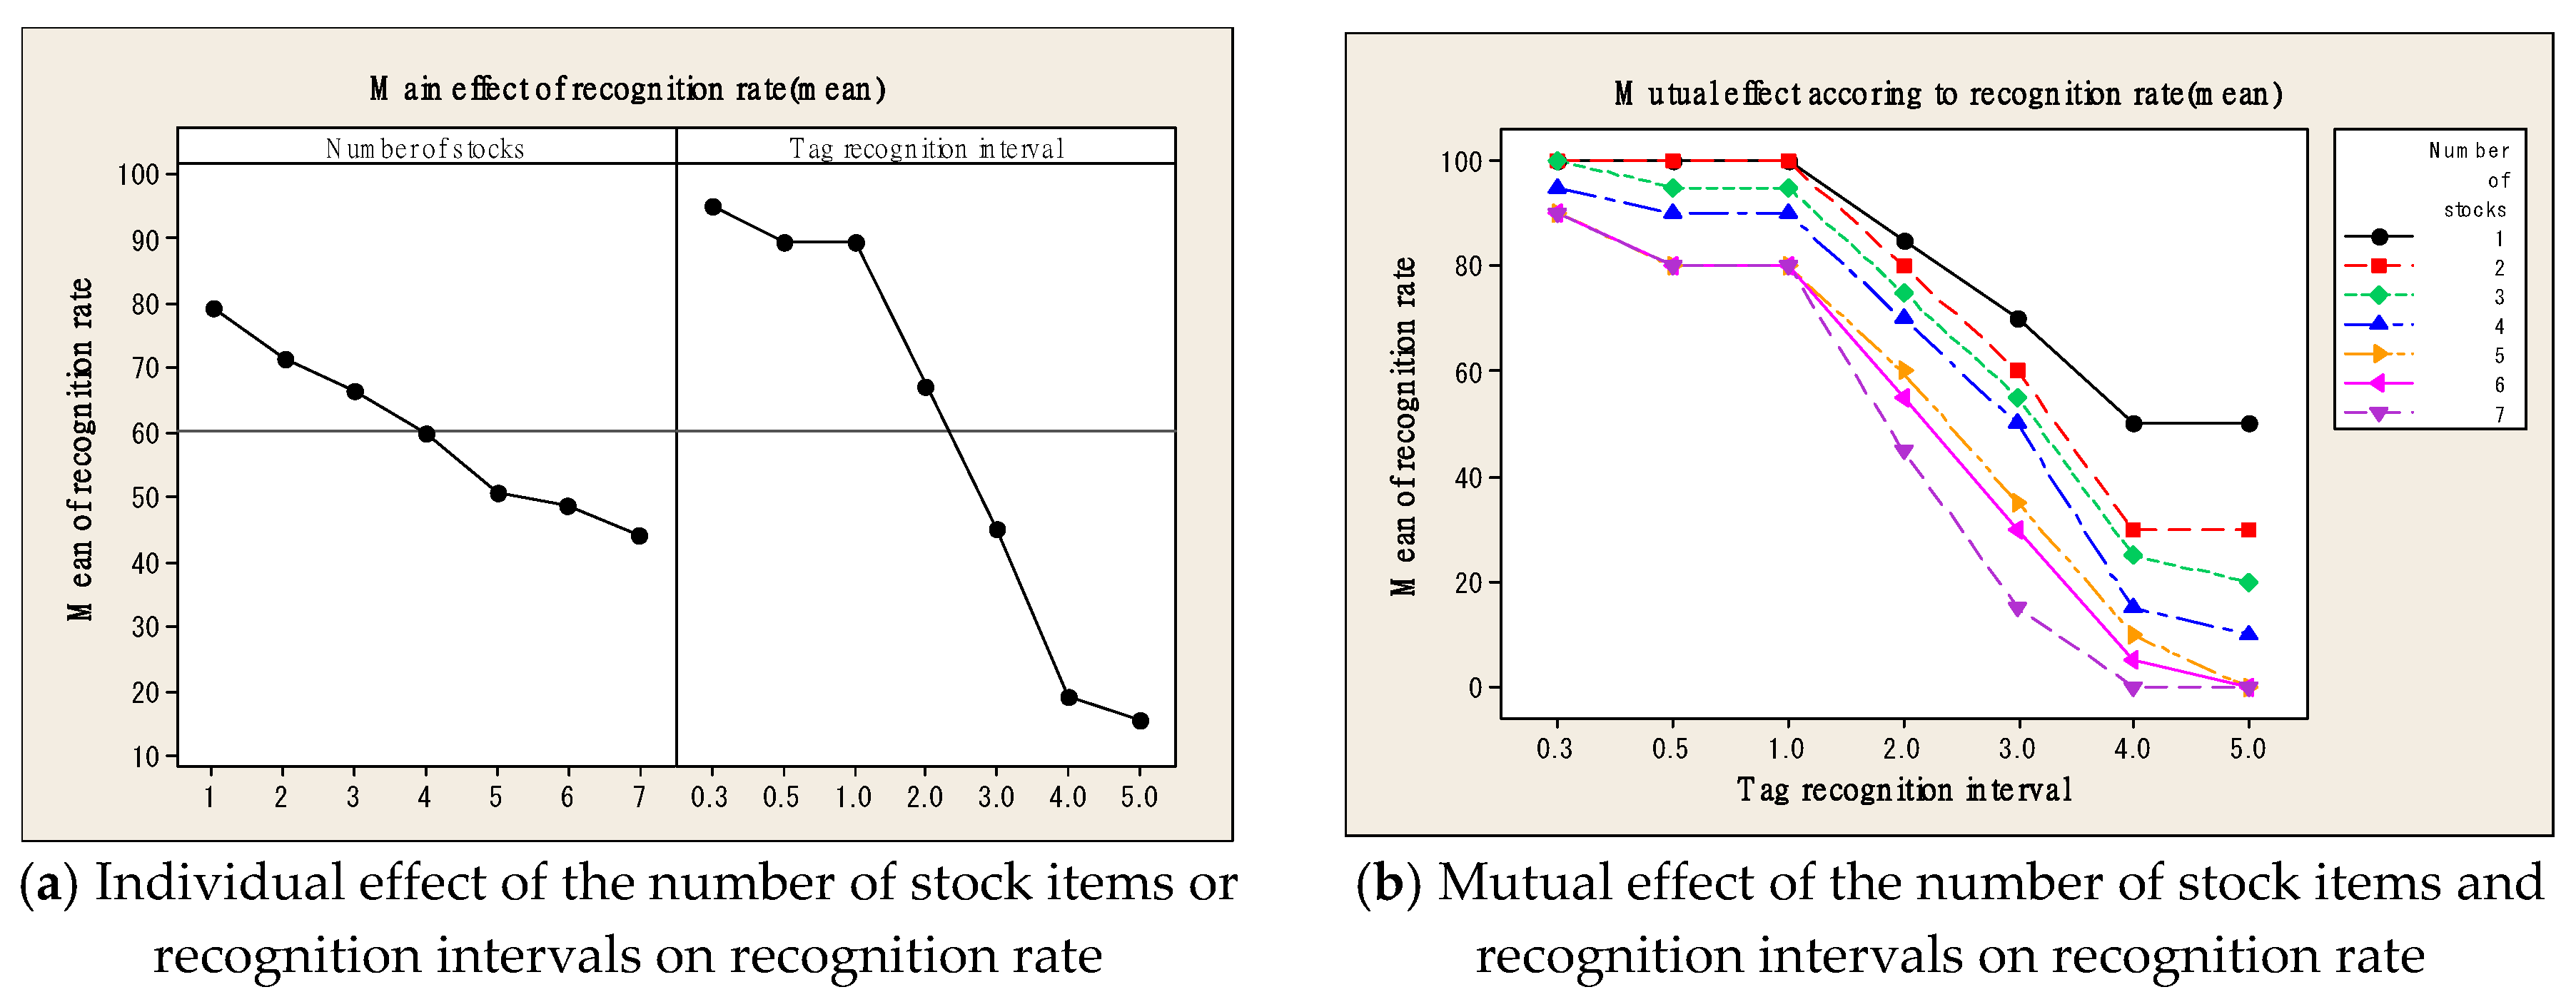
We then analyzed the inventory location identification based on the change in the number of stock items to be loaded in zone (area) 1-2 and the tag recognition interval of the RFID reader. The tag recognition speed of the RFID reader was fixed at 0.15 m/s. The number of stock items in each zone was changed from one to seven, and the tag recognition interval of the RFID reader was changed to 0.3, 0.5, 1, 2, 3, 4, and 5 sec. Table 2 shows the mean recognition rates when the measurement was carried out 30 times for each setting. The recognition rate was 100% when the number of stock items was less than or equal to two and the tag recognition interval was less than or equal to 1 sec. In addition, the recognition rate was 100% even when the tag recognition interval was 0.3 sec and the number of stocked items was less than or equal to three. The larger the number of stock items loaded in each zone, the greater the variability in recognition rates together with the lower the mean. The same trend applies to the recognition intervals. Figure 7 shows the influence of the number of stock items and tag recognition intervals on mean recognition rates. The plot indicates that the tag recognition interval had greater effect on the recognition rate than the number of stock items (Figure 7a), and the higher number of stock items lead to worse recognition rates (Figure 7b). It could be interpreted that smaller recognition intervals (or number of stock items) contribute positively to a greater recognition rate. According to the observations, it is found that both the recognition intervals and the number of stock items have a significant effect on the recognition rates in an inverse manner. It means that the recognition rate could be improved when the recognition interval or/and the number of stock items decrease/s. Therefore, the experiment results recommend managers load fewer than three items in a zone and scan the reference tag with an RFID reader with a recognition interval lower than 1 sec in order to have a 100% recognition rate.
The regression analysis for the recognition rate was conducted by increasing the number of stock items in each zone from one to 15 and increasing the tag recognition interval from 0.2 to 7 sec, thus the recognition rate was obtained as in Equation (5) with R-square = 94.1%, P-value = 0.00. R-square is a statistical measure for the proportion of the variance for a dependent variable that is explained by an independent variable, or variables, in a regression model [41], and the P-value, or probability value, is the probability of obtaining test results as extreme as the results actually observed for the statistical hypothesis testing, assuming that the null hypothesis is correct [42].
The regression formula further supports the experiment results, as it explicitly shows the association of the tag recognition interval with the recognition rate. According to Equation (5), we could calculate that, for the recognition rate to be 100%, the tag recognition interval of the RFID reader should be approximately 0.05, 0.37, and 0.70 sec when the number of loaded stock items is four, three, and two, respectively. In addition, as the number of stock items increases, the tag recognition interval needs to be decreased to retain the recognition rate. Furthermore, even if the tag recognition interval is small, the recognition rate could be lowered when the number of stock items is large.
4.2. Results for Item Location Identification
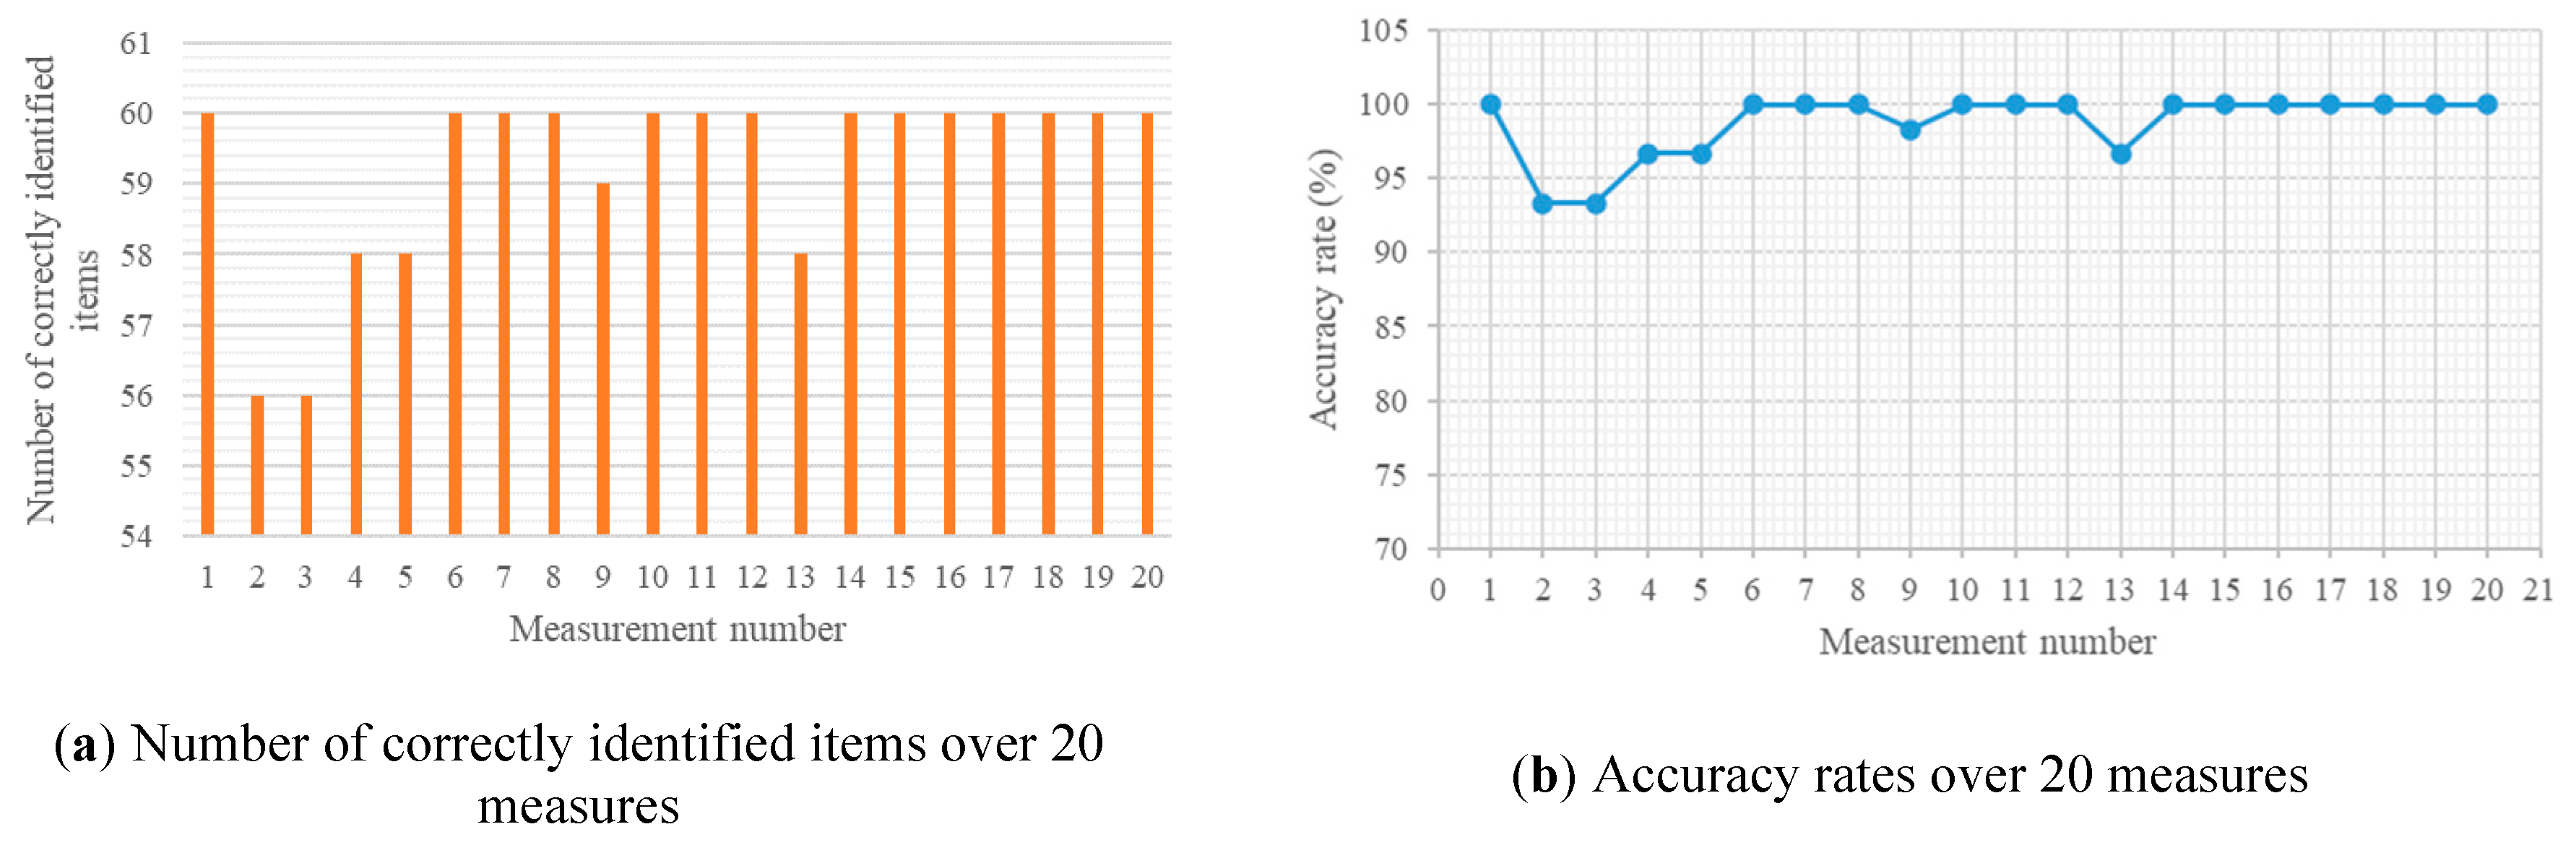
For the practical experiments, we extended the size of the MSR to four rows and five columns of 360 cm in width and 288 cm in length. For the given 20 zones, the unit zone size was same as the previous setting, and three items were loaded in each zone (i.e., a total of 60 items were loaded in the MSR) with a distance of 24 cm in between. The Rh and tag recognition interval were set at 35 cm and 0.3 sec, respectively, because, as demonstrated in Section 4.1, these are the optimum values for obtaining the best recognition rate. Meanwhile, the tag recognition speed of the RFID reader was approximately 0.36 m/s. We performed inventory location identification with 20 replications by applying the proposed algorithm under the same settings and conditions. The accuracy of the location identification was calculated via comparing the experimental results with the actual location of the stock items in favor of the number of existing stock items divided by the total number of identified items. The results of the 20 repeated measurements under the same setting and conditions are shown in Figure 8. In Figure 8a, we could recognize that there were several incorrectly identified items in the 2nd, 3rd, 4th, 5th, 9th, and 13th measurements out of a total of 60 items. In Figure 8b, we can ascertain that the location identification success rate using the proposed algorithm was 98.75% on average, with a standard deviation of 2.22%, which is practically high enough to identify inventory locations using the passive RFID tag. Although the recognition rate hardly reaches 100%, a meaningful result was obtained, given that the conventional active RFID tag-based location awareness method is also unable to guarantee an identification accuracy of 100%. SME managers might consider applying the proposed method, as it is an economical alternative, instead of the active tag-based location awareness method. The market prices for active tags are typically known to be twice as high as that of the passive tag.
5. Concluding Remarks
RFID-based real-time location awareness has been widely studied. Although passive RFID tag-based methods involve lower costs than active RFID methods, most studies have focused on the latter, with the research on the former remaining largely insufficient. Thus, we proposed a passive RFID-based inventory localization method that involved the introduction of the concept of reference tags. The proposed algorithm was programed and then applied to the MSR, consisting of four rows and five columns installed in an electronic device manufacturing company in South Korea. We confirmed the tag recognition according to the change in the measurement distance, the tag recognition interval of the RFID reader, and the number of stock items in each zone. We also verified the accuracy of the location identification for the size-expanded MSR through 20 repeated experiments. From these experiments, we found that as the number of loaded stock items is increased, the tag recognition interval of the RFID reader inversely decreases to increase the recognition rate. Furthermore, even if the tag recognition interval of the RFID reader is small, the recognition rate can be lowered when the number of loaded stock items is large. In addition, we confirmed that the proposed method provided a meaningful result, as there was no significant difference in the location identification rate compared with that of the existing active RFID tag-based methods.
Strictly speaking, the proposed method is not a real-time location identification method, as the operator recognizes the item information in the MSR with a portable RFID reader at a specific time. However, the proposed method is relatively inexpensive to construct in terms of identifying the location of the items stacked in MSR and in relatively narrow areas using a passive tag. This advantage makes it suitable for SMEs that have issues with large-scale facility investment, applying it to compare the location difference between the registered location information in the inventory system and the actual location of the items in the rack.
Despite the many advantages of the proposed method, the following issues should be addressed to make the method more practically applicable, and these issues will be the subject of future research. First, the decrease in the location identification rate should be compensated for when the tag recognition interval and the number of items loaded in each zone increase. Second, the proposed method has a restriction, as the same number of items must be loaded in each zone, and the item locations should be correctly identified, even if various numbers of items are loaded in each zone.
Author Contributions
All of the authors discussed and proposed the mathematical method and designed the test plan. J.P., Y.-J.K., and B.K.L. accomplished the computation and wrote the paper. All authors have read and agreed to the published version of the manuscript.
Funding
This work was supported by the National Research Foundation grant (NRF-2018R1C1B5033711) of the Republic of Korea.
Conflicts of Interest
The authors declare no conflict of interest.
References
- Jakob, M.; Grobmann, M.; Honle, N.; Nicklas, D. DCbot: Exploring the Web as Value-Added Service for Location-Based Applications. In Proceedings of the 21st International Conference on Data Engineering, Tokyo, Japan, 5–8 April 2005. [Google Scholar]
- Song, J.; Haas, C.; Caldas, C.; Ergen, E.; Akinci, B. Automating the task of tracking the delivery and receipt of fabricated pipe spools in industrial projects. Autom. Constr. 2006, 15, 166–177. [Google Scholar] [CrossRef]
- Aittola, M.; Ryhänen, T.; Ojala, T. Smart Library: Location-aware mobile library service. In Proceedings of the Fifth International Symposium on Human Computer Interaction with Mobile Devices and Services, Udine, Italy, 8–11 September 2003; pp. 411–416. [Google Scholar]
- Ting, Z.; Zhang, X.; Yuanxin, O. A Framework of Networked RFID System Supporting Location Tracking. In Proceedings of the 2006 2nd IEEE/IFIP International Conference in Central Asia on Internet, Tashkent, Uzbekistan, 19–21 September 2006; pp. 1–4. [Google Scholar]
- Kimoto, R.; Yamamoto, T.; Ishida, S.; Tagashira, S.; Fukuda, A. Evaluation of MultiZigLoc: Indoor ZigBee Localization System Using Inter-Channel Characteristics. In Proceedings of the 2018 Eleventh International Conference on Mobile Computing and Ubiquitous Network (ICMU), Auckland, NZ, USA, 5–8 October 2018; pp. 1–6. [Google Scholar]
- Seetharam, D.; Fletcher, R. Battery-Powered RFID. In Proceedings of the Sense ID 2007 1st ACM Workshop on Convergence of RFID and Wireless Sensor Networks and their Applications, Sydney, Australia, 4–9 November 2007; pp. 1–6. [Google Scholar]
- Takahashi, H.; Yanagita, T.E.; Suzuki, T.; Maeda, A.; Nakai, N.; Maeda, Y.; Shinga, K.; Hirokawa, T.; Ogawa, R.; Hara, M.; et al. Accurate localization of rectal cancer using near infrared ray-guided surgery with intra-operative colonoscopy and da Vinci Firefly technology. Surg. Today 2020, 50, 205–208. [Google Scholar] [CrossRef] [PubMed]
- Dai, D.; He, Q. Structure damage localization with ultrasonic guided waves based on a time–frequency method. Signal Process. 2014, 96, 21–28. [Google Scholar] [CrossRef]
- Finkenzeller, K. RFID Handbook: Fundamentals and Applications in Contactless Smart Cards, Radio Frequency Identification and Near-Field Communication, 3rd ed.; John Wiley & Sons: Wiltshire, UK, 2010. [Google Scholar]
- Li, N.; Becerik-Gerber, B. Performance-Based evaluation of RFID-Based indoor location sensing solutions for the built environment. Adv. Eng. Inform. 2011, 25, 535–546. [Google Scholar] [CrossRef]
- Dziadak, K.; Kumar, B.; Sommerville, J. Model for the 3D location of buried assets based on RFID technology. J. Comput. Civ. Eng. 2009, 23, 148–159. [Google Scholar] [CrossRef]
- Alarifi, A.; Al-Salman, A.; Alsaleh, M.; Alnafessah, A.; Al-Hadhrami, S.; Al-Ammar, M.A.; Al-Khalifa, H.S. Ultra wideband indoor positioning technologies: Analysis and recent advances. Sensors 2016, 16, 707. [Google Scholar] [CrossRef]
- Ni, L.M.; Liu, Y.; Lau, Y.C.; Patil, A.P. LANDMARC: Indoor location sensing using active RFID. In Proceedings of the First IEEE International Conference on Pervasive Computing and Communications 2003, Fort Worth, TX, USA, 23–26 March 2003; pp. 407–415. [Google Scholar]
- Goodrum, P.; McLaren, M.; Durfee, A. The application of active radio frequency identification technology for tool tracking on construction job sites. Autom. Constr. 2006, 15, 291–302. [Google Scholar] [CrossRef]
- Ergen, E.; Akinci, B.; East, B.; Kirby, J. Tracking components and maintenance history within a facility utilizing radio frequency identification technology. J. Comput. Civ. Eng. 2007, 21, 11–20. [Google Scholar] [CrossRef]
- OECD. Net employment creation and destruction between 2010 and 2016. In OECD SME and Entrepreneurship Outlook 2019; OECD Publishing: Paris, France, 2019. [Google Scholar]
- Tesoriero, R.; Tebar, R.; Gallud, J.A.; Lozano, M.D.; Penichet, V.M.R. Improving location awareness in indoor spaces using RFID technology. Expert Syst. Appl. 2010, 37, 894–898. [Google Scholar] [CrossRef]
- Montaser, A.; Moselhi, O. RFID indoor location identification for construction projects. Autom. Constr. 2014, 39, 167–179. [Google Scholar] [CrossRef]
- Jaselskis, E.; El-Misalami, T. Implementing radio frequency identification in the construction process. J. Constr. Eng. Manag. 2003, 129, 680–688. [Google Scholar] [CrossRef]
- Chae, S.; Yoshida, T. Application of RFID Technology to prevention of collision accident with heavy equipment. Autom. Constr. 2010, 19, 368–374. [Google Scholar] [CrossRef]
- Legner, C.; Thiesse, F. RFID-Based maintenance at Frankfurt airport. IEEE Pervasive Comput. 2006, 5, 34–39. [Google Scholar] [CrossRef]
- Hightower, J.; Borriello, G. Location systems for ubiquitous computing. Computer 2001, 34, 57–66. [Google Scholar] [CrossRef] [Green Version]
- Al Nuaimi, K.; Kamel, H. A survey of indoor positioning systems and algorithms. In Proceedings of the 2011 IEEE International Conference on Innovations in Information Technology, Abu Dhabi, UAE, 25–27 April 2011. [Google Scholar]
- BSR INCITS 371.2. Real Time Locating System (RTLS)—Part 2: 433MHz Air Interface Protocol; American National Standards Institute (ANSI): New York, NY, USA, 2003. [Google Scholar]
- Huang, C.-L.; Chung, P.-C.; Tsai, M.-H.; Yang, Y.-K.; Hsu, Y.-C. Reliability Improvement for an RFID-based Psychiatric Patient Localization System. Int. J. Comput. Commun. 2008, 31, 2039–2048. [Google Scholar] [CrossRef]
- D’Mello, S.; Mathews, E.; McCauley, L.; Markham, J. Impact of position and orientation of RFID tags on real time asset tracking in a supply chain. J. Theor. Appl. Electron. Commer. Res. 2008, 3, 1–12. [Google Scholar]
- Lim, M.K.; Bahr, W.; Leung, S.C.H. RFID in the warehouse: A literature analysis (1995–2010) of its applications, benefits, challenges and future trends. Int. J. Prod. Econ. 2013, 145, 409–430. [Google Scholar] [CrossRef] [Green Version]
- Alyahya, S.; Wang, Q.; Bennett, N. Application and integration of an RFID-enabled warehousing management system—A feasibility study. J. Ind. Inf. Integr. 2016, 4, 15–25. [Google Scholar] [CrossRef] [Green Version]
- Zhou, W.; Piramuthu, S.; Chuc, F.; Chue, C. RFID-enabled flexible warehousing. Decis. Support Syst. 2017, 98, 99–112. [Google Scholar] [CrossRef]
- Choy, K.L.; Ho, G.T.S.; Lee, C.K.H. A RFID-based storage assignment system for enhancing the efficiency of order picking. J. Intell. Manuf. 2017, 28, 111–129. [Google Scholar] [CrossRef]
- Hightower, J.; Want, R.; Borriello, G. SpotON: An Indoor 3d Location Sensing Technology Based on Rf Signal Strength; Technical Report UW CSE #2000-02-02; University of Washington: Seattle, WA, USA, 2000. [Google Scholar]
- Sue, K.-L.; Tsai, C.-H.; Lin, M.-H. FLEXOR: A Flexible Localization Scheme Based on RFID. In Proceedings of the Information Networking. Advances in Data Communications and Wireless Networks, Sendai, Japan, 16–19 January 2006. [Google Scholar]
- Jin, G.-Y.; Lu, X.-Y.; Park, M.-S. An Indoor Localization Mechanism Using Active RFID Tag. In Proceedings of the IEEE International Conference on Sensor Networks, Ubiquitous, and Trustworthy Computing, Taichung, Taiwan, 5–7 June 2006; pp. 40–43. [Google Scholar]
- Hahnel, D.; Burgard, W.; Fox, D.; Fishkin, K.; Philipose, M. Mapping and localization with RFID technology. In Proceedings of the IEEE International Conference on Robotics and Automation, New Orleans, LA, USA, 26 April–1 May 2004. [Google Scholar]
- Chattopadhyay, A.; Harish, A.R. Analysis of low range Indoor Location Tracking techniques using Passive UHF RFID tags. In Proceedings of the 2008 IEEE Radio and Wireless Symposium, Orlando, FL, USA, 22–24 January 2008. [Google Scholar]
- Liu, X.; Corner, M.; Shenoy, P. Ferret: RFID localization for pervasive multimedia. In Proceedings of the 8th International Conference (UbiComp 2006), Orange County, CA, USA, 17–21 September 2006. [Google Scholar]
- Nemmaluri, A.; Corner, M.D.; Shenoy, P. Sherlock: Automatically Locating Objects for Humans. In Proceedings of the 6th International Conference on Mobile Systems, Application, and Service, Breckenridge, CO, USA, 17–20 June 2008. [Google Scholar]
- DiGiampaolo, E.; Martinelli, F. A robotic system for localization of passive UHF-RFID tagged objects on shelves. IEEE Sens. J. 2018, 18, 8558–8568. [Google Scholar] [CrossRef]
- González, J.F.A.; Smith, N.R.; Vargas-Rosales, C. A method for identifying multiple RFID tags in high electromagnetic interference environments. Can. J. Electr. Comput. Eng. 2015, 38, 346–352. [Google Scholar] [CrossRef]
- Liu, C.-G.; Liu, I.-H.; Lin, C.-D.; Li, J.-S. A novel tag searching protocol with time efficiency and searching accuracy in RFID systems. Comput. Netw. 2019, 150, 201–216. [Google Scholar] [CrossRef]
- R-Squared. Available online: https://www.investopedia.com/terms/r/r-squared.asp (accessed on 23 May 2020).
- Wasserstein, R.L.; Lazar, N.A. The ASA’s Statement on p-Values: Context, Process, and Purpose. Am. Stat. 2016, 70, 129–133. [Google Scholar] [CrossRef] [Green Version]
Figure 1.
Proposed framework.
Figure 2.
Difference in recognizable range based on the measurement distance between the RFID reader and target.
Figure 2.
Difference in recognizable range based on the measurement distance between the RFID reader and target.
Figure 3.
MSR with reference tags and stocks.

Figure 4.
RFID reader with aluminum conical structure (mockup).
Figure 5.
MSR areas with three items.
Figure 6.
Recognition of the reference tags with an increase in Rh at a propagation angle of 125°.
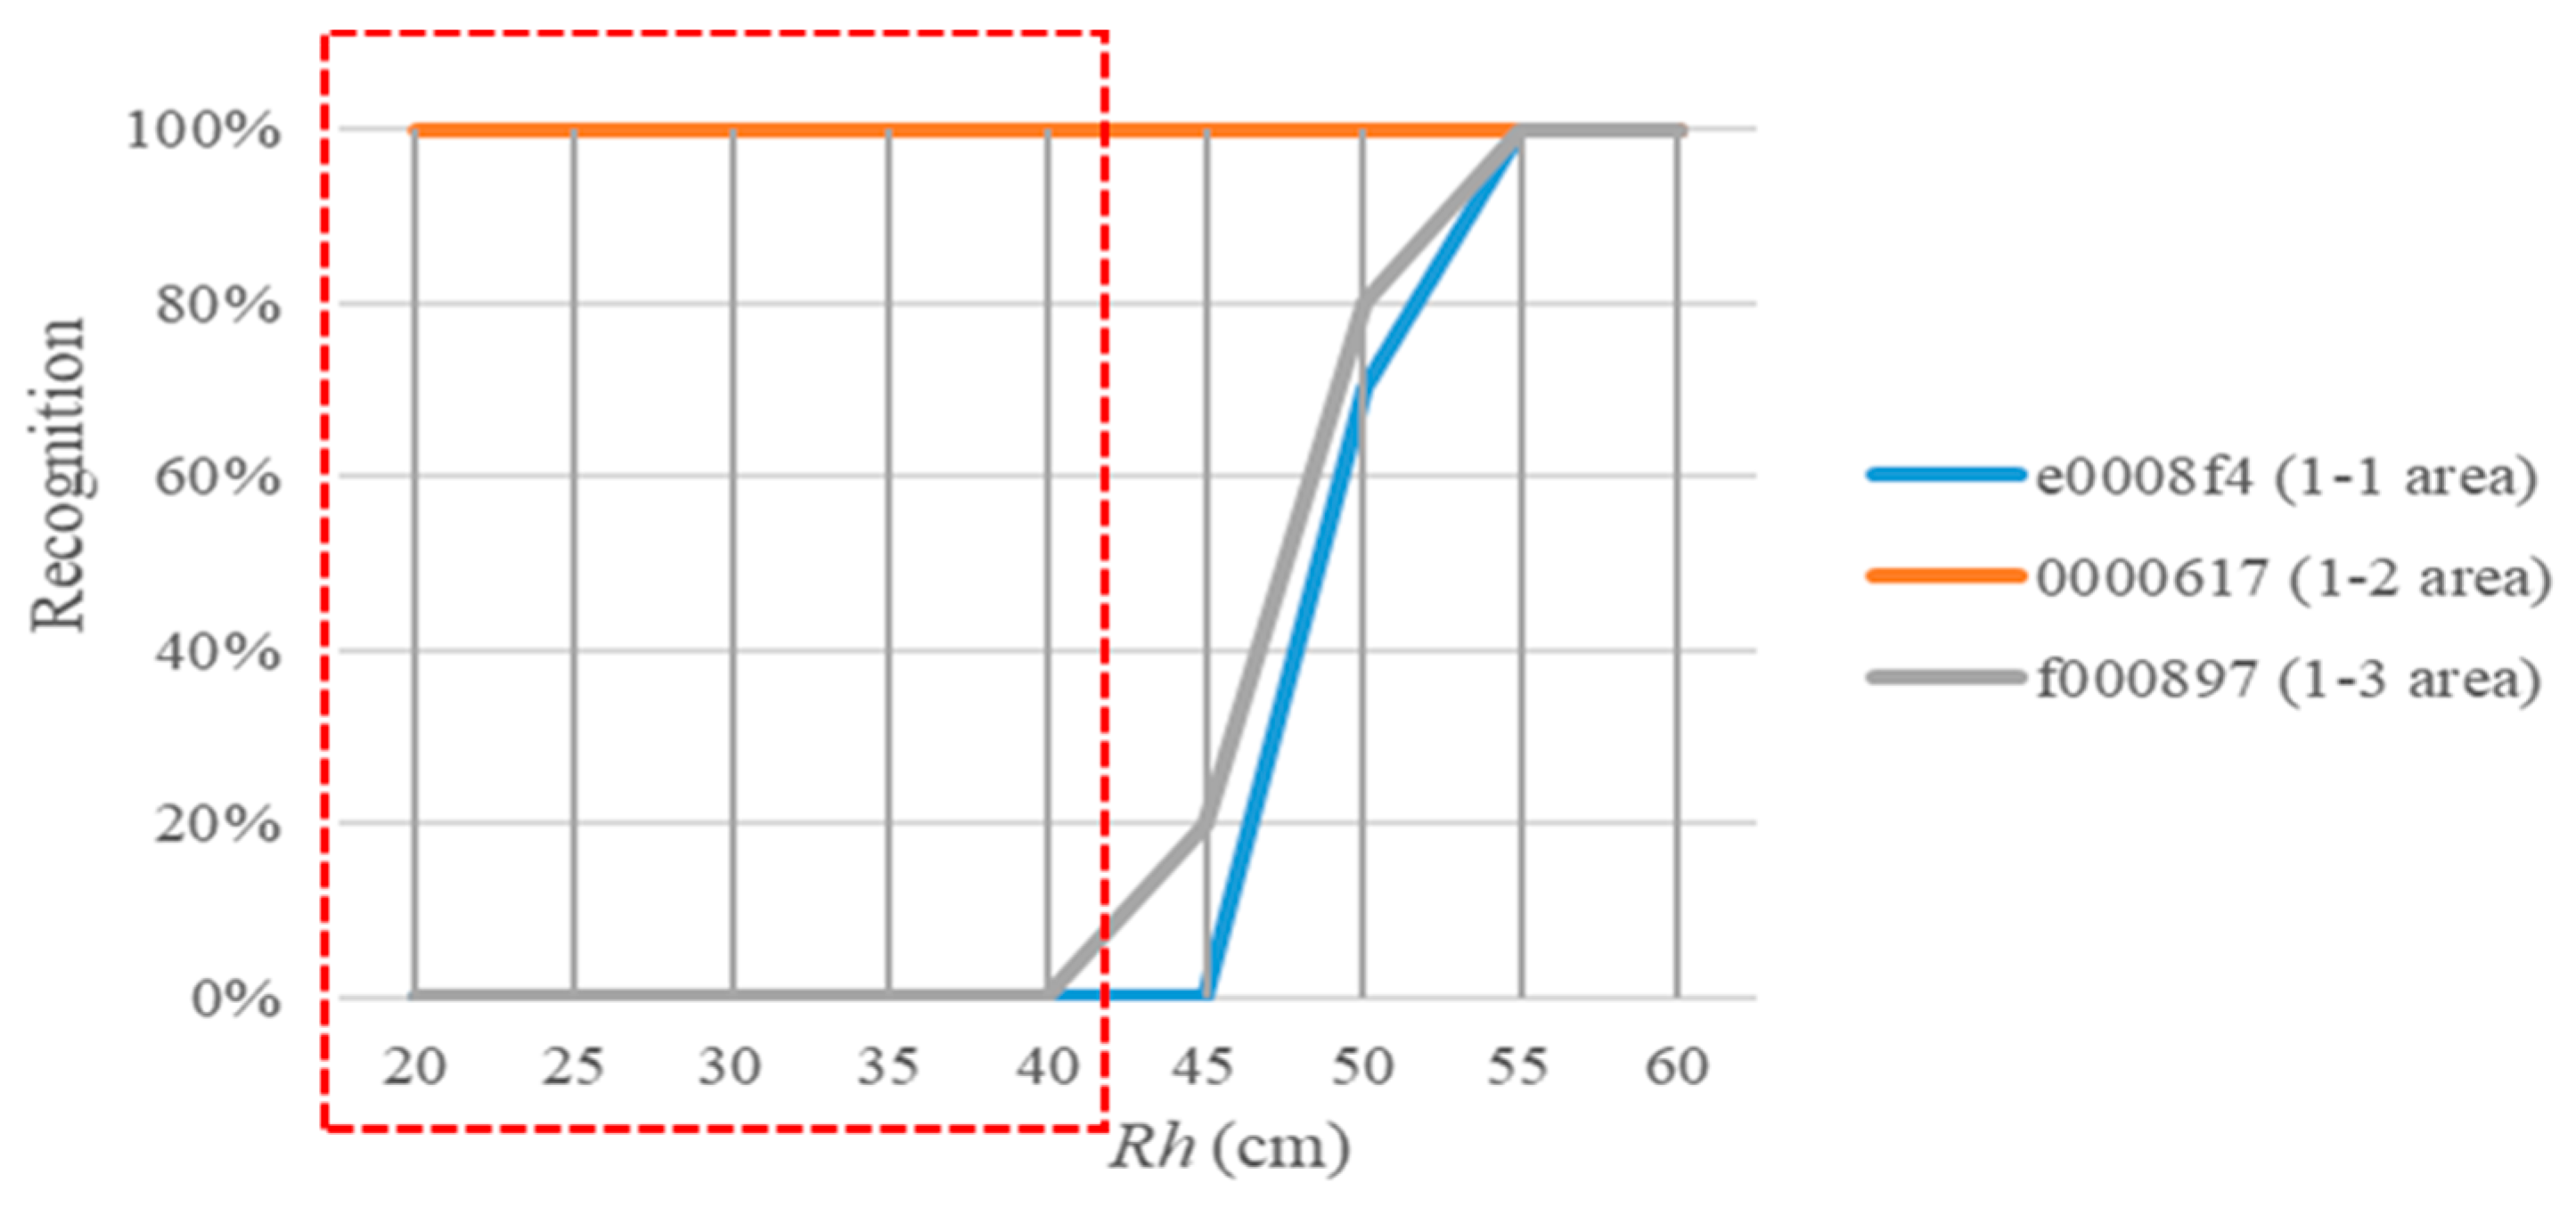
Figure 7.
Main effect plot for the recognition rate between the number of stock items and the tag recognition intervals.
Figure 7.
Main effect plot for the recognition rate between the number of stock items and the tag recognition intervals.

Figure 8.
Results of the item location identification for the 20 repeated measurements.


Table 1.
Recognized tag information of stock items in each zone.
| Recognized Tag Information of Stocks | Number of Reference Tags | ||
|---|---|---|---|
| A, A1, A2, A3, A4 | 1 | ||
| A, A1, A2, A3, A4, A5, B | 2 | ||
| A, A2, A3, A4, A5, A6, B | 2 | ||
| B, A3, A4, A5, A6, A7 | 1 | ||
| B, C, A4, A5, A6, A7, A8 | 2 | ||
| B, C, A5, A6, A7, A8, A9 | 2 | ||
| C, A6, A7, A8, A9, A10 | 1 | ||
| C, A7, A8, A9, A10, A11, D | 2 | ||
| C, A8, A9, A10, A11, A12, D | 2 | ||
| D, A9, A10, A11, A12 | 1 | ||
| D, A10, A11, A12 | 1 | ||
| D, A11, A12 | 1 | ||
| - | 0 |
Table 2.
Recognition rates for the number of stock items and tag recognition intervals (%]).
| Number of Stocked Items | Tag Recognition Intervals of the RFID Reader (sec) | ||||||||
|---|---|---|---|---|---|---|---|---|---|
| 0.3 | 0.5 | 1 | 2 | 3 | 4 | 5 | Mean | Standard Deviation | |
| 1 | 100 | 100 | 100 | 85 | 70 | 50 | 50 | 79 | 22.8 |
| 2 | 100 | 100 | 100 | 80 | 60 | 30 | 30 | 71 | 31.8 |
| 3 | 100 | 95 | 95 | 75 | 55 | 25 | 20 | 66 | 33.8 |
| 4 | 95 | 90 | 90 | 70 | 50 | 15 | 10 | 60 | 35.9 |
| 5 | 90 | 80 | 80 | 60 | 35 | 10 | 0 | 51 | 36.1 |
| 6 | 90 | 80 | 80 | 55 | 30 | 5 | 0 | 49 | 37.3 |
| 7 | 90 | 80 | 80 | 45 | 15 | 0 | 0 | 44 | 39.6 |
| Mean | 95 | 89 | 89 | 67 | 45 | 19 | 16 | ||
| Standard deviation | 5.0 | 9.3 | 9.3 | 14.4 | 19.1 | 17.2 | 19.0 | ||
© 2020 by the authors. Licensee MDPI, Basel, Switzerland. This article is an open access article distributed under the terms and conditions of the Creative Commons Attribution (CC BY) license (http://creativecommons.org/licenses/by/4.0/).
Share and Cite
MDPI and ACS Style
Park, J.; Kim, Y.-J.; Lee, B.K. Passive Radio-Frequency Identification Tag-Based Indoor Localization in Multi-Stacking Racks for Warehousing. Appl. Sci. 2020, 10, 3623. https://doi.org/10.3390/app10103623
AMA Style
Park J, Kim Y-J, Lee BK. Passive Radio-Frequency Identification Tag-Based Indoor Localization in Multi-Stacking Racks for Warehousing. Applied Sciences. 2020; 10(10):3623. https://doi.org/10.3390/app10103623
Chicago/Turabian StylePark, Jaehun, Yong-Jeong Kim, and Byung Kwon Lee. 2020. "Passive Radio-Frequency Identification Tag-Based Indoor Localization in Multi-Stacking Racks for Warehousing" Applied Sciences 10, no. 10: 3623. https://doi.org/10.3390/app10103623
Note that from the first issue of 2016, this journal uses article numbers instead of page numbers. See further details here.