Article

Static Strength of Friction-Type High-Strength Bolted T-Stub Connections under Shear and Compression

1
School of Transportation and Civil Engineering, Shandong Jiaotong University, Jinan 250357, China
2
School of Civil Engineering, Shandong University, Jinan 250061, China
3
China Academy of Transportation Sciences, Beijing 100081, China
*
Authors to whom correspondence should be addressed.
Appl. Sci. 2020, 10(10), 3600; https://doi.org/10.3390/app10103600
Submission received: 14 April 2020 / Revised: 16 May 2020 / Accepted: 19 May 2020 / Published: 22 May 2020
(This article belongs to the Section Mechanical Engineering)

Abstract

:
The friction-type high-strength bolted (FHSB) T-stub connection has been widely used in steel structures, due to their good fatigue resistance and ease of installation. While the current studies on FHSB T-stub connections mainly focus on the structural behaviors under both shear and tensile force, no research has been reported on the mechanical responses of the connections under the combined effects of shear and compression. To make up for this gap, this paper presents a novel FHSB T-stub connection, which is simple in structure, definite in load condition, and easy to construct. Static load tests were carried out on 21 specimens under different shear–compression ratios, and the finite-element (FE) models were created for each specimen. The failure modes, initial friction loads and ultimate strengths of the specimens were compared in details. Then, 144 FE models were adopted to analyze the effects of the friction coefficient, shear–compression ratio, bolt diameter and clamping force on the initial friction load and ultimate strength. The results showed that the FHSB T-stub connection under shear and compression mainly suffers from bolt shearing failure. The load–displacement curve generally covers the elastic, yield, hardening and failure stage. If the shear–compression ratio is small and the friction coefficient is large, its curve only contains the elastic and failure stage. The friction coefficient and shear–compression ratio have great impacts on the initial friction load and ultimate strength. For every 1 mm increase in bolt diameter, the initial friction load increased by about 10%, while the ultimate strength increased by about 8.5%. For each 10% increase/decrease of the design clamping force, the initial friction load decreases/increases by 7.8%, while the ultimate load remains basically the same. The proposed formula of shear capacity and self-lock angles of FHSB T-stub connection can be applied to the design of CSS-enhanced prestressed concrete continuous box girder bridges (PSC-CBGBs) and diagonal bracing.

1. Introduction

Box girder cracking and mid-span deflection are common problems of prestressed concrete (PSC) continuous box girder bridges (CBGBs) around the world [1,2,3,4,5]. Traditionally, these problems have been effectively treated by pasting carbon fiber cloth, applying steel plate, increasing sectional size and adding prestressing tendons. However, the traditional methods vary greatly in enhancement effect, when the PSC-CBGB has a long span and serious problems [6].
The cable-stayed system (CSS) is a novel active reinforcement method that improves the shear capacity and mid-span height of the girder [7,8]: on each side of the pile foundation, a steel joist is added in the tower laterally to the lower part of the girder, the steel joist is joined to the girder by a connection in the anchorage zone at the bottom of the girder and stay cables are anchored from the tower to the steel joist. In this way, cable forces are transmitted from the girder via the joist and the connection. The steel joist and the girder are generally connected tightly with both bolts and welds or with high-strength bolts [9,10,11,12,13]. The bolted–welded connection faces two defects: on the one hand, the connection is difficult to construct or dismantle, and poor in reliability. Although a welded connection is stronger than bolted connections, the quality of it is unreliable, especially when it is not factory-made. Compared with a welded connection, a bolt connection has a quick construction speed and requires fewer skilled workers. From an economic and performance perspective, all of these give bolted connections a distinct advantage over a welded connection [9]; on the other hand, each connection has a unique stiffness and ductility, and complex mechanical properties [14]. The effects of these demands are often compounded by the sensitivity to fracture typical welded connection details. Even if the welds are properly executed, these strain demands will lead to tearing of the base metal in proximity of the weld access hole. This results in low rotational ductility and poor connection performance under large cyclic load reversals [15]. These defects are made up of a high-strength bolted (HSB) connection, which has been widely applied in bridges and other steel structures [16,17]. Based on the load transfer mode, the HSB connections can be divided into the bearing type and the friction type. For the bearing type HSB (BHSB) connection, the shear force is transmitted by the wall pressure and the screw shear. Despite its high ultimate bearing capacity, the BHSB connection is not applicable under dynamic load or fatigue load. For the friction type HSB (FHSB) connection, the shear force is transmitted by the friction between the contact surfaces. Compared with a BHSB connection, high tensile strength in flexure and tensile behaviors, high performance in fatigue loading due to the reduced stress range, avoidance of bolt loosening to vibration, etc. [18,19]. The FHSB connection has been extensively adopted for the connections in bridges [20,21]. As shown in Figure 1, FHSB connections have been employed for the CSS enhancement of Dongming Yellow River Highway Bridge.
In engineering practice, many bolts are implanted to provide the connection with required shear capacity according to the Standard for Design of Steel Structures (GB 50017-2017) [22]. However, the relevant design specification and research results do not involve the design method of the anti-slip bearing capacity for FHSB connections under combined shear and compression. The friction load of such a connection depends heavily on the pressure from the cable force and the friction between the contact surfaces induced by the axial force of the bolt. In our previous research, a scaled model test was carried out on the connections in the anchorage zone of the Dongming Yellow River Highway Bridge. The results show a positive correlation between cable force, the pressure on the contract surfaces and the loss of shear force and the clamping force of the bolt. This calls for further analysis on the friction load of FHSB connections [23]. The rough contact surface of the sand blasting connection plate may be partially buckled after slippage, and the friction coefficient may change, making it difficult to evaluate the ultimate strength of FHSB connections. [24,25].
As shown above, no research has been reported on the static strength of the FHSB connections under combined shear and compression. To overcome the difficulty, this paper presents a novel FHSB T-stub connection, which is simple in structure, definite in load condition, and easy to construct. To identify the mechanical properties of the proposed connection, static load tests were carried out on 21 specimens under different shear–compression ratios, and the FE models were created for each specimen. The shear–compression ratio was adjusted by changing the size of the pressure plate. On this basis, the authors compared the specimens in failure mode, initial friction load and ultimate strength, summed up the relationship between shear capacity and shear–compression ratio, and verified the FE models. In addition, 144 FE models were adopted for parametric analysis. In this way, the shear capacity formula of FHSB T-stub connections was obtained under shear and compression. The research results provide a reference for the connection design of CSS-enhanced PSC-CBGBs and diagonal bracing.

2. Selection of Anchorage Angle

Before the static load tests, it is necessary to define the range of the anchorage angle θ (i.e., the angle between the stay cable direction and the normal direction of the anchor point), which affects the magnitude of the normal component FN and tangential component Fv of the cable force F at the connection in the anchorage zone at the bottom of the girder. The normal component is positively correlated with the pressure on the contact surfaces and the lifting force of the girder, while the tangential component is positively correlated with the shear on the contact surfaces and the shear resistance required for the connection. As shown in Figure 2, the anchorage angle θ depends on the tower height H (i.e., the vertical distance from the anchor point of tower to the deck) and the distance x between the anchor point and symmetrical center. For partially CSS-enhanced bridges, the ratio of tower height H to the maximum span L ranges from L/12 to L/4. The tower height H should be maximized (H = L/4) to increase the cross-sectional height of box girder. The maximum value falls in the distribution range of anchor points (i.e., L/8-3L/8 away from the center line of pier) specified in the Guidelines for Design of Highway Cable-stayed Bridge (JTG/T D65-01-2007) [26]. The statistics on 152 PSC-CBGBs (L ≥100 mm) around the world show that the anchorage angles vary between 36.41 and 55.01°. Therefore, the anchorage angle of the specimens was set to the range of 35–60° in the tests, and the corresponding range of shear–compression ratio is 0.70–1.73.

3. Static Load Tests

3.1. Specimens

Before the tests, the specimens were evenly divided into three groups by the angle between the axial direction of bolt and the load direction, which corresponds to the anchorage angle. The angles of the three groups are 35°, 45° and 60°, respectively. The corresponding shear–compression ratios λ were 0.70, 1.00 and 1.73, respectively. The shear–compression ratio λ is infinite when under pure shear, and zero when under pure pressure. As shown in Figure 3, each specimen contained two pressure plates, two connecting plates, two bolts, two nuts and four washers. Each connecting plate (l × w × t1) had two 21 mm-diameter bolt holes, through which it is bolted to the corresponding pressure plate (w × a × b × c × t2). Both kinds of plates were made of steel. According to the Standard for Design of Steel Structures (GB 50017-2017) [22], the material properties of the plates were tested. The results show that yield strength and tensile strength of connecting plates were 250.3 MPa and 420.4 MPa, respectively, and those of pressure plates were 355.6 MPa and 600.8 MPa, respectively.
The dimensions and material properties of high-strength bolts (HSBs) are shown in Table 1 and Table 2, respectively. It can be seen that the bolts are 20 mm (M20) in diameter, and 10.9 S in steel strength, i.e., the yield strength exceeds 900 MPa and the tensile strength falls between 1040 and 1240 MPa. The parameters of the 21 specimens are listed in Table 3, where the NMC and MC mean the contact surfaces are buttered and not buttered, respectively; 35, 45 and 60 are the anchorage angles; 01–06 are the serial number of specimens. The friction coefficient of contract surfaces were measured as 0.588 according to the Technical Specification for High Strength Bolt Connections of Steel Structures (JGJ 82-2011) [27]. Considering the large early loss of bolt clamping force, the target clamping force was applied at 10% higher than the design value.

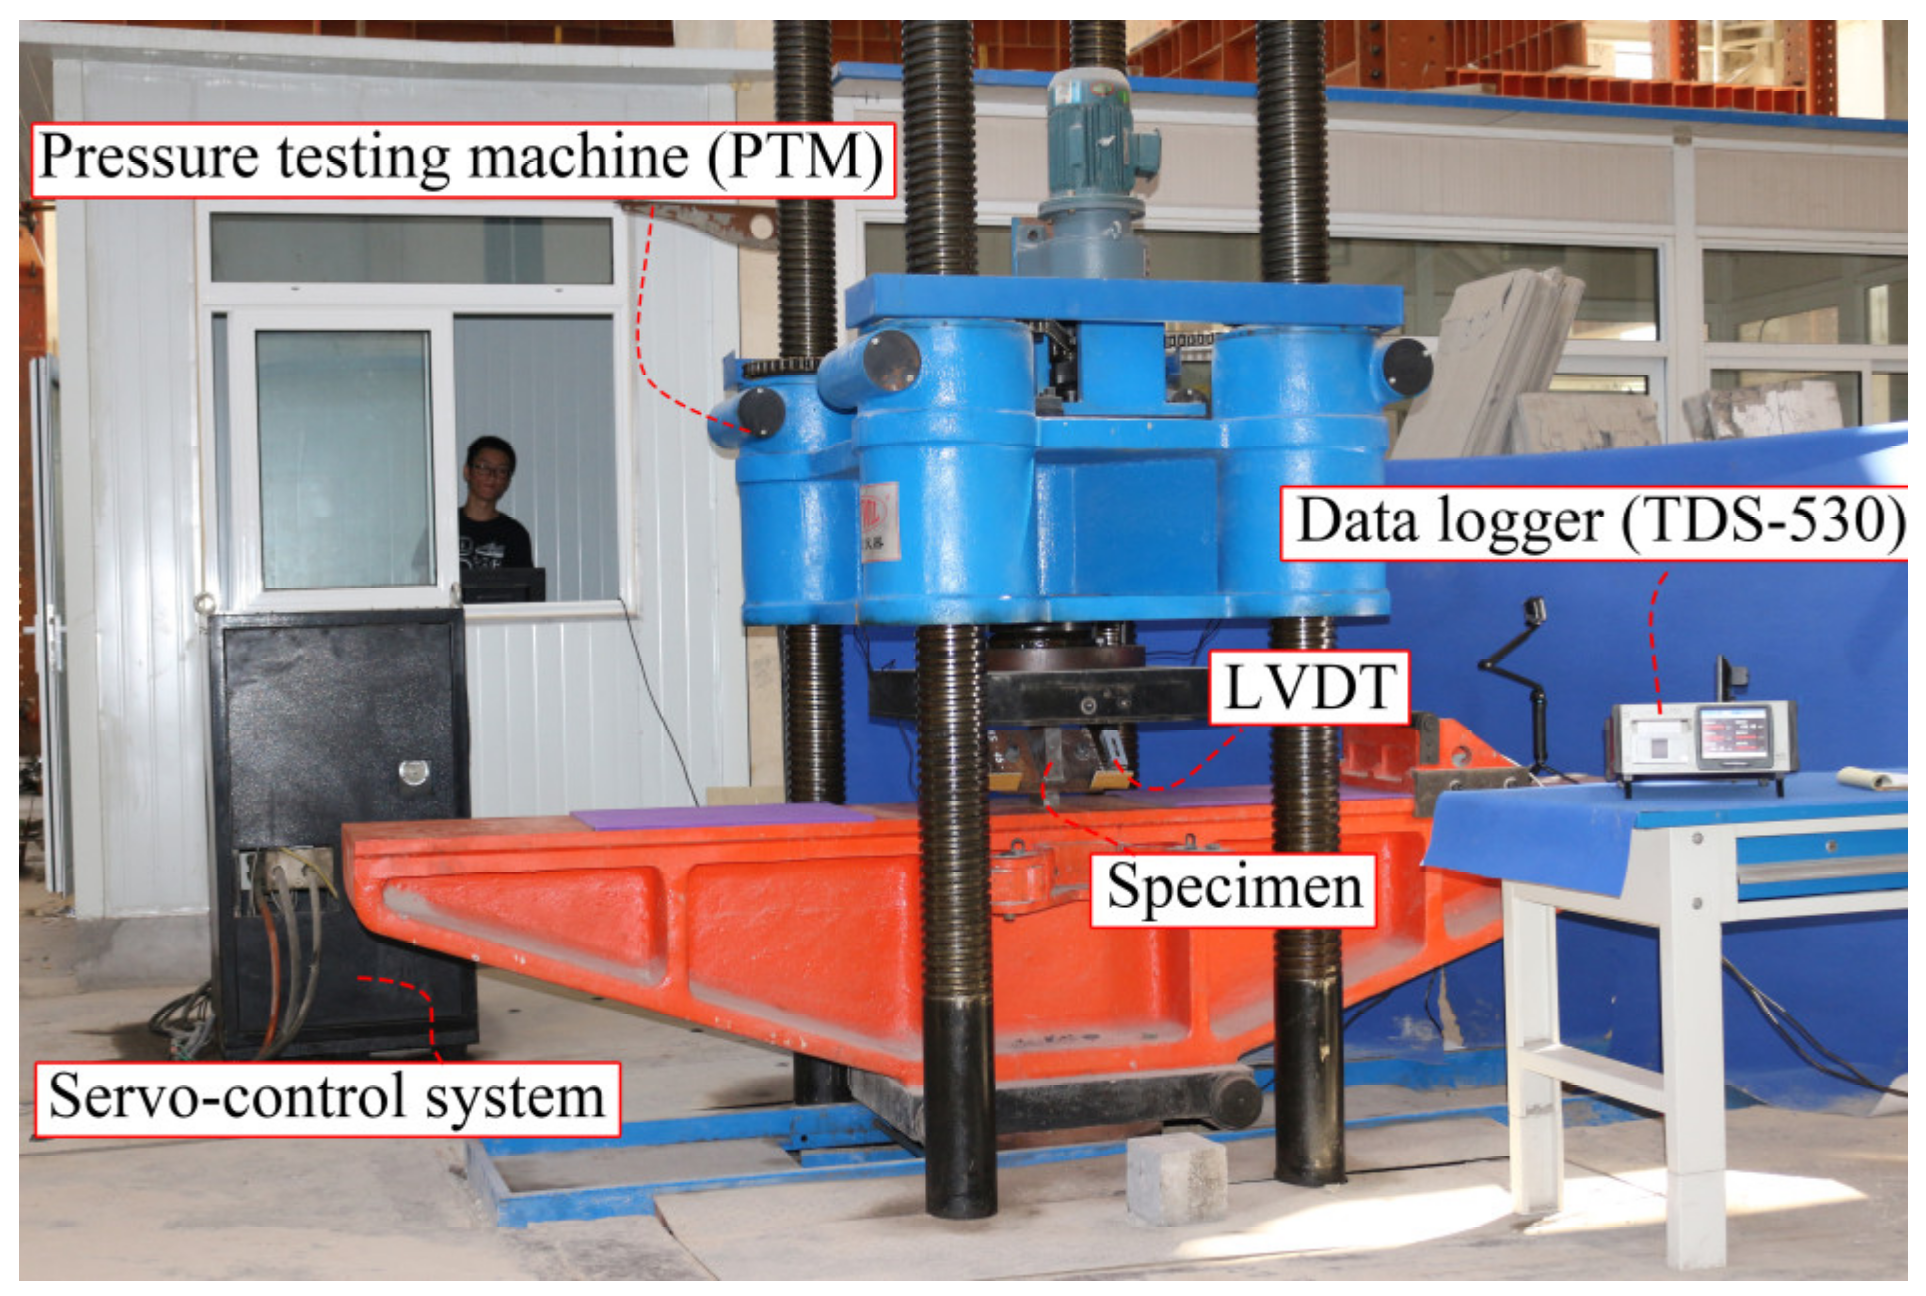
3.2. Loading Conditions and Instruments

During the tests, each specimen was loaded at the preset displacement rate (0.6 min/min) on a 5 MN pressure testing machine (PTM, Shandong Jianzhu university, Jinan, China) with a servo hydraulic controller. Besides, two linear variable displacement transformers (LVDTs) were symmetrically fixed on the left and right sides of the specimen. The relative displacement of each connecting plate along the direction of contact surfaces was recorded by a TDS-530 data logger. Figure 4 shows the positions of the LVDTs on MC-45 specimens.
As shown in Figure 5, the bolt force sensor (BFS) was manufactured in the following steps: First, a blind hole (diameter: 2 mm; depth: 28 mm) was drilled at the center of hexagon bolt head. After the hole was cleaned up, a strain gauge (KFB-3-120-C20-11, Kyowa electronic Instruments, (Shanghai) Trading Co., Ltd., Shanghai, China) was embedded into the hole and fixed with glue; Next, the BFS was calibrated by the tensile testing machine and TDS-530 data logger (Shandong Jianzhu university, Jinan, China). The strain that corresponds to the target clamping force of the BFS was calculated through linear regression [28]. Here, the clamping force of the bolt was applied in turn to 50%, 100% and 110% of the design value (P = 155 kN) [27]. The test setup is illustrated in Figure 6 below.

4. Test Results and Discussion

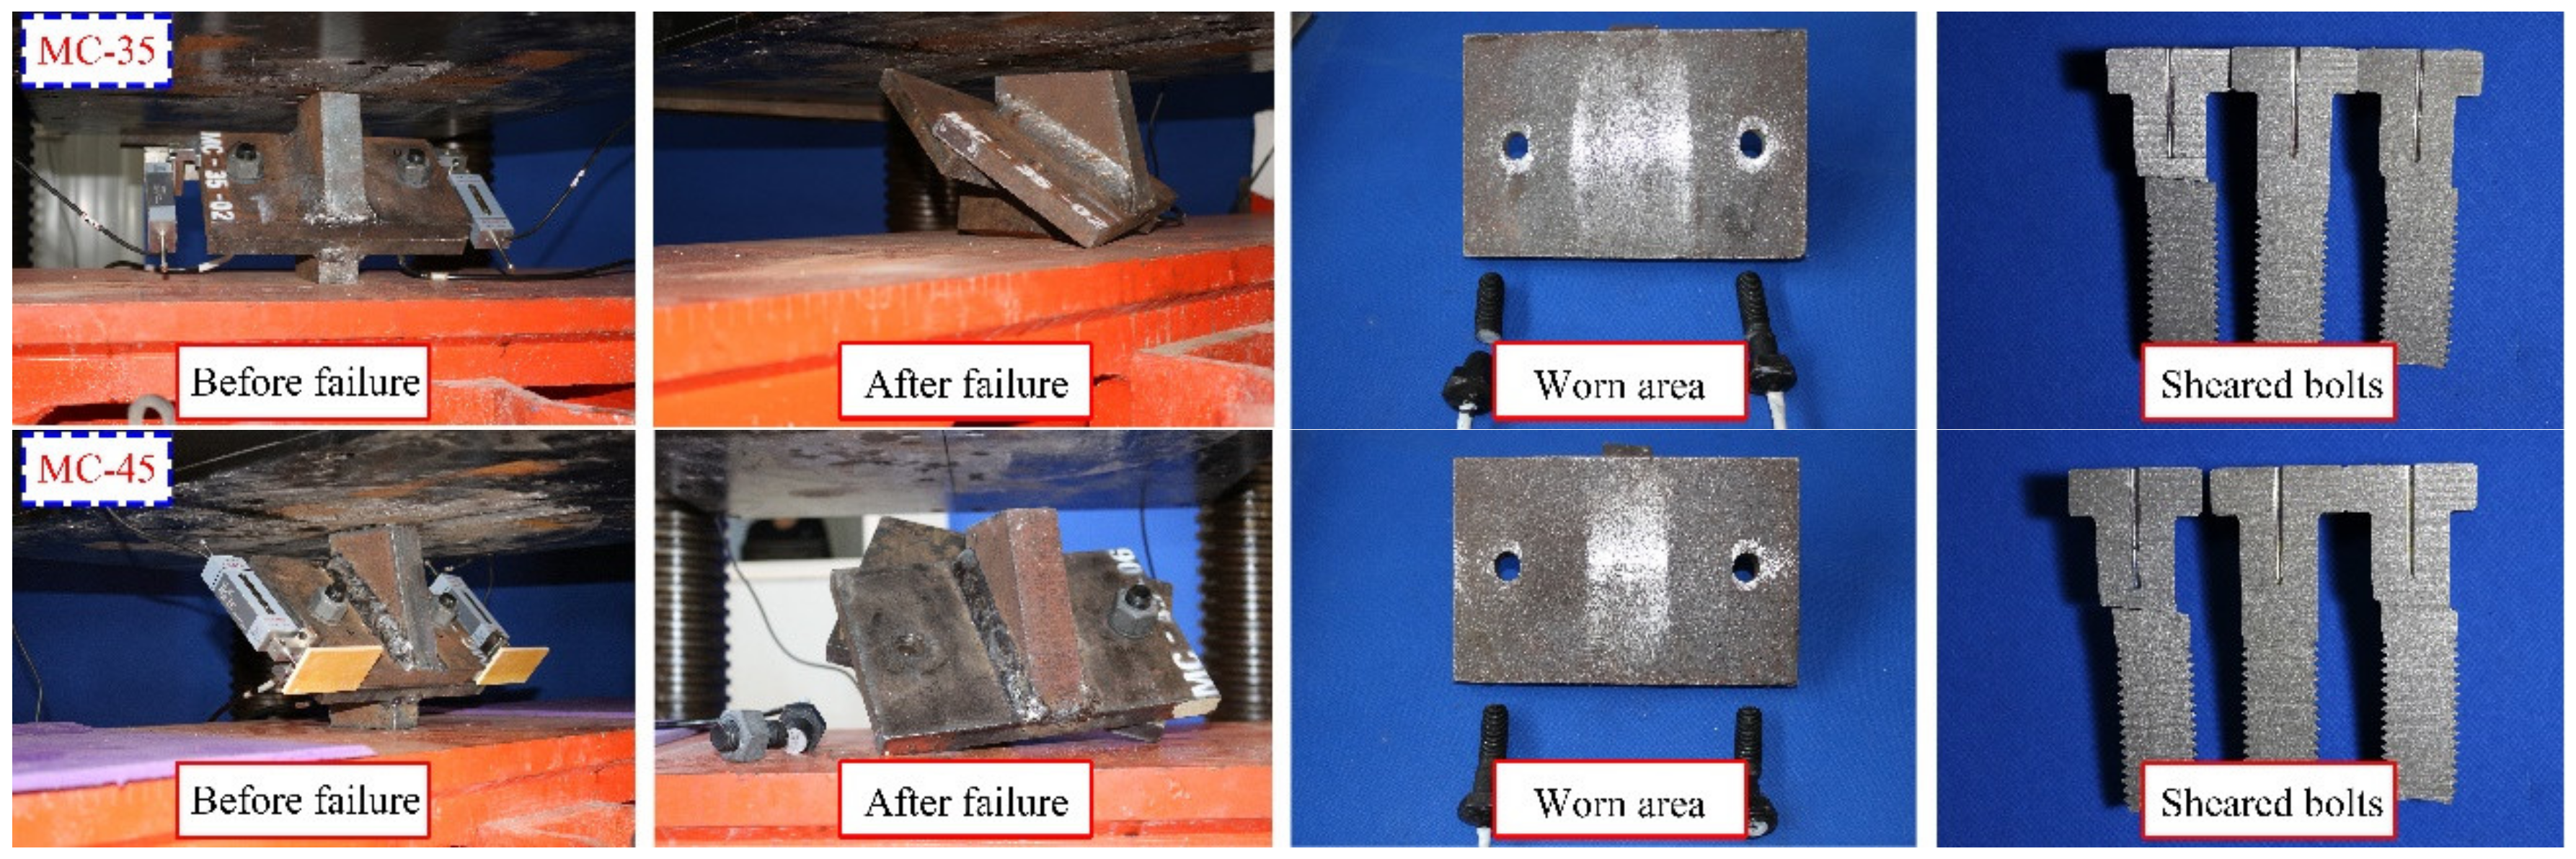
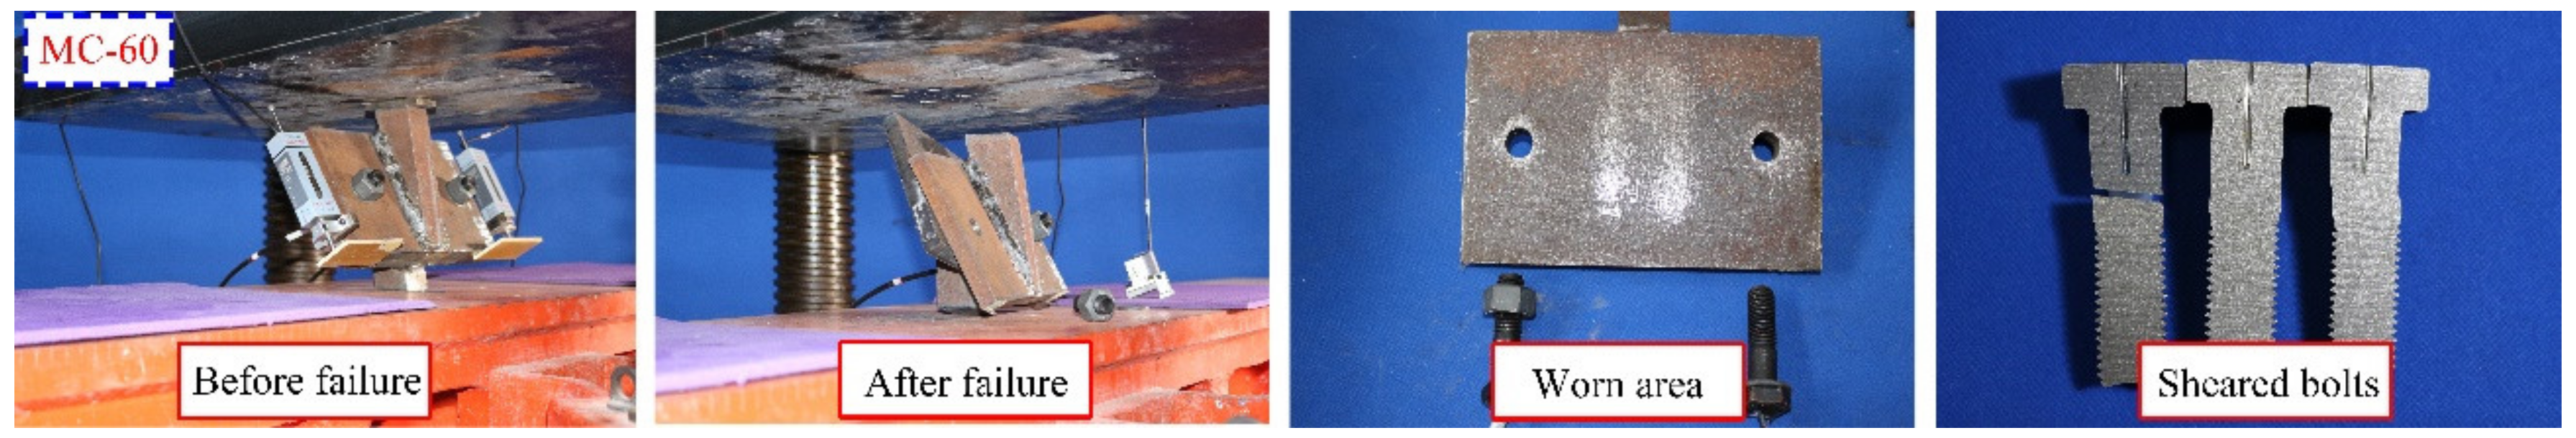
4.1. Failure Modes of FHSB T-Stub Connection

The specimen failures observed in the tests are displayed in Figure 7. It can be seen that the specimens mainly suffered from shear failure, as one bolt was cut off in most cases. During the tests, each specimen gave off a sound when the static friction was overcome. The sound was followed by a string of clear sounds. Finally, an ultra-loud sound was heard when the bolt was cut off. With the increase in the shear–compression ratio, the sounds became less loud, the hole wall underwent greater deformation, and the worn area at the middle of contact surfaces and the peripheral of bolt hole continued to shrink and roughen.

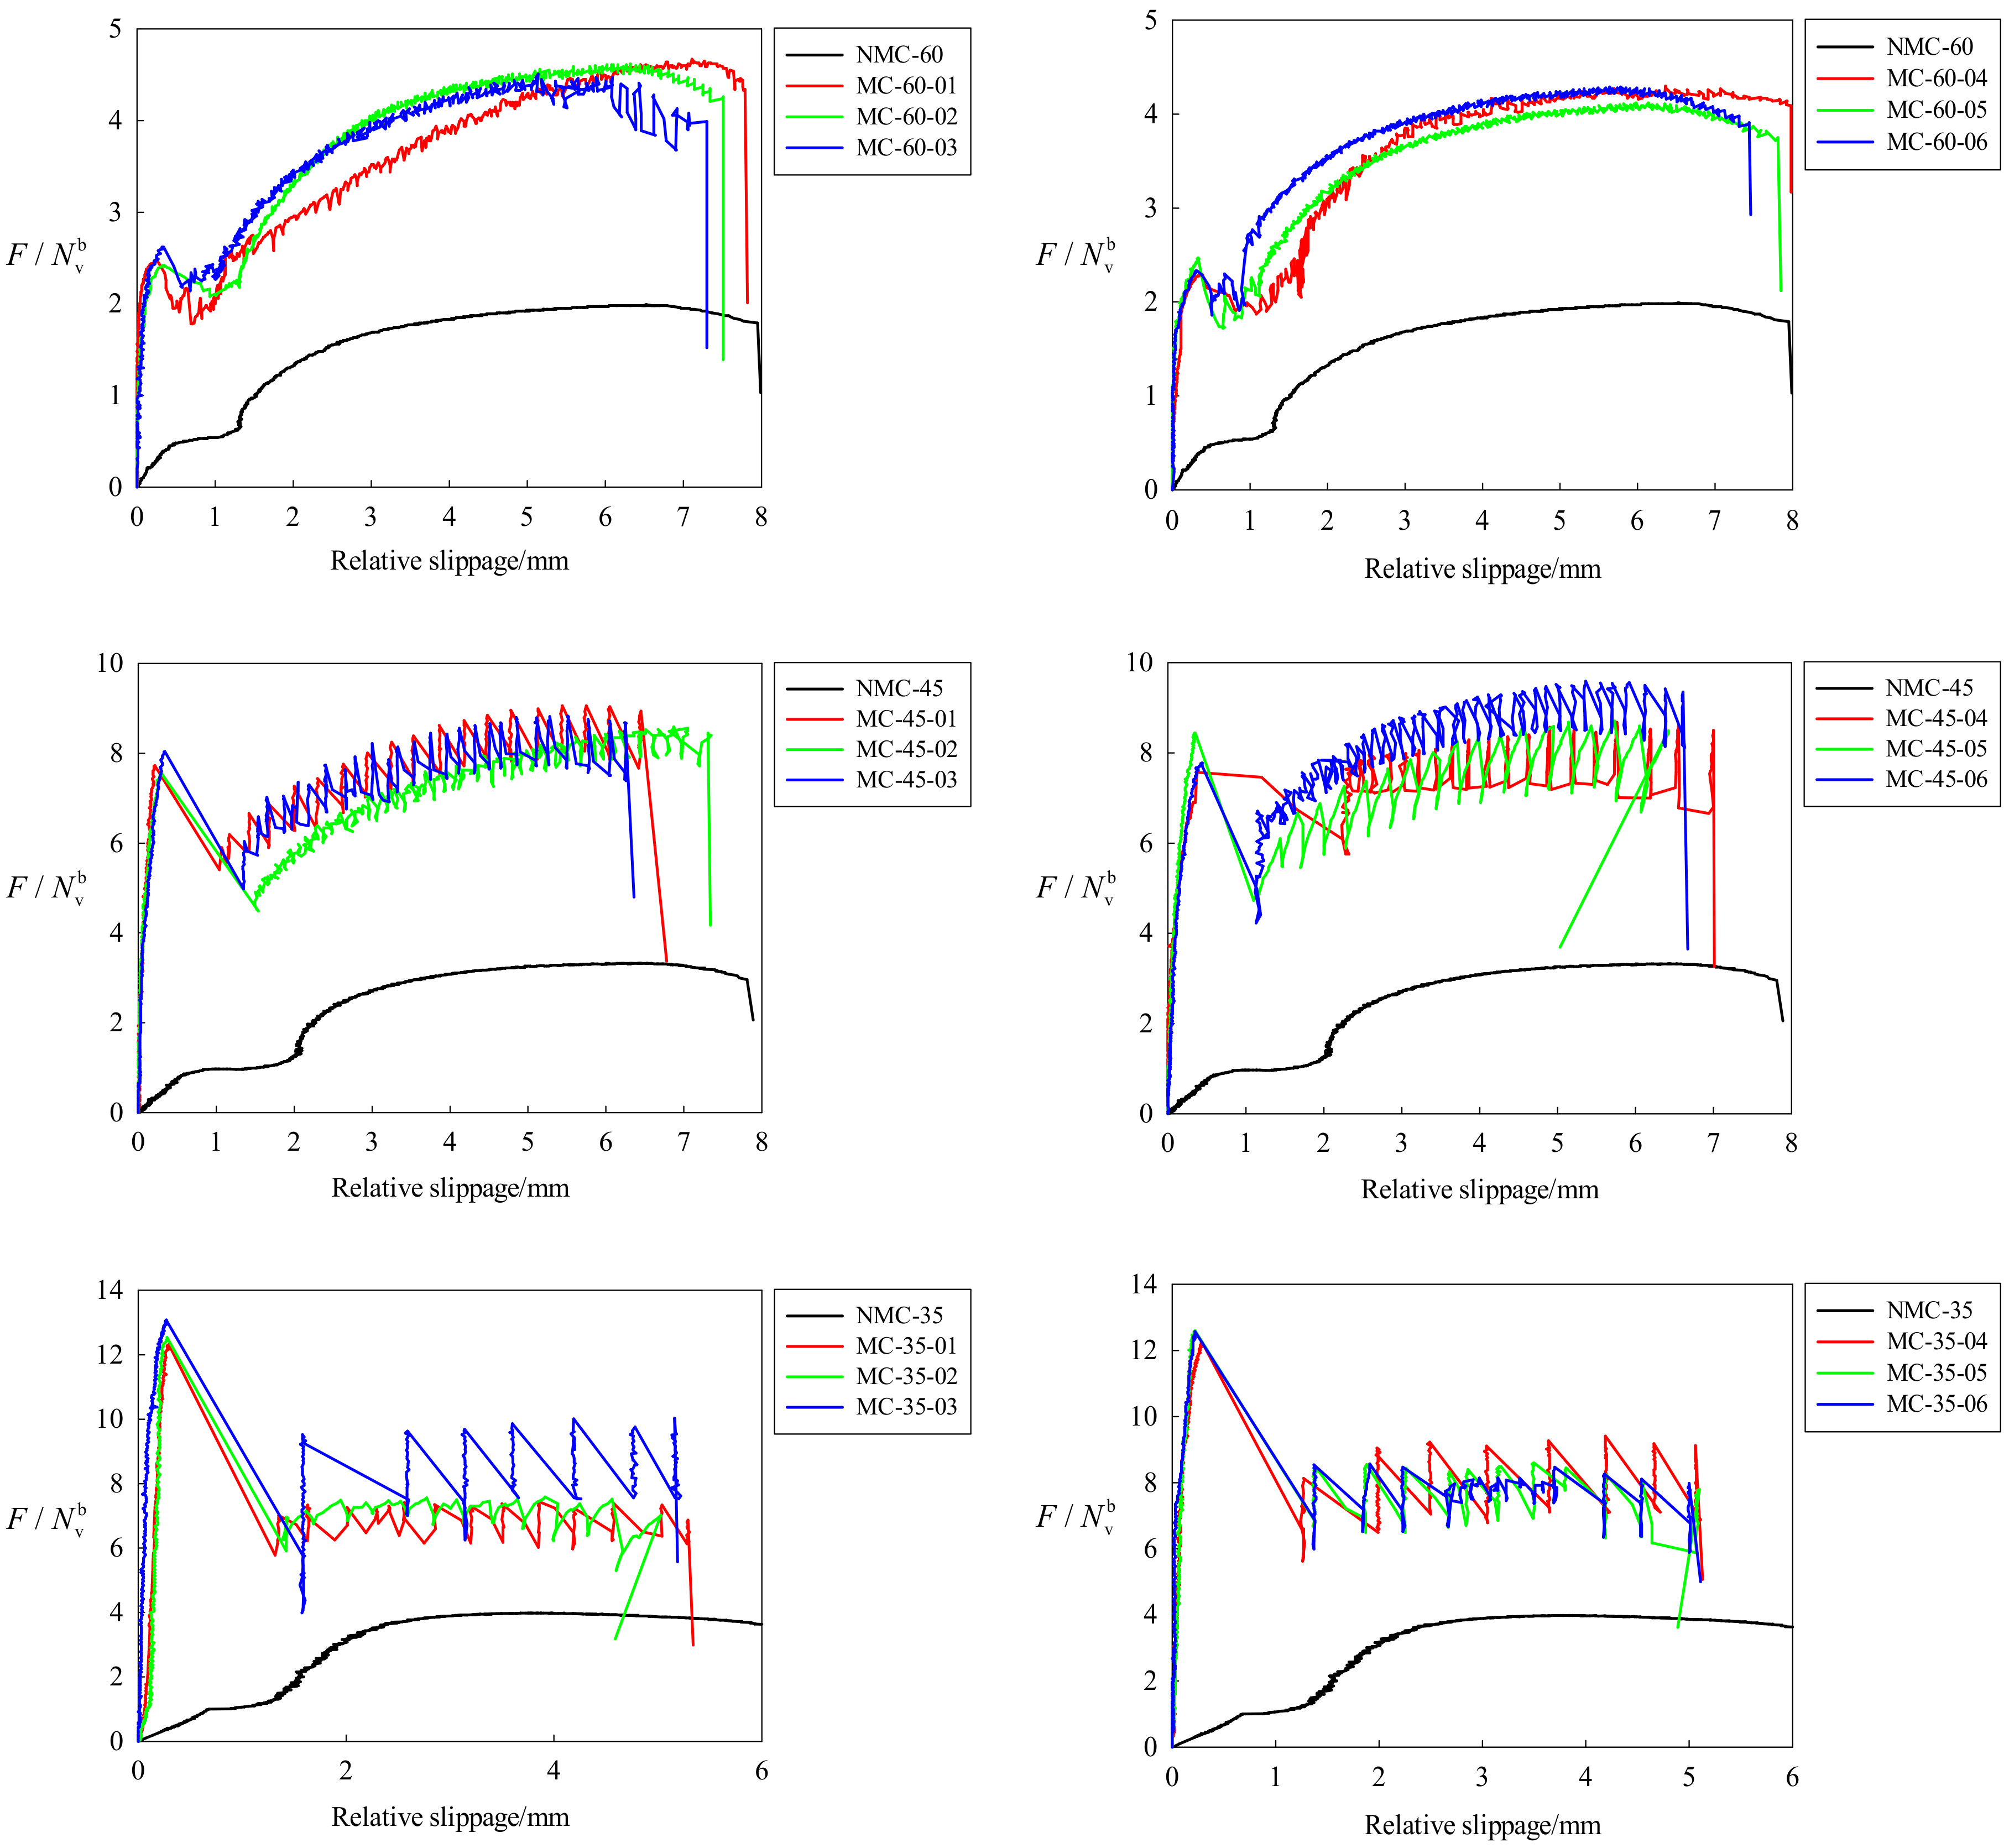
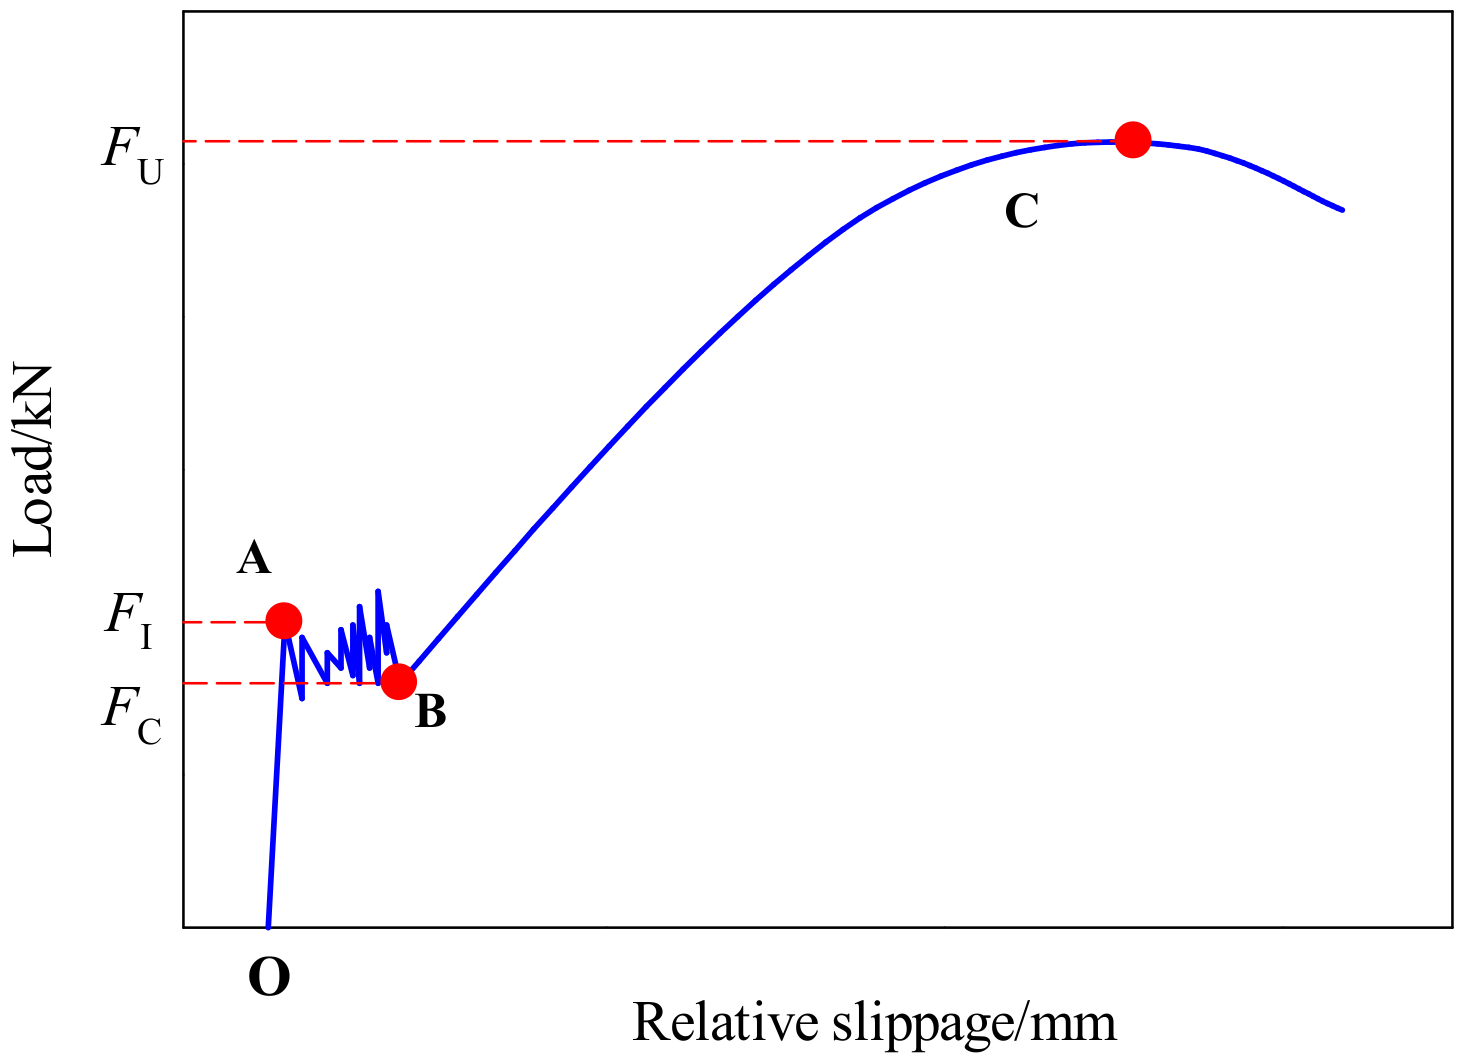
4.2. Relationship between Compressive Load and Relative Slippage of the Two Connecting Plates

Figure 8 shows the curves between compressive load and relative slippage of the two connecting plates of each specimen. Before the first slip, the curves were rather straight, indicating that the specimens were in elastic state. The curves nosedived at the first slip, causing the PTM to unload. With the growing compressive load, the MC-60 curves zigzagged into the yield stage and then into the slip-unload hardening stage, while the MC-45 and MC-35 directly entered into the hardening stage. Eventually, the bolts were cut off once the load surpassed the ultimate strength of specimens.
It could be concluded that: (1) the MC-60 curves covered four stages: elastic stage, yield stage, hardening stage and failure stage; (2) the MC-45 and MC-35 specimens had large initial slippages, pressing the bolt to the hole wall of the connecting plate, which is why these specimens skipped the yield stage before entering the hardening stage; (3) after the initial slip under a huge load, buckling of local rough contact surfaces occurred, the degree of mechanical occlusion also changed, the friction coefficient of MC-35 contact surfaces decreased, and the anti-slip bearing capacity reduced. The mechanical properties of specimens were weakened, and their ultimate strength fell below the initial friction load; therefore, the MC-35 curves cover only two stages: elastic stage and failure stage; (4) the growing shear–compression ratio suppressed the initial friction load and intensified curve fluctuations, shortened time to enter the hardening stage and reduced the total slippage and (5) there was no “slip–unload–load–slip” process on the buttered specimen, and the zigzag curve did not fluctuate obviously. It could be concluded that the friction coefficient had a great influence on the load–displacement curves.

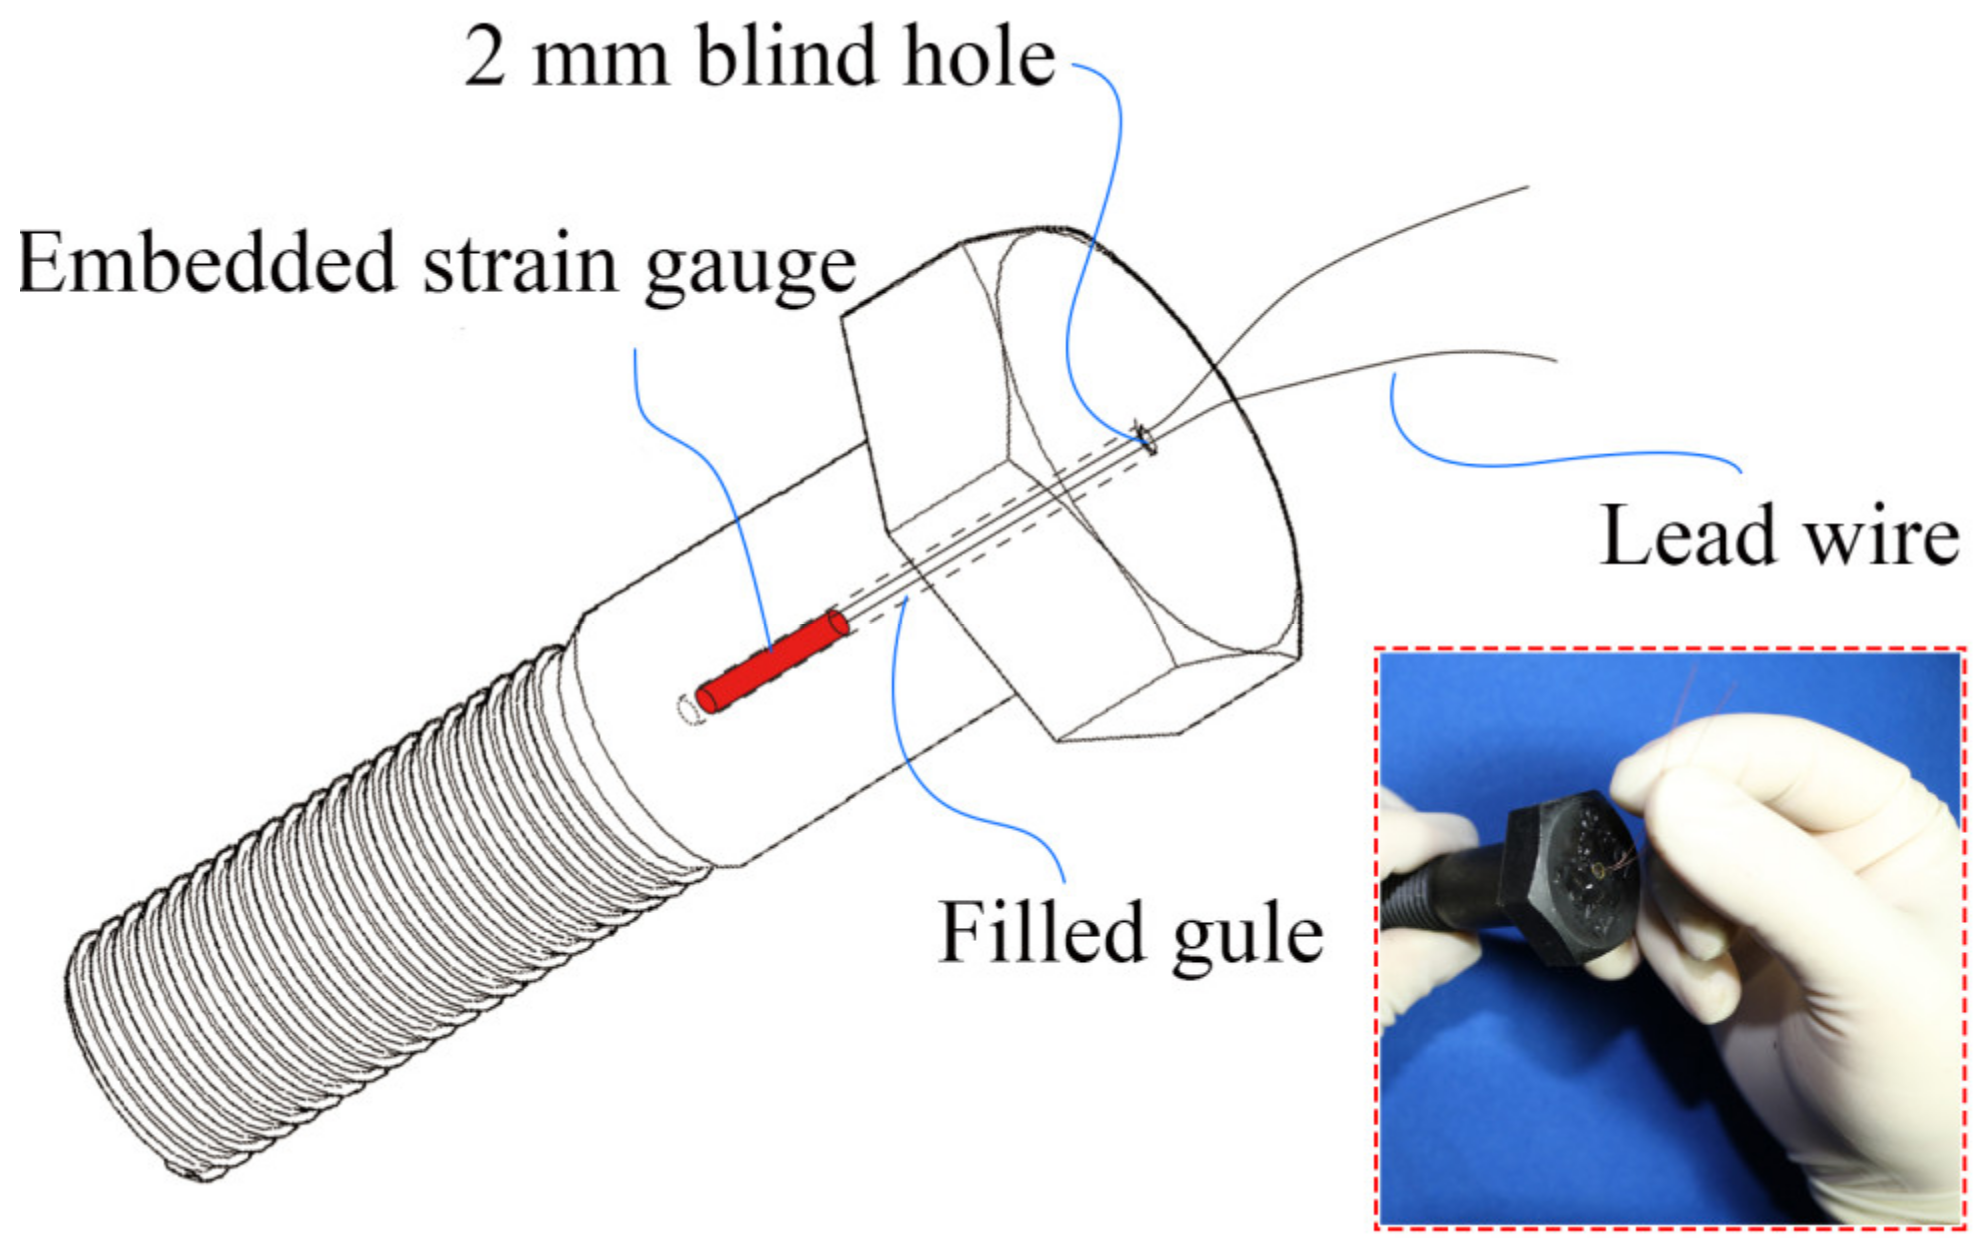
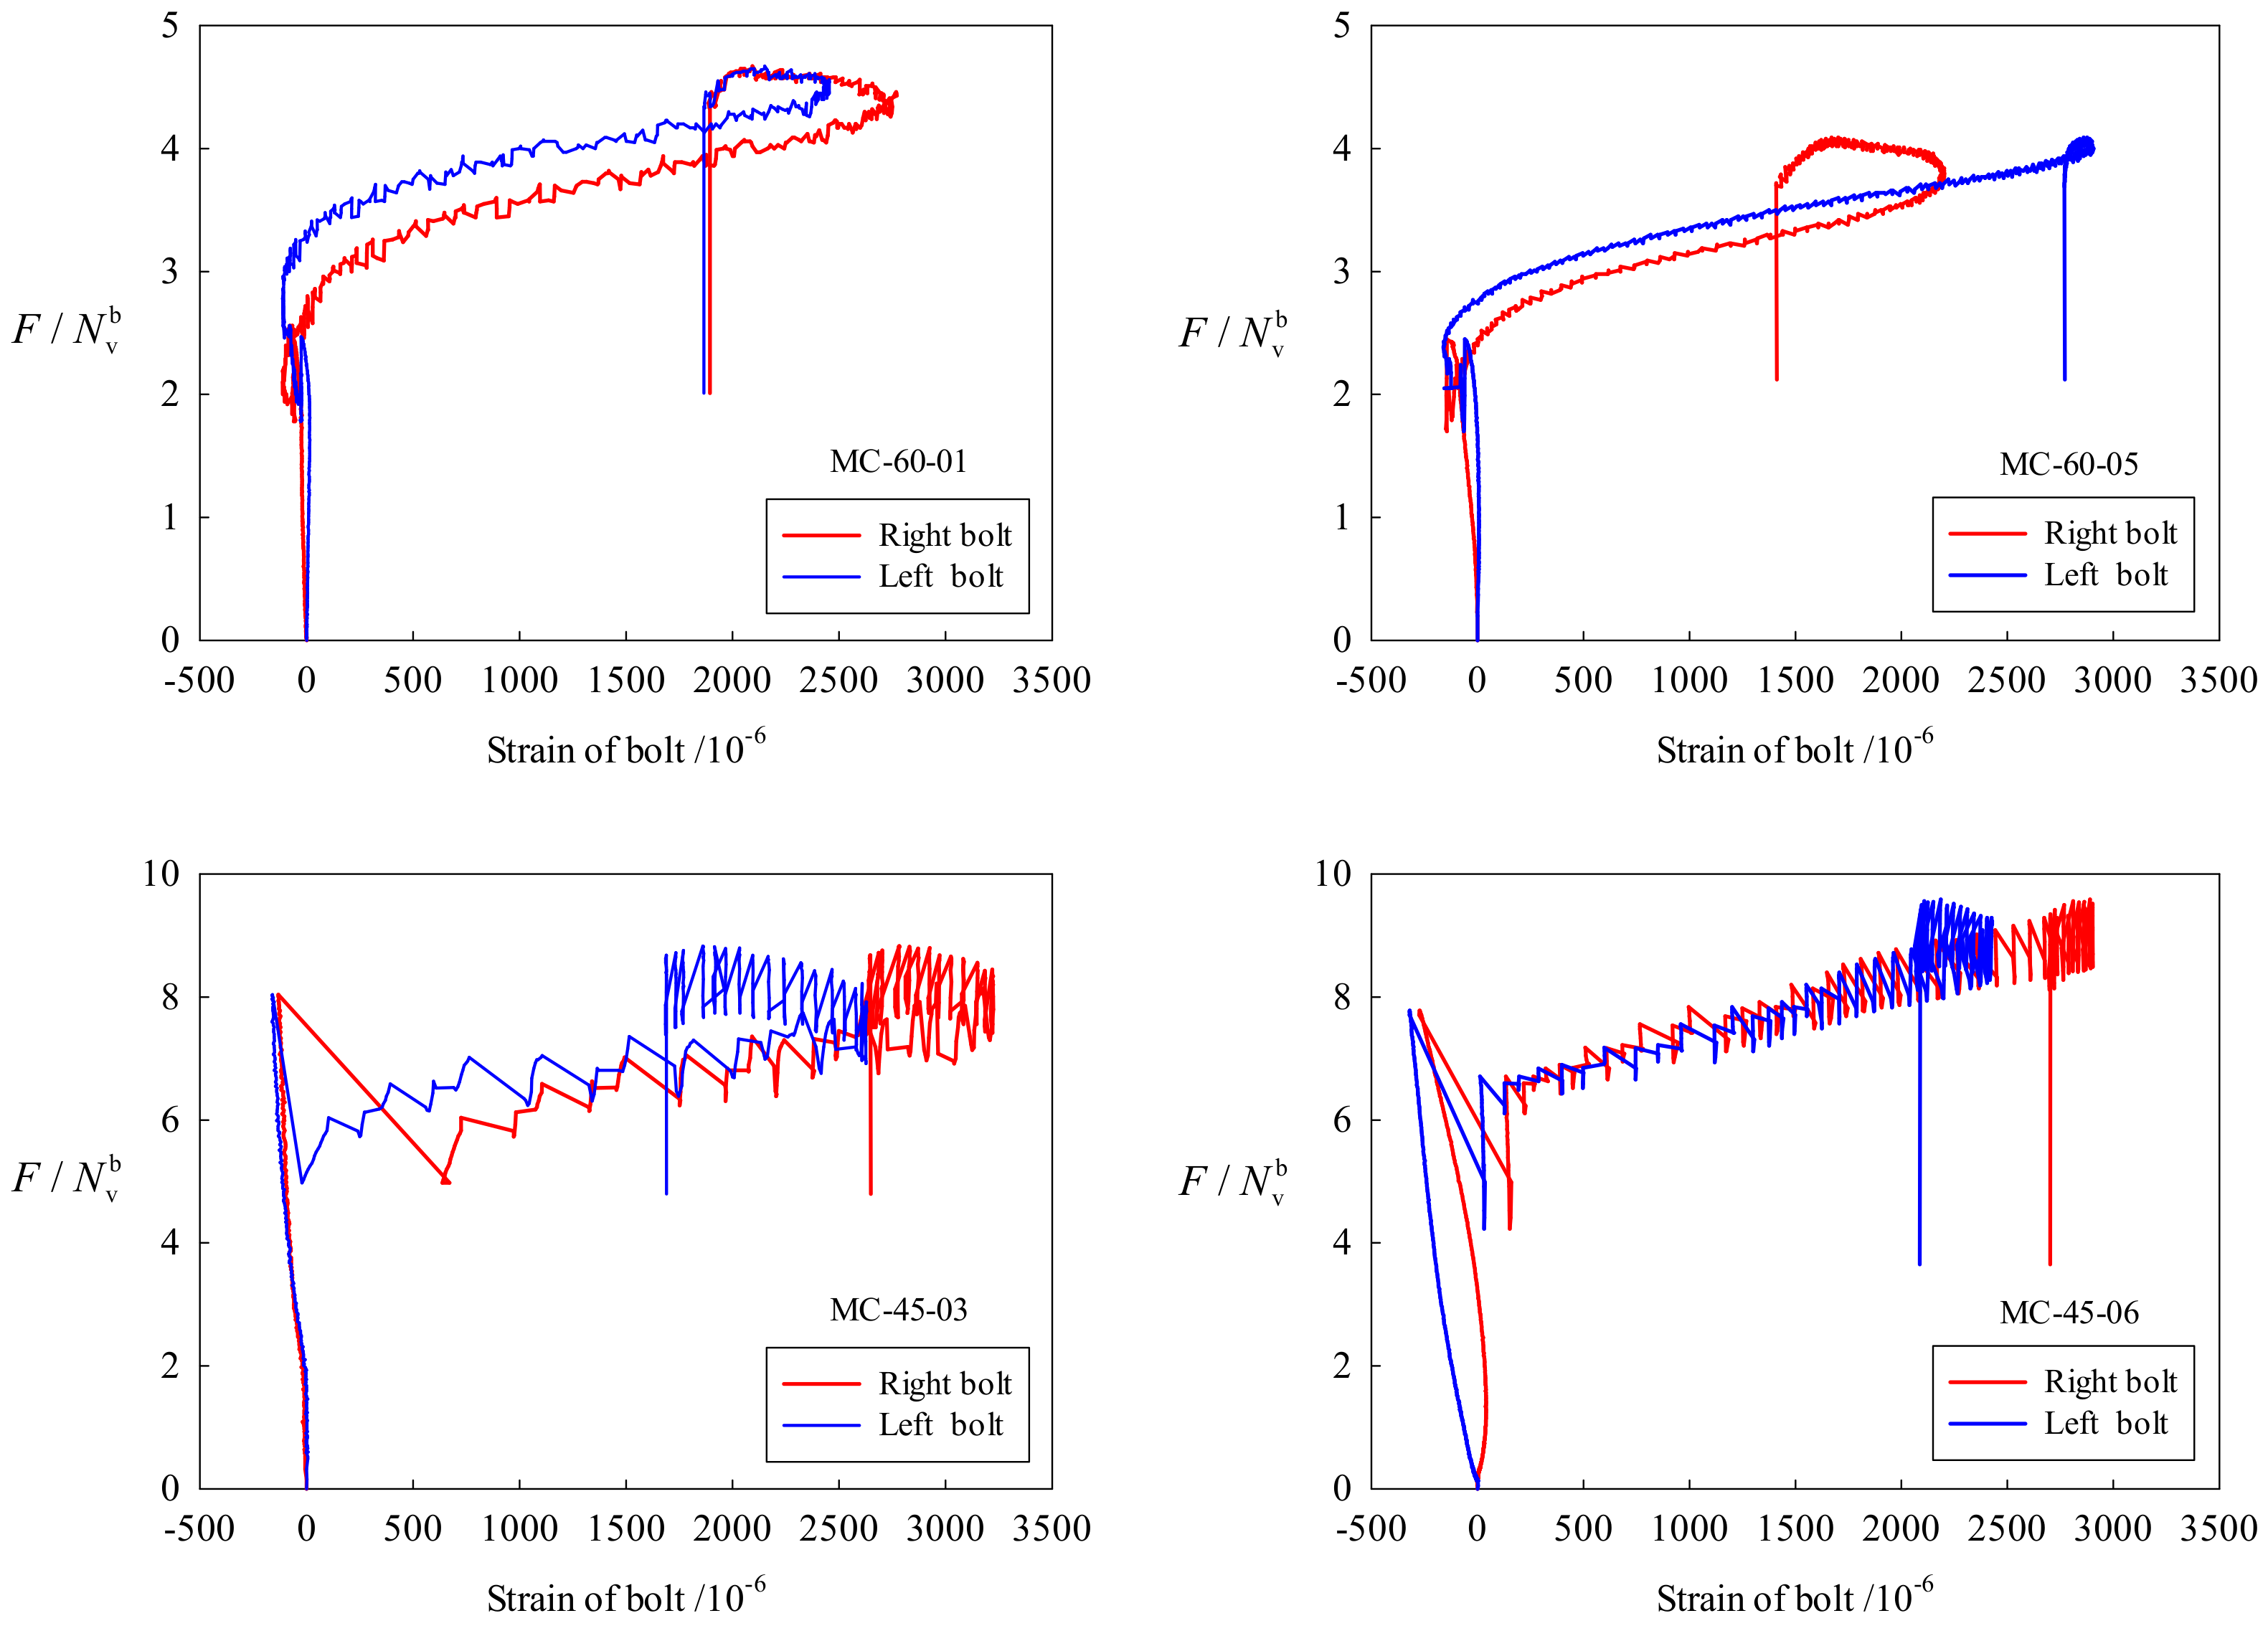
4.3. Relationship between Compression Load and Strains of Bolt

Figure 9 shows the compression load and strains of bolt curves of certain specimens. MC-35 data is relatively cluttered and not listed. The strain loss of bolts was very slightly in the compressive direction before first slipping. After exceeding the initial friction load, the strain of the bolt also increased and fluctuated in accordance with the compression load–relative slippage curve. When the shear deformation of the bolt reached a certain degree, the strain of the bolt decreased gradually, and the bolt with the largest strain reduction in this process was cut.

4.4. Relationship between Shear–Compression Ratio and Pressure Features

Three parameters were introduced to compare the mechanical properties of specimens at different shear–compression ratios (Figure 10): the initial friction load FI (point A) was defined as the first relative slip load after the static friction of connecting plates is overcome; the compressive load FC (point B) was defined as the load when the bolt is pressed tightly onto the hole wall of connecting plate; the ultimate strength FU (point C) was defined as the maximum load throughout the tests.

4.4.1. Initial Friction Load of FHSB T-Stub Connection

The initial friction load depends on the friction induced by bolt clamping force and its compressive component. Any change to the bolt clamping force will cause the friction between connecting plates to change. The designed shear capacity that a HSB provides to the connection can be expressed as [22]:
N v b = 0.9 n μ n f P ,
where, n is the number of HSBs; nf is the number of friction surfaces; P is the designed clamping force of a HSB and μ is the anti-slip coefficient of contact surfaces and the usual value is 0.3–0.5.
The tangential component of initial friction load of the contact surfaces can be described as:
F v = F I sin θ ,
Then, the improved coefficient of anti-slip bearing capacity (referred to as “improved coefficient”) can be defined as [29]:
v = F v N v b = 10 F I sin θ 9 n μ n f P ,
As the shear–compression ratio dropped from 0.70 through 1.00–1.73, the mean improved coefficient decreased from 7.21 through 5.55–2.12.

4.4.2. Ultimate Strength of FHSB T-Stub Connection

The smaller the ratio, the closer the ultimate strength is to the initial friction load. The mean ultimate strengths of MC-60, MC-45 and MC-35 specimens were 2207.95 kN, 1570.78 kN and 788.60 kN, respectively. Table 4 provides the initial friction load, ultimate strength and the improved coefficient of each specimen.

5. Finite Element Method (FEM) based Numerical Simulations

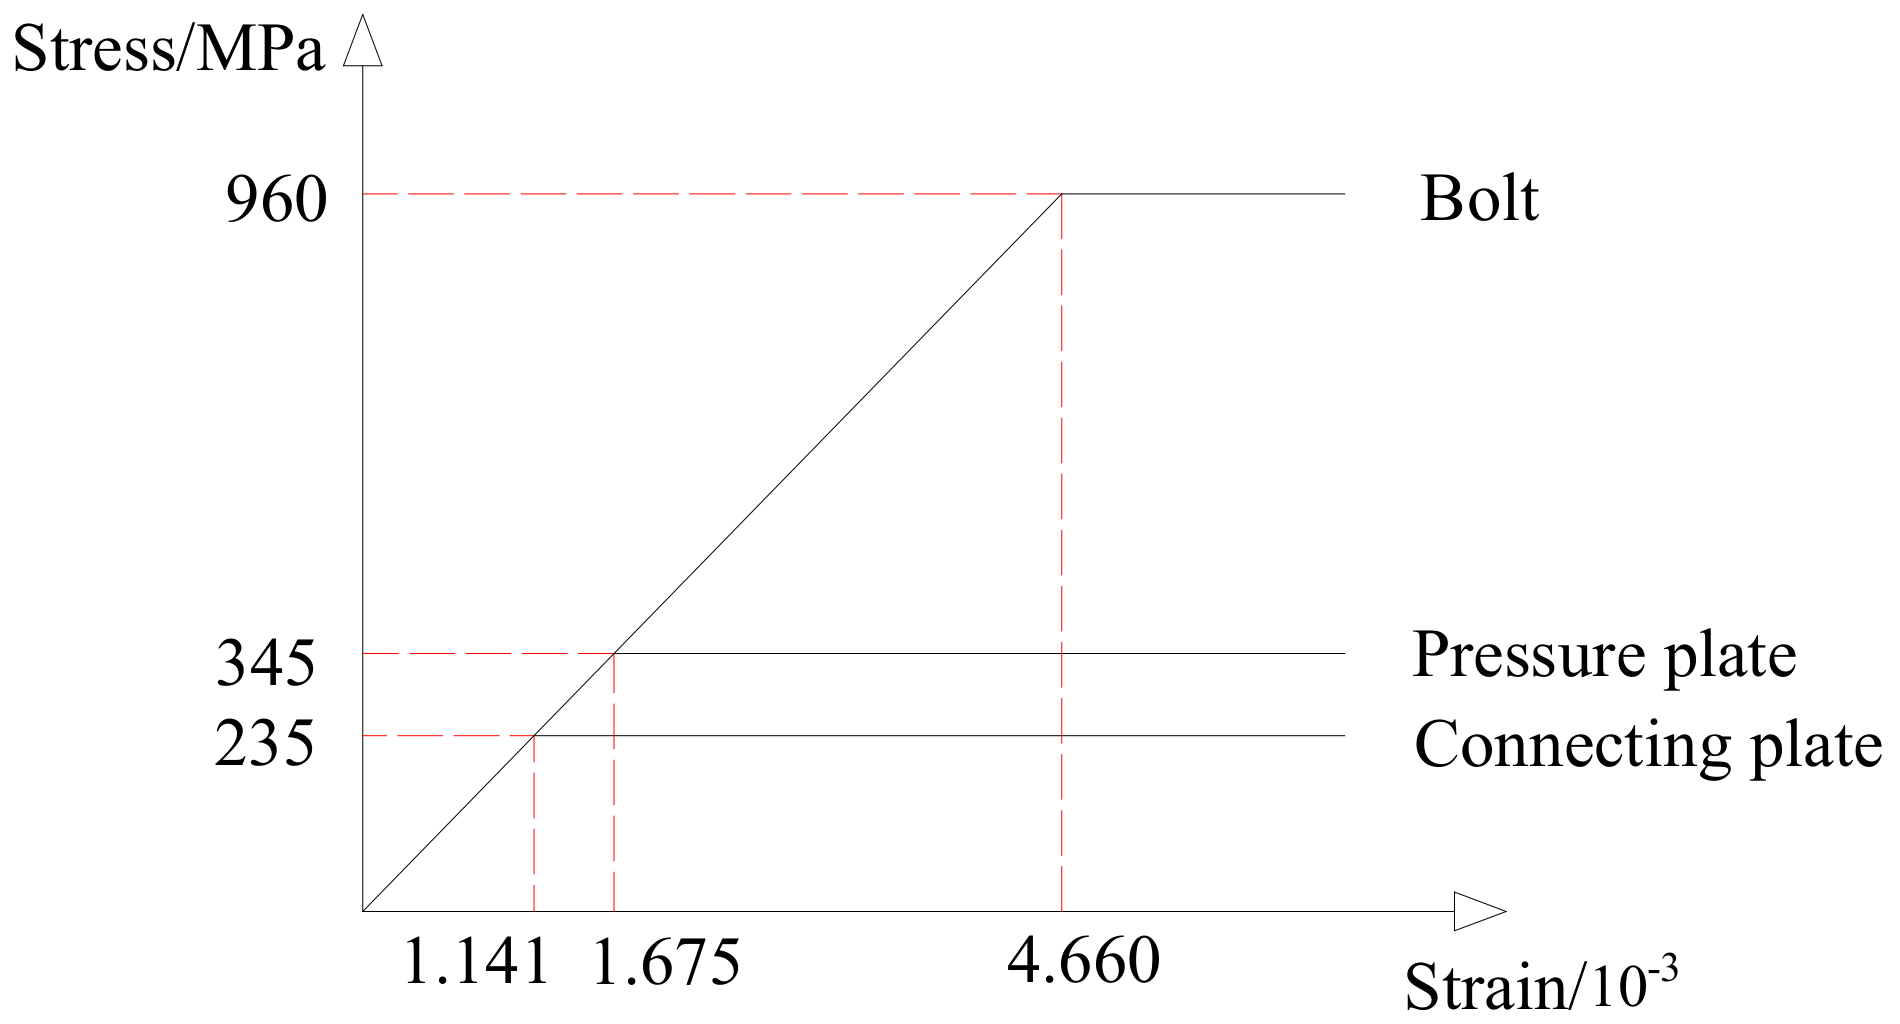
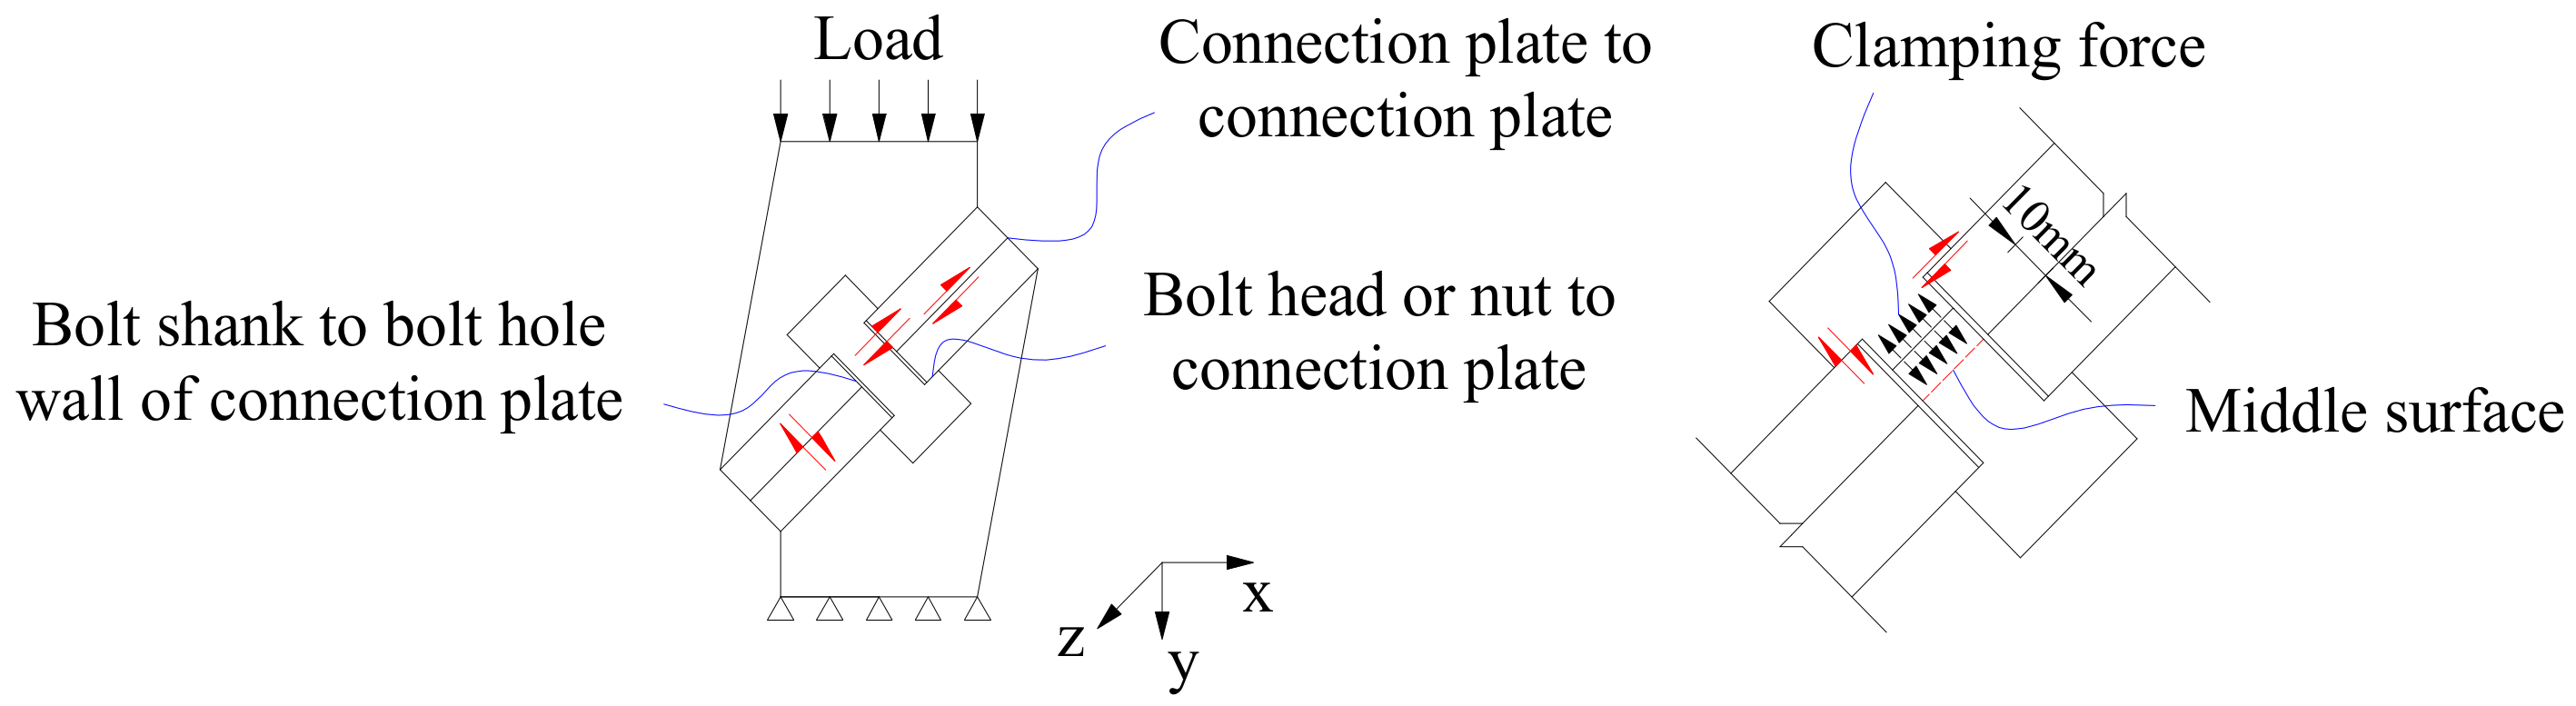
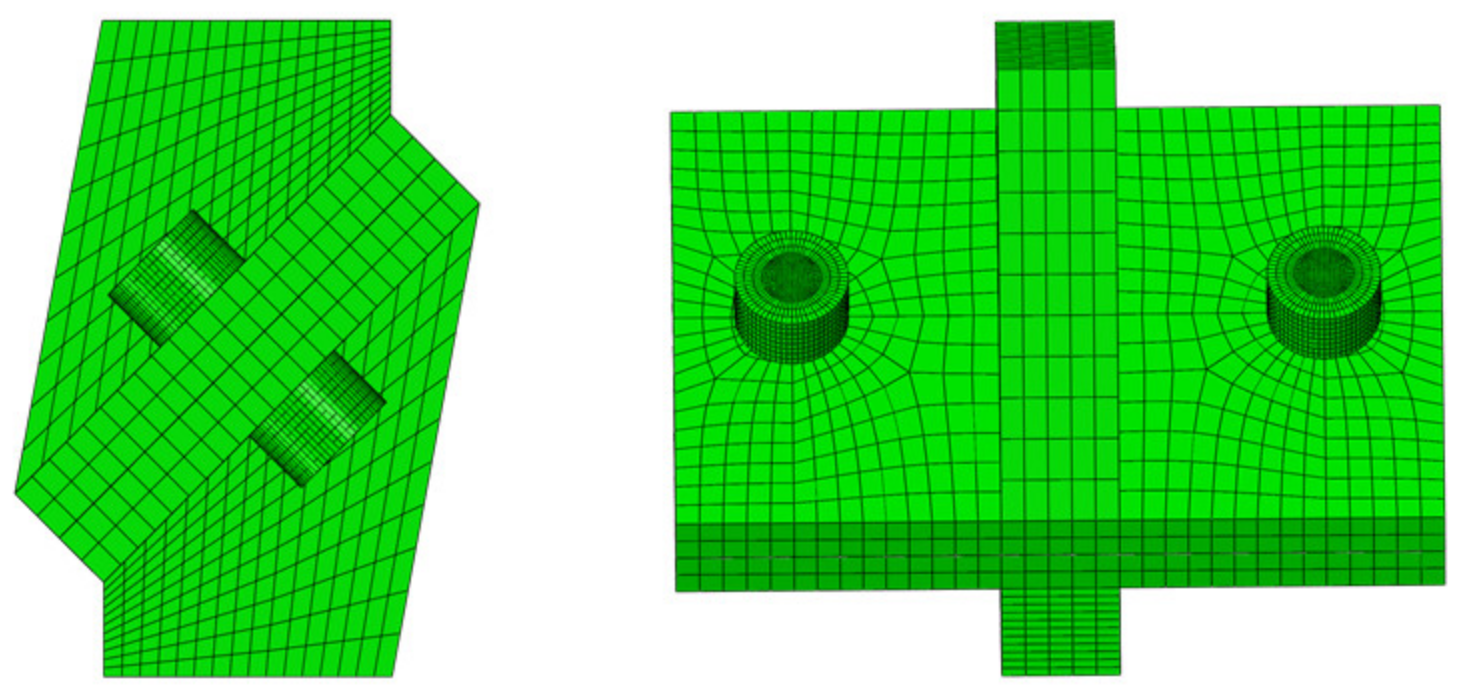
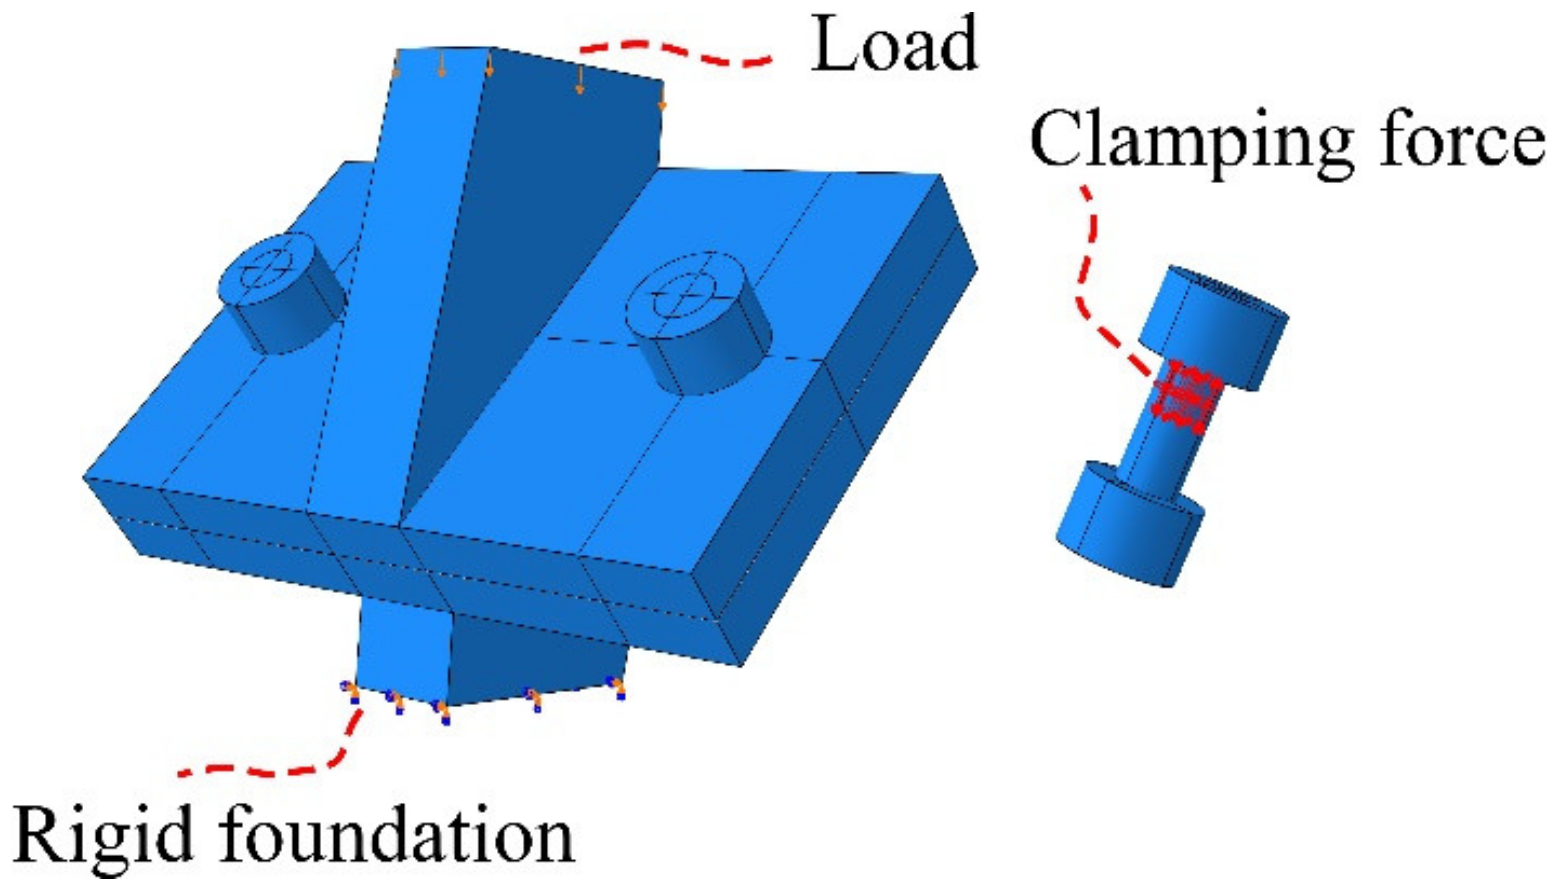
5.1. Finite-Element Modeling

The FHSB T-stub connection was simulated as C3D8R elements of ABAQUS [30,31]. Due to the ultimate strength of the MC-35 FE model is higher than the test value, the yield strengths of the MC-35 pressure plates were set to 550 MPa, and others were set to the test values; the yield strength of the HSB was set to 940 MPa; the material density was set to 7850 kg/m3; the Young’ modulus was set to 2.06 × 10⁶ MPa and the Poisson’s ratio was set to 0.3. The ideal elastic–plastic constitutive model was adopted in the FE model. Figure 11 shows the constitutive relation of steel.
As shown in Figure 12, surface-to-surface contact was employed to describe the contact between the following surface pairs: bolt head and connection plate, nut and connection plate, bolt shank and hole wall of connection plate, as well as the connection plate and connection plate. The above contacts were considered as hard contacts in the normal direction, and isotropic Coulomb friction contacts in the tangential direction [32]. For the tangential behavior, a penalty friction of 0.2 was applied [33,34]. The friction coefficient was defined as 0.588 (measured value) between connecting plates. Washers were not taken into account [9,35]. The structural mesh generation technique was used for the FE model, and the mesh generation size was 0.008. Mesh generation of MC-45 FE model is shown as in Figure 13.
Figure 14 shows the boundary conditions application of the clamping force of the FE model. All degrees of freedom on the edge of the bottom pressure plate are limited. The model was loaded with a 15 mm displacement along the Y direction of the pressure plate. During the modeling, the initial clamping force of bolt was simulated by the bolt load imposed on the specific section of the HSB. Next, the initial clamping force of bolt was applied by the “bolt load” command at the 3/4 section of the shank.

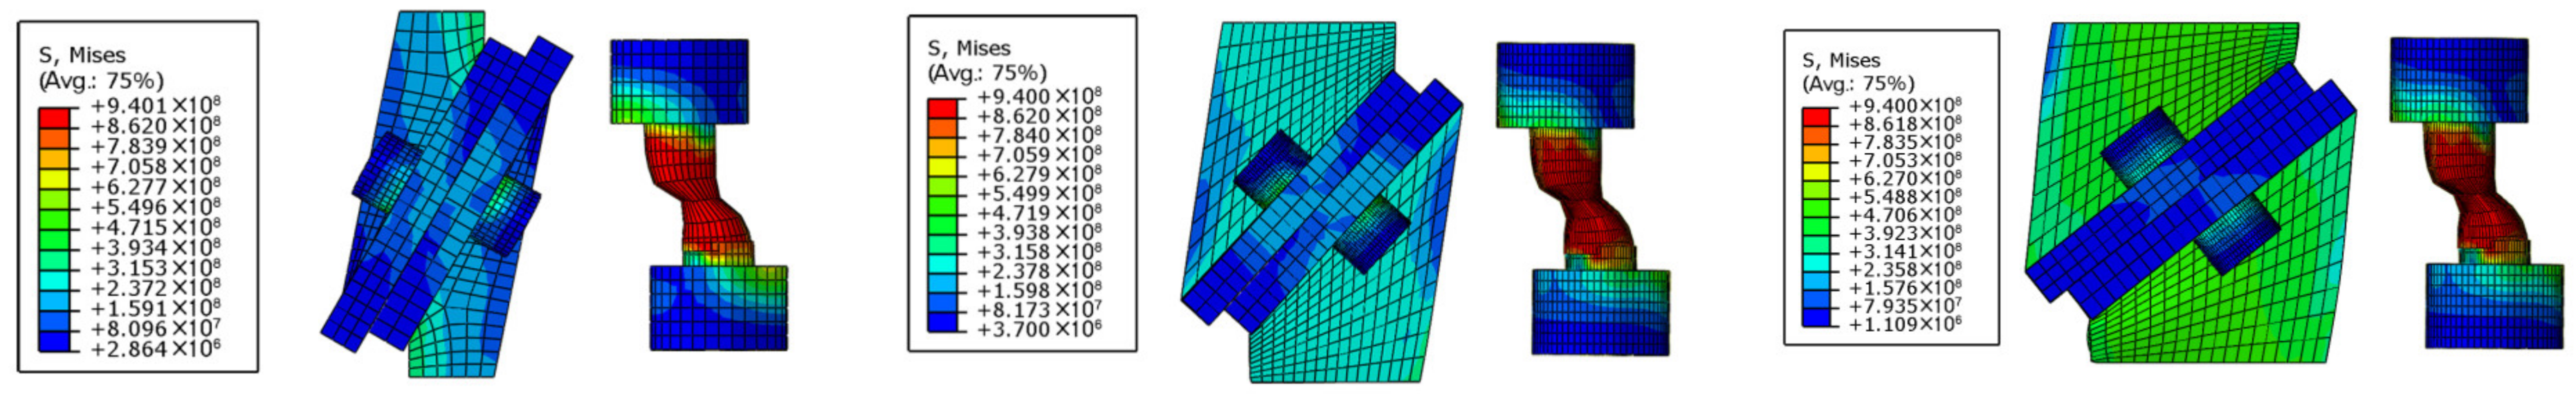
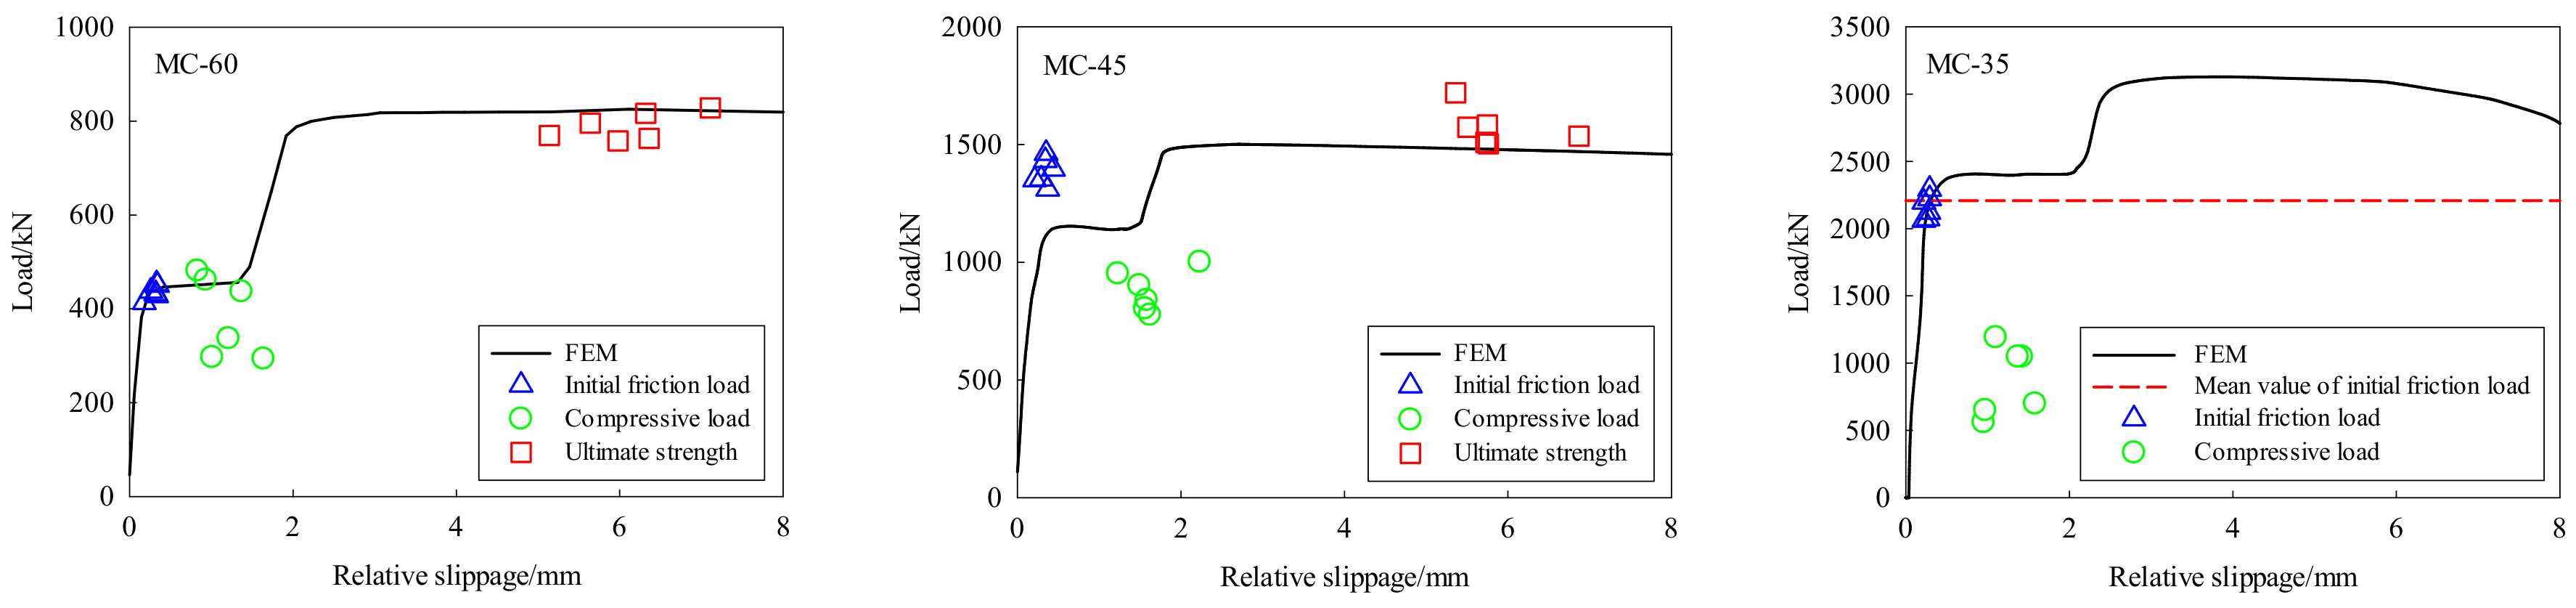
5.2. Validation of Test Results

Figure 15 is the stress nephograms of MC-60, MC-45 and MC-35 FE models. The failure mode and stress distribution are well shown in the figure.
Figure 16 compares the simulated and test curves between the compressive load and relative slippage of MC-60, MC-45 and MC-35 specimens. It can be seen that the absolute error between the simulated and tested initial friction loads was within 10%, while the simulated compressive loads were generally below the test results. This is because the FE model used a uniform displacement load, which did not reflect the slip–unload–load–slip process in the actual loading. After the first slippage, the compressive load–relative slippage curves in Figure 8 were zigzag curves, and the FE model failed to simulate the “slip–unload–load–slip” process, and the compressive load–relative slippage curves were smooth. Positive correlation was between the initial friction load and the shear–compression ratio. After the initial slip under a huge load, the anti-slip bearing capacity was reduced, the ultimate strength of MC-35 fell below the initial friction load. Moreover, the simulated ultimate strengths of MC-60 and MC-45 specimens were consistent with test results, while those of MC-35 specimens were generally above test results, with an average error of 29.56%. The reason is that the rough contact surfaces of MC-35 specimens were partly polished after the slip; the changing conditions of the contact surfaces cut down the friction coefficient; meanwhile, the friction coefficient was fixed during the simulation. Table 5 further compares the test results with the simulated results. In particular, the initial friction load of MC-35 specimens is the ultimate strength.

5.3. Parametric Analysis Results

A total of 144 finite-element models were selected for parametric analysis. These models differ in the friction coefficient, shear–compression ratio, bolt diameter and initial clamping force. In addition to the three groups of specimens, the specimens with the anchoring angle of 55° (λ = 1.43) was added. For the additional specimens, the dimensions of pressure plates were 30 × 65 × 172 × 40 (mm), and those of connecting plates were the same as the other specimens. During the analysis, four levels of friction coefficient (0.3, 0.4, 0.5 and 0.6), and three levels of bolt clamping force (140 kN (90% design value), 155 kN and 170 kN (110% design value)) were considered. Two bolt diameters were added: 16 mm and 22 mm. The corresponding connecting plates were 16 mm and 22 mm thick, and the corresponding bolt holes were 17.5 mm and 24 mm in diameter.

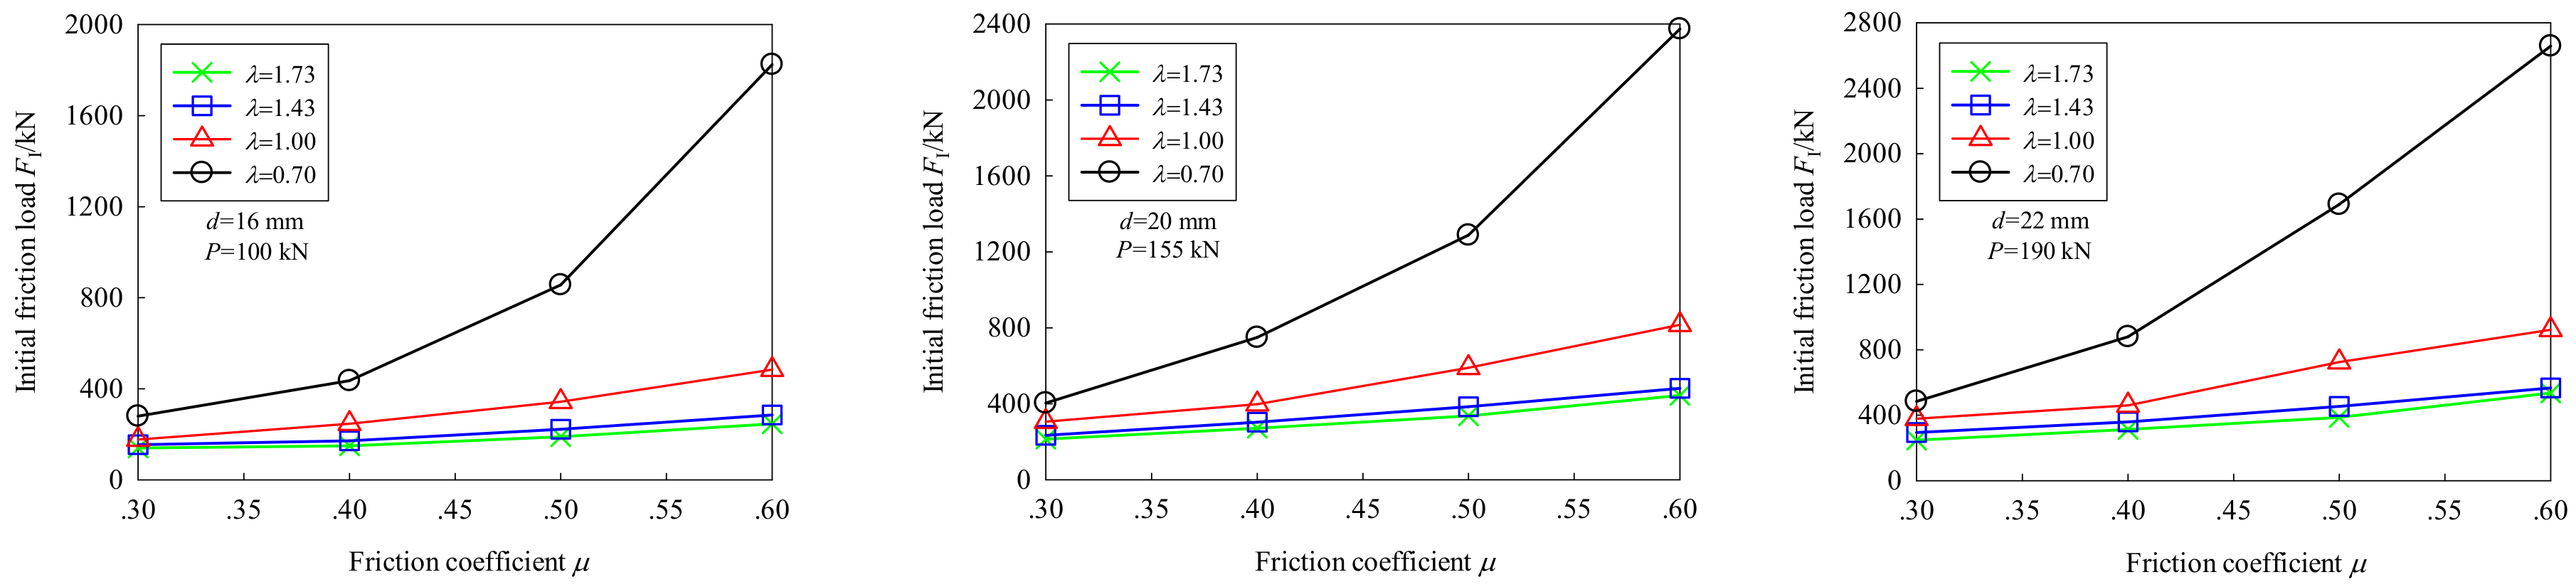
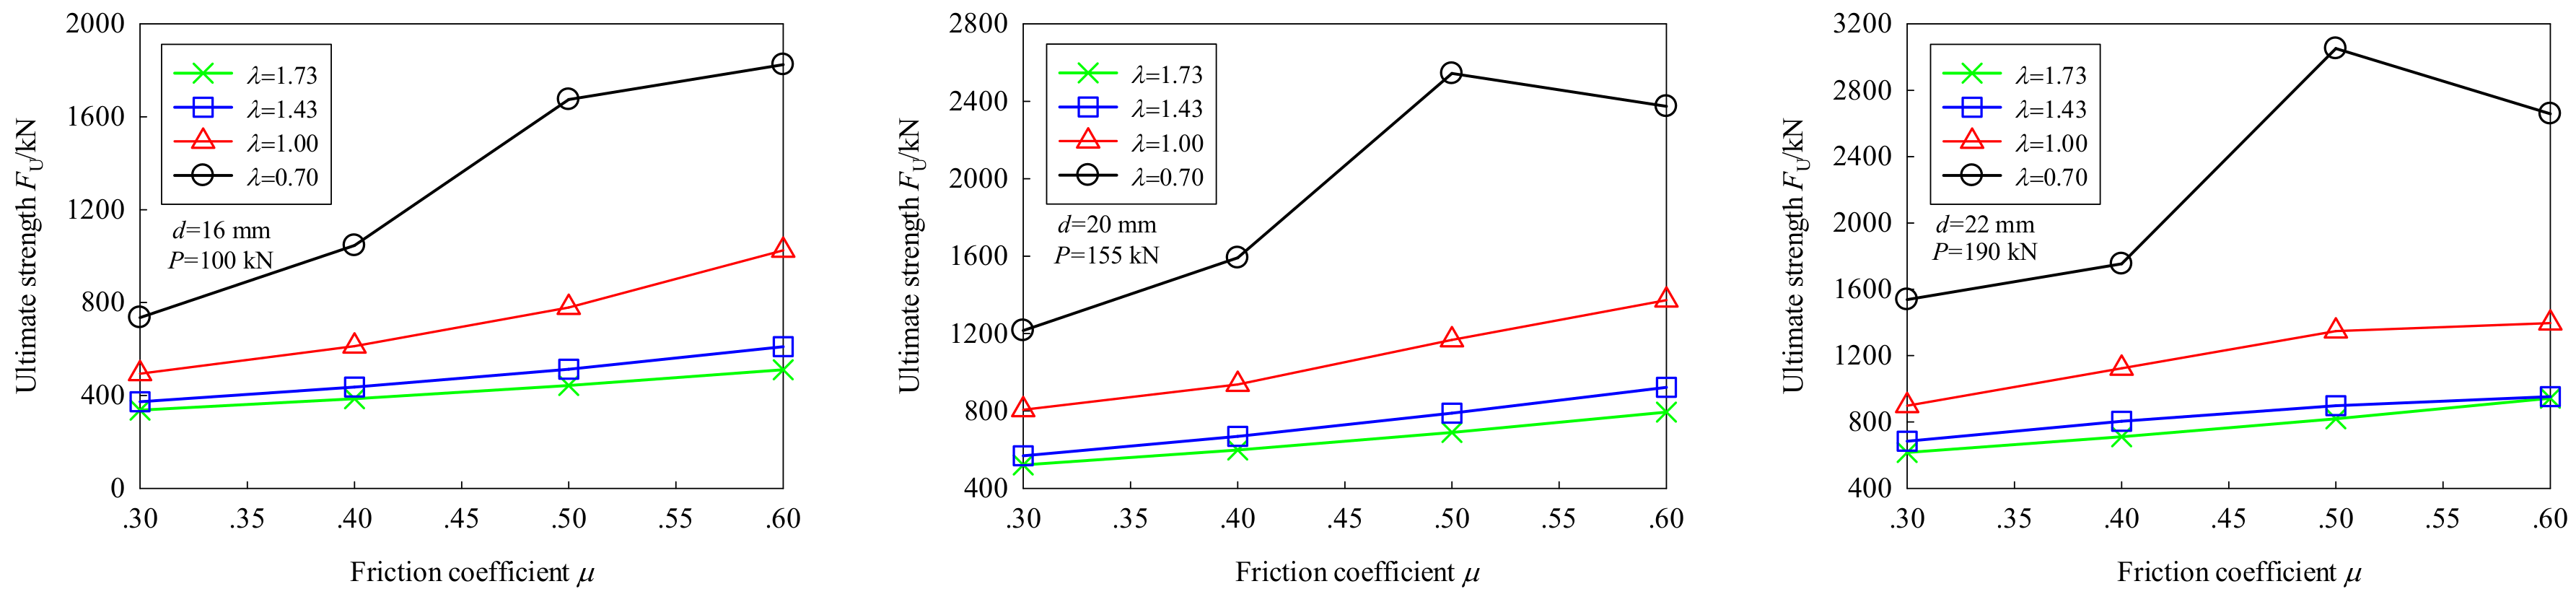
5.3.1. Effect of Friction Coefficient

Figure 17 and Figure 18 provide the correlations of friction coefficient with the initial friction load and ultimate strength, respectively. For MC-45 and MC-35 specimens, the initial friction load increased nonlinearly with the growing friction coefficient; for MC-55 and MC-60 specimens, the initial friction load increased linearly with the growing friction coefficient. The smaller the shear–compression ratio, the greater the friction coefficient affects the initial friction load. Moreover, the ultimate strength of all specimens increased linearly with the growing friction coefficient. The smaller the shear–compression ratio, the greater the friction coefficient affects the ultimate strength. For the specimens with the shear–compression ratio of 0.70 and the friction coefficient of 0.6, the ultimate strength was regarded as the initial friction load in this paper. Thus, the corresponding curve in Figure 18 is a polyline.

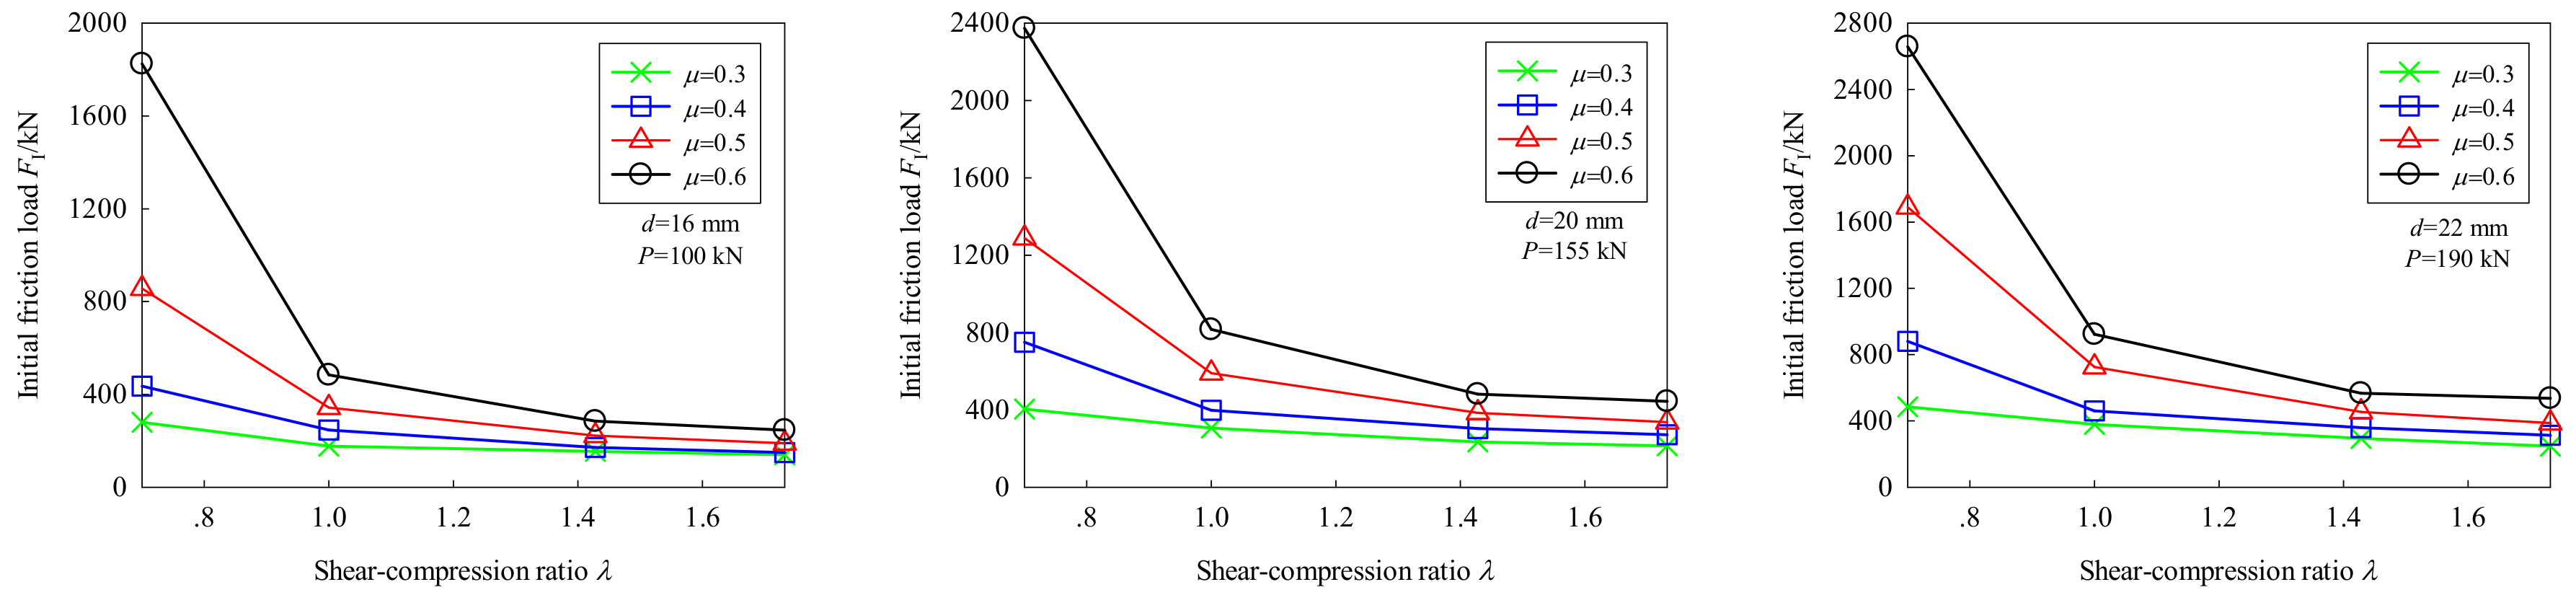
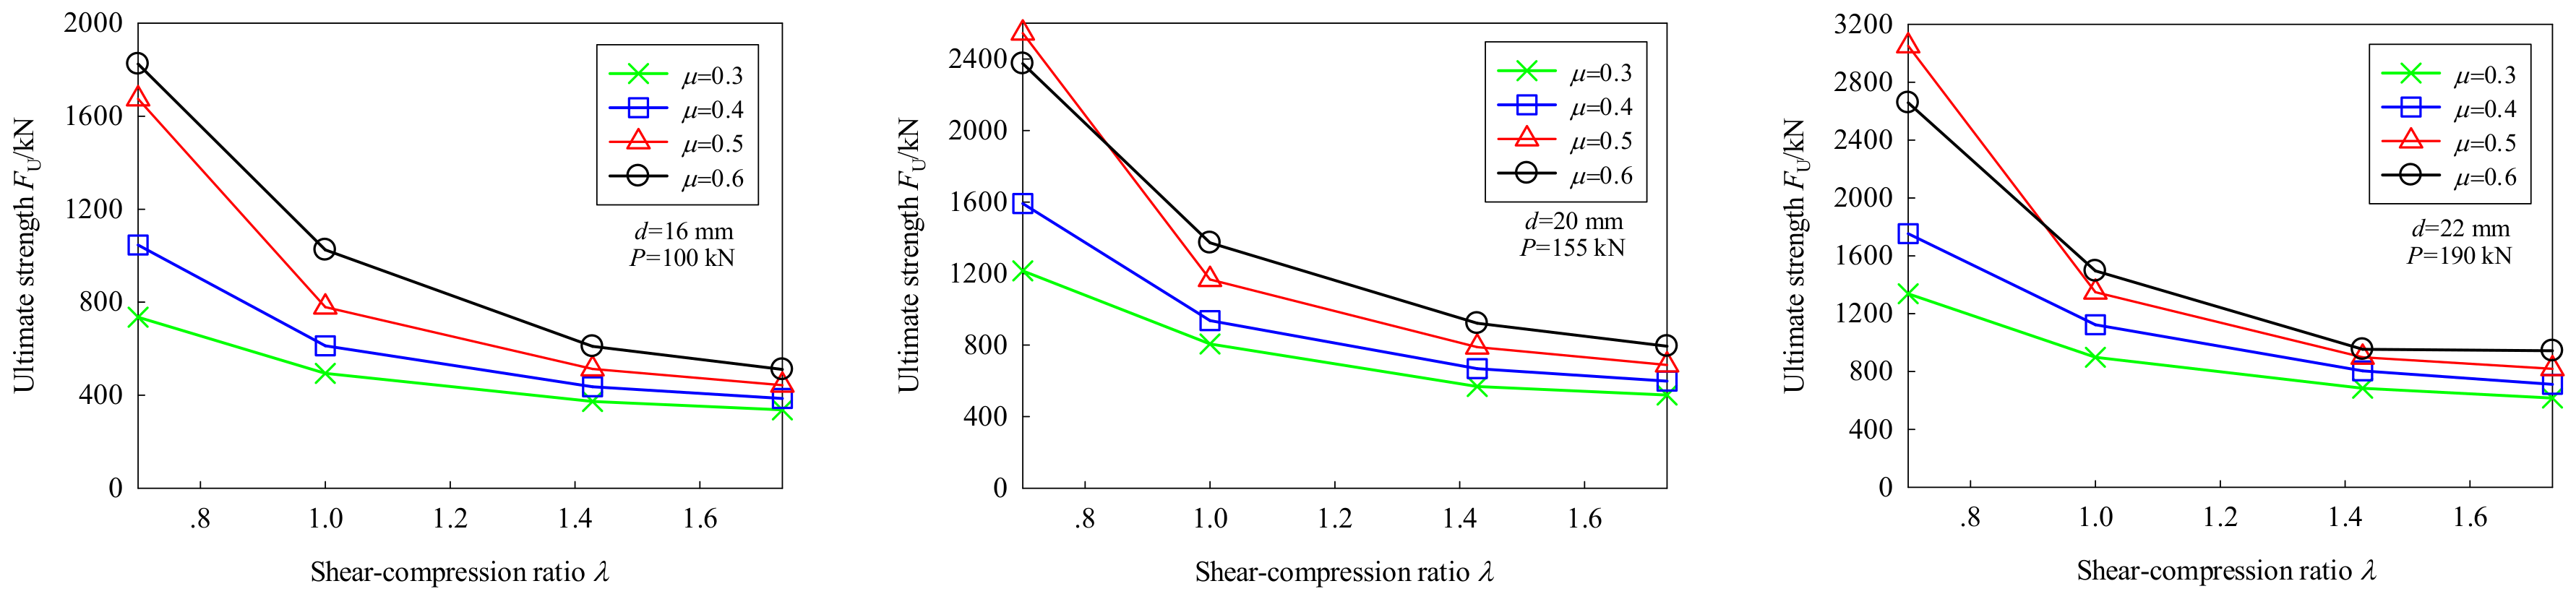
5.3.2. Effect of the Shear–Compression Ratio

Figure 19 and Figure 20 provide the correlations of shear–compression ratio with the initial friction load and ultimate strength, respectively. It can be seen that the initial friction load and ultimate strength of all specimens exhibited a nonlinear increase with the growing shear–compression ratio. Except for the specimens with λ = 0.70 and μ = 0.6, the larger the friction coefficient, the greater the shear–compression ratio affects the initial friction load and ultimate strength.

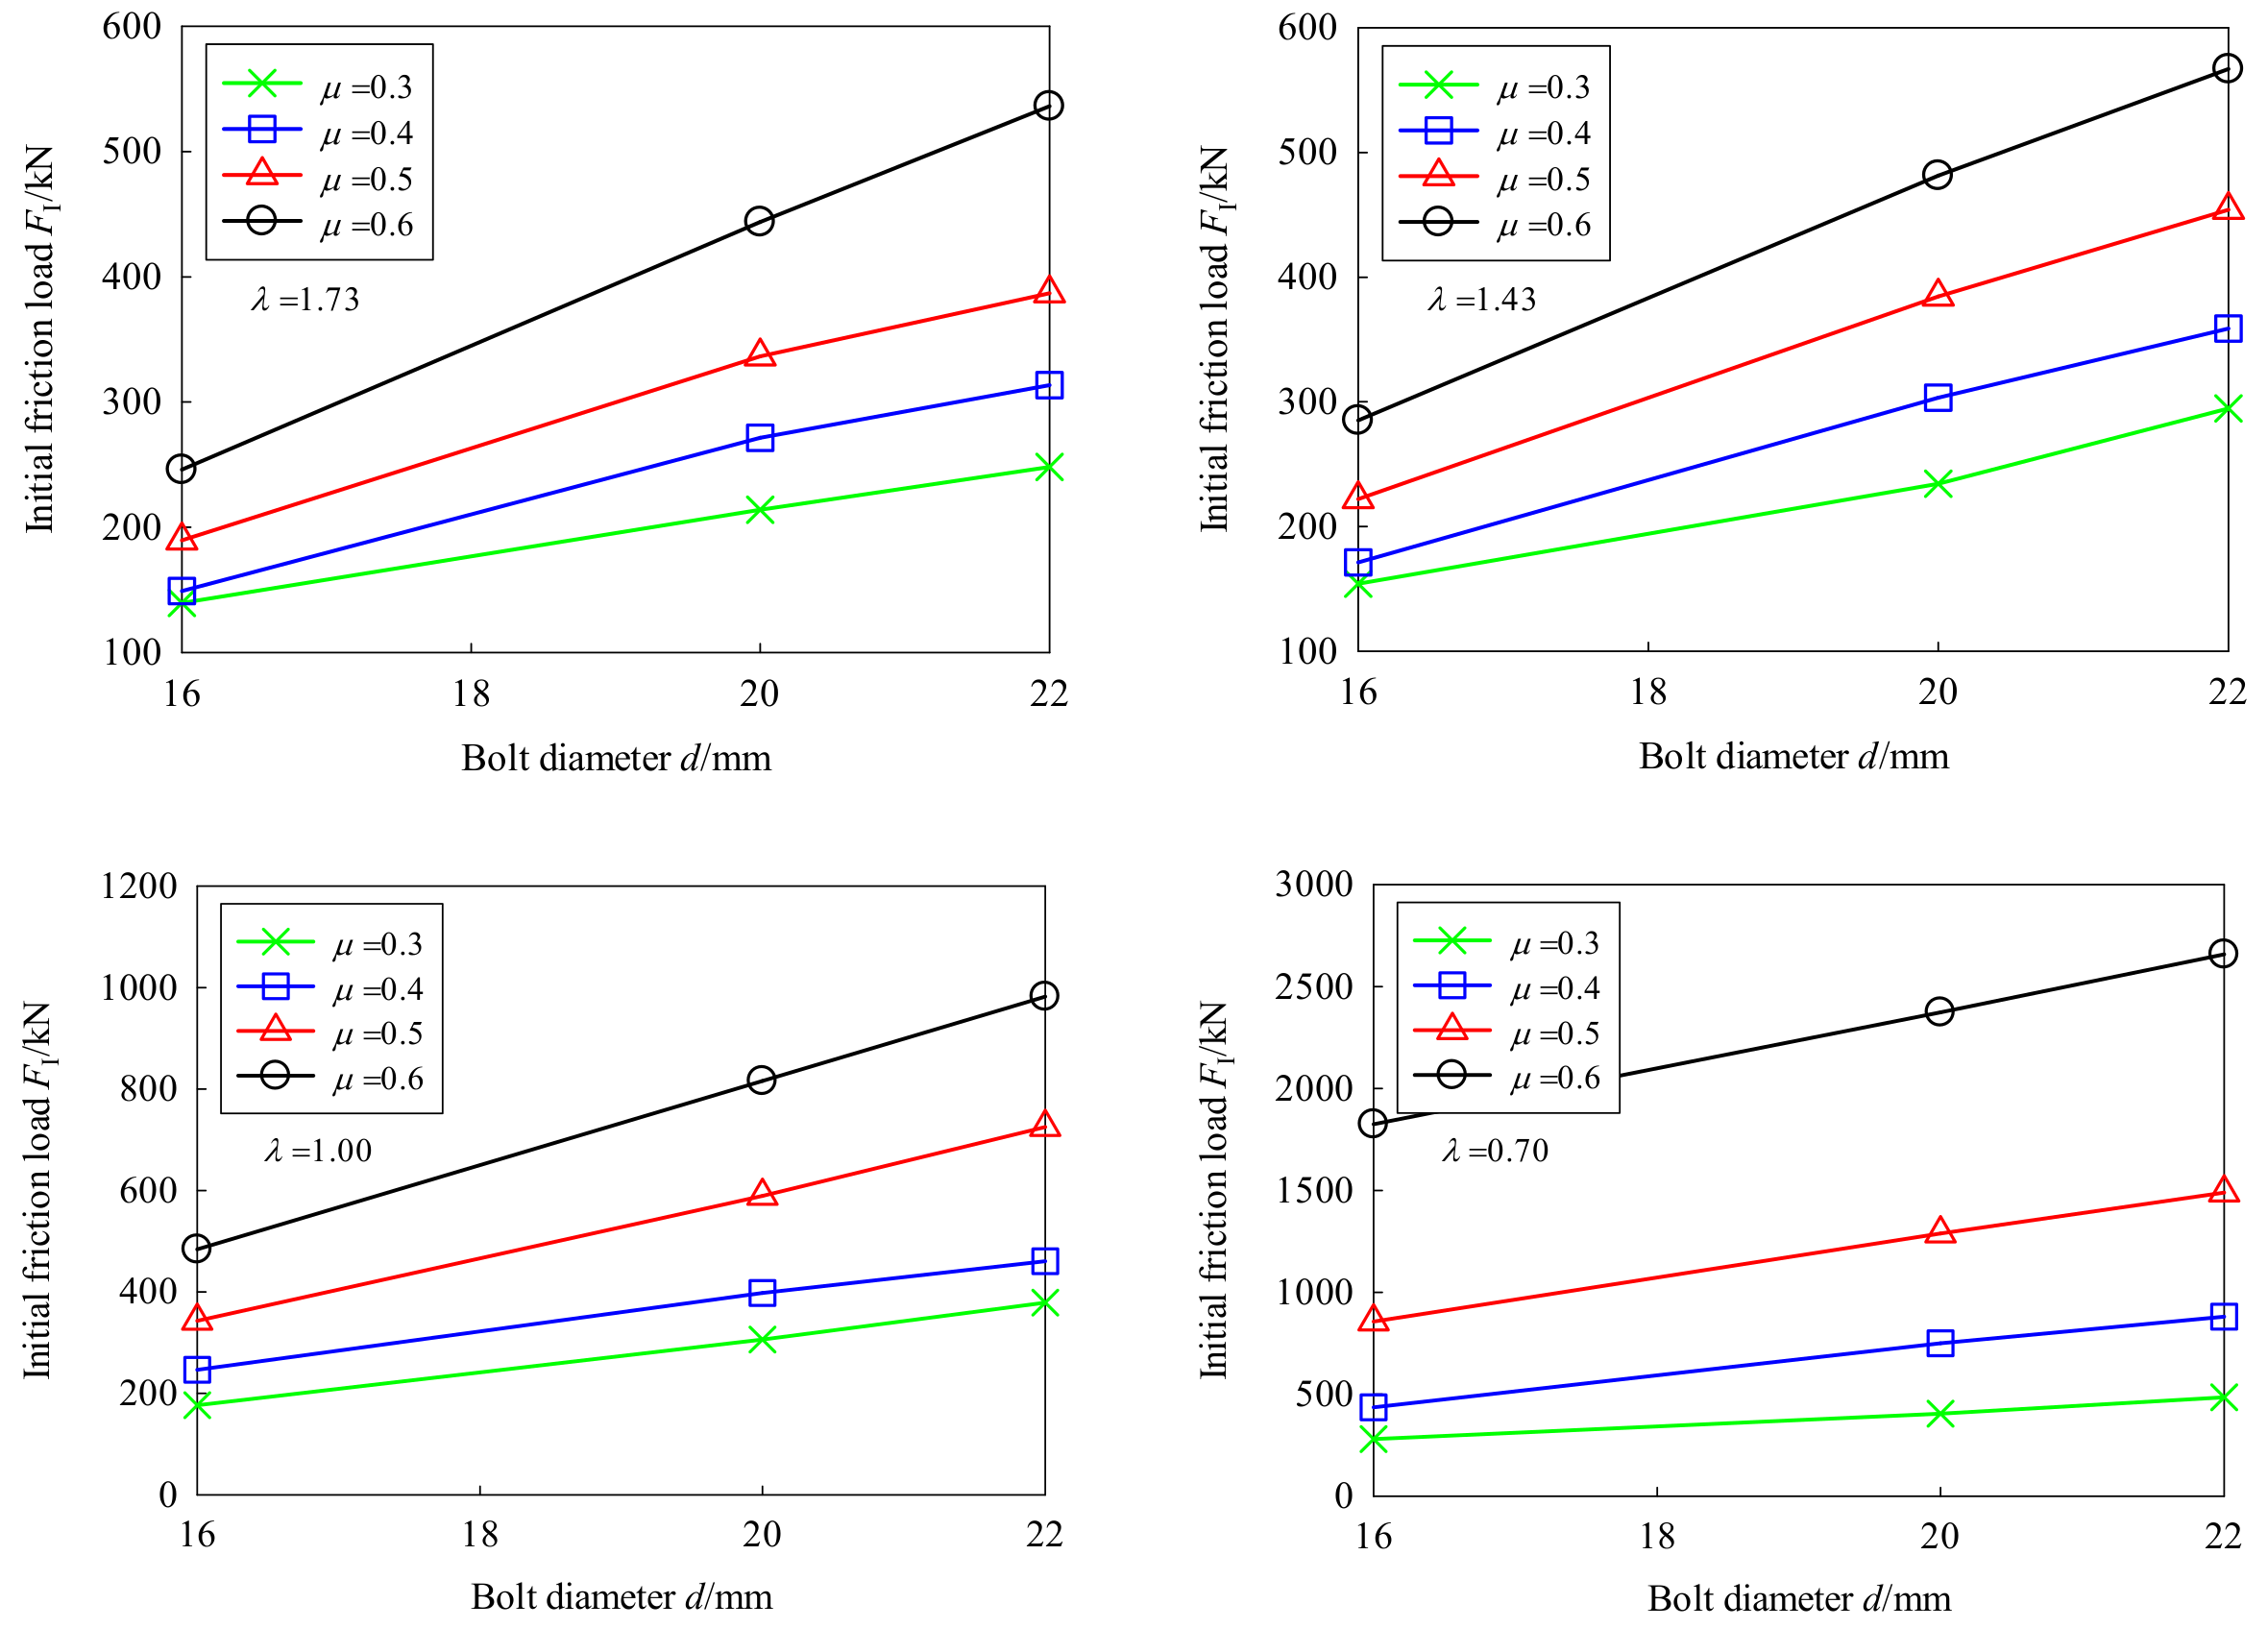
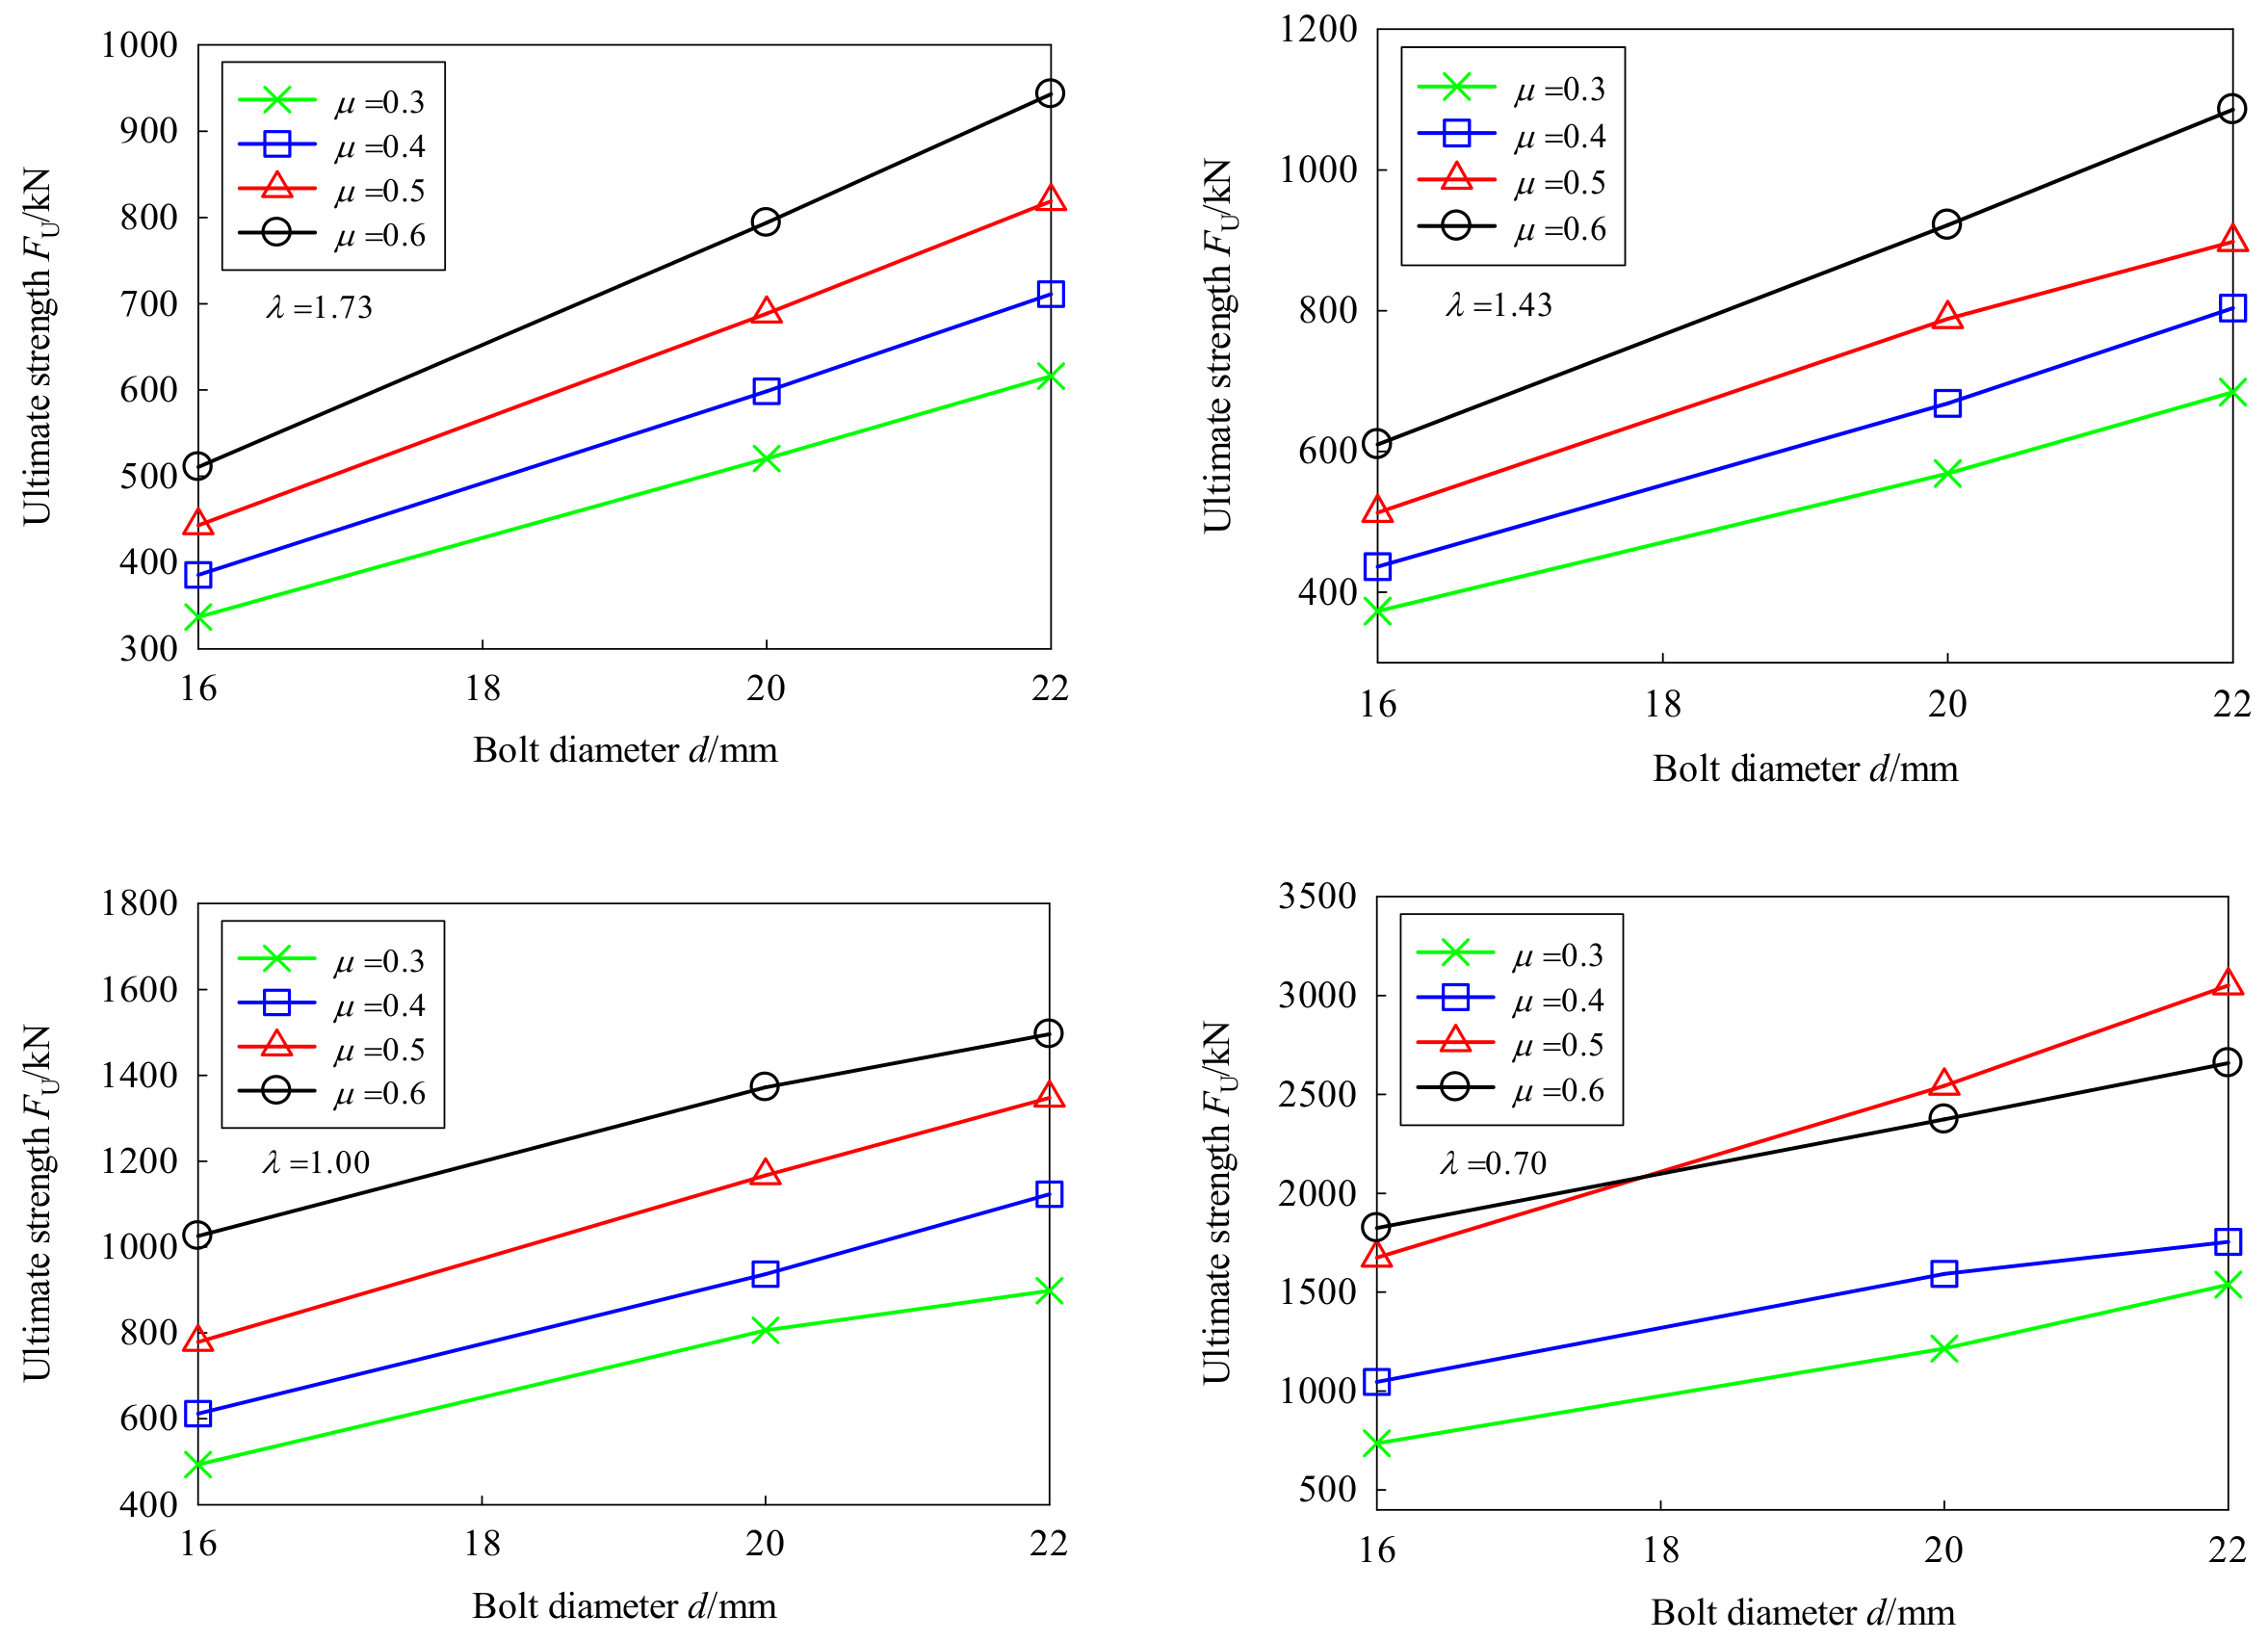
5.3.3. Effect of the Bolt Diameter

Figure 21 and Figure 22 provide the correlations of bolt diameter with the initial friction load and ultimate strength, respectively. The initial clamping force of the finite-element models was set to the designed level. It can be seen that the initial friction load and ultimate strength of all specimens grew linearly with the increase of bolt diameter. Further analysis shows that for every 1 mm increase in bolt diameter, the initial friction load increased by about 10%, while the ultimate strength increased by about 8.5%.

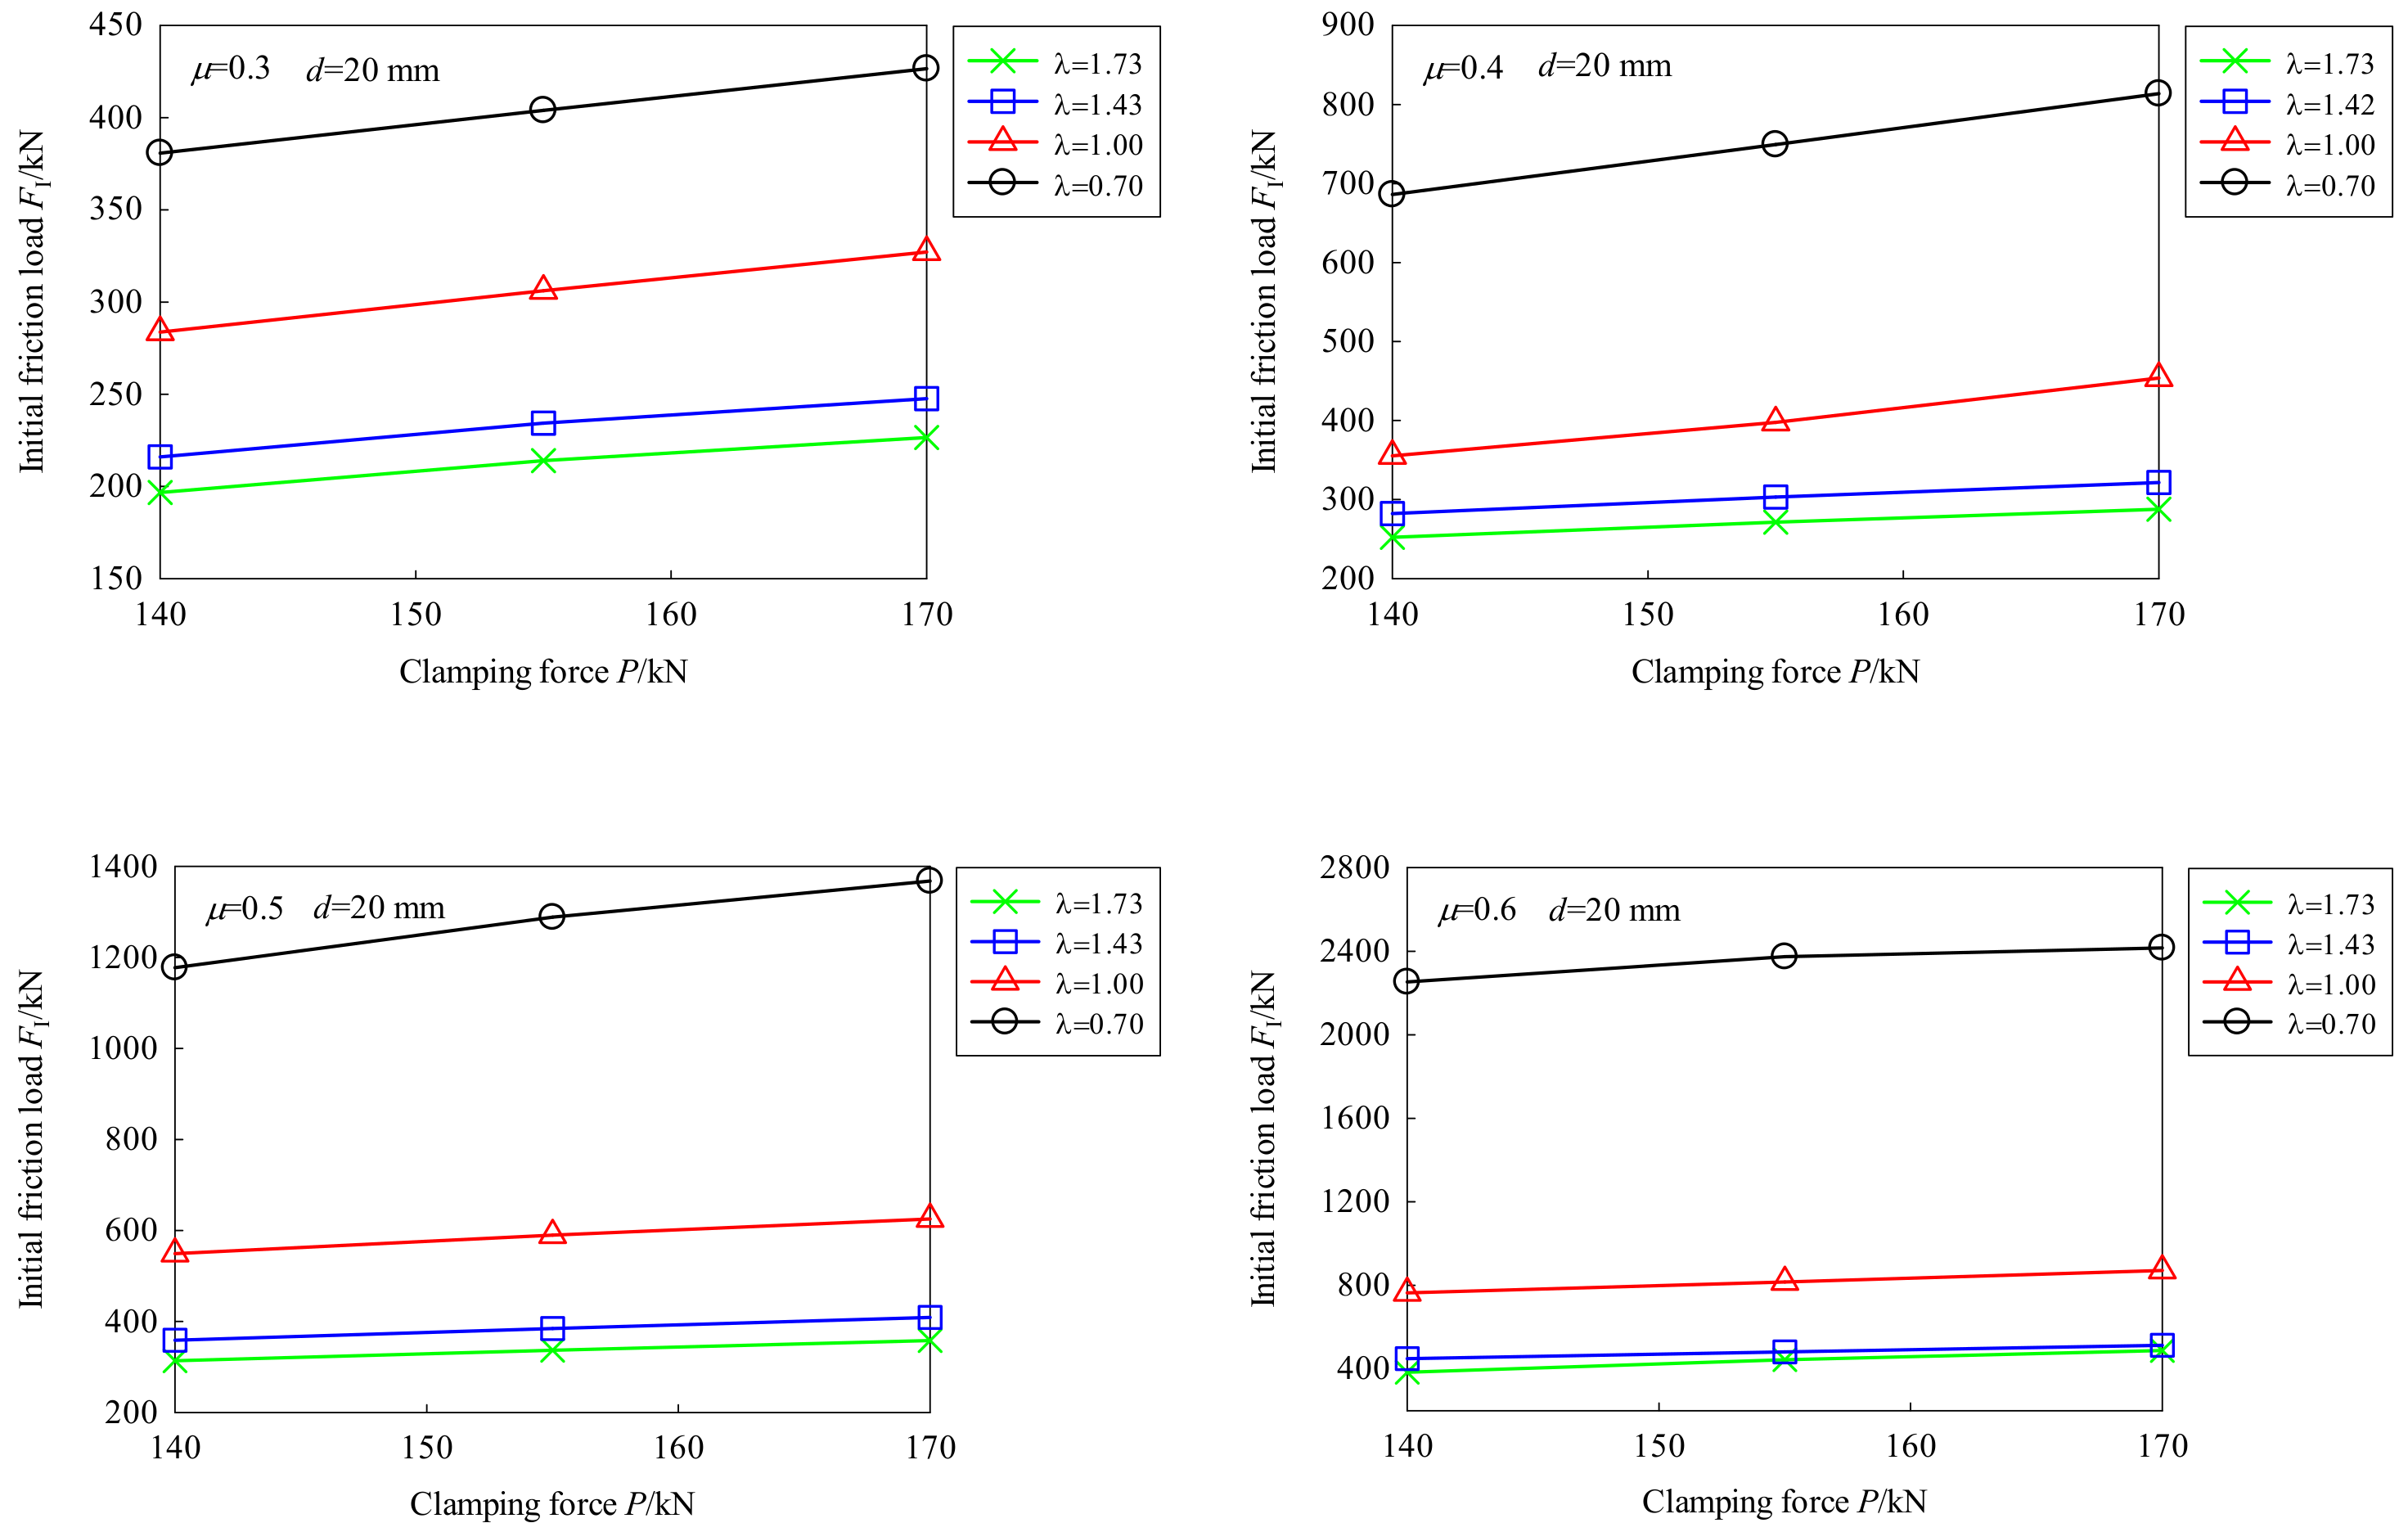
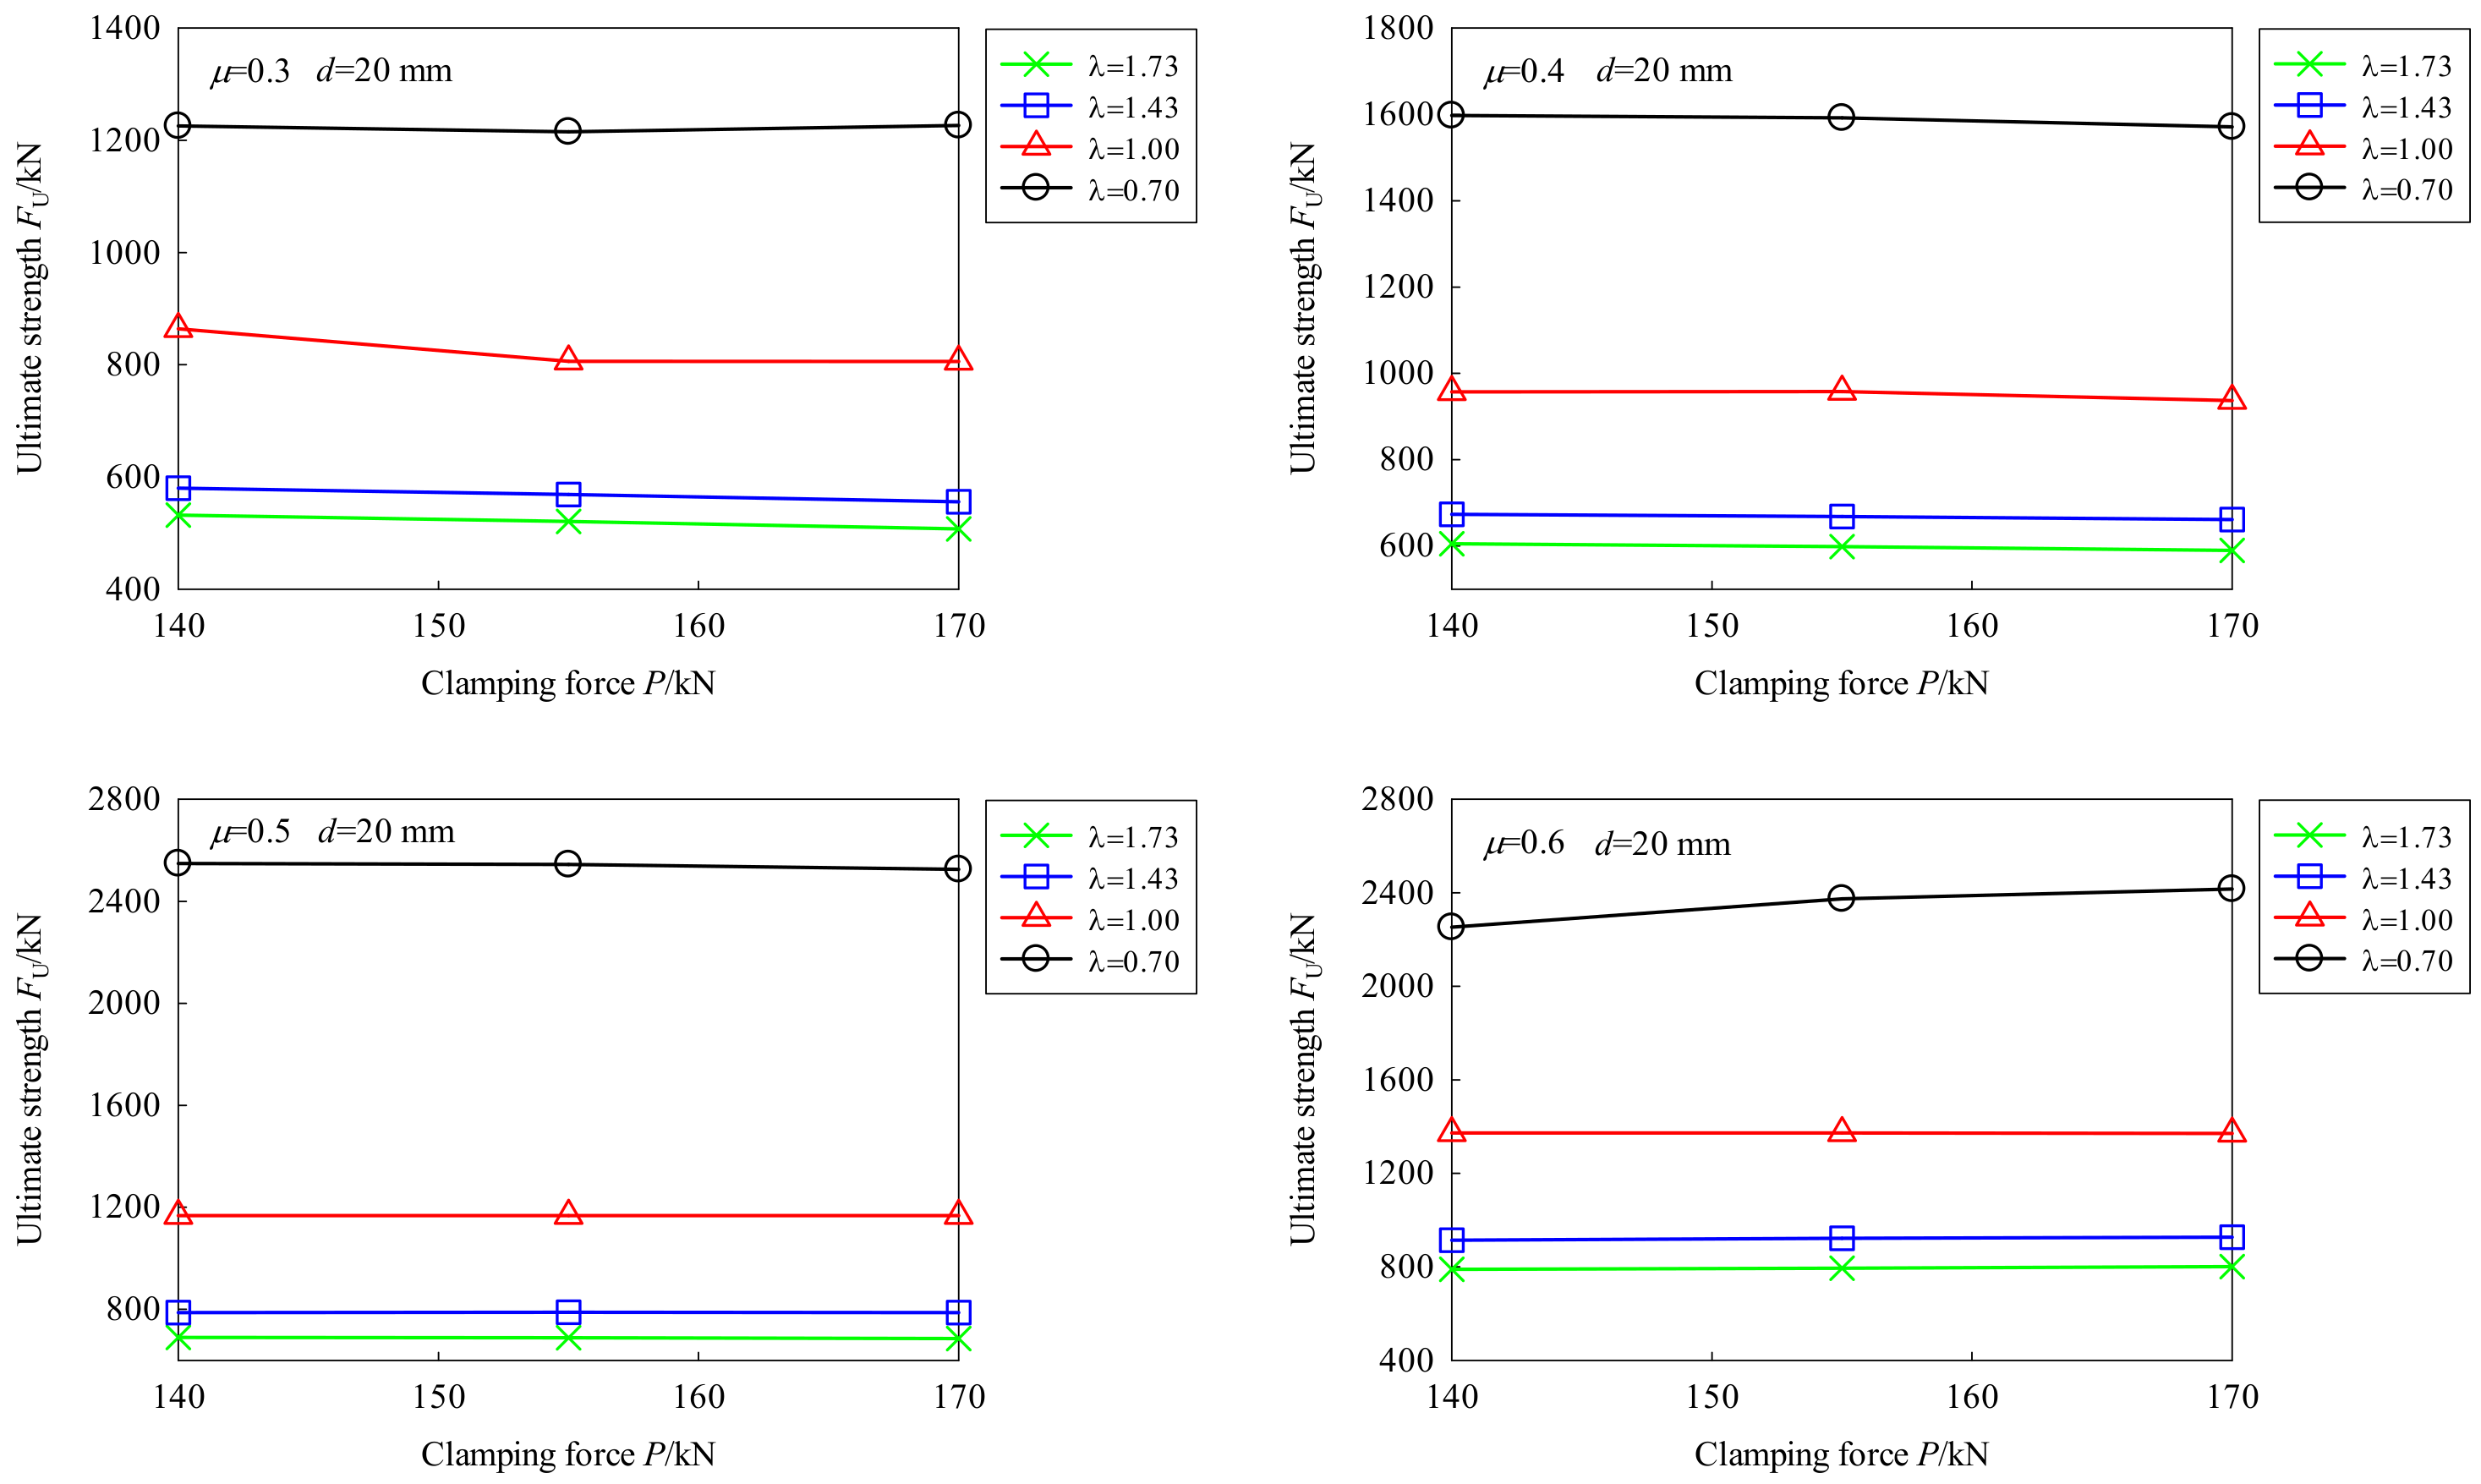
5.3.4. Effect of the Clamping Force

Figure 23 and Figure 24 provide the correlations of the clamping force of 20 mm-diameter FHSB T-stub connection with initial friction load and ultimate strength, respectively. It can be seen that the initial friction load increased linearly with the increase of the clamping force, while the ultimate strength showed a linear decline (except for the specimens with λ = 0.70 and μ = 0.6). The results show that the specimens with 16 mm and 22 mm-diameter bolts have the same variation trend. For each 10% increase/decrease of the clamping force, the initial friction load decreased/increased by 7.8%, while the ultimate strength remains basically the same.

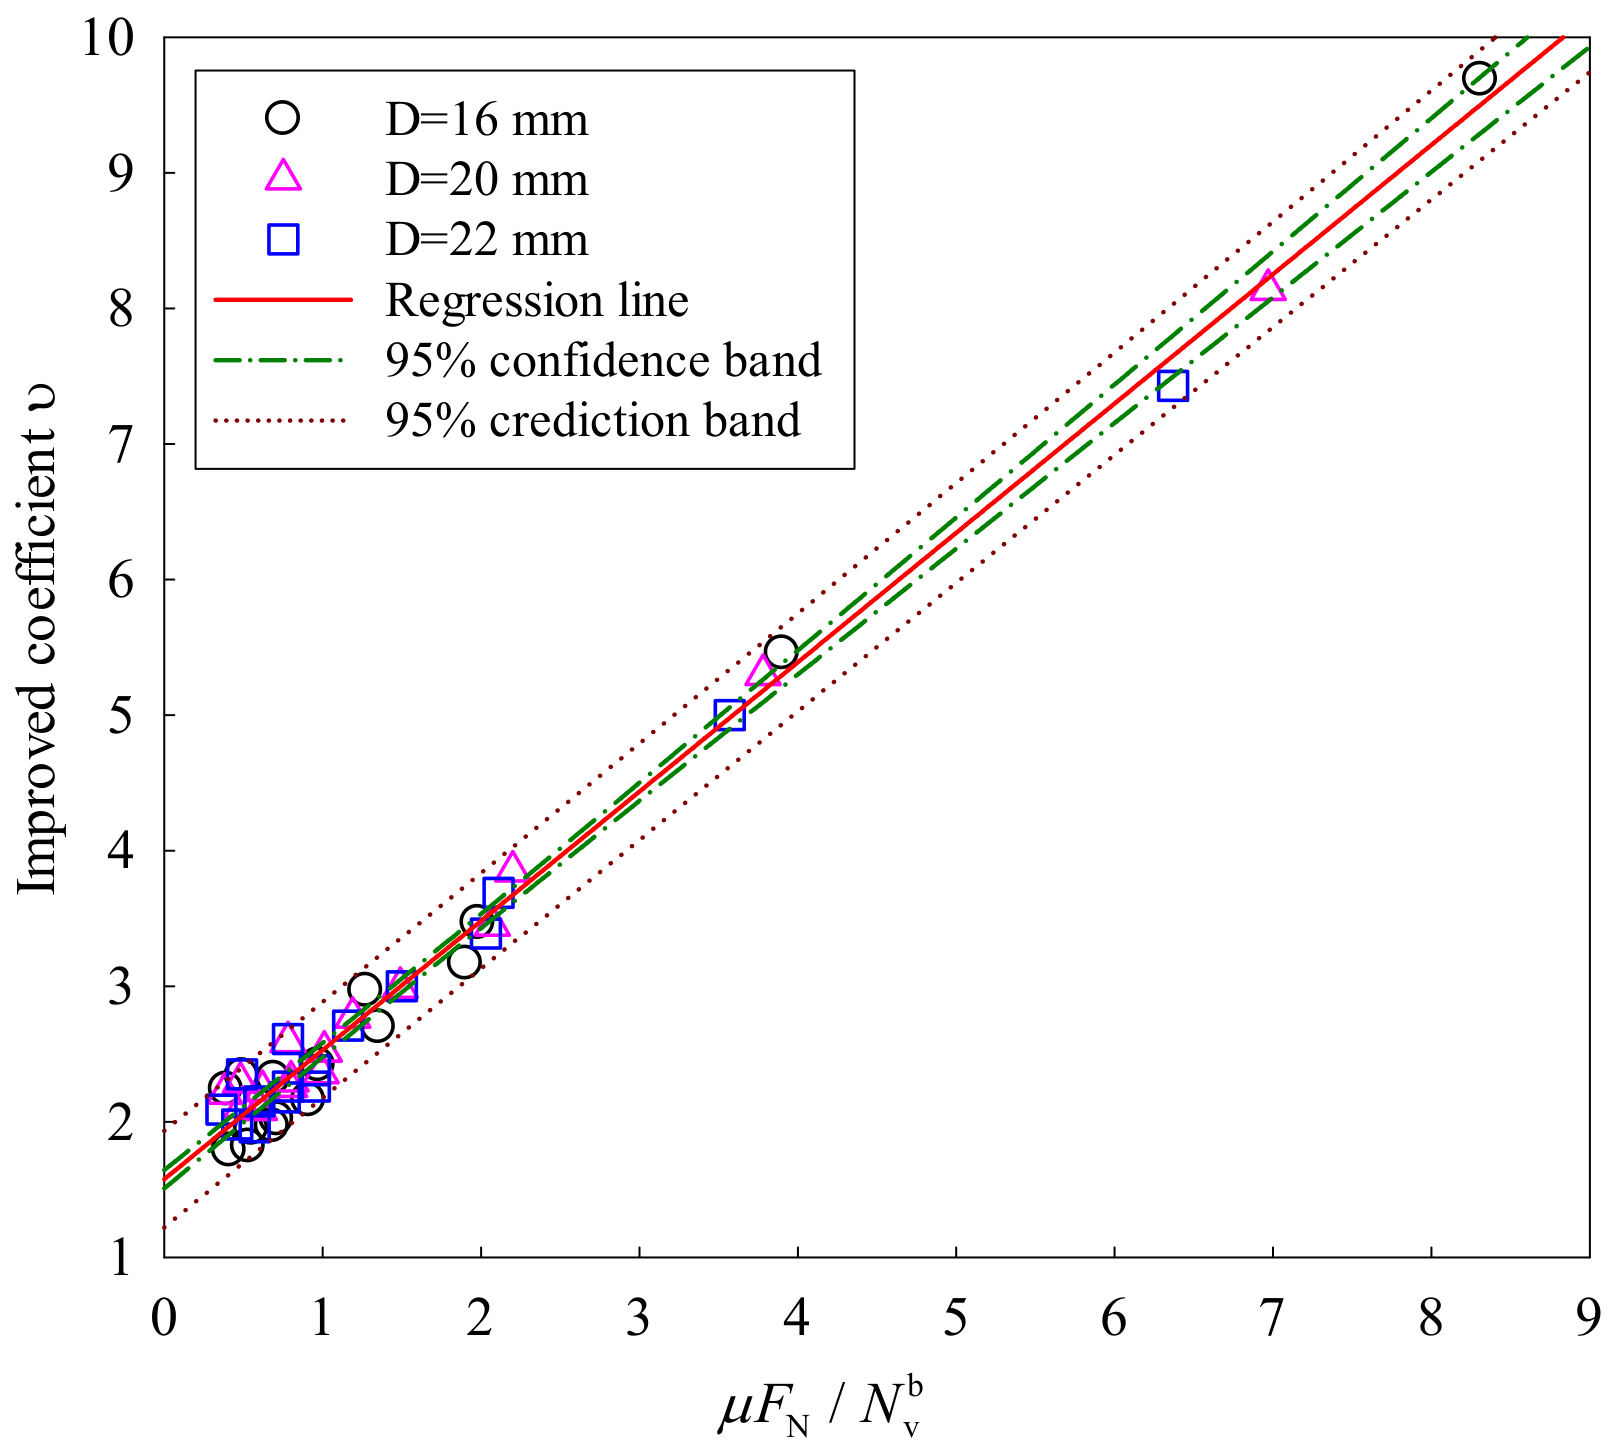
6. Bearing Capacity of the FHSB T-Stub Connection

The initial friction load is the most important design parameter of the FHSB T-stub connection under the combined effects of shear and compression. Considering the effects of the bolt diameter, shear–compression ratio and friction coefficient on the initial friction load, this paper put forward the calculation formula of the initial friction load of the FHSB T-stub connection under both shear and compression through regression analysis. The shear capacity of the FHSB T-stub connection can be computed by the following regression equation:
υ = 1.5760 + 0.9538 μ F N N v b ,
where, FN = FIcosθ is the normal components of the initial friction load on the contact surface of connecting plates.
Figure 25 shows the relationships between the initial friction load and different parameters of 48 finite-element models under the 95% confidence and prediction interval. The R-squared value of Formula (4) was computed as 0.9892. The results of ANOVA (analysis of variance) are shown in Table 6.
It can be seen from Table 6 that the significance test resulted in p < 0.05, so the parameter selection had a significant influence to the initial slippage load. In addition, in this paper, the Shapiro–Wilk test was used to test the residual samples, and the calculated W = 0.954 and p = 0.054 (significance level = 0.050), which followed the normal distribution. If the initial friction load FI is infinite, the connection will self-lock. Accordingly, the friction coefficient was linearly correlated with the shear–compression ratio, and the ratio coefficient was 0.9538.

7. Conclusions

This paper designed a novel FHSB T-stud connection based on the structural features in the anchorage zone of a CSS-enhanced PSC-CBGB. Then, static load tests were conducted on 21 specimens with different shear–compression ratios, followed by finite-element modeling of the specimens. The specimens were investigated and compared in the failure mode, initial friction load and ultimate strength. After that, FEM based numerical simulation was performed to analyze the effects of multiple parameters on the initial friction load and the ultimate strength. The analysis results were used to evaluate the load-bearing capacity of the FHSB T-stub connection. The main conclusions are as follows:
(1)
Under the combined effects of shear and compression, the FHSB T-stub connection mainly suffered from bolt shearing failure. The load–displacement curve generally covered four stages: the elastic stage, yield stage, hardening stage and failure stage. If the shear–compression ratio is small and the friction coefficient is large, the ultimate strength of FHSB T-stub connection equals its initial friction load. In this case, the load–displacement curve for the connection only contained the elastic stage and failure stage.
(2)
The finite-element model proposed in this paper is suitable to study the mechanical behavior of FHSB T-stub connection under both shear and compression.
(3)
The friction coefficient and shear–compression ratio had great impacts on the initial friction load, improved anti-slip coefficient and ultimate strength. The larger the friction coefficient, the smaller the shear–compression ratio, and the better the anti-slip bearing capacity of the FHSB T-stub connection.
(4)
The initial friction load and ultimate strength increased linearly with the growing bolt diameter. For every 1 mm increase in bolt diameter, the initial friction load increased by about 10%, while the ultimate strength increased by about 8.5% within a 16–22 mm-diameter.
(5)
The initial friction load increased linearly with the increase of clamping force, while the ultimate strength showed a linear decline. For each 10% increase/decrease of the design clamping force within 16–22 mm-diameter bolts, the initial friction load decreased/increased by 7.8%, while the ultimate load remained basically the same.
The proposed formula of shear capacity and self-lock angles of FHSB T-stub connection could be applied to the design of CSS-enhanced PSC-CBGBs and diagonal bracing. However, this paper only studied the friction coefficient, shear–compression ratio, bolt diameter and clamping force within a certain range, and the conclusions obtained had a certain scope of application. In addition, the influence of plate thickness and nut corrosion damage on the mechanical properties of the FHSB-T stub connections under shear and compression, and the variation law of friction coefficient after first slipping need to be further studied.

Author Contributions

Conceptualization, G.X. and Y.W.; methodology, G.X.; software, Y.D., L.W.; validation, G.X., L.W. and Y.D.; formal analysis, Y.D.; investigation, G.X., Y.Z.; resources, G.X.; data curation, G.X.; writing—original draft preparation, G.X., W.Z.; writing—review and editing, G.X.; visualization, Y.D., G.X.; supervision, Y.W.; project administration, Y.W.; funding acquisition, Y.W., G.X. All authors have read and agreed to the published version of the manuscript.

Funding

This research received no external funding.

Conflicts of Interest

The authors declare no conflict of interest.

References

  1. Sousa, H.; Bento, J.; Figueiras, J. Construction assessment and long-term prediction of prestressed concrete bridges based on monitoring data. Eng. Struct. 2013, 52, 26–37. [Google Scholar] [CrossRef] [Green Version]
  2. Robertson, I.N. Prediction of vertical deflections for a long-span prestressed concrete bridge structure. Eng. Struct. 2005, 27, 1820–1827. [Google Scholar] [CrossRef]
  3. Guo, T.; Chen, Z.H.; Liu, T.; Han, D.Z. Time-dependent reliability of strengthened PSC box-girder bridge using phased and incremental static analyses. Eng. Struct. 2016, 117, 358–371. [Google Scholar] [CrossRef]
  4. Akl, A.; Saiidi, M.; Vosooghi, A. Deflection of in-span hinges in prestressed concrete box girder bridges during construction. Eng. Struct. 2017, 131, 293–310. [Google Scholar] [CrossRef]
  5. Bažant, Z.P.; Yu, Q.; Li, G.-H. Excessive Long-Time Deflections of Prestressed Box Girders. I: Record-Span Bridge in Palau and Other Paradigms. J. Struct. Eng. 2012, 138, 676–686. [Google Scholar] [CrossRef] [Green Version]
  6. Chróścielewski, J.; Miśkiewicz, M.; Pyrzowski, Ł.; Sobczyk, B. Damage Analysis of Tensioning Cable Anchorage Zone of a Bridge Superstructure, Using CDP Abaqus Material Model. Arch. Civ. Eng. 2017, 63, 3–18. [Google Scholar] [CrossRef]
  7. Fjeldheim, F.; Teigen, J. Strengthening of Puttesund Bridge. In Proceedings of the International Conference: Structural Faults and Repair-2003, London, UK, 1–3 July 2003. [Google Scholar]
  8. Xu, G.N.; Wang, Y.Z.; Wang, S.M.; Wang, L.Y. Key construction techniques for strengthening of main girder of Dongming Huanghe River Highway Bridge. Bridge Constr. 2017, 47, 101–106. [Google Scholar]
  9. Hedayat, A.A.; Afzadi, E.A.; Iranpour, A. Prediction of the Bolt Fracture in Shear Using Finite Element Method. Structures 2017, 12, 188–210. [Google Scholar] [CrossRef]
  10. Može, P.; Beg, D. Investigation of high strength steel connections with sevearal bolts in double shear. J. Eng. Struct. 2011, 67, 333–347. [Google Scholar]
  11. Liu, X.P.; Bradford, M.A.; Chen, Q.J.; Ban, H.Y. Finite element modelling of steel–concrete composite beams with high-strength friction-grip bolt shear connectors. Finite Elem. Anal. Des. 2016, 108, 54–65. [Google Scholar] [CrossRef]
  12. Manuel, T.J.; Kulak, G.L. Strength of Joints That Combine Bolts and Welds. J. Struct. Eng. 2000, 126, 279–287. [Google Scholar] [CrossRef]
  13. Chen, Q.; Li, F.X.; Lei, J.Q.; Li, Q.; Guo, J. Tensile capacity and design method of combined connections with bolts and welds. Eng. Mech. 2016, 33, 112–121. [Google Scholar]
  14. Kim, D.-K.; Lee, C.-H. Experimental and analytical study of combined bolted-welded lap joints including high-strength steel. J. Constr. Steel Res. 2020, 168, 105995. [Google Scholar] [CrossRef]
  15. Swanson, J.A.; Leon, R.T. Bolted Steel Connections: Tests on T-Stub Components. J. Struct. Eng. 2000, 126, 50–56. [Google Scholar] [CrossRef]
  16. Lyu, Y.F.; Li, G.Q.; Wang, Y.B.; Li, H.; Wang, Y.Z. Bearing behavior of multi-bolt high strength steel connections. Eng. Struct. 2020, 212, 110510. [Google Scholar] [CrossRef]
  17. Wang, Y.-B.; Lyu, Y.-F.; Li, G.-Q.; Liew, J.R. Bearing-strength of high strength steel plates in two-bolt connections. J. Constr. Steel Res. 2019, 155, 205–218. [Google Scholar] [CrossRef]
  18. Ahn, J.-H.; Lee, J.M.; Cheung, J.; Kim, I.-T. Clamping force loss of high-strength bolts as a result of bolt head corrosion damage: Experimental research A. Eng. Fail. Anal. 2016, 59, 509–525. [Google Scholar] [CrossRef]
  19. Ahn, J.-H.; You, J.M.; Huh, J.; Kim, I.-T.; Jeong, Y.-S. Residual clamping force of bolt connections caused by sectional damage of nuts. J. Constr. Steel Res. 2017, 136, 204–214. [Google Scholar] [CrossRef]
  20. Lin, W.; Yoda, T.; Taniguchi, N.; Satake, S.; Kasano, H. Preventive maintenance on welded connection joints in aged steel railway bridges. J. Constr. Steel Res. 2014, 92, 46–54. [Google Scholar] [CrossRef]
  21. Yamaguchi, T.; Suzuki, Y.; Kitada, T.; Sugiura, K. Effect of tensile and shear force on mechanical behavior of high strength bolted tensile joints. J. Constr. Steel Res. 2004, 60, 1545–1560. [Google Scholar] [CrossRef]
  22. National Standards of the People’s Republic of China. Code for Design of Steel Structure, GB 50017-2017; Ministry of Housing and Urban-Rural Development (MOHURD): Beijing, China, 2017.
  23. Xu, G.N.; Wang, Y.Z.; Yuan, Q.; Wang, L.Y.; Wu, J.Y. Main girder anchor zone model based experimental study of using cable-stayed system to strengthen Dongming Huanghe River Highway Bridge. World Bridges 2018, 46, 80–85. [Google Scholar]
  24. Kim, I.-T.; Lee, J.M.; Huh, J.; Ahn, J.-H. Tensile behaviors of friction bolt connection with bolt head corrosion damage: Experimental research B. Eng. Fail. Anal. 2016, 59, 526–543. [Google Scholar] [CrossRef]
  25. Song, L.S. Anti-sliding bearing capacity of high-strength bolted connections under combined tension and shear. Ind. Const. 1987, 5, 37–42. [Google Scholar]
  26. Trade Standards of the People’s Republic of China. Guidelines for Design of Highway Cable-Stayed Bridge, JTG/T D65-01-2007; Ministry of Communications: Beijing, China, 2007.
  27. National Standards of the People’s Republic of China. Technical Specification for High Strength Bolt Connections of Steel Structures, JGJ 82-2011; Ministry of Housing and Urban-Rural Development (MOHURD): Beijing, China, 2011.
  28. Liu, X.; He, X.; Wang, H.; Zhang, A. Compression-bend-shearing performance of column-to-column bolted-flange connections in prefabricated multi-high-rise steel structures. Eng. Struct. 2018, 160, 439–460. [Google Scholar] [CrossRef]
  29. Guo, X.; Zhang, Y.; Xiong, Z.; Xiang, Y. Load-bearing capacity of occlusive high-strength bolt connections. J. Constr. Steel Res. 2016, 127, 1–14. [Google Scholar] [CrossRef]
  30. Dassault Systemes simulia Corp. Abaqus Analysis User’s Manual, 6.11 ed.; SIMULIA: Providence, RI, USA, 2011. [Google Scholar]
  31. Liang, G.; Guo, H.; Liu, Y.; Li, Y. Q690 high strength steel T-stub tensile behavior: Experimental and numerical analysis. Thin-Walled Struct. 2018, 122, 554–571. [Google Scholar] [CrossRef]
  32. D’Antimo, M.; Demonceau, J.-F.; Jaspart, J.-P.; Latour, M.; Rizzano, G. Experimental and theoretical analysis of shear bolted connections for tubular structures. J. Constr. Steel Res. 2017, 138, 264–282. [Google Scholar] [CrossRef]
  33. Gödrich, L.; Wald, F.; Kabeláč, J.; Kuříková, M. Design finite element model of a bolted T-stub connection component. J. Constr. Steel Res. 2019, 157, 198–206. [Google Scholar] [CrossRef]
  34. Grimsmo, E.; Aalberg, A.; Langseth, M.; Clausen, A. Failure modes of bolt and nut assemblies under tensile loading. J. Constr. Steel Res. 2016, 126, 15–25. [Google Scholar] [CrossRef]
  35. Liu, X.; He, X.; Wang, H.; Yang, Z.; Pu, S.; Ailin, Z. Bending-shear performance of column-to-column bolted-flange connections in prefabricated multi-high-rise steel structures. J. Constr. Steel Res. 2018, 145, 28–48. [Google Scholar] [CrossRef]
Figure 1. The friction type high-strength bolted (FHSB) connections adopted for the cable-stayed system (CSS) enhancement of Dongming Yellow River Highway Bridge.
Applsci 10 03600 g001
Figure 2. The anchorage angles of the SCS-enhanced prestressed concrete continuous box girder bridges (PSC-CBGB).
Applsci 10 03600 g002
Figure 3. The dimensions of specimens.
Applsci 10 03600 g003
Figure 4. The positions of the linear variable displacement transformers (LVDTs) on MC-45 specimens.
Applsci 10 03600 g004
Figure 5. The structure of a bolt force sensor.
Applsci 10 03600 g005
Figure 6. The test setup.
Applsci 10 03600 g006
Figure 7. The specimen failures observed in the tests.
Applsci 10 03600 g007aApplsci 10 03600 g007b
Figure 8. The relationship between the compressive load and relative slippage of specimens at different shear–compression ratios.
Applsci 10 03600 g008
Figure 9. The relationship between the compression load and strains of the bolt.
Applsci 10 03600 g009
Figure 10. The friction resistance curve of the specimens.
Applsci 10 03600 g010
Figure 11. Constitutive model of steel.
Applsci 10 03600 g011
Figure 12. The contract and boundary conditions of the finite-element model.
Applsci 10 03600 g012
Figure 13. Mesh generation of the finite element model.
Applsci 10 03600 g013
Figure 14. Boundary conditions and application of the clamping force.
Applsci 10 03600 g014
Figure 15. Stress nephogram of the finite element model.
Applsci 10 03600 g015
Figure 16. Simulated and test results on the relationship between load and relative slippage of specimens.
Applsci 10 03600 g016
Figure 17. The relationship between the initial friction load and friction coefficient.
Applsci 10 03600 g017
Figure 18. The relationship between the ultimate strength and friction coefficient.
Applsci 10 03600 g018
Figure 19. The relationship between the initial friction load and shear–compression ratio.
Applsci 10 03600 g019
Figure 20. The relationship between the ultimate strength and shear–compression ratio.
Applsci 10 03600 g020
Figure 21. The relationship between the initial friction load and bolt diameter.
Applsci 10 03600 g021
Figure 22. The relationship between the ultimate strength and bolt diameter.
Applsci 10 03600 g022
Figure 23. The relationship between the initial friction load and clamping force.
Applsci 10 03600 g023
Figure 24. The relationship between the ultimate strength and clamping force.
Applsci 10 03600 g024
Figure 25. The relationship between the initial friction load and different parameters.
Applsci 10 03600 g025
Table 1. The dimension of HSBs.
SizeBolt/mmNut/mmWasher/mm
esKdLbesmrDdt
M2038.5331220754338.533201038.521.53.5
Applsci 10 03600 i001 Applsci 10 03600 i002 Applsci 10 03600 i003
Table 2. The material properties of 10.9 S HSBs.
BoltNutWasher
GradeYield strength/MPaTensile strength/MPaElongation/%Reduction ratio in area/%Minimum tensile load/kNGradeProof load/kNGrade
10.9≥9001040 to 1240≥14≥4024510 H245HRC-45
Table 3. The parameters of specimens.
Specimen IDθ/°λSurface TreatmentTarget Clamping Force /kNConnecting Plate/mmPressure Plate/mm
l × w × t1w × a × b × c × t2
NMC-35350.70Butter170260 × 170 × 20170 ×130 × 116 × 30 × 40
MC-35-01~06350.70Sand blasting170 × 130 × 116 × 30 × 40
NMC-45451.00Butter170 × 153 × 92 × 30 × 40
MC-45-01~06451.00Sand blasting170 × 153 × 92 × 30 × 40
NMC-60601.73Butter170 × 181 × 50 × 30 × 40
MC-60-01~06601.73Sand blasting170 × 181 × 50 × 30 × 40
Table 4. The initial friction load, compressive load, ultimate strength and improved anti-slip coefficient of each specimen.
λSpecimen IDInitial Clamping Force P/kNInitial Friction Load FI/kNCompressive Load FC/kNUltimate Strength FU/kNImproved Coefficient ν
Left BoltRight Bolt
0.70NMC-35166.8165.6--700.2-
MC-35-01165.0169.12179.61047.52179.67.07
MC-35-02167.6167.52223.6561.02223.67.19
MC-35-03164.9166.32293.11192.22293.17.50
MC-35-04163.9167.32145.6698.72145.67.02
MC-35-05164.4165.82208.5650.12208.57.25
MC-35-06163.9165.32197.31047.32197.37.23
1.00NMC-45166.5167.2--587.3-
MC-45-01164.5165.81350.8952.41583.25.46
MC-45-02169.2168.81353.7803.41535.95.35
MC-45-03167.9168.91432.6902.31573.45.68
MC-45-04164.0163.41310.81002.31503.45.35
MC-45-05163.7163.71462.9839.41509.25.97
MC-45-06169.2169.71395.9776.31719.65.50
1.73NMC-60159.5155.8--331.3-
MC-60-01167.4168.0437.7293.6828.32.14
MC-60-02166.3167.9428.0437.1816.72.10
MC-60-03162.8161.8450.5337.1769.52.27
MC-60-04168.2167.3413.3481.7763.22.02
MC-60-05174.0173.7453.8461.8758.02.14
MC-60-06175.7174.6432.6297.1795.92.02
Table 5. Comparison between simulated results and test results.
SpecimenInitial Friction Load FIUltimate Strength FU
Mean Test Value/kNSimulated Value/kNRelative Error/%Mean Test Value/kNSimulated Value/kNRelative Error/%
MC-352207.952417.118.652207.953134.6029.56
MC-451384.451261.34−9.761570.781370.20−14.64
MC-60435.98460.575.34788.60743.70−6.04
Table 6. Results of ANOVA.
Source of DifferenceDFSSMSFp
Regression1126.8280126.82804199.9847<0.0001
Residual461.38910.0302--
Total47128.21702.7280--

