1. Introduction
Performing landings and jumps successfully is an essential element in many sports such as basketball. An observational analysis [
1] reported that basketball players performed 70 landings in a typical game, wherein players landed from low jumps as frequently as from high jumps, depending on their positions. During landing, the peak vertical ground reaction forces (vGRF) experienced by players are several times that of body weight, and the forces increase with drop heights [
2]. In terms of kinematics, there are mixed findings as to whether lower body joint ranges of motion (ROM) increased [
3] or remained consistent [
4] with increasing drop heights. Regarding the neuromuscular response at the lower extremity, higher drop heights induce higher muscle activation prior to landing as a preparation strategy [
5,
6]. An epidemiology study on US high school basketball injuries reported an injury rate of 1.94 per 1000 athlete exposure, with ankle/foot (30.5%) and knee (18.6%) being the most commonly injured [
7]. Appropriate footwear design is one possible way to aid protecting basketball players from injuries [
8,
9,
10].
A recent review on basketball footwear concluded that softer midsoles are related to better impact attenuation in unanticipated test scenarios [
10]. In step-off landings, shoes with a soft midsole (40 Shore C) were able to better attenuate impacts compared with a regular (55 Shore C) and a hard (70 Shore C) midsole from different drop heights [
11]. Another study comparing shoes with soft (38 Shore C), medium (42 Shore C), and hard (57 Shore C) midsole hardness found that a soft midsole reduced vGRF in shot block landing but not in drop landing or lay-up landing [
12]. It should be noted that many previous studies used widely disparate midsole properties [
6,
11,
12,
13] that often exceeded the typical range of commercially offered basketball footwear. While using such wider ranges of footwear properties may facilitate statistical comparisons for research studies and thereby provide insight in general concepts of locomotion and movement adaptation, it is of practical and industrial interest to examine how athletes respond to subtle differences in midsole characteristics that are within commercially relevant ranges [
14,
15]. There are currently no studies that comprehensively examine how subtle differences in midsole hardness affect the kinetics, kinematics, and muscle activation of vertical drop jumps from different heights.
Examining the perceptual response together with biomechanical variables in footwear studies offers insights into the interplay between subjective and objective measures [
12,
13,
15,
16]. In general, players preferred soft shoes over hard shoes when executing basketball-related tasks [
12,
15]. When executing a lay-up task, basketball players could not perceive any difference in mediolateral stability between shoes with softer (50 Shore C) and harder (60 Shore C) midsoles, but despite this, the subtle difference in midsole hardness was objectively quantified by center of pressure path variation [
15]. During landings, the ability to accurately perceive and appropriately respond to impact stimuli is important for developing safe landing strategies. Currently, it is not known whether athletes can accurately perceive the intensity of landing impact jointly altered by drop heights and footwear features [
6,
17]. Such knowledge is of importance because athletes do not have easy access to force measurements and therefore tend to rely on subjective perception of their landing intensity.
The primary aim of this study was to examine how subtle differences in midsole hardness of basketball footwear affect lower extremity biomechanics during drop jumps from various heights. The secondary aim was to examine the relationship between the perceived landing impact and objective impact loading measures. It was hypothesized that (1) the magnitude of the lower limb biomechanical variables increases with the increase in drop height; (2) more attenuating landing strategies are adopted in response to harder midsoles; and (3) there are positive relationships between the perceived intensity of landing impact and actual loading impacts measured using force platforms. Results from this study are expected to guide the development of user-centered and position-dependent basketball footwear.
2. Materials and Methods
The experimental protocol was approved by the Nanyang Technological University Institutional Review Board (IRB-2016-11-005). A double-blind, randomized control cross-over design was employed in this study. Both the participants and the testers were blinded from the footwear properties during data collection and analysis.
2.1. Participants
All participants gave written consent to participate in this study. For participants under 21 years of age, parental consent was also obtained. Eighteen male basketball players (mean (standard deviation, SD); age 25.5 (3.7) years; height 175.8 (6.4) cm; body mass 71.6 (11.6) kg) were recruited. The inclusion criteria were (1) male, (2) aged between 18 and 35 years old, (3) shoe size US 7.5 to 9.5, (4) at least 5 years of basketball playing experience, (5) had competed at school or hall level, and (6) currently playing basketball for at least once a month over the past 6 months. Participants were excluded if they (1) had any injury in the 6 months prior to testing, or (2) experienced pain during the test.
2.2. Footwear
Two pairs of visually identical basketball shoes with different midsole hardness were used [
Table 1, Xtep, China, Co Ltd.]. The difference of midsole hardness was within the commercially relevant range and was used in recent studies on basketball footwear [
14,
15]. The new shoes were broken in with 5-min treadmill running prior to the experiment on the first participant [
18]. To ensure a consistent foot-shoe interface among all participants, a new pair of standardized sport socks was issued to each participant and worn throughout the testing session.
2.3. Equipment Setup
Three-dimensional motion of the lower body was recorded at 240 Hz using an 8-camera infra-red motion capture system (Motion Analysis Corporation, Santa Rosa, CA, USA). To facilitate motion capture, 26 retroreflective markers were placed on the lower body and the shoes. For the human body, the markers were attached to its left and right side at anterior superior iliac spine (ASIS), posterior superior iliac spine (PSIS), mid-thigh, medial and lateral epicondyles, tibial tuberosity, and fibular head. On the shoes, markers were attached to the fabric at the medial and lateral malleoli, first, second, and fifth metatarsal heads, and the superior part of the posterior calcaneus. To facilitate this process, a tester first palpated the metatarsal head position on the participants before the shoes were worn. The participants were told that the markers will be placed at these specific positions on the shoes. Immediately after the shoes were worn, the tester located the metatarsal head positions with feedback from participants. For the lateral malleolus, the tester aligned the position from the top of the shoe and used a ruler to ensure that the markers were placed at exactly the same marker positions on the other pair of shoes. Two side-by-side force platforms recorded ground reaction forces at 1200 Hz (OR6-7-2000, Advanced Mechanical Technology Inc., Watertown, MA, USA). Surface electromyography (EMG; Trigno™ Wireless EMG, Delsys, Inc., Natick, MA, USA) sampled at 1200 Hz was used to record the activation levels of seven muscles in the right lower limb, which were gluteus maximus, vastus medialis, rectus femoris, biceps femoris, tibialis anterior, medial gastrocnemius, and soleus. Motion, force, and EMG signals were recorded simultaneously and synchronized via the Cortex software (version 2.6.2.1169, Motion Analysis Corp, Santa Rosa, CA, USA).
2.4. Drop Vertical Jump Task
A total of six sets of double-legged drop vertical jumps (DVJs) were performed from 31-cm, 46-cm, and 61-cm platforms in both shoe conditions. Five valid trials were obtained for each set and hence, there were 30 trials in total (5 trails × 3 drop heights × 2 levels of shoe hardness) for each participant entering data analysis. The shoe order was randomized among the participants while the same order was kept consistent across all drop heights within a participant. The platform height order also was randomized among the participants. The selected platform heights fell within the typical range of drop heights observed in basketball, and similar heights were used in previous DVJ studies [
19,
20,
21,
22,
23]. Participants stood on the platform with their hands placed on opposite shoulders and elbows pointing forward [
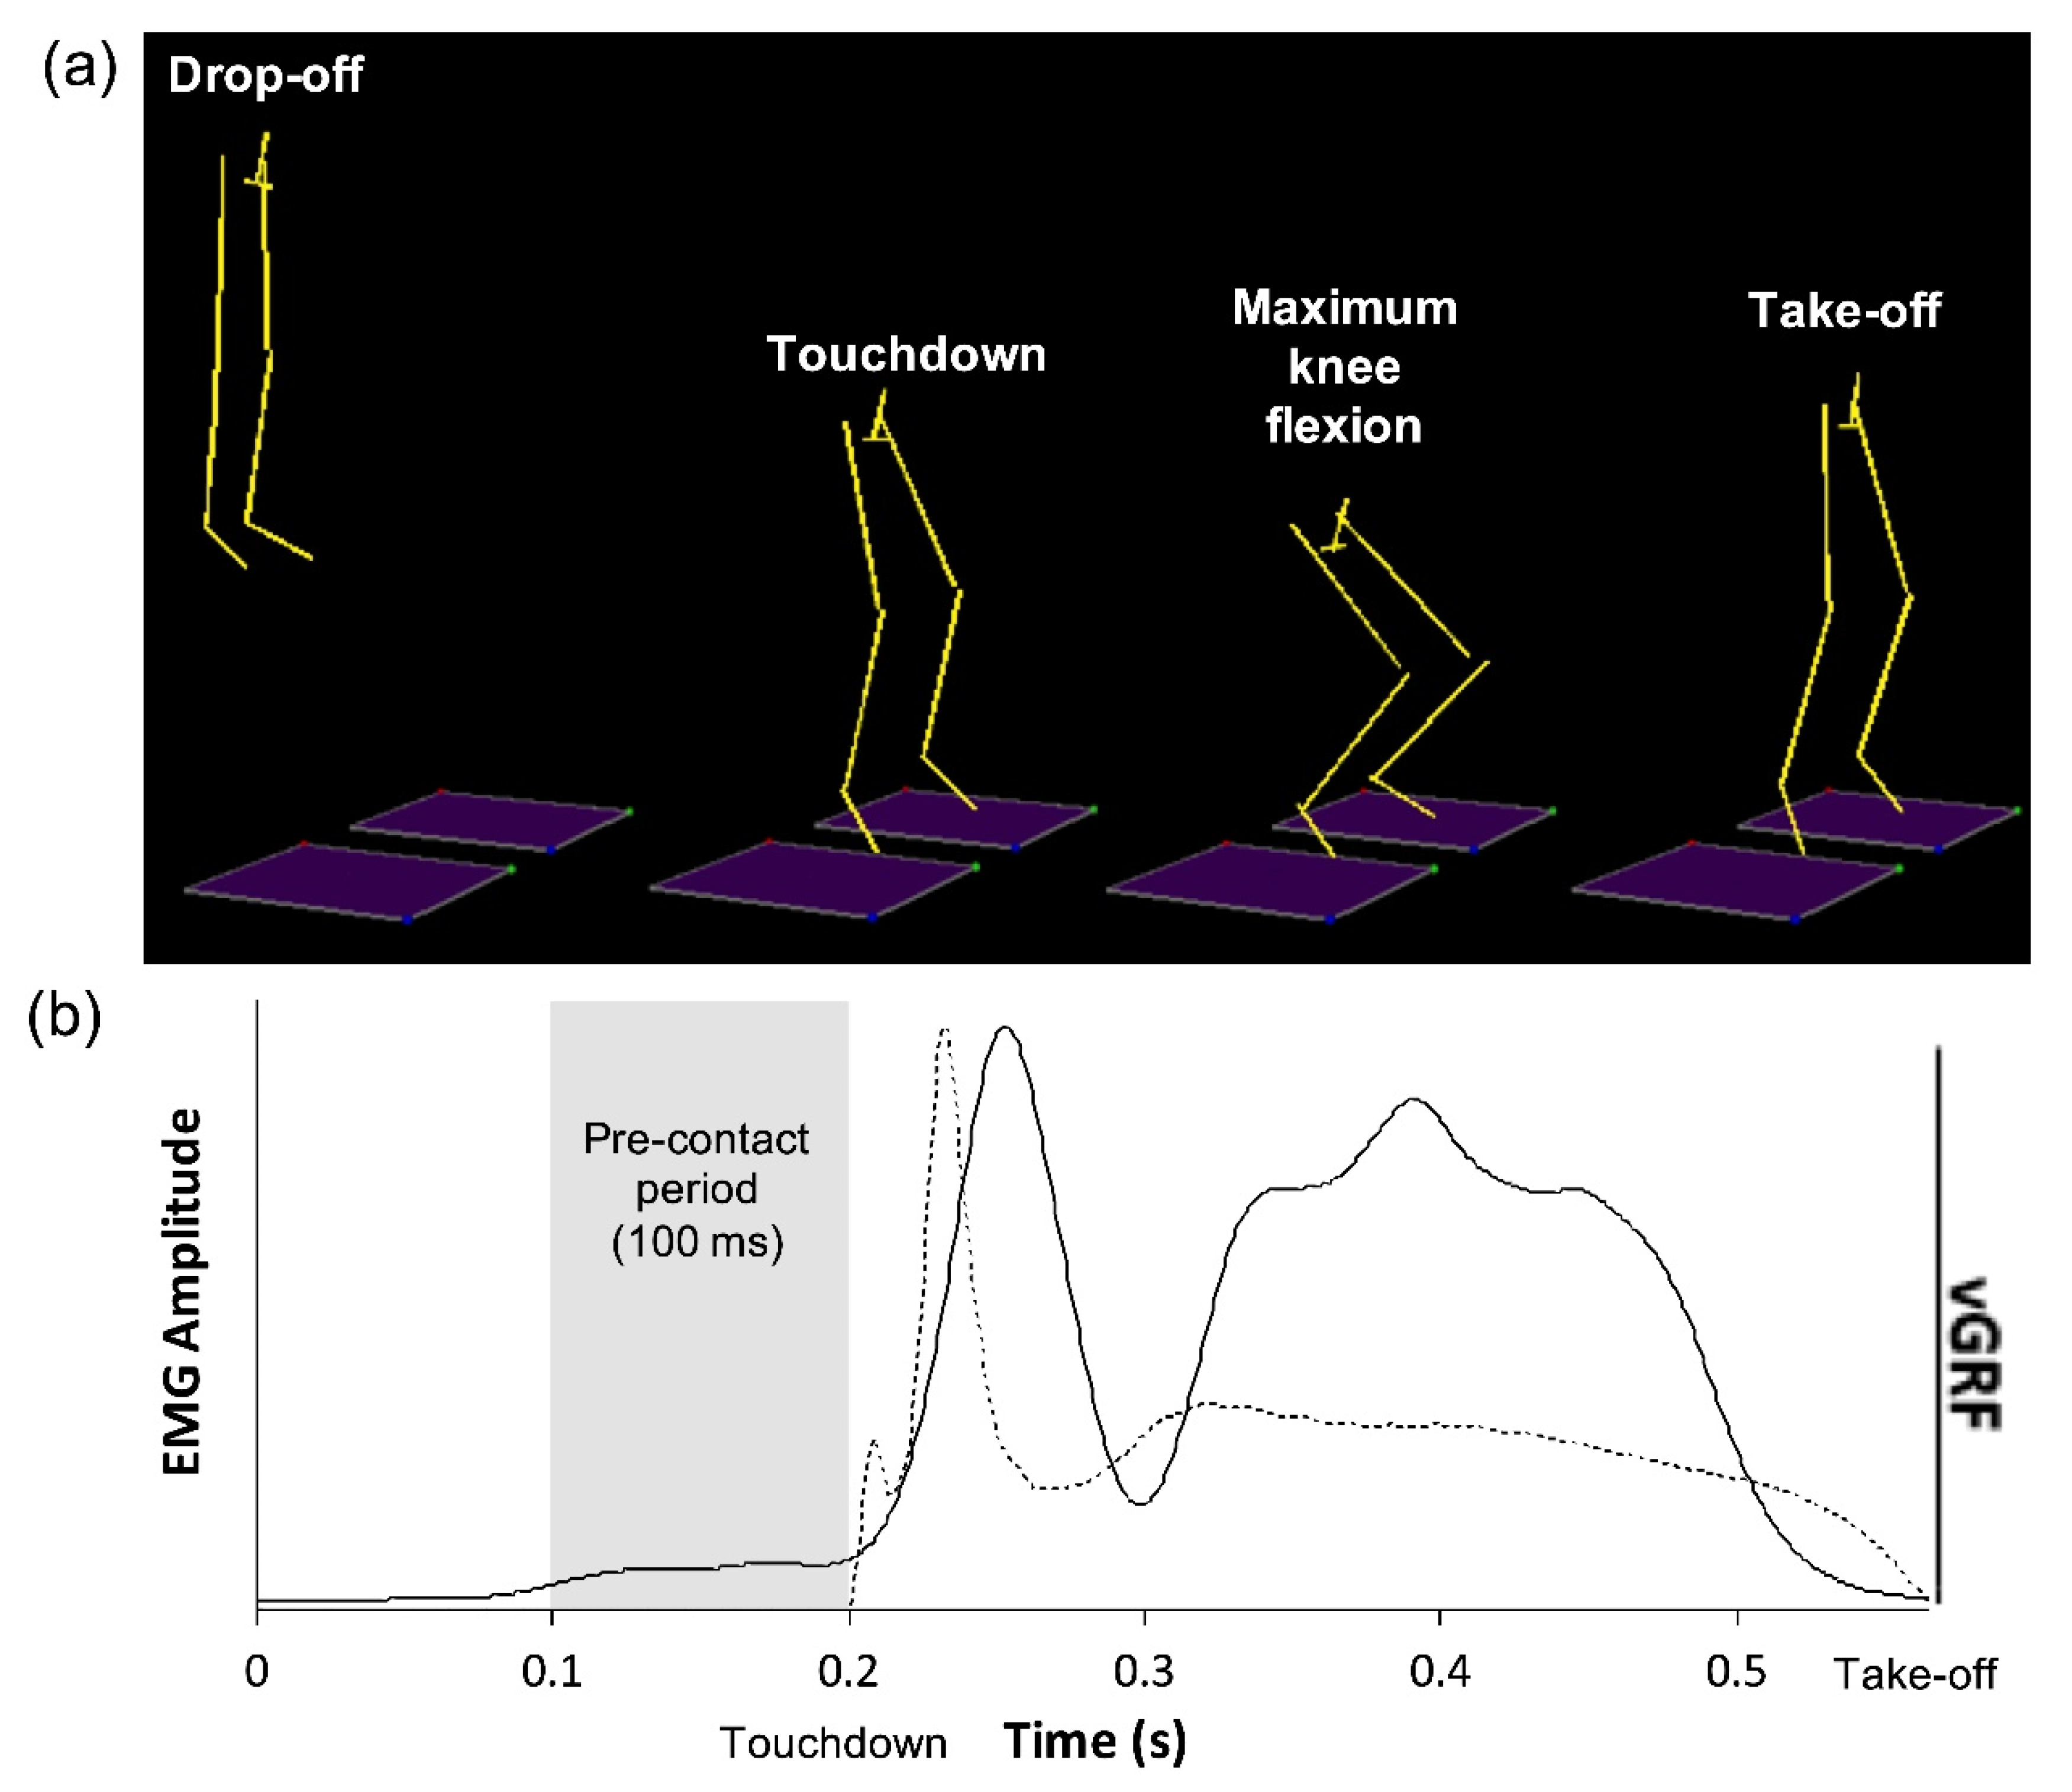
21] and were instructed to step off the platform with the right leg, land simultaneously on both feet, and then jump vertically to maximum height (
Figure 1a). Trials were considered successful when the right foot landed entirely on the right force plate with the left foot landing entirely on the adjacent force plate. The intertrial reliability of biomechanical variables obtained from this drop jumping test protocol was reported as good [
24].
Prior to data collection, participants were firstly given time to get used to the test shoes by walking freely around the laboratory. After that, they practiced the DVJ task until they executed the movement correctly [
3]. It took about 5 min to familiarize with each of the three drop heights. Once participants were comfortable with the shoes and DVJ task, the data collection commenced. Following each set of DVJs, participants rated their perceived landing impact (0 cm: very low; 15 cm: very high) on a visual analog scale (VAS), which is considered a reliable measure [
25] and is widely employed in the subjective assessment of athletic footwear [
12,
18,
26]. Seated rests were permitted ad libitum between the six sets of trials.
2.5. Data Processing
A fourth-order low-pass Butterworth filter with a cut-off frequency of 50 Hz was applied to the raw GRF signal [
27]. Maxima of the GRF signal relating to the forefoot and rearfoot impact peaks were extracted using a self-developed custom MATLAB code (v2017b, MathWorks, Natick, MA, US), as participants were reported to adopt a toe-to-heel landing style [
12,
20,
28]. The mean loading rate for forefoot and rearfoot impacts was calculated between 20%–80% of the respective slope preceding each peak [
3], with the first slope corresponding to the forefoot loading rate and the second slope corresponding to the rearfoot loading rate. GRF variables were normalized to bodyweight (BW) [
12,
28,
29].
Sagittal plane kinematic and kinetic variables of the right lower limb during the DVJs were extracted using Visual3D (v6.01.18, C-Motion, Germantown, MD, USA). Initial contact was identified when the unfiltered vertical GRF first exceeded 10 N [
5,
19,
29]. The landing phase was defined as the period from initial contact of the right foot to maximum knee flexion of the right leg [
3,
4,
30]. Marker trajectories were filtered using a fourth-order low-pass Butterworth filter with a cut-off frequency of 10 Hz. Joint angles were derived through a Cardan XYZ rotation sequence [
28] of the distal segment relative to the proximal segment. The ankle angle was normalized to the static standing position [
28,
31]. Positive joint angles (hip/knee/ankle) represent flexion/dorsiflexion; negative joint angles (hip/knee/ankle) represent extension/plantarflexion. Peak external flexion moments were determined during the landing phase [
4] for ankle, knee, and hip joints through an inverse dynamics approach [
4,
32]. The integral of the negative joint power curve defined the total eccentric joint work performed by each joint. Joint kinetics were normalized to body mass.
Mean muscle activations of each muscle were analyzed during the precontact phase of landing, which was considered to be the 100 ms period before initial contact [
5,
21,
33]. A band-pass filter (20 to 450 Hz) [
34] was applied to raw EMG signals. A linear envelope was formed by full-wave rectification of the EMG signal, then a low-pass fourth-order Butterworth filter cut off at 10 Hz was applied. Mean muscle activation was calculated by dividing the mathematical integral of the linear envelope across the precontact period by 100 ms (
Figure 1b).
2.6. Statistical Analysis
Data are expressed as mean (SD). Statistical tests were performed through SPSS 24.0 (IBM Corp., Armonk, NY, USA). Normality of data was verified. A two-way (3 drop heights × 2 levels of shoe hardness) repeated-measures ANOVA was performed with Bonferroni-corrected post hoc comparisons for all kinetic, kinematic, EMG, and VAS variables. Greenhouse–Geisser’s epsilon adjustment was applied where Mauchly’s test indicated sphericity was violated. The level of significance was set at
p < 0.05. Effect size (partial eta-squared,
ηp2) was interpreted as small (.01 <
ηp2 ≤ 0.09), medium (0.09 <
ηp2 ≤ 0.25), or large (
ηp2 > 0.25) [
35]. Post hoc power analysis was also computed. The association between the perceived landing impact and vGRF variables was assessed using Spearman’s rho (r
s) [
15]. The correlation coefficient (r
s) was interpreted as negligible (0 < |r
s| ≤ 0.30), low (.30 < |r
s| ≤ 0.50), moderate (0.50 < |r
s| ≤ 0.70), high (0.70 < |r
s| ≤ 0.90), or very high (0.90 < |r
s| ≤ 1.00) [
36].
3. Results
All participants adopted a toe-heel landing strategy for DVJs performed from the middle (46 cm) and highest (61 cm) platforms, while some participants occasionally landed flatfooted from the lowest (31 cm) platform.
3.1. Kinematics
No significant interaction or midsole hardness effects were observed for the kinematic variables that were analyzed (
Table 2). While platform height had no effect on knee or hip kinematics, the ankle was increasingly plantarflexed at initial ground contact as drop height increased (
p < 0.001), which was accompanied with a greater ankle ROM (
p = 0.002).
3.2. Kinetics
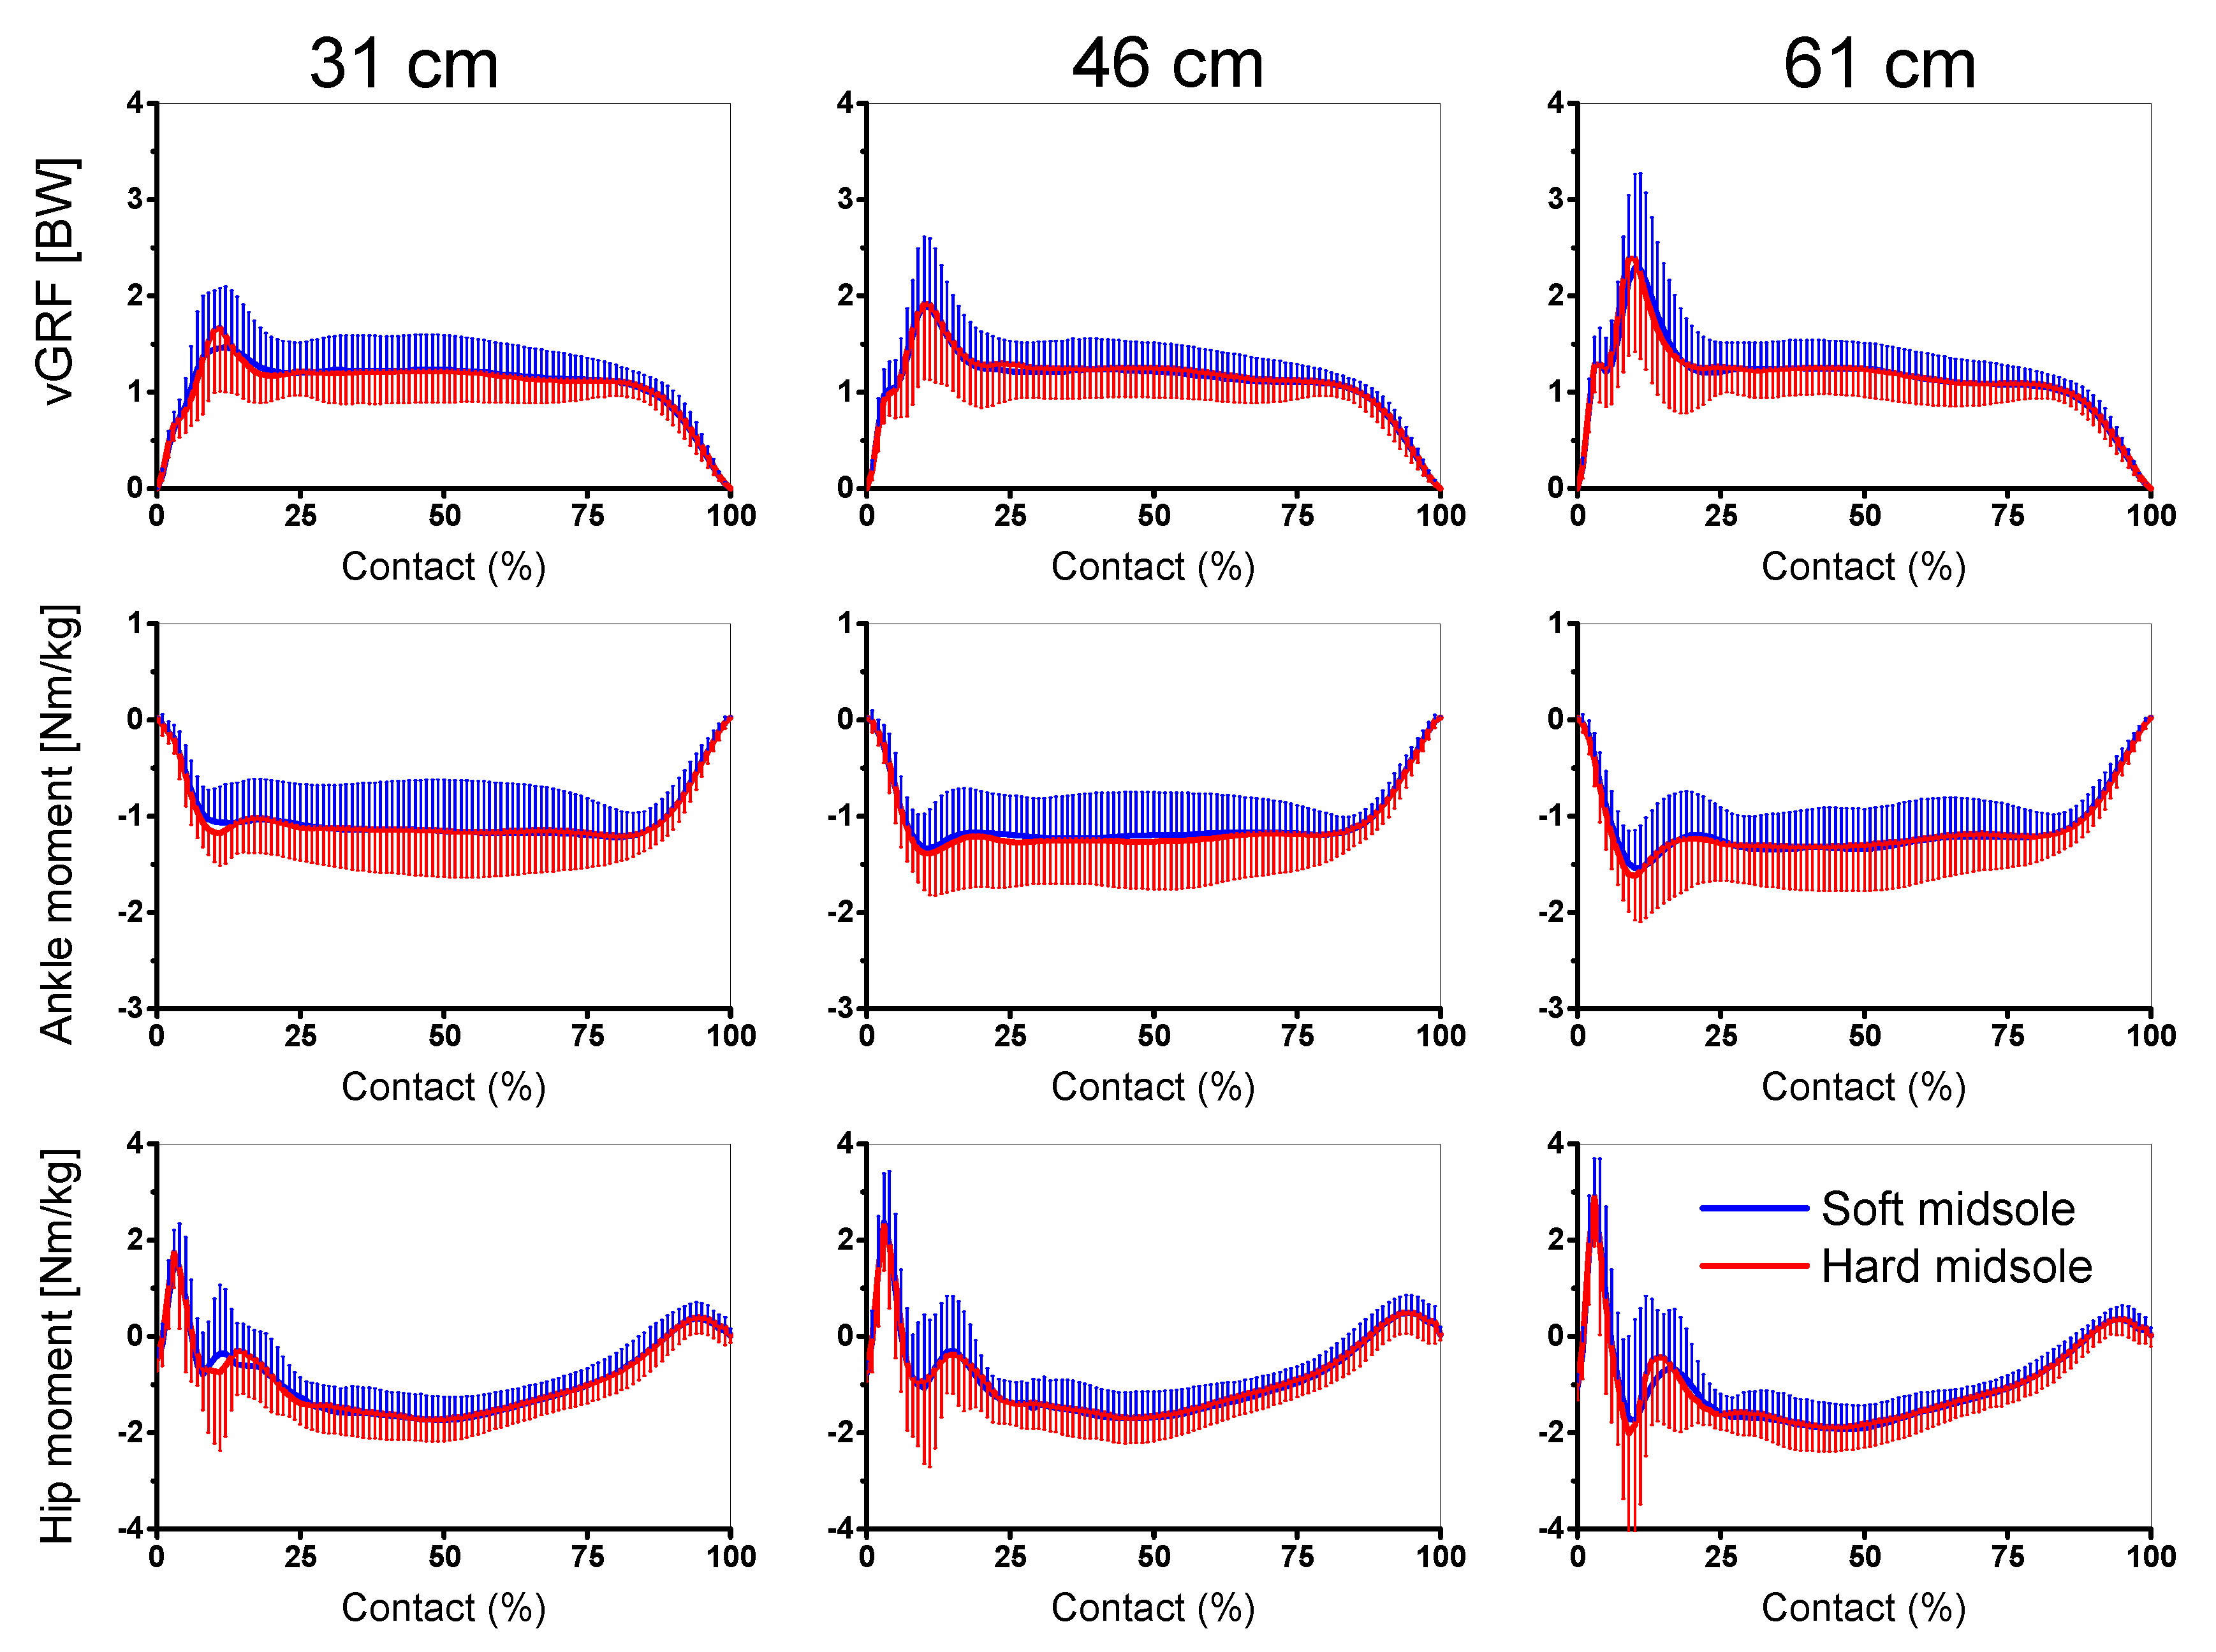
The time histories of all kinetic variables were similar, with increasing magnitudes at higher drop heights (
Figure 2). There was a significant drop height X shoe hardness interaction for rearfoot peak force (
Table 3). The interaction graph and planned contrasts revealed that the softer midsole led to a lower rearfoot peak force than the harder midsole when dropping from 46 cm and 61 cm, however midsole hardness had no effect on the 31-cm drop height. No significant interaction effects were detected for the other vGRF variables.
With the increase in drop height, the peak forces, loading rates, joint moments and work consistently increased (
p < 0.001,
Table 3). Peak force at the forefoot increased by 5% when wearing basketball shoes with the softer midsole compared with the harder midsole (
p = 0.028). Peak flexion moments were lower at the ankle (
p = 0.024) and hip joint (
p = 0.029) when wearing softer shoes compared with harder shoes.
3.3. Precontact EMG
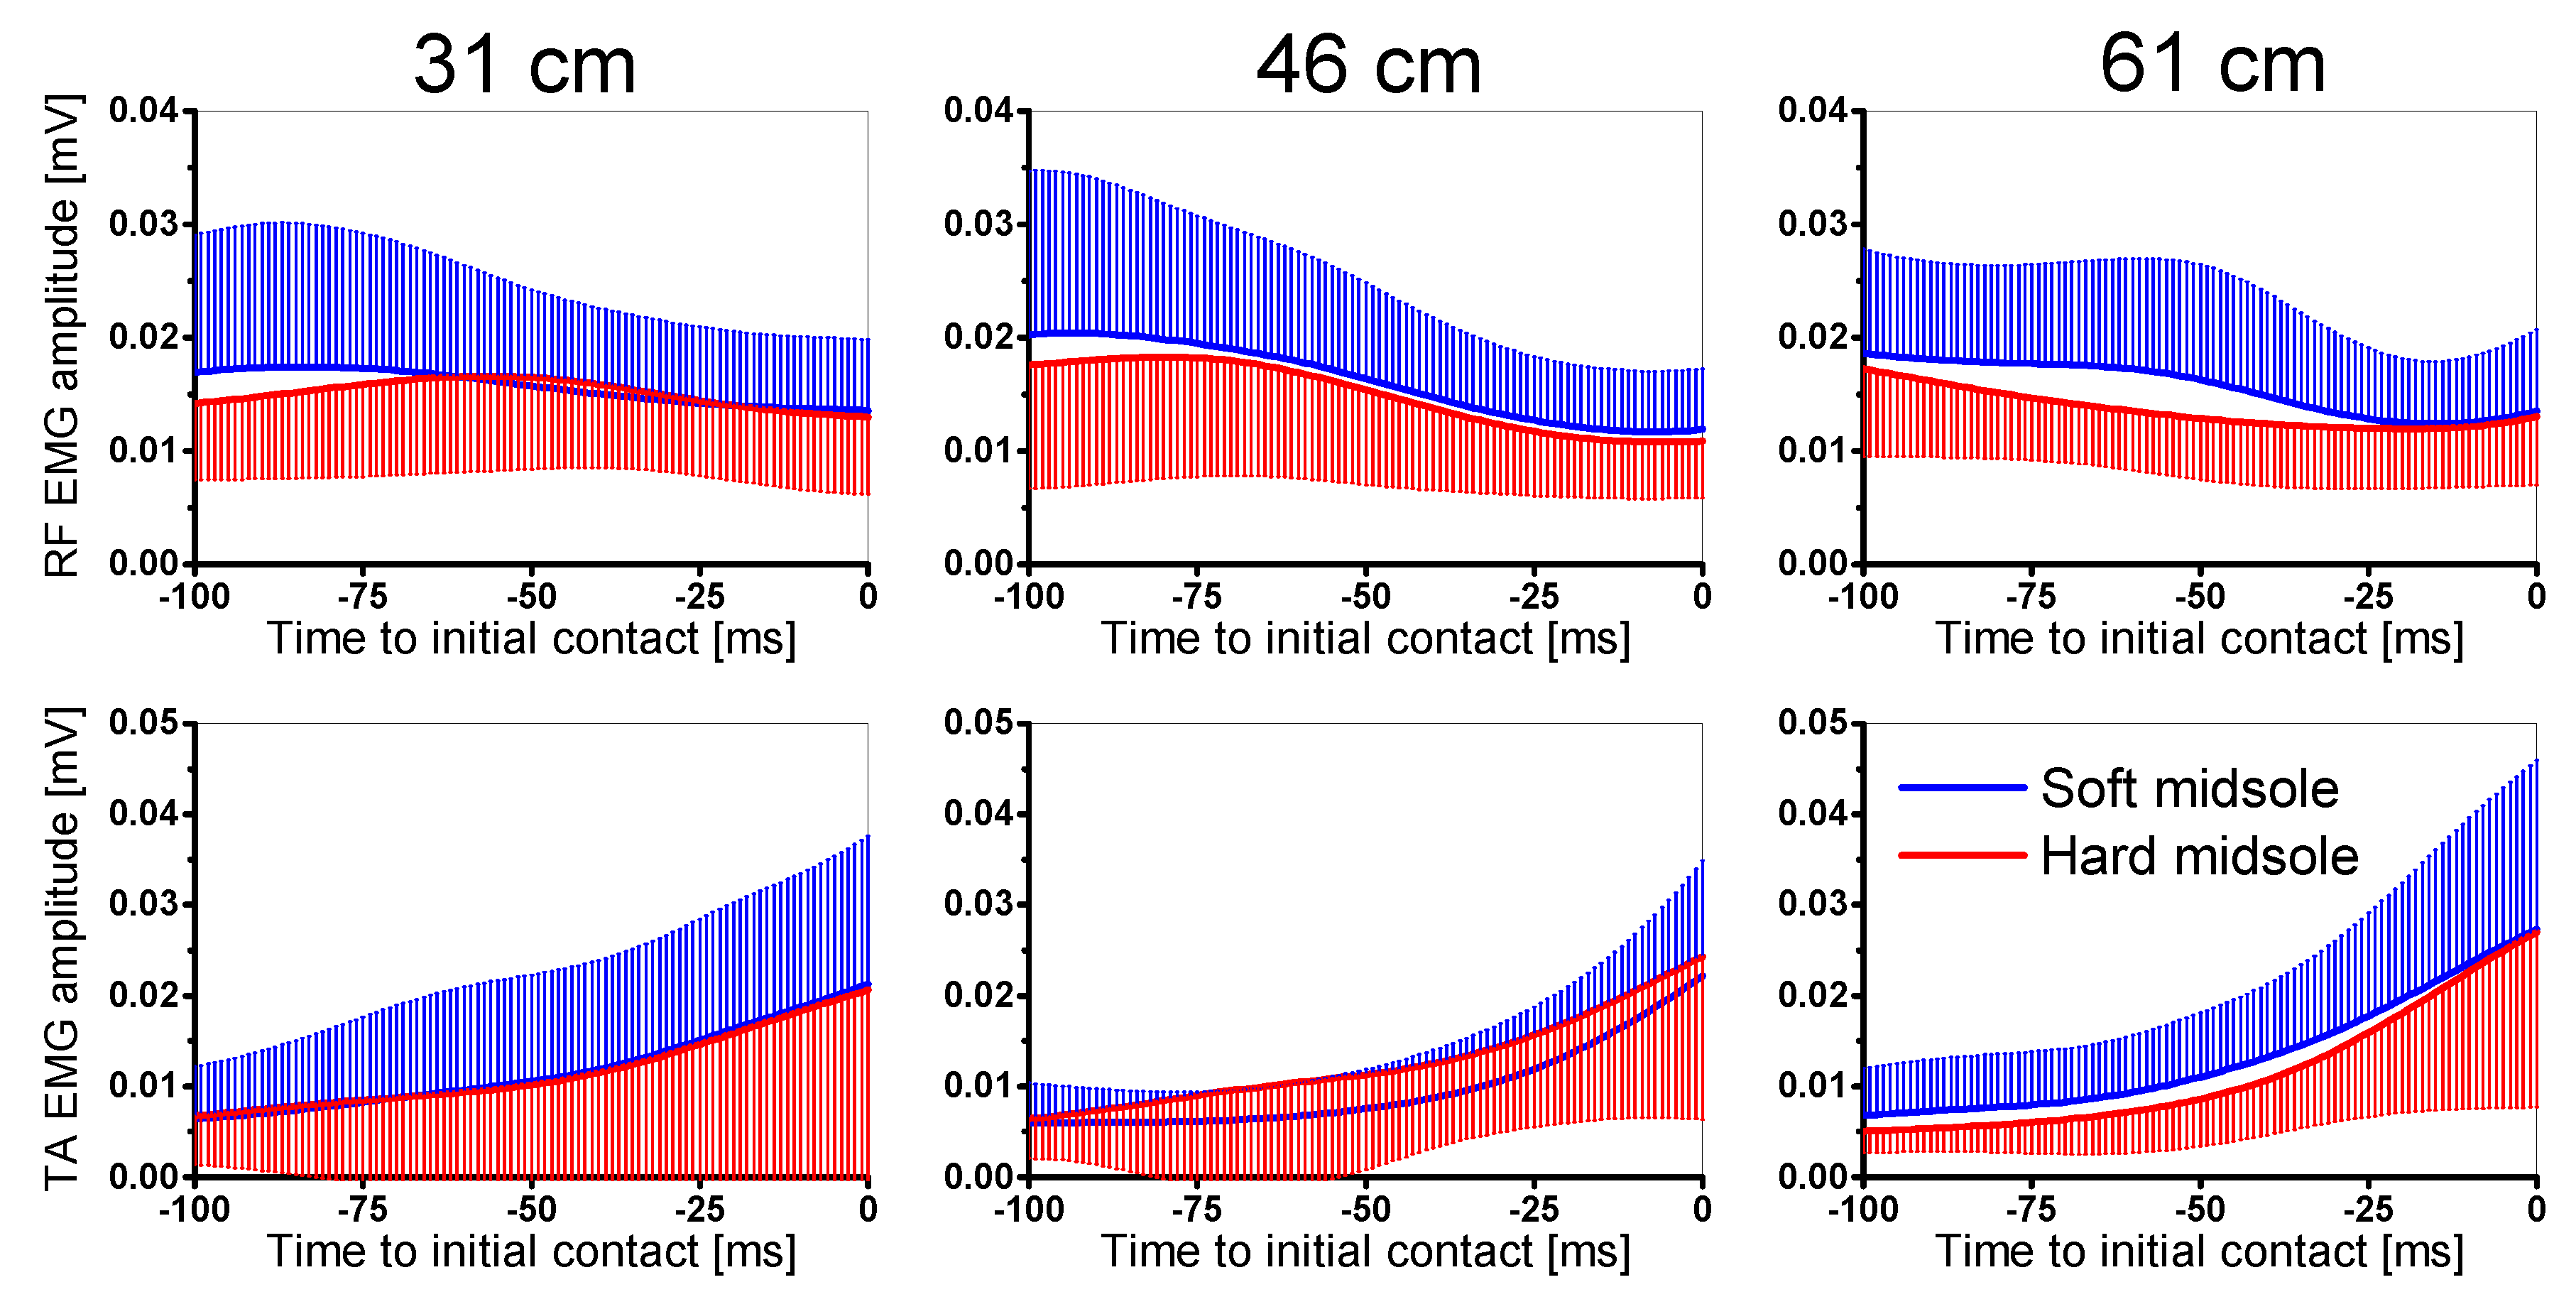
All muscles presented significantly higher precontact activation at greater drop heights. Muscle activation of the rectus femoris (
p = 0.042) and the tibialis anterior (
p = 0.043) was significantly higher when wearing the shoes with softer midsoles compared with harder midsoles (
Figure 3,
Table 4). No interaction effects were found.
3.4. Impact Perception
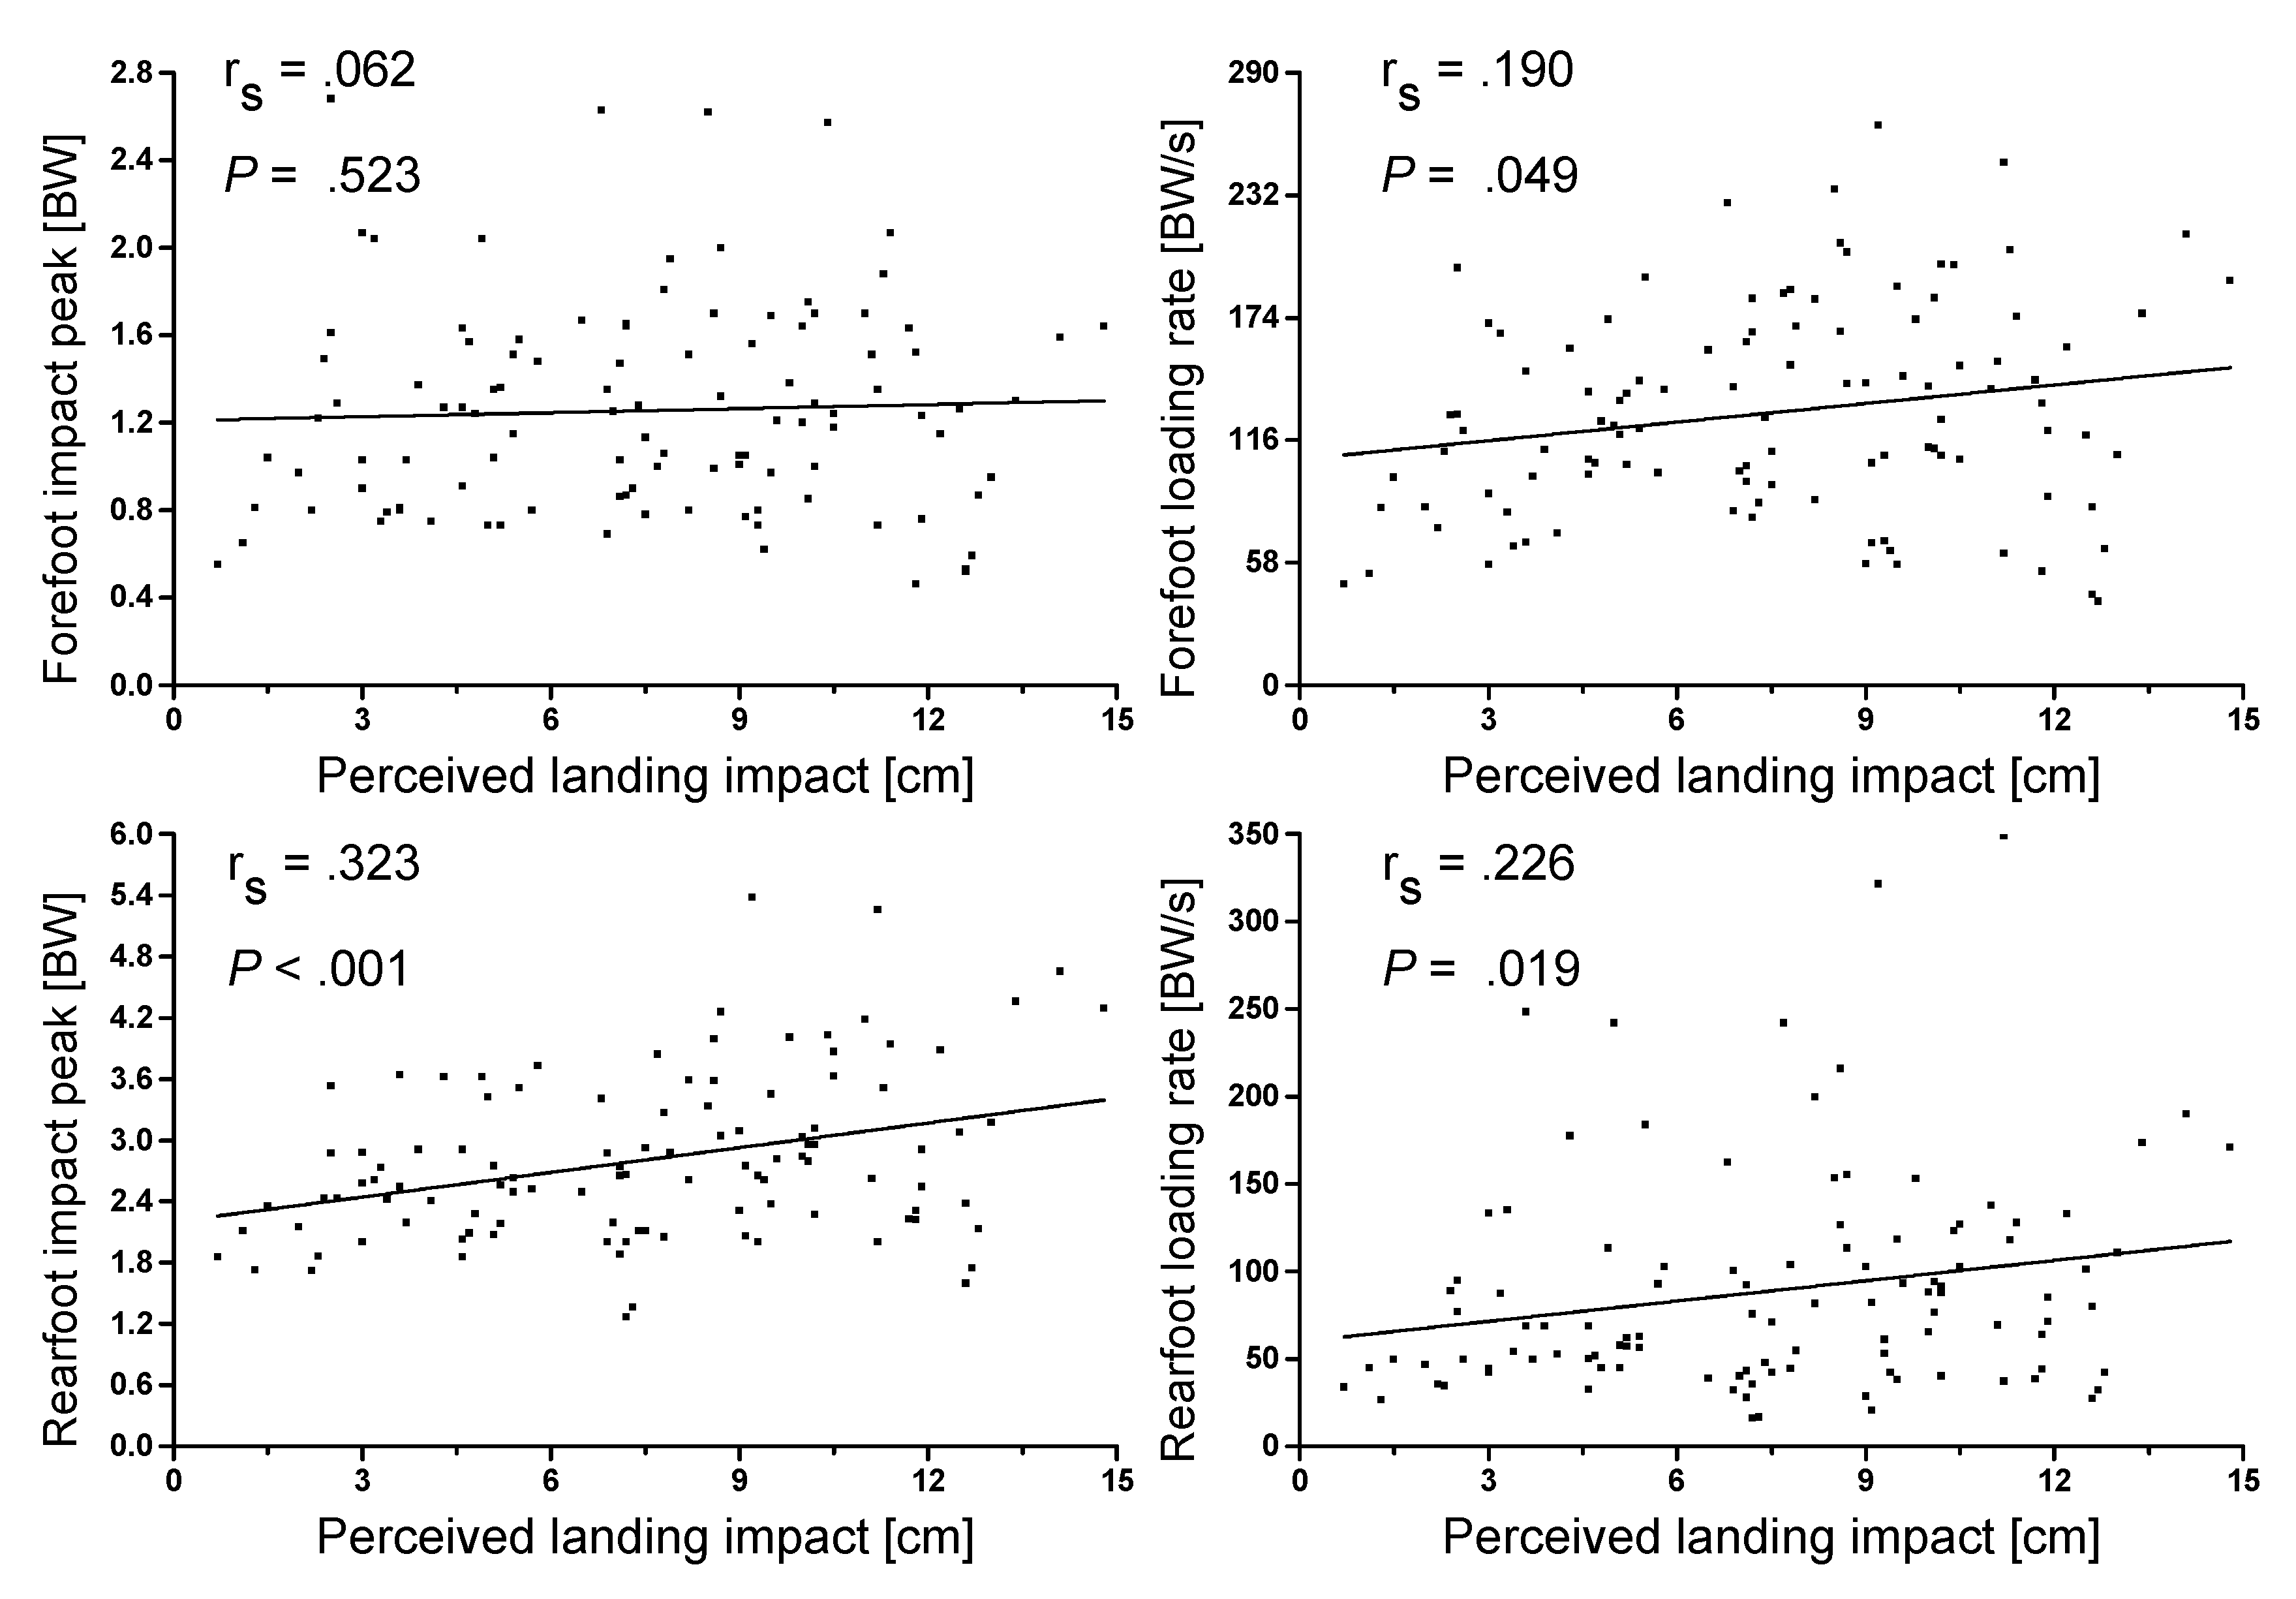
Results of the Spearman correlation indicated that there was a significant positive correlation of low strength between perceived landing impact and rearfoot vertical peak force, (r
s(106) = 0.323,
p < 0.001,
Figure 4). Forefoot and rearfoot vertical force loading rate each had a positive but negligible association with perceived landing impact (r
s(106) = 0.190,
p = 0.049; r
s(106) = 0.226,
p = 0.019, respectively).
4. Discussion
This study examined how subtle change in basketball shoe midsole hardness affected the biomechanics of DVJs from different drop heights, as well as the relationships between subjective and objective measures of landing impacts. The key findings were (1) drop height had a clear effect on lower extremity landing biomechanics of DVJs; (2) shoe midsole hardness affected the prelanding muscle activation and kinetics of DVJ, while lower limb kinematics remained consistent; (3) subjective perception of landing impact was positively correlated with vertical loading variables while association strengths were weak.
4.1. Effect of Drop Height on Landing Biomechanics
The first hypothesis of this study was that the magnitude of biomechanical variables would increase with increasing drop height. This hypothesis is supported as peak vGRF and vertical loading rate of both forefoot and rearfoot, as well as peak flexion moments of the ankle, knee and hip joints, and eccentric work of the ankle, knee, and hip joints increased with the elevated drop height. The findings on kinetic variables are in good agreement with previous studies which also reported that peak vertical GRF and respective loading rate were influenced by drop height [
2,
3]. The progressive increase in the magnitude of vertical loading was expected due to the increasing input energy from higher drop heights [
3,
4,
11]. As participants largely adopted a toe-to-heel landing style [
12,
20,
28], it is of interest to report the vGRF variables associated with the forefoot and rearfoot separately. Peak vGRF and loading rate of both forefoot and rearfoot were higher as the drop height increased, which is in line with previous work [
20]. For joint kinetics, the moments and total eccentric work of the lower limb showed a significant height effect, specifically, the higher the drop height the larger the magnitude. As a large knee flexion moment was reported to be associated with the increase in anterior cruciate ligament (ACL) injuries [
37], athletes and coaches should be aware of the heightened risk during landing from jumps. When using DVJs as a plyometric training exercise, previous studies recommended a drop height of no more than 0.6 m [
38]. Hence, the platform heights (31 cm, 46 cm, and 61 cm) used in this study were within a safe and meaningful range.
In the present study, height-dependent kinematic modifications to the landing strategy were evident only at the ankle joint, emphasizing its role in impact attenuation during landing. At the ankle joint, plantarflexion at initial contact increased with input energy (i.e., higher drop heights), allowing for a larger range of motion to support impact attenuation. This indicates that the role of the forefoot becomes more important for impact attenuation when drop height is increased. Participants adopted similar landing strategies at the knee and hip joints and kept kinematics consistent across the three drop heights. These observations are similar to the work by Zhang and colleagues [
4] who found no height effect on sagittal plane knee ROM during drop landings. Findings from the present study also parallel the results of the study by Yeow and co-workers [
30], in which a substantial increase in the vGRF variables but only subtle changes in the lower limb kinematics were found when increasing the drop height from 0.15 to 1.05 m. In contrast, Fu et al. [
3] reported a significant height effect on the sagittal knee ROM, though their reported sagittal ROM at the knee (approximately 35 degrees) was much smaller than those in the present study (around 75 degrees,
Table 2) as well as in Zhang and co-workers’ study (roughly 70 degrees) [
4], thus not allowing for a plausible comparison of findings.
Regarding neuromuscular response, a significant height effect was found in the increased EMG activation level across all lower limb muscles tested in the present study. These findings reaffirmed a previous study which reported higher quadriceps activation prior to landing with an increased drop height [
5]. General increase in preparatory muscle activation may suggest that participants tuned their joint stability via the hip, knee, and ankle extensors and flexors, to specifically adapt to the anticipated input stimulus [
5,
6].
4.2. Effect of Midsole Hardness on Landing Biomechanics
The second hypothesis of the present study was that more attenuating landing strategies would be adopted in response to harder midsoles, and this hypothesis is partly supported by the results. Collectively, small changes in midsole hardness within a commercially relevant range showed subtle effects on lower limb biomechanics in landing. With a softer midsole, participants showed increased rectus femoris and tibialis anterior muscle activation during the preparation phase to landing of DVJs. This change in neuromuscular response, however, did not result in any change in the kinematics or eccentric energy absorption of the lower limb joints, thus it may be attributed to increased efforts of joint stabilization, deemed necessary in response to softer midsole hardness. Midsole hardness significantly affected peak force at the forefoot and the rearfoot, as well as the peak flexion moment in the ankle and hip, though the magnitude of change was much smaller than that due to drop height (
Figure 2). Nevertheless, the comparatively higher forefoot peak forces and comparatively lower rearfoot peak forces in shoes with softer midsoles indicate a subtle load shift to the forefoot region, observed during landings from the medium and the highest drop height, inducing larger input energy to be controlled. It can be assumed that the forefoot with its more complex anatomical structure is better able to counteract potential lower stability coming along with softer midsole hardness of the experimental basketball footwear than the more rigid anatomical structure of the rearfoot.
The consistent landing kinematics between shoes with different midsole hardness in the present study were in agreement with previous works [
3,
11]. For example, Fu et al. [
3] also found no differences in joint angles in the lower limbs between shoes with different cushioning properties. As the knee joint extensors contribute to the energy dissipation during landing [
39], the lack of differences in total eccentric joint work can explain the consistent landing strategies between shoe conditions. Flat-footed landings were occasionally adopted by some participants when dropping from the lowest platform. The switch in flat-foot and forefoot landing techniques may have accounted for the interaction effect between midsole hardness and drop height that was observed for rearfoot peak vGRF.
4.3. Impact Perception
The third hypothesis that impact loading would be positively correlated to perceived intensity of landing impact is supported, as peak vGRF of the rearfoot and loading rates of forefoot and rearfoot had significant positive associations with the perceived landing impact. Participants were able to subjectively perceive the increasing landing impact with higher drop heights, although the strengths of the correlations were rather weak. In the present study, both the researchers and the participants were blinded from the shoe properties during the experiment. Thus, participants could only rely on their subjective perception of the foot-shoe-ground interface system to regulate their landing strategies. It has been reported that stiffer surfaces can increase net work done by the lower limbs during the landing phase of DVJs in barefooted gymnasts [
17]. In circumstances whereby stiff landing interfaces can be distinctly perceived, safer landing strategies can be adopted through increasing eccentric work of the lower limb joints. In the present study, participants presented no difference in eccentric work done at the ankle, knee, or hip joints in response to different shoe conditions. These results indicated that the differences in impact loading caused by a 10-point difference in Asker C midsole shore hardness was only perceived insufficiently and hence, participants were unable to adopt softer landing strategies based on their perception. These findings also suggest that footwear developers should comprehensively examine the biomechanical influence of footwear properties and not rely on perception-based player tests alone for the given movement tasks [
15].
4.4. Limitations
There are a few limitations to the present study. Firstly, we recruited only a small sample of 18 recreational basketball players, all within homogenous skill level. While our participants are active and well trained, they are not professional players competing at national or international levels. Findings from the present study thus may not be generalized for professional players. Future studies can substantiate the current finings for a wider population, including more participants at various playing levels. Secondly, we only recruited participants of US shoe size 7.5 to 9.5 to ensure that they fitted well with the custom-made experimental shoes. From the anthropometric measurement, their average height of 175.8 cm may be shorter than other typical basketball players, especially those from the Caucasian population and among professional players. Thus, caution should be taken when interpretation the landing biomechanics of basketball players who are of a larger physique than the Asian players in this study.
5. Conclusions
This study showed that the landing biomechanics of the lower limbs during drop vertical jump tasks were more influenced by drop height than by shoe midsole hardness. As participants dropped from greater heights, there was an increase in impact forces, loading rates, prelanding muscle activation, joint moments, and eccentric joint work. Interestingly, these changes in kinetics and neuromuscular response were only accompanied by a very subtle kinematic increase in ankle plantar flexion at initial contact and did not lead to changes in hip or knee joint kinematics. Within a commercially relevant range, softer midsole hardness has led to a load shift from the rearfoot to the forefoot for the medium and high drop height, but the magnitude of change was much smaller than that due to drop height effect. There was increased muscle activation in preparation to landing with softer midsole hardness, but no change in the kinematics or eccentric energy absorption of the lower limb joints. Subjectively, participants were able to perceive higher landing impacts with greater drop heights, though the strength of the relationships between subjective and biomechanical measures were weak.
Author Contributions
Conceptualization, T.S. and P.W.K.; methodology, C.T., J.W.P. and P.S.P.T.; software, R.A.; formal analysis, R.A. and J.W.P.; resources, P.S.P.T.; data curation, R.A., C.T. and J.W.P.; writing—original draft preparation, R.A. and C.T.; writing—review and editing, J.W.P., P.S.P.T., T.S. and P.W.K.; visualization, R.A. and J.W.P.; supervision, P.W.K.; project administration, R.A. and P.W.K.; funding acquisition, T.S. and P.W.K. All authors have read and agreed to the published version of the manuscript.
Funding
This research received no external funding. The shoes worn by participants were provided by Xtep (China) Co. Ltd.
Acknowledgments
The authors would like to thank Yoong Ping Lim, Lisa Noteboom, and Lucas Nijman for their contribution during the pilot phase of this study. One author (Jing Wen Pan) of this article is supported by the China Scholarship Council (CSC).
Conflicts of Interest
The authors declare no conflict of interest. Thorsten Sterzing was an employee at Xtep (China) Co Ltd. at the time of this study.
References
- McClay, I.S.; Robinson, J.R.; Andriacchi, T.P.; Frederick, E.C.; Gross, T.; Martin, P.; Valiant, G.; Williams, K.R.; Cavanagh, P.R. A profile of ground reaction forces in professional basketball. J. Appl. Biomech. 1994, 10, 222–236. [Google Scholar] [CrossRef]
- McNitt-Gray, J.L. Kinetics of the lower extremities during drop landings from three heights. J. Biomech. 1993, 26, 1037–1046. [Google Scholar] [CrossRef]
- Fu, W.; Liu, Y.; Zhang, S. Effects of footwear on impact forces and soft tissue vibrations during drop jumps and unanticipated drop landings. Int. J. Sports Med. 2013, 34, 477–483. [Google Scholar] [CrossRef] [PubMed]
- Zhang, S.; Derrick, T.R.; Evans, W.; Yu, Y.J. Shock and impact reduction in moderate and strenuous landing activities. Sport. Biomech. 2008, 7, 296–309. [Google Scholar] [CrossRef]
- Ford, K.R.; Myer, G.D.; Schmitt, L.C.; Uhl, T.L.; Hewett, T.E. Preferential quadriceps activation in female athletes with incremental increases in landing intensity. J. Appl. Biomech. 2011, 27, 215–222. [Google Scholar] [CrossRef]
- Wang, X.; Zhang, S.; Fu, W. Changes in impact signals and muscle activity in response to different shoe and landing conditions. J. Hum. Kinet. 2017, 56, 5–18. [Google Scholar] [CrossRef]
- Borowski, L.A.; Yard, E.E.; Fields, S.K.; Comstock, R.D. The epidemiology of US high school basketball injuries, 2005–2007. Am. J. Sports Med. 2008, 36, 2328–2335. [Google Scholar] [CrossRef]
- Brauner, T.; Zwinzscher, M.; Sterzing, T. Basketball footwear requirements are dependent on playing position. Footwear Sci. 2012, 4, 191–198. [Google Scholar] [CrossRef]
- Lake, M.J. Determining the protective function of sports footwear. Ergonomics 2000, 43, 1610–1621. [Google Scholar] [CrossRef]
- Lam, W.K.; Kan, W.H.; Chia, J.S.; Kong, P.W. Effect of shoe modifications on biomechanical changes in basketball: A systematic review. Sports Biomech. 2019, 1–27. [Google Scholar] [CrossRef]
- Zhang, S.; Clowers, K.; Kohstall, C.; Yu, Y.-J. Effects of various midsole densities of basketball shoes on impact attenuation during landing activities. J. Appl. Biomech. 2005, 21, 3–17. [Google Scholar] [CrossRef] [PubMed]
- Nin, D.Z.; Lam, W.K.; Kong, P.W. Effect of body mass and midsole hardness on kinetic and perceptual variables during basketball landing manoeuvres. J. Sports Sci. 2016, 34, 756–765. [Google Scholar] [CrossRef] [PubMed]
- Wei, Q.; Wang, Z.; Woo, J.; Liebenberg, J.; Park, S.-K.; Ryu, J.; Lam, W.-K. Kinetics and perception of basketball landing in various heights and footwear cushioning. PLoS ONE 2018, 13, e0201758. [Google Scholar] [CrossRef] [PubMed]
- Lam, W.K.; Ng, W.X.; Kong, P.W. Influence of shoe midsole hardness on plantar pressure distribution in four basketball-related movements. Res. Sports Med. 2017, 25, 37–47. [Google Scholar] [CrossRef] [PubMed]
- Leong, H.F.; Lam, W.-K.; Ng, W.X.; Kong, P.W. Center of pressure and perceived stability in basketball shoes with soft and hard midsoles. J. Appl. Biomech. 2018, 34, 284–290. [Google Scholar] [CrossRef]
- Okholm Kryger, K.; Jarratt, V.; Mitchell, S.; Forrester, S. Can subjective comfort be used as a measure of plantar pressure in football boots? J. Sports Sci. 2017, 35, 953–959. [Google Scholar] [CrossRef] [PubMed]
- Arampatzis, A.; Stafilidis, S.; Morey-Klapsing, G.; Brüggemann, G. Interaction of the human body and surfaces of different stiffness during drop jumps. Med. Sci. Sports Exerc. 2004, 36, 451–459. [Google Scholar] [CrossRef]
- Kong, P.W.; Lim, C.Y.; Ding, R.; Sterzing, T. Subjective evaluation of running footwear depends on country and assessment method: A bi-national study. Ergonomics 2015, 58, 1589–1604. [Google Scholar] [CrossRef]
- Bates, N.A.; Ford, K.R.; Myer, G.D.; Hewett, T.E. Kinetic and kinematic differences between first and second landings of a drop vertical jump task: Implications for injury risk assessments. Clin. Biomech. 2013, 28, 459–466. [Google Scholar] [CrossRef]
- Tobalina, J.C.; Calleja-González, J.; de Santos, R.M.; Arteaga-Ayarza, A.; Fernández-López, J.R. The effect of basketball footwear on the vertical ground reaction force during the landing phase of drop jumps. Rev. Psicol. Deport. 2013, 22, 179–182. [Google Scholar]
- Arai, A.; Ishikawa, M.; Ito, A. Agonist–antagonist muscle activation during drop jumps. Eur. J. Sport Sci. 2013, 13, 490–498. [Google Scholar] [CrossRef] [PubMed]
- Mizner, R.L.; Chmielewski, T.L.; Toepke, J.J.; Tofte, K.B. Comparison of 2-dimensional measurement techniques for predicting knee angle and moment during a drop vertical jump. Clin. J. Sport Med. 2012, 22, 221–227. [Google Scholar] [CrossRef] [PubMed]
- Khlifa, R.; Aouadi, R.; Hermassi, S.; Chelly, M.S.; Jlid, M.C.; Hbacha, H.; Castagna, C. Effects of a plyometric training program with and without added load on jumping ability in basketball players. J. Strength Cond. Res. 2010, 24, 2955–2961. [Google Scholar] [CrossRef] [PubMed]
- Lim, Y.Y.; Sterzing, T.; Teo, C.J.; Alonzo, R.; Pan, J.W.; Teng, P.S.; Kong, P.W. Between-limb asymmetry in kinetic and temporal characteristics during bilateral plyometric drop jumps from different heights. J. Sports Sci. 2020, 1–10. [Google Scholar] [CrossRef] [PubMed]
- Mills, K.; Blanch, P.; Vicenzino, B. Identifying clinically meaningful tools for measuring comfort perception of footwear. Med. Sci. Sports Exerc. 2010, 42, 1966–1971. [Google Scholar] [CrossRef]
- Tay, C.S.; Sterzing, T.; Lim, C.Y.; Ding, R.; Kong, P.W. Overall preference of running shoes can be predicted by suitable perception factors using a multiple regression model. Hum. Factors J. Hum. Factors Ergon. Soc. 2017, 59, 432–441. [Google Scholar] [CrossRef]
- Hewett, T.E.; Myer, G.D.; Ford, K.R.; Heidt, R.S.; Colosimo, A.J.; McLean, S.G.; van den Bogert, A.J.; Paterno, M.V.; Succop, P. Biomechanical measures of neuromuscular control and valgus loading of the knee predict anterior cruciate ligament injury risk in female athletes: A prospective study. Am. J. Sports Med. 2005, 33, 492–501. [Google Scholar] [CrossRef]
- Weinhandl, J.T.; Smith, J.D.; Dugan, E.L. The effects of repetitive drop jumps on impact phase joint kinematics and kinetics. J. Appl. Biomech. 2011, 27, 108–115. [Google Scholar] [CrossRef]
- Paterno, M.V.; Schmitt, L.C.; Ford, K.R.; Rauh, M.J.; Myer, G.D.; Huang, B.; Hewett, T.E. Biomechanical measures during landing and postural stability predict second anterior cruciate ligament injury after anterior cruciate ligament reconstruction and return to sport. Am. J. Sports Med. 2010, 38, 1968–1978. [Google Scholar] [CrossRef]
- Yeow, C.H.; Lee, P.V.S.; Goh, J.C.H. Regression relationships of landing height with ground reaction forces, knee flexion angles, angular velocities and joint powers during double-leg landing. Knee 2009, 16, 381–386. [Google Scholar] [CrossRef]
- Hewett, T.E.; Myer, G.D.; Ford, K.R.; Heidt, R.S.; Colosimo, A.J.; McLean, S.G.; van den Bogert, A.J.; Paterno, M.V.; Succop, P. Neuromuscular control and valgus loading of the knee predict acl injury risk in female athletes. Med. Sci. Sports Exerc. 2004, 36, S287. [Google Scholar] [CrossRef]
- Winter, D.A. Biomechanics and Motor Control of Human Movement; John Wiley & Sons, Inc.: Hoboken, NJ, USA, 2009; pp. 189–198. [Google Scholar]
- Palmieri-Smith, R.M.; Wojtys, E.M.; Ashton-Miller, J.A. Association between preparatory muscle activation and peak valgus knee angle. J. Electromyogr. Kinesiol. 2008, 18, 973–979. [Google Scholar] [CrossRef] [PubMed]
- Ruan, M.; Zhang, Q.; Wu, X. Acute effects of static stretching of hamstring on performance and anterior cruciate ligament injury risk during stop-jump and cutting tasks in female athletes. J. Strength Cond. Res. 2017, 31, 1241–1250. [Google Scholar] [CrossRef]
- Hanna, D.; Dempster, M. Psychology Statistics for Dummies; John Wiley & Sons: Chichester, UK, 2012; Chapter 11. [Google Scholar]
- Mukaka, M.M. Statistics corner: A guide to appropriate use of correlation coefficient in medical research. Malawi Med. J. 2012, 24, 69–71. [Google Scholar] [PubMed]
- Leppänen, M.; Pasanen, K.; Krosshaug, T.; Kannus, P.; Vasankari, T.; Kujala, U.M.; Bahr, R.; Perttunen, J.; Parkkari, J. Sagittal plane hip, knee, and ankle biomechanics and the risk of anterior cruciate ligament injury: A prospective study. Orthop. J. Sports Med. 2017, 5. [Google Scholar] [CrossRef] [PubMed]
- Peng, H.-T. Changes in biomechanical properties during drop jumps of incremental height. J. Strength Cond. Res. 2011, 25, 2510–2518. [Google Scholar] [CrossRef]
- Zhang, S.N.; Bates, B.T.; Dufek, J.S. Contributions of lower extremity joints to energy dissipation during landings. Med. Sci. Sports Exerc. 2000, 32, 812–819. [Google Scholar] [CrossRef]
© 2020 by the authors. Licensee MDPI, Basel, Switzerland. This article is an open access article distributed under the terms and conditions of the Creative Commons Attribution (CC BY) license (http://creativecommons.org/licenses/by/4.0/).


 ,
, 


