1. Introduction
The study of Electroencephalogram (EEG) signals can reveal complex phenomena associated with different kinds of non-linear interactions. Thus, the non-linear analysis is able to provide a useful diagnosis and information to generate a prognosis. Hence, the mathematical tool, called Power Spectrum Density, has been applied in this article to study the dynamics of EEG time series from neurotypic children and children with and Infantile Spastic Cerebral Palsy.
The numbers of people with a disability in the world increases year by year, in particular those referring to cognitive abilities. In Mexico, approximately 747 thousand people suffer of mental diseases and cognitive ability problems, according to a study conducted by the National Institute of Statistics and Geography (INEGI) [
1]. The statistics given by this census show (
Figure 1) that the fourth cause of disability in Mexico is mental and the seventh one is cognitive problems.
It is important to highlight the definition of a human being to understand the problem faced by patients with some mental or cognitive problem. In this way, a human being is a primate classified in the species Homo sapiens and is anatomically similar and related to the great apes. Both humans and great apes share similar anatomical structure and cognitive abilities, which clearly differentiate them from other animal species. These cognitive abilities shape the culture behavior of a certain group of humans. When a person does not adopt this behavior, regardless of whether the person is able to comply them or not, is commonly segregated. That is why it is essential that these kind of people have therapies with a view to their integration into human society.
In particular, not only certain types of disabilities such as Infantile Spastic Cerebral Palsy (ISCP) but also rehabilitation related to neuronal problems have both physical and alternative therapies. There are a huge amount of the alternative therapies such as the ones assisted by animals like dolphins or horses, aromatherapy or acupuncture, which try to complement conventional and physical therapies. It is possible to understand what may happen in some areas of the patient’s brains taking alternative therapies by studying brain signals or EEG, applying tools from mathematics and artificial intelligence in order to assess the effectiveness and efficiency of alternative treatments such as the Dolphin-Assisted Therapy (DAT).
Machine Learning provides a necessary and proliferating background, on what artificial intelligence could be further developed. Specifically, the Cognitive Dynamic System (CDS) is one of the machine learning schemes for using large data sets, examples and experiences by algorithms, in order to extract the model from the data set and, thus, to make predictions and, at a given moment, even optimize the model extracted [
2]. Fuster in [
3] proposed the concept of cognitive as a representation of knowledge in cerebral cortex and an abstract model of cognitive composed of five building blocks: perception, memory, attention, intelligence and language. From CDS’ view of point, it can be divided into two classes—the first one mimics the human brain in some sensory way, and the second one is where a design motivated by human cognition is required.
From an engineering perspective, the CDS is made up of the following four fundamental blocks. (i) Cycle of perception-action (PAC), which generates information gained through the processing of signals received from the environment, in each cycle carried out there is an information gained. (ii) Memory, which encodes the received signal, stores the encoded information and evokes it when necessary in response to an input, in some cases memory can predict the consequences of any action to be taken. (iii) Attention, which allows the effective and efficient use of computational resources and avoids information overload. (iv) Intelligence, which enables a decision-making control mechanism to be selected, in order to decide the optimal strategy to achieve a predetermined objective despite disturbances and uncertainties in the environment [
3].
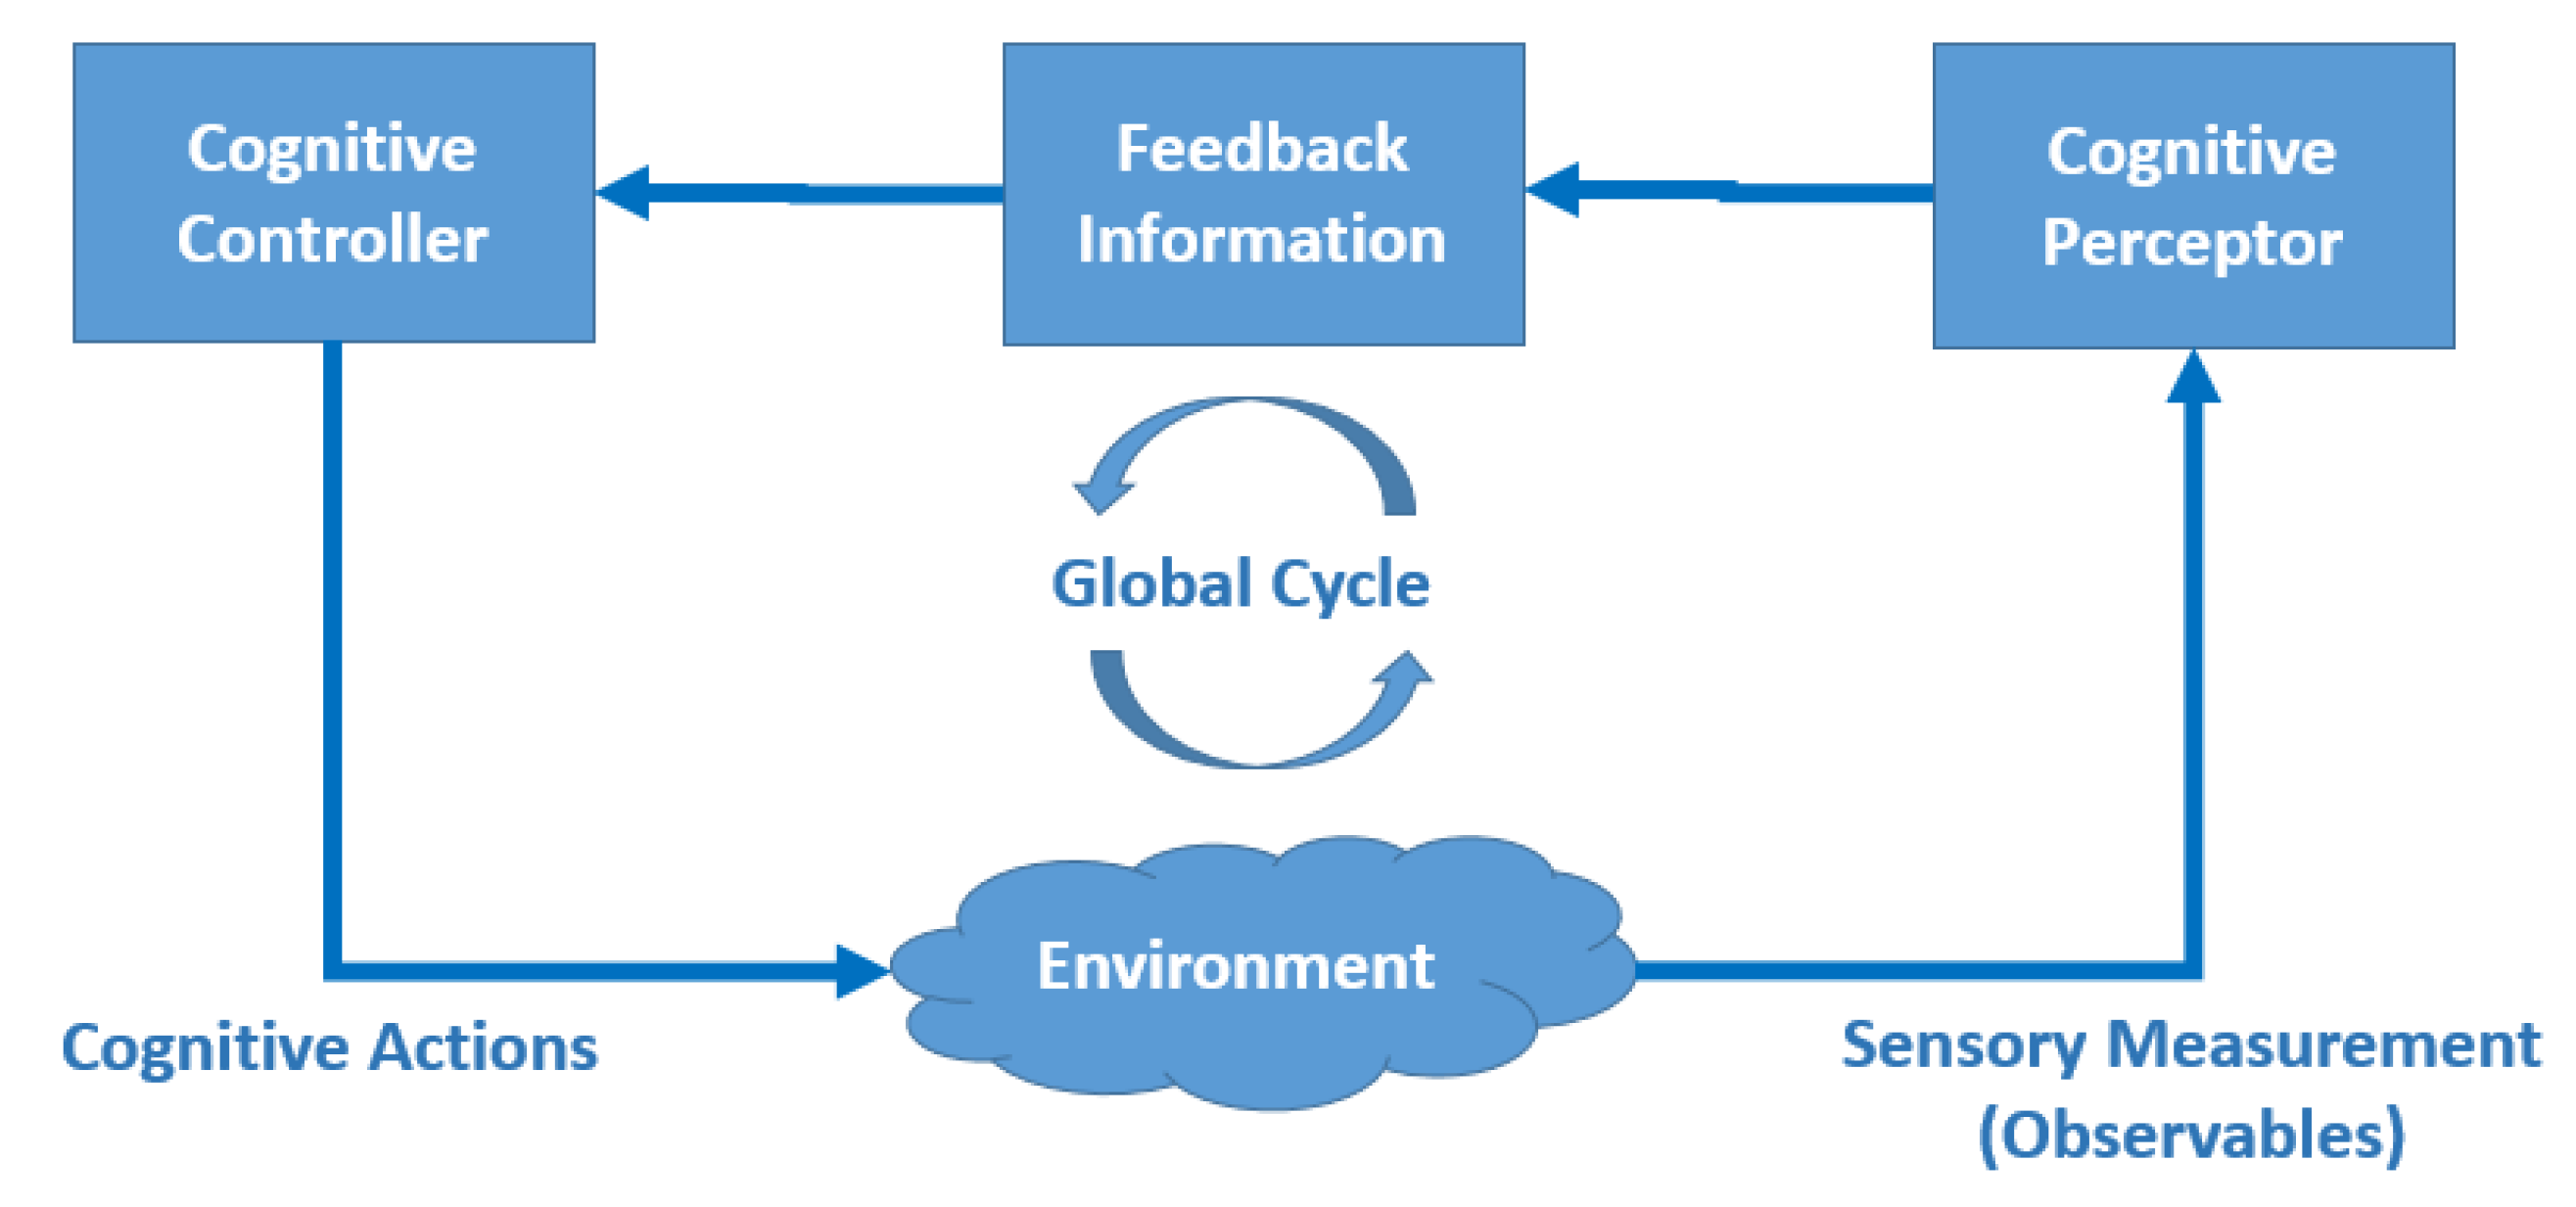
The CDS physically has a cognitive sensor to process all observable environmental stimuli, extracts relevant information from it, and calculates feedback information based on perception errors,
Figure 2. This feedback data is sent to cognitive controller and used as input to perform on the environment, yielding changes in the setting and in turn leads to new perceptions, allowing that iterative cycle continues until the previously defined objective is achieved. Both the perceiver and the cognitive controller are reciprocally coupled and each of them have their own internal feedback-loops and local processes (perceptual attention and executive attention) [
4].
From the engineering perspective, the CDS has been applied to industrial and domestic sectors, either to streamline and improve transmission of data in several materials for communications systems or to enhance accuracy of cognitive radar by performing simulations of magnetic resonance imaging (MRI) data. Also, to make Smart Homes come true through combination of technology in IoT and CDS building blocks, allowing people to operate the washing machine remotely. In addition, CDS application adds elements from the neurosciences (operation of the prefrontal cortex) and economics (risk management) that hold on physical systems under control in order to keep reliable across time. This in turn could bring ideas for risk management in neuroscience (disease development) and provide a different approach to the traditional economic point of view. These implementations focus on making known how physical systems manage to be better versions according to different industrial goals, leaving aside how these improvements can impact complex systems such as humans and the study or treatment of human organs illnesses.
In this work, according to the above, proposes the HSS-Cognitive to measure the effectiveness and efficiency of the dolphin-assisted therapy applied to patients with ISCP (Infantile Spastic Cerebral Palsy)in Mexico. The HSS-Cognitive was developed jointly with Delfiniti Mexico, which is a company dedicated to the interaction between people and dolphins in activities related not only to swimming with these cetaceans but also with therapies assisted by them.
Thus, based on the HSS-Cognitive proposed, the goal of this work is to design a Healthcare Smart System along with a methodology for measuring the efficiency of a therapy, giving a tool not only for therapist or medical doctors but also for researchers in neurosciences. The further sections of this article are organized as follows. In
Section 2 we briefly reported the related works in DAT. In
Section 3 we talk about some studies related to electroencephalography. In
Section 4, an explanation of the Power Spectral Density is given. HSS-Cognitive scheme is defined in
Section 5. While in
Section 6 the comparison of the performances of experiments are announced, in order to verify the correction and feasibility of the proposal. Finally, the arguments and discussions of this work are analyzed in
Section 7.
2. Literature Review
Dynamic cognitive systems are used in a diversity of applications, based on the way the human brain makes decisions. Authors such as Naghshvarianjahromi, Kumar and Deen have proposed for their work published in 2019 [
2] a novel Cognitive Dynamic System (CDS) algorithm to be applied in environments that are not Gaussian and linear and has finite memory. This algorithm brings the possibility of being applied when making cognitive decisions, combining two approaches from machine learning. The first approach is the supervised learning algorithm in the perceiver in which generates a reward gain and predicts the result of the dynamic environment; the second one is the reinforcement learning in the executive that makes use of the internal reward of the current cycle to determine what action can increase or decrease the internal reward for the next cycle of perception-action (PAC). As a case study, the algorithm is applied in a non-linear long-distance fiber optic link and obtained an improvement of the Q factor of ∼7 dB and a ∼43% in data rate efficiency, in addition to guaranteeing maintenance automatically the error of cognitive decision-making below the system threshold.
Authors such as Feng, Setoodeh and Haykin [
5] proposed the integration of the CDS and Internet of Things (IoT) which is called cognitive IoT (CIoT), for its application in homes where people and the IoT interact to improve the quality of life (Smart Home) by developing a smart environment for living. Such integration systematically allows the IoT to develop cognition to carry out several activities at home where electronic, electrical and other kind of devices are implicated with minimal human intervention, since it is managed through software applications. Basically the proposal implies that the CDS supervises all the components in the interactive IoT network, which is made up of different blocks (perception, memory, attention, intelligence and language) interacting each other and to which at least three kind of cognitive actions are applied. First cognitive action is applied in the environment that indirectly affect the perception process, the second one is for the system itself that allows reconfiguration of sensors and actuators, and the third one is applied as part of the control actions status in order to reduce the information gap. As a whole, CDS building blocks allow us to have great advantages over the existing options on the market that could lead to Smart Home being a reality.
The CDS elements can bring risk under control for physical systems that have uncertainties. Since almost all systems are immersed in dynamic environments, Reference [
6] introduces a new term called prefrontal executive as a part of CDS, in order to get under control the risk for uncertainties due to in executive block (memory) adaptation takes place because of its feedback loop. This feature makes CDS a predictive-adaptive system that is under control by means of task switches. Moreover, it enables the whole system to have sufficient power for information processing, keep both mathematical and computational risk under control, act as supervisor of complex networks, and provides Neurosciences with ideas about how to control cognitive risk.
In 2016, Krishnan, Schwering and Sarraf in Reference [
7] proposed the four functional blocks of the PAC (Perception-Action Cycle), carrying out simulations of MRI data for extracting brain networks by means of three non-linear filters, in order to demonstrate that this improved the accuracy in the tracking of cognitive radar above traditional active radar. Likewise, they used the risk management concept for a better control of the parameters and to improve the cognitive radar performance by reducing noise based on estimation of error in cognitive radar applying a Probabilistic Independent Component Analysis approach. Finally, they used parallel computing for increasing the speed in the system (around 4 times faster) as well as its precision.
On the other hand, with aging and disease, the dynamics of many integrated physiological processes of an organism is affected. Those changes in our brain can be quantified by studying the signals (time series) that reflect the dynamics of this complex biological system. The recording of these biosignals can be obtained by means of electroencephalography, since the EEG is a non-invasive technique due to it is performed through disc-shaped electrodes arranged in the scalp of the patients. Hence, in this work, in order to study EEG time series from both neurotypic children and children with Spastic and Infantile Cerebral Palsy, the Power Spectrum Density was applied, the findings of which helped us to measure and assess the effectiveness and efficiency of the the dolphin-assisted therapy and to reach our goal.
3. Electroencephalography
Electroencephalography (EEG) studies, compared to other imaging techniques or behavioral observations, have advantages because of their excellent time resolution since several records can be taken in a second through multiple sensors. For example, magnetoencephalography (MEG) records the electric field activity generated by neurons and has excellent resolution in time, but it requires large, stationary and expensive detectors. On the other hand, the change in blood flow associated with neuronal activity is measured by Functional Magnetic Resonance Imaging (fMRI), since oxygenated blood compared to the rest causes magnetic distortions that are generated by the protons present in it, so fMRI has excellent spatial resolution [
8].
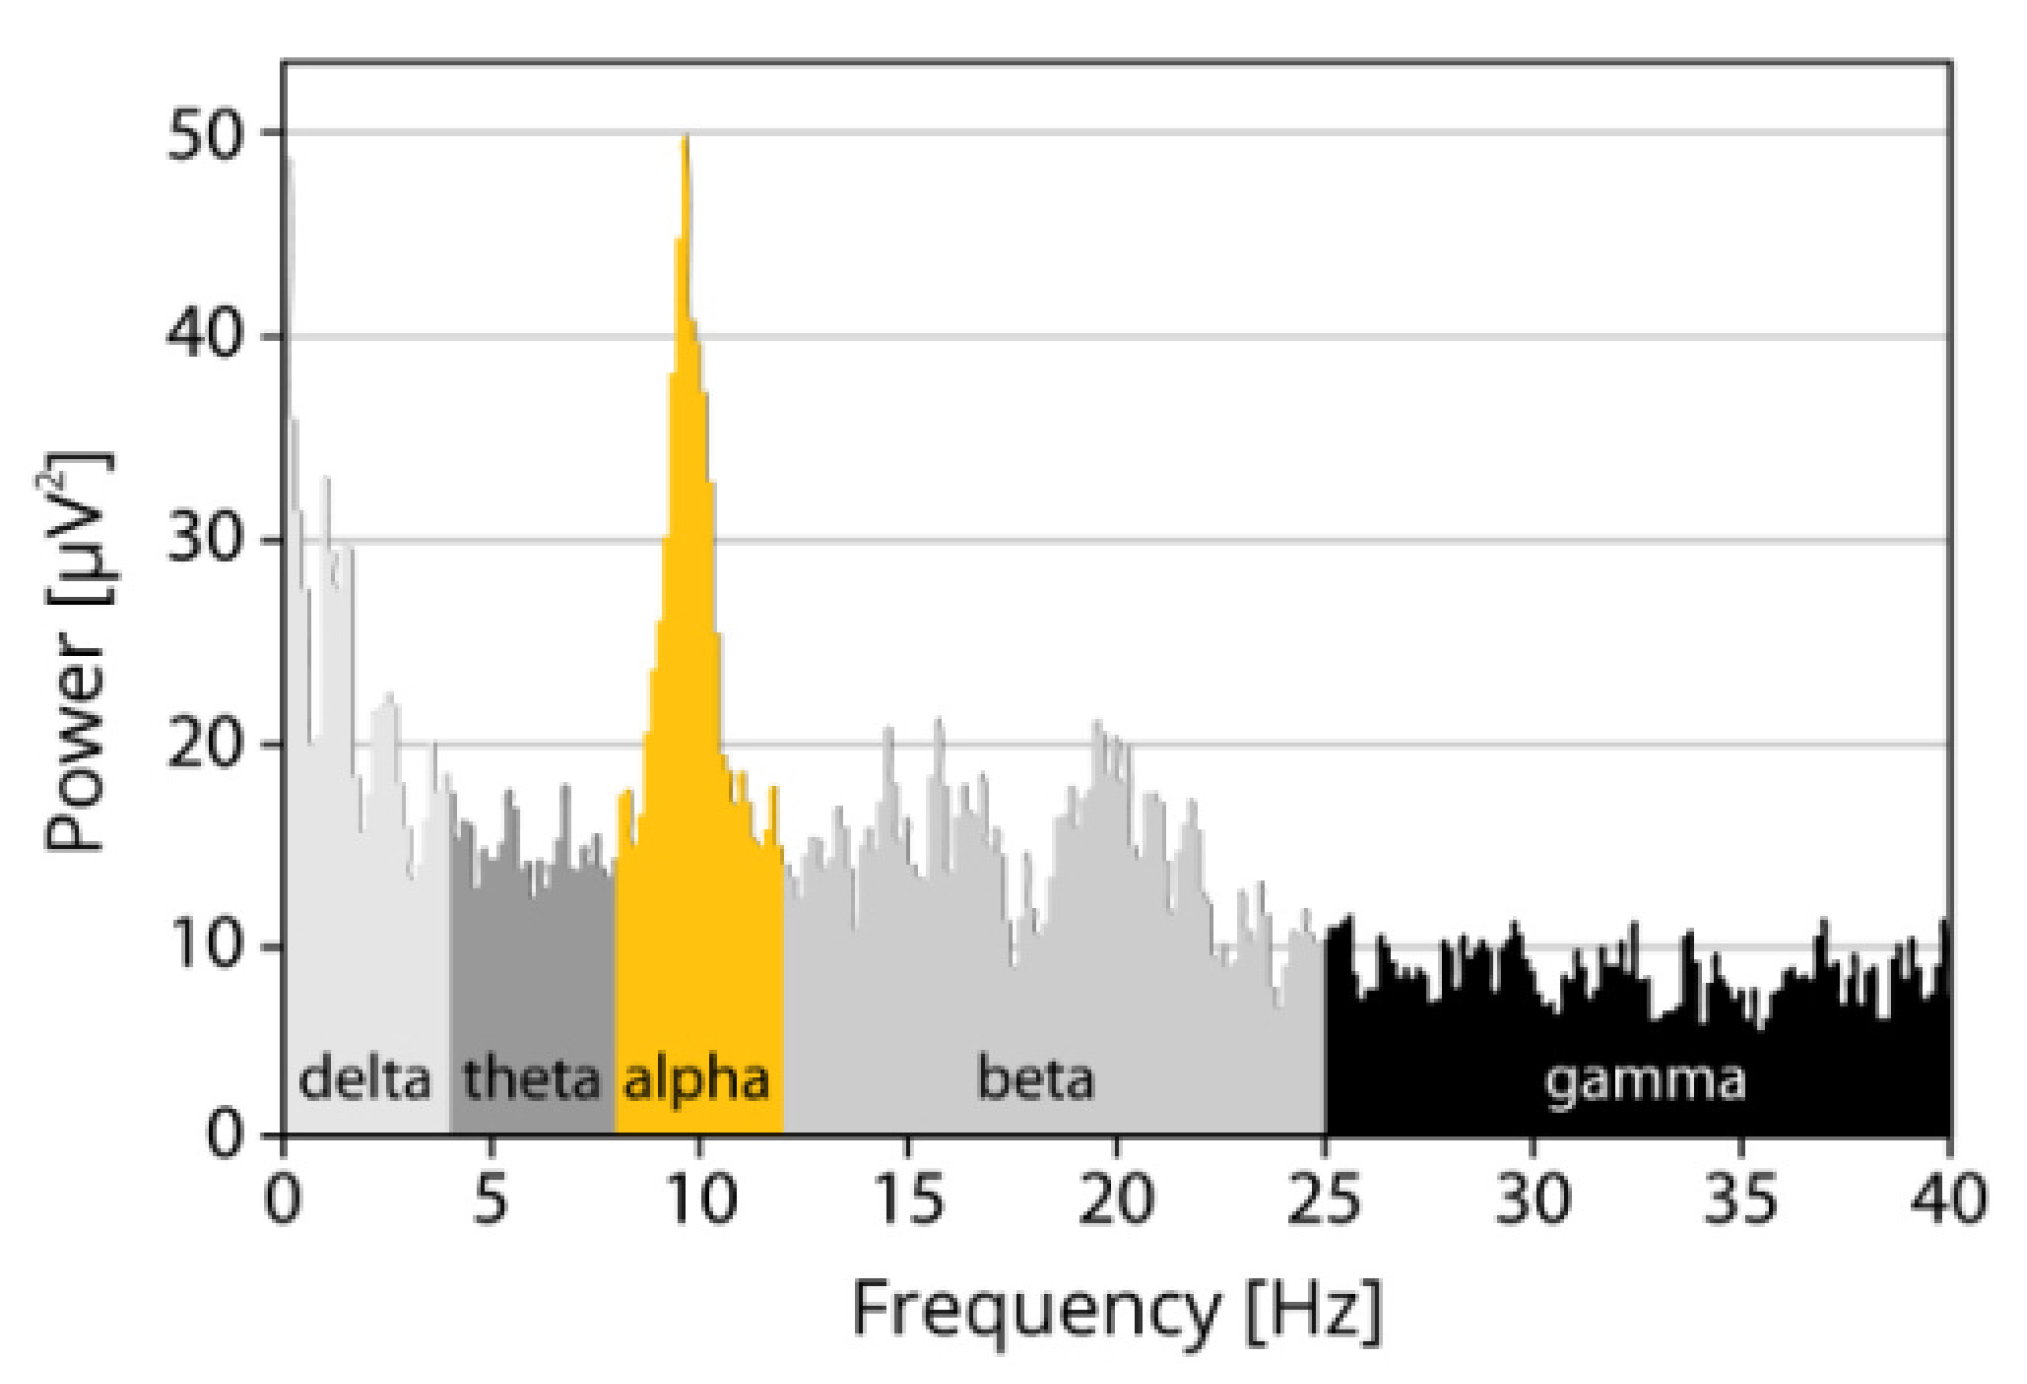
Since human neuronal activity has a high degree of complexity in its nature, neuronal oscillations can be measured as a mixture of several underlying base frequencies, which reflect certain cognitive, attentive and affective states. These oscillations were defined in specific frequency-ranges such as gamma (
, +25 Hz), beta (
, 12–25 Hz), alpha (
, 8–12 Hz), theta (
, 4–8 Hz), and delta (
, 1–4 Hz) [
8,
9,
10],
Figure 3.
Delta (1–4 Hz): These types of waves have been examined during periods of deep sleep, locating their point of greatest power in the right hemisphere of the brain. Since sleep is associated with memory consolidation, it plays a central role in learning functions. Its amplitude varies from 20–200 V.
Theta (4–8 Hz): Some studies report that the activity of this wave is related to cognitive activities such as selective attention, assimilation of information, processing, learning and working memory. Anyone can have a better record from the prefrontal, central, parietal and temporal areas. Its amplitude varies from 20–100 V.
Alpha (8–12 Hz): This rhythmic oscillatory activity is involved when there is a response to sensory stimuli, motor functions and memory. High levels of alpha can be noted when there is relaxation with closed eyes, the suppression of alpha implies a characteristic signature of mental states of interest, e.g., when there is sustained attention to any type of stimulus at a particular time. Its amplitude varies from 20–60 V and the source of activation of these signals is in the occipital region of the brain.
Beta (12–25 Hz): This frequency is generated both in the occipital and frontal regions, the states of active thinking, motor functions, visual and spatial coordination, anxiety and concentration are associated. Its amplitude varies from 2–20 V.
Gamma (more than 25 Hz): They usually have the highest frequency and the lowest amplitude. So far there is no strong association of what these types of waves reflect in the brain, there are some researchers who suggest being the reflection of the interconnection of several sensory responses to an object in a coherent way, therefore, it would represent a process of attention due to intense brain activities. On the other hand, others think that it is the effect of neuronal processes to achieve vision control, and, therefore, would not represent a cognitive process after all.
There is discussion to date about a sixth cerebral rhythm called
, its frequency band covers practically the same as alpha, however, it is only observed in the sensory-motor cortex [
11].
These types of signals need to be discretized, which is why it is also important to define that signal processing consists of the representation, transformation and manipulation of signals in general, e.g., in their numerical representations of finite precision sequences. Typically, these systems work in real time, which means that a discrete system speeds processing; its applications include, among others, control systems, communications, radar, sonar, coding and voice and video enhancement, or biomedical engineering.
Figure 4 shows the way the EEG sensor records the human brain activity (RAW sample). Among the issues involved in the treatment of digital signals, the linear and invariant digital filters stand out in time or Linear Time Invariant (LTI). Another important class of LTI filters are the frequency selective ones, which allow the passage of signals without distortion in one or a set of frequency bands and totally attenuate or eliminate the signals in the rest of the bands [
12].
A filter can be seen as a continuous or discrete system to process the signals and it can modify the spectrum of the input signal according to certain specifications; these filters are divided into analog and digital. Some advantages of digital filters over the analog ones are that the formers respond to the frequency closest to the ideal one, they do not require tuning, their components are independent of the filter’s operating frequency, can be multiplexed to process multiple signals and have a high degree of system integration. In addition, it is very important to consider the Nyquist-Shannon fundamental sampling theorem, which states that at least twice the frequency of operation at the input must be used so that sampling is reliable and information is not lost. That is why most EEG systems use a sampling rate of at least 128 Hz when anyone wants to study bands at less than 60 Hz, and in other cases up to 1 KHz when anyone wants to study bands higher than the previous ones with higher resolution [
13]. Filtering techniques are widely used in the collection of raw data by EEG devices, since, without this stage, data analysis is compromised by the presence of environmental noise or electrical interference from other devices [
8].
4. Mathematical Analysis Basis of the Power Spectral Density
Within the context of the signal processing described above, there are cases in which the analysis in the time domain is not sufficient, therefore it is recommended to study the signal in another domain in which intervals can be classified, for example in the frequency domain. For these cases, Fast Fourier Transform (FFT) is a good option for biosignal analysis. Frequently, the relevant information of a signal has a characteristic wave that is known in a general way, for this anyone can obtain time series containing this information. Then, the study measures the relationships between signals in both time and frequency domain (correlation or cross spectrum) and more complex transforms for feature extraction [
14].
In the case of the analysis of EEG signals, considering the time plotted on the abscissa axis and the voltage on the ordinate axis, FFT transforms a signal from time domain to frequency domain. Basically what is done during this transformation is to examine how much the raw data can be approximated by sine waves consisting of pure frequencies, that is, free of redundancy; the more they fit, the greater their correlation. Since the frequencies of the human brain associated with affective and cognitive activities are in the range of 1–45 Hz, an analysis using the FFT gives a lot of relevant information, for example, if a person is in a concentration state (theta band) or the response of anyone’s neuronal activity describes a sleep state (delta band). Equation (
1) defines the FFT
From Equation (
1), it is possible to perform power analysis that reflects the intensity with which a certain frequency is manifested in the signal, or to obtain conjecture of what is the predominant frequency band within the signal.
The biological signals processing often involves the continuous registration for time long-periods of the electrical activity during an event, pathology or functional state that anyone wants to record on the patient. The digital processing and analysis of these records involves a direct compromise between their duration and size and the computational cost. This means that the greater the amount of information to be processed, the greater the resources consumed from the processing systems, leaving aside the possibility of executing the analysis in real time. For this reason it is necessary to truncate the signals in order to have short segments of them, reflecting the change dynamics and preserving the event properties. Thereby, the Power Spectrum Density (PSD) is an alternative to perform an analysis. Equation (
2) is the Fourier transform of the autocorrelation function that defines the PSD
where
is the autocorrelation function (ACF) defined as
where
N is the number of data in vector
x with index
k of a brain activity signal.
Hence, with Equation (
2) a power analysis of a patient’s EEG signal can be performed using the FFT, and thereby efficiently separated the delta, theta, alpha, beta and gamma frequencies,
Figure 5. Before using Equation (
2), a Band-stop Filter or Notch Filter is performed, which is characterized by rejecting a certain frequency that is interfering with the sensor, in our case the 60 Hz frequency generated by the power line. That is why the Notch frequency is equal to
with a bandwidth of 3 dB.
5. Healthcare Smart System for Measuring Dolphin-Assisted Therapy Efficiency
Figure 6 shows the methodology proposed, which was divided into three main stages of HSS-Cognitive. It was assumed that something unknown modifies the behavior of the human brain and this modification is kept for certain period of time. There are many esoteric assertions about what changes biosignals, but we have focused on what is physical and not esoteric. Thus, we assumed that the dolphin’s echolocation signals are those that make the behavior of the brain changing in some way, which, however, causes patients to present an improvement in their conventional treatments. These three stages are the following:
EEG Acquisition,
EEG Processing, and
EEG Understanding.
These three stages separate, in turn, the digitalization of biosignals from patients, computational processing through an integrated development environment and the understanding that this time occurs in the patient’s brain for its later interpretation, respectively.
This work makes use of the Cognitive Dynamic System (CDS) along with a batch learning algorithm, since this combination keeps the system weights constant while computing the error associated with each sample in the input, that is, the two algorithms visit different sets of points during adaptation but converge in the Understanding of the brain signal. Hence, this batch algorithm is useful for specifying time-windows from the continuous EEG signal.
5.1. EEG Acquisition
Figure 7 shows the main steps from the biosignal discretization up to obtain an EEG time series, which was self-stimulated by another subsystem, in this case a bioacoustic signal from the dolphin’s echolocation.
5.1.1. Echolocation
As part of their evolution, dolphins have developed a sophisticated sensory system called echolocation, emitting sound waves that travel through the water and return to the dolphin in the shape of echoes to be processed and interpreted by their brain.
The sounds used by these mammals in echolocation consist of small emissions of repeated clicks at different frequencies. Low-frequency
clicks can travel long distances with a high penetration power; these clicks reflect the object structures, so the dolphin can obtain information from the surrounding topography of the objects. Regarding the location of their nearby dams, dolphins emit high-frequency
clicks, inaudible to humans. For instance, bottlenose dolphins emit clicks at frequencies ranging from 15 to 130 KHz, while killer whales emit clicks at an average 14 KHz-frequency. This explains why dolphins rely fully on their sonar to navigate and communicate simultaneously, as well as hunting in dark waters where vision is of little use. Also, bottlenose dolphins produce clicks and sounds whose frequency ranges from 0.25 to 150 KHz, the maximum frequency of the echolocation clicks becomes 100 KHz [
15].
5.1.2. Brain Self-Stimulation
The EEG analysis is based on knowledge of normal brain activity in wakefulness and sleep. Under normal conditions, waves of different morphology, amplitude and frequency are recorded depending on the area of the cerebral cortex. In our study, Fronto-Polar 1 (
) was employed, the waking state of the subject and the activation procedures were performed. The normal EEG features change throughout age, especially evident in childhood [
16].
Activation techniques are intended to induce the appearance of abnormal activity, mainly epileptiform, or accentuate abnormalities that appear in resting phases. They should be performed routinely in all EEG as long as the patient can collaborate. They consist of hyperventilation and intermittent light stimulation. Sleep registration with/without prior deprivation is also considered in an activation procedure. Some more specific activation procedures will depend on the patient’s clinic, e.g., reading during the EEG, performing complex mental tasks such as calculus, listening to sounds or music or displaying graphic patterns in reflex epilepsies [
17].
Thus, the human brain can be stimulated and its behavior is induced depending on the stimulation frequency, for example, to induce active thinking states, the brain must be stimulated with a
-frequency band (12 and 25 Hz) [
18,
19].
5.1.3. Time Series Acquisition
The possible brain stimulation by the emitted dolphin-frequency should change the patient’s brain activity, which would be reflected in an EEG. So, we employed a ThinkGear ASIC Module electroencephalographic sensor (TGAM1,
Figure 8), which is an electroencephalographic biosensor responsible for amplifying, processing and digitizing brain activity signals by means of three electrodes—EEG, reference and ground, allowing to collect unprocessed brain wave data.
Besides, we used an algorithm patented by NeuroSky [
20] to generate the spectra of the alpha, beta, theta, delta, gamma signals, amplifying the signal of the raw data and eliminating the noise captured during the sampling to apply said algorithm to the remaining signal. On the other hand, the attention and meditation indicators range from zero to 100 depending on how concentrated, stressed, restless, etc. is found the person during the collection of the samples.
The TGAM1 sensor is physically composed of a single channel EGG electrode. Its Bluetooth is used for data transmission, its transmission speed is set to 57,600 bauds. This chip operates within the range 2.97–3.63 V, its maximum input voltage is 10 mV peak to peak, it also has 4 kV electrostatic discharge protection arrangements for contact discharge and 8 kV for air discharge. The transmission speeds at which it can be configured are 1200, 9600 and 57,600 bauds. Its sampling frequency of 512 samples per second, a frequency ranging from 3 to 100 Hz, serial communication, low power consumption 15 mA at 3.3 V. It is also provided with a low-signal quality warning, in addition to having a reduced size and be low-cost [
20].
Likewise, the TGMA1 sensor has different connections, but among the most important are the power, transmission, reception and electrode connections.
Figure 8 shows the red wire as the main measuring electrode, the green wires are from the ground and reference electrodes, the black wires as the shield of the system electrodes to mitigate as much as possible the ambient noise, the yellow and blue wires are the power and purple is the communication, respectively. The module requires a transmission speed of 9600 bauds and by default it is set to 57,600 bauds because it lacks resistance between pin B1 and pin B0 of the rear part explained below.
The biosignals acquired by TGAM1 are represented in RAW data. The range of Raw Data varies from −32,768 to 32,767, signed 16 bits precision. The first frontal polar electrode, or , samples in real-time the discretization of voltage.
This RAW-Volts data relation is defined by Equation (
4).
Figure 9 shows the representation of the RAW data in
V.
5.2. EEG Processing
Figure 10 shows that the processing of the time series (EEG Raw-data) is done through a User Interface, which orders this time series to be understood by a Perception-Action Cycle.
We have developed a MatLab User Interface that not only processes the EEG signal but also captures and analyzes it. The release of MatLab used was R2019b.
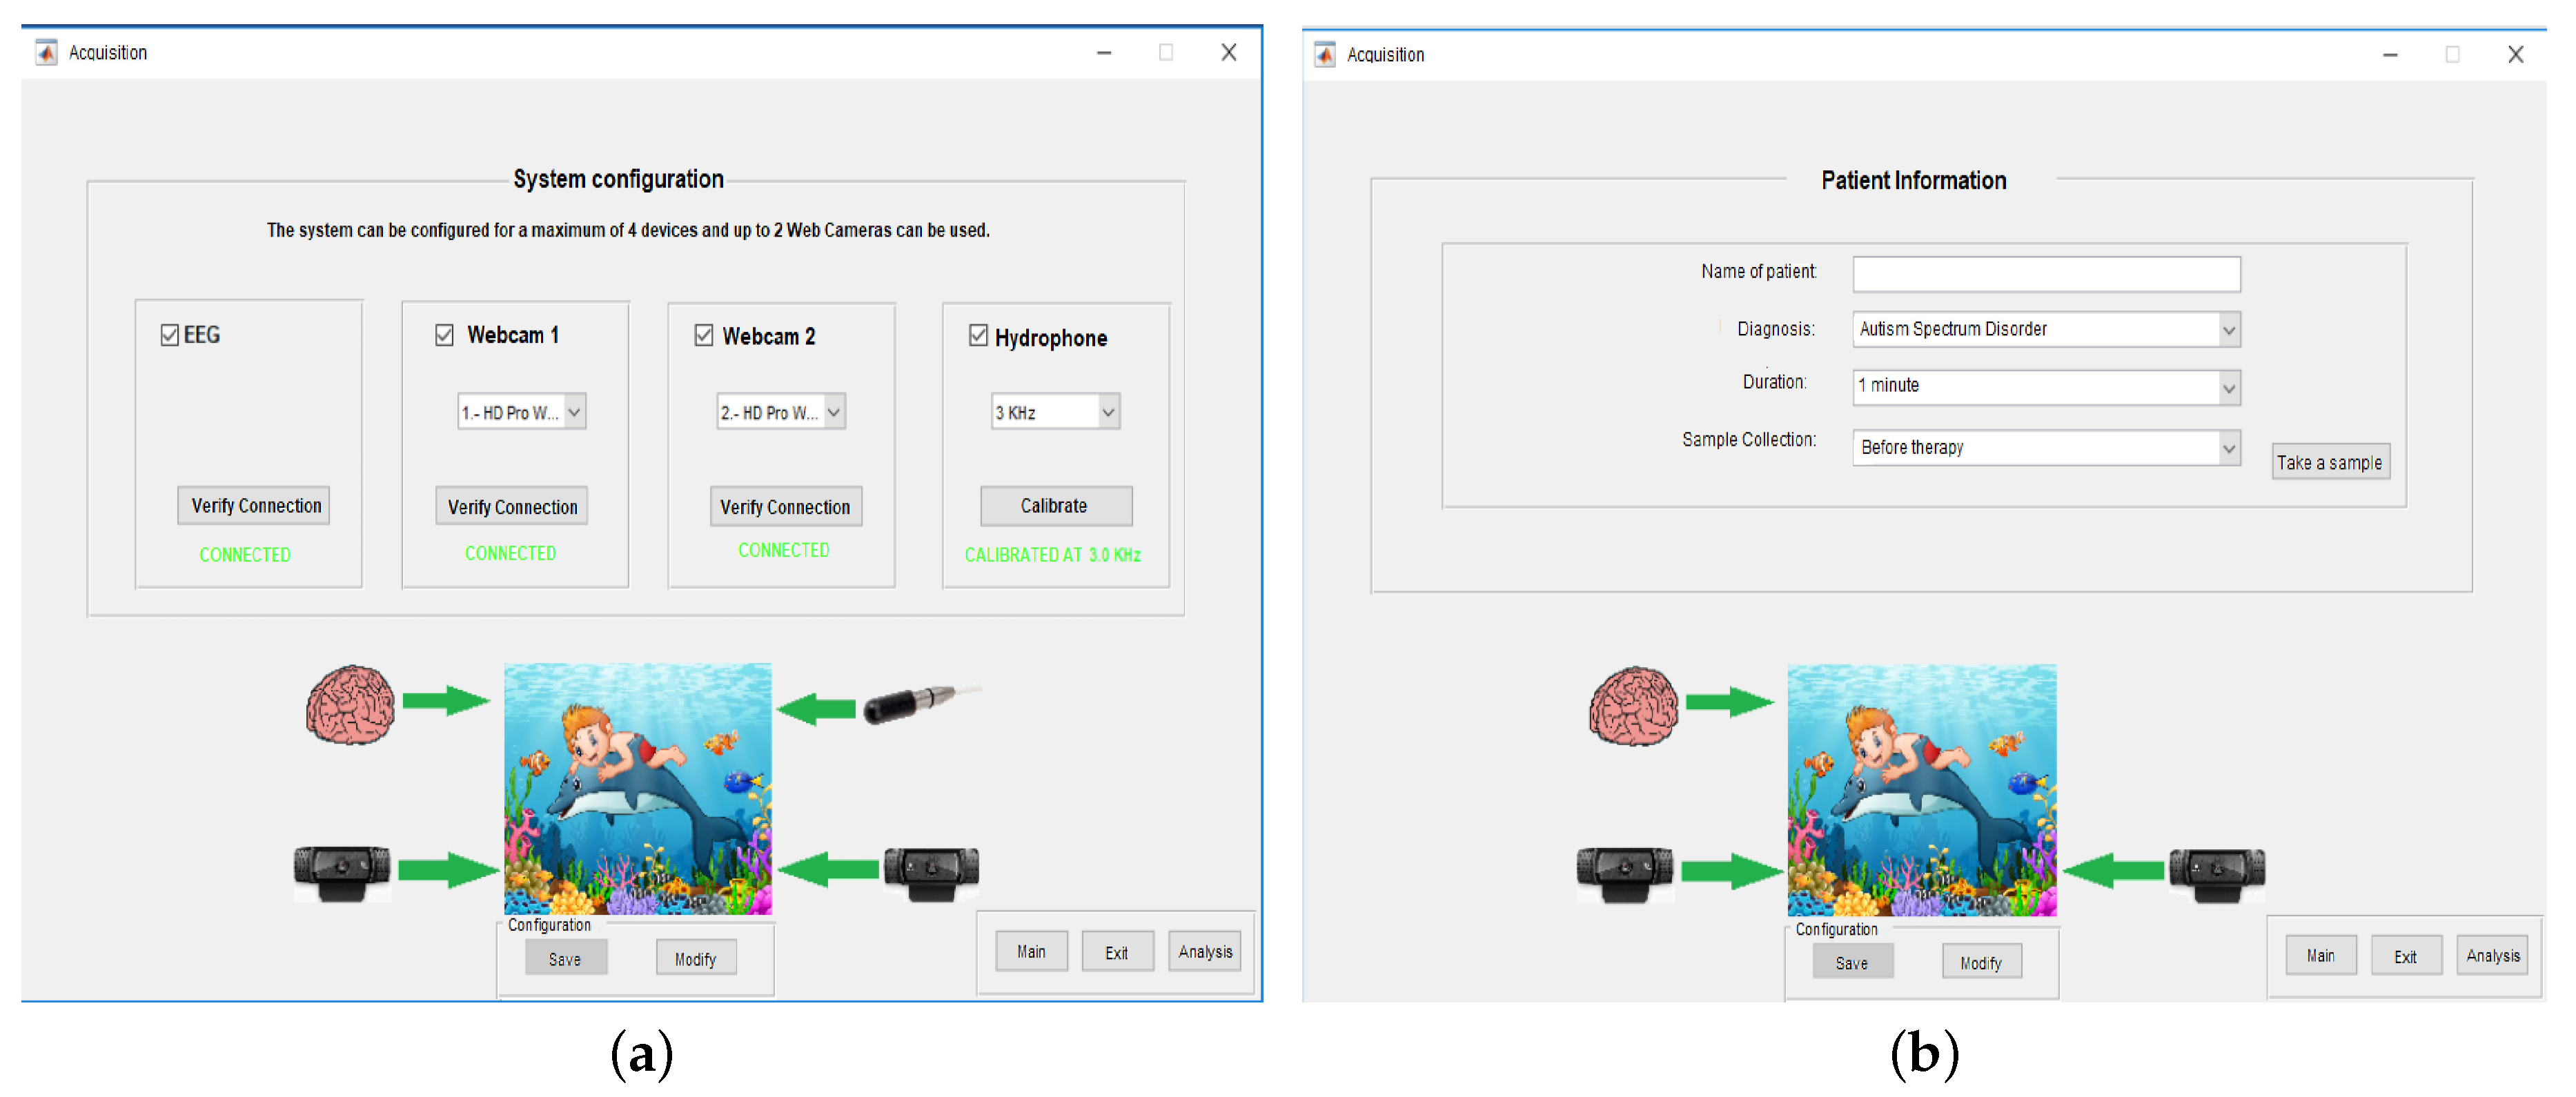
Figure 11a shows the Integrated Development Environment (IDE) for HSS-Cognitive. Once it is loaded, informs what resources the computer has and how many webcams is possible to connect to.
This IDE initially shows three sections for sampling—EEG, WEB Camera 1 and Hydrophone. In this window it is possible to return to the Main screen by pressing the Main button or go to the Data Analysis Window by pressing Analysis or simply Exit. Each section configures desirable system devices. In this article we only use electroencephalographic time series, although all four signals are acquired when the experiment is performed with the patient. The system is then configured according to the signal processing needs.
For instance, in
Figure 11a all devices in the system are configured and saved. Then, the patient’s basic information is introduced, such as name, diagnosis, duration of the experiment in minutes and moment of collecting the sample (before, during or after a DAT),
Figure 11b.
Once as many samples as necessary are stored, they are retrieved through the window shown in
Figure 12. Thus, the basic patient information and devices configuration are shown. The devices configuration can be modified to process the necessary signal(s), for this work only EEG signal was selected.
Figure 13 shows the results obtained by means of this IDE. These are the raw signal (in
volts), which were processed using the Fast Fourier Transform (FFT) to obtain the Periodogram, the Spectrogram and the Band-Pass Filtered Spectrogram of an EEG signal. These three mathematical tools are explained in
Section 5.3.
5.3. EEG Understanding
Both Acquisition and Processing of the EEG are necessary phases for the present study, but both are devoid of computational tools that provide them with Artificial Intelligence. That is why this work makes use of an adaptation of a Perception-Action Cycle in a global Perception-Action Cycle,
Figure 14.
The automatic understanding of the environment presented by this proposal is to know how the dolphin echolocation waves interact with the patient’s brain and how they modify the power of certain brain frequencies. Thus, Cognitive Perceptor is defined as brain activity or EEG since it is modified by the environment, which in this case is the echolocation of the dolphin.
Once the environment has been measured, a Feedback Information is calculated, which concentrates the signals of interest found. From a mathematical point of view, the non-parametric Power Spectral Density (PSD) is estimated, which is equivalent to the Periogram used to correctly scale the output of brain activity that lacks a uniform length and, therefore, concentrates a certain type of signals of interest.
Figure 15 depicts the power analysis or Periodogram of an EEG signal by means of the FFT. The PSD makes it possible to determine the distribution of the power of a signal over a frequency range.
We defined the Periodogram as
, the Time-averaging function, by means of the Welch’s method with two-sided at the frequencies specified in brain activity.
Figure 15 shows
expressed in decibels.
is a function depending on the following factors:
The sampling frequency, , is the number of samples per unit of time for the EEG sensor TGAM1, Hz with a minimum frequency Hz.
The unit frequency,
, is specified by
Since the Welch method is used, the number of overlapping samples, , has a value of 50% between segments.
is the Window where each segment of brain activity is sampled. we used a Kaiser window with an adjustment in the window length , and shape the factor that affects the attenuation of the lateral lobe of the transformation Window Fourier equals to 0.5.
Hence, in this part of the PAC there is Feedback Information of the signal, which leads us to the proposal of a Spectrogram or
as Cognitive Controller.
determines how the segmentation of the different brain frequencies is affected by the echolocation emitted by the dolphin during the time the sample is obtained.
Figure 16 plotted the power spectrum, which can be evaluated by applying FFT over the entire signal
. Therefore, the power spectrum is a function dependent on the factors
,
,
,
, and
estimated for
.
According to
Figure 14, to close a Cognitive Dynamic System, it is necessary to carry out some Cognitive Actions. These Cognitive Actions lead us to understand how echolocation modifies the behavior of the brain. That is why a Therapeutic Efficiency Assessment (TEA) is proposed.
TEA is a metric consisting of three main parts:
Calculation of the Normalized Power Density (NPD) ,
Determination of the Angle Width of Normalized Power Density in samples (), and
Estimation of the distance of with respect to the worst case.
On the one hand,
is normalized by Equation (
6) as follows:
On the other hand, the average power spectrum or Band-Pass Filtered Spectrogram is used, particularly when the available waveform (truncated signal) is only a sample of a signal of greater length, a fairly common case in the EEG analysis. In that case, the evaluation of PSD becomes an estimation process that contributes to improving the statistical properties of the results. When the power spectrum is calculated via Fourier transform and subsequently averaged in a certain band, it is then known as a Band-Pass Filtered Spectrogram
[
21],
Figure 17.
Thereby, the Normalized Power Density is filtered and measured for frequencies from 0.5 Hz to 60 Hz: Before DAT, During DAT and After DAT, that is,
,
, and
, respectively. Finally, the Normalized Power Density is filtered and measured for the low frequencies, i.e.,
and
or
, and for high frequencies, that is,
,
and
or
. The slope,
, between
and
indicates relaxation if it is negative, and repeated attention periods if it is positive. Hence, TEA is defined as
TEA bases its estimate of effectiveness on measuring the angle made up it by , (vertex), and . If the therapy has no effect, all three Normalized Power Density would be almost at the same level, i.e., would tend to . As long as the effect of is increased, the Normalized Power Density would go from an obtuse angle (>90) and it would tend to an acute angle (<90).
Therefore, TEA measures how far the patient is from having the therapy no effect. The bigger TEA, the better the effect of the Dolphin Assisted Therapy on the patient. TEA also measures whether the patient is in a attention state, (+), or in a relaxation state, (−). A threshold, , of 2 dB, or approximately , is established to determine whether the therapy was efficient for the patient, since this angle brings efficiency closer to an equilateral triangle or with all sides and angles equal.
In summary, the dolphin echolocation (Environment) modifies the Activity of the brain (Sensory Measurement). The latter is quantified by an EEG (Cognitive Perceptor) and whose representation in a Periodogram (Feedback Information) shows the behavior in frequency of the same as being Filtering in frequency groups by a Spectrogram (Cognitive Controller). This allowed us to estimate its efficiency (Cognitive Actions), finding out what was the best interaction between patients and dolphins, and, thus, closing this Perception-Action Cycle.
6. Experimental Results
So far, this work have presented the project HSS-Cognitive as a Healthcare Smart System applied to measure the efficiency of any therapy where neuronal interaction gives a trace whether the therapy is efficient or not using TEA metric.
In this way, we defined a DAT as a technique consisting in the interaction of a patient with dolphins (
Tursiops truncatus, bottlenose specie), where a therapist also intervenes; the therapist role is to help improve the quality of life of both children and adults who suffer serious health problems, especially chronic diseases and psychological,
Figure 18.
In the present study, the EEG signals recorded during a session of DAT in patients with Infantile Spastic Cerebral Palsy (ISCP) were evaluated. We experimented with two children with ISCP as intervention patients, while the control patient was one child within the same range of age of the intervention group, all three patients were 12-years old. Both groups were treated for 8 min and were subjected to two kind of experiments. On the one hand, in a dolphin tank measuring their activity in five experiments:
Before DAT (1 min),
During DAT without Therapist and without Dolphin (2 min),
During DAT without Therapist and with Dolphin (2 min),
During DAT with Therapist and with Dolphin (2 min), and
After a DAT (1 min).
On the other hand, in a pool without Dolphin for 6 min measuring their activity in four experiments:
Before water therapy (1 min),
During water therapy without Therapist (2 min),
During water therapy with Therapist (2 min), and
After a water therapy (1 min).
We performed these two experiments for the sake of independently comparing the effect of the different factors such as water, therapist, or dolphin.
Table 1 shows the results of the intervention patient 1, these results can be summarized in
Figure 19.
Figure 19 shows the results of the TEA metric at three (on 05/19/2019, 11/05/2019 and 01/25/2020) different times for Patient 1 (Intervention), pointing out that over time the patient had gone from having relaxation states (TEA = −1.2765 and TEA = −2.475) regardless of the dolphin to attention states when the dolphin was present (TEA = 2.6639).
Table 2 shows the results of the intervention patient 2, these results can be summarized in
Figure 20.
Figure 20 shows the results of the TEA metric at two (on 11/05/2019 and 01/25/2020) different times for Patient 2 (Intervention), indicating that over time this patient had kept attention states regardless of the dolphin (TEA = 6.2508 and TEA = 2.2603), that is, the DAT did not have a significant effect on this patient.
Table 3 shows the results of the control patient 3, these results can be summarized in
Figure 21.
Figure 21 shows the results of the TEA metric for Patient 3 (Control), pointing out that over time (on 01/25/2020) this patient had sustained attention states (TEA = 4.875) and the presence of the dolphin increased the therapy efficiency in his brain activity.
If all the patients are compared only with the samples taken on 25 January 2020, for the control patient and intervention patient 1 the best results are found when the patients underwent a DAT. Intervention patient 2 was a special case due to this patient had comorbidity of Pilocytic Astrocytoma (PA) brain stem tumor grade I derived from glial cell abnormalities. This kind of tumor grows slowly and have the possibility of being completely removed, depending on which part of the brain are located. Patient 2 was underwent surgery in 2019 in order to remove the tumor; that surgery could have had an impact on the effectiveness of DAT taken on 2020. Patient 2 presented the best efficiency when doing physical therapy led by therapist in a pool without dolphins around him,
Figure 22.
7. Conclusions
In this work the project HSS-Cognitive was developed as a Healthcare Smart System to measure the efficiency of dolphin-assisted therapies. By one hand, by means of a ThinkGear ASIC Module electroencephalographic sensor (TGAM1) we have developed a MatLab User Interface for collecting, amplifying, processing, and digitizing the brain signals (EEG) of patients with Infantile Spastic Cerebral Palsy (ISCP).
On the other hand, we proposed a global Perception-Action Cycle to know how the dolphin echolocation waves interact with the patient’s brain and how they modify the power of certain brain frequencies. Thereby, we defined as Cognitive Perceptor the brain activity or EEG since it is modified by the environment, determining the cycle of perception–action (PAC) as the Feedback Information to concentrate the signals. Then, we defined the Spectrogram as Cognitive Controller that estimates how the segmentation over different brain frequencies was affected by the echolocation emitted by the dolphin during the time the sample was obtained. Finally we estimated its efficiency (Cognitive Actions) by calculating the PSD, which is equivalent to the Periogram.
To close a Cognitive Dynamic System it was necessary to understand how echolocation modifies the behavior of the brain, therefore we also proposed a Therapeutic Efficiency Assessment (TEA) as a metric made up by three main parts—(a) Calculation of the Normalized Power Density, (b) Determination of the Angle Width of Normalized Power Density in samples, and (c) Estimation of the distance of the angle width with respect to the worst case. Moreover, the average power spectrum or Band-Pass Filtered Spectrogram was used when the available waveform (truncated signal) was only a sample of a signal of greater length, a fairly common case in the EEG analysis. The evaluation of PSD becomes an estimation process that contributes to improving the statistical properties of the results. Then, Normalized Power Density was filtered and measured for frequencies ranging from 0.5 Hz to 60 Hz: Before DAT, During DAT and After DAT.
The Normalized Power Density was filtered and measured for the low and high frequencies. If the therapy had no effect all three Normalized Power Density would be almost at the same level, that is, would tend to . Thus, the bigger TEA, the better the effect of the Dolphin Assisted Therapy on the patient, it also measures whether the patient is in a state of attention (+) or relaxation (−). A threshold, , of 2 dB, or approximately , was established to determine if the therapy was efficient for the patient, since this angle brings efficiency closer to an equilateral triangle or with all sides and angles equal.
Our HSS-Cognitive project was applied in Delfiniti Mexico facilities, recording the EEG signal during a session of DAT in patients with ISCP. The intervention group had two children with ISCP (patients 1 and 2) while the control group had one child, all of them 12-years old. Both groups, by one hand, were treated for 8 min in a dolphin tank measuring their activity in five experiments—before DAT (1 min), during DAT without therapist and without dolphin (2 min), during DAT without therapist and with dolphin (2 min), during DAT with therapist and with dolphin (2 min), and after a DAT (1 min). On the other hand, in a pool without dolphin for 6 min measuring their activity in a pool without Dolphin in four experiments—before water therapy (1 min), during water therapy without therapist (2 min), during water therapy with therapist (2 min), and after a water therapy (1 min).
After applying our TEA metric at three different times for Patient 1, we found that this patient had gone from having relaxation states (TEA = −1.2765 and TEA = −2.475) regardless of the dolphin to attention states when the dolphin was presented (TEA = 2.6639) (
Table 1 and
Figure 19). For patient 2 at two different times, we found that he had kept attention states regardless of the dolphin (TEA = 6.2508 and TEA = 2.2603), that is, the DAT did not have a significant effect in this patient (
Table 2 and
Figure 20). For the control group child, we found that this kid had sustained attention states (TEA = 4.875) and the presence of the dolphin increased the efficiency of therapy in his brain activity (
Table 3 and
Figure 21).
When we compared all the patients only with the same samples (January 25, 2020), we observed that for the control patient and the intervention-patient 1 the best results were found when they underwent a DAT. Intervention-patient 2 was a special case mainly since this patient had comorbidity of Pilocytic Astrocytoma (PA), thus patient 2 underwent surgery in 2019 in order to remove his tumor, which could have had an impact on the effectiveness of DAT taken on 2020, and this patient presented the best efficiency when doing physical therapy led by therapist in a pool without dolphins around him (
Figure 22).
According to our findings, we concluded that our Brain-Inspired Healthcare Smart System, based on the Perception-Action Cycle, can be considered a reliable tool for measuring the efficiency of any therapy where neuronal interaction gives a trace whether the therapy is efficient or not, using mathematical tools. Our methodology can be a tool not only for therapist or medical doctors but also for researchers in neurosciences, since any event that presumably modifies brain activity can be taken into account as the Environment of the System to estimate the efficiency of this factor in the brain activity of the patient.

 ,
, 


