PRANAS: A Process Analytics System Based on Process Warehouse and Cube for Supply Chain Management


1
Mechatronics R&D Center, Samsung Electronics, Hwaseong-si, Gyeonggi-do 18448, Korea
2
Department of Industrial and Management Systems Engineering, Kyung Hee University, Yongin-si, Gyeonggi-do 17104, Korea
*
Author to whom correspondence should be addressed.
Appl. Sci. 2020, 10(10), 3521; https://doi.org/10.3390/app10103521
Submission received: 8 April 2020
/
Revised: 14 May 2020
/
Accepted: 18 May 2020
/
Published: 20 May 2020
(This article belongs to the Special Issue Big Data and AI for Process Innovation in the Industry 4.0 Era)
Abstract
:Most organizations need to monitor and assess their business activities. In order to support the performance analysis of the business activities in a more systematic manner, in this research, we introduce a PRocess ANalytics System, called PRANAS. The system adopts process warehouses and process cubes to support process-oriented analysis, as well as data-oriented analysis. In this research, the process warehouse and cube were designed to assess business performances for supply chain management, specifically under the SCOR standard models. Furthermore, the process cube was constructed based on process-related dimensions such as time, case type, and event class to support process mining. Finally, we exemplify how the system can be applied to process analytics with three use cases of process discovery, data analytics, and decision point analysis. It is expected that the proposed system can be a helpful reference model when business process analyst designs process analytics systems in the process-oriented perspective, as well as in the data-oriented perspective.
1. Introduction
With the rapid development of technology, the size and availability of data are constantly increasing. Companies need to analyze their data intelligently to acquire competitive advantages in terms of efficiency and responsiveness [1]. Business analytics is a decision support system that enables managers and analysts to take effective and timely decisions in business activities [2]. Meanwhile, business process analytics is a specialized system that helps to improve business process execution by analyzing operational data recorded in event logs that contain activity events, which have been recorded in process-aware information systems such as enterprise resource planning (ERP) and supply chain management (SCM) systems [3]. Although business analytics offers both types of data-oriented and process-oriented analysis tools, few studies have investigated how to integrate the two approaches in a concrete and effective manner [4,5,6].
Business analytics using regression, classification, and clustering usually do not consider the order of data generation because time information is rarely contained in a general form of data, e.g., tabular data [7]. However, the context information related to business process often crucially affects the target business values of interest such as delivery time and service quality. Therefore, process analytics can provide the missing link between the data and the process aspects. Recently, although many process mining methods have been developed to analyze process execution data, most of the traditional process mining techniques, such as process discovery and conformance checking, mainly focus on the structure of business processes, not the process-related data. Hence, process analytics tools need to integrate the two sides of analytics (i.e., data and process) in a balanced way to enable effective and efficient process data analysis.
To support the integrated analysis of data and process, a concept of process cubes was proposed by van der Aalst [8]. The process cube is inspired in the online analytical processing (OLAP) and extends the concept into process repositories. A process cube is created from an event log and its related database, in which different dimensions such as event class, case type, and time are defined. Like an OLAP cube, a process cube allows the analyst to drill-down or roll-up data and zoom into slices of the data, as well as reorder the dimension. Furthermore, just as an OLAP cube is used for analyzing and reporting operational performance, a process cube can also be used in a similar way to evaluate operational performance.
In this paper, we introduce a PRocess ANAlytics System, named PRANAS, which was developed to effectively and efficiently evaluate operational performance of supply chain operations using process cubes and process warehouses. The system provides an environment for both data-oriented analytics and process-oriented analytics. The system can store in the process warehouse the business performance data that are generated in supply chain execution, and the process cube can provide the aggregated process data through convenient OLAP functions such as slicing, dicing, rolling-up, and drilling-down. The process data extracted from the system can also be used as the inputs of data mining, as well as process mining, for the purpose of advanced analytics.
There are insufficient studies on the design of process analytics systems that integrate two analytics aspects: Data analytics and process analytics. This research presents a good guidance for balancing the benefits of the two analytics tools using process warehouses and cubes. The process warehouse and cube can provide proper filtered data fractions that will be used for the recently advanced analytics of both data analytics and process analytics for performance management in terms of business process execution. In particular, a framework of collaborative performance measures, called collaborative Balanced Scorecard (cBSC), is presented to illustrate the usage of the PRANAS for supply chain management under the Supply Chain Operations Reference (SCOR) standard models.
The remainder of the paper is organized as follows. The work related with our approach is described in Section 2. The framework of PRANAS is presented, along with the design of process cubes and warehouse, in Section 3. Three exemplary analytics applications of the system are explained in Section 4. Finally, we conclude the paper with future work in Section 5.
2. Related Work
The integration between business and process analytics has been considered in different ways in a few studies [4,5,6,9,10]. A conceptual framework of a decision support system for business intelligence was presented by Görgülü and Pickl [4], which combined classical data-centric approaches such as data mining with a modern system engineering using the advanced concept of adaptive business intelligence. Marjanovic argued that, in service-oriented industries, the operational business intelligence and business process management systems need to be integrated with case-handling [5], which could be done with the framework proposed in this paper. Kim presented an architecture to functionally integrate data analysis functions and process discovery functions [6]. Both systems coexist in what it is called a process-aware enterprise organization, which is usually the case of companies that participate in supply chain systems. Beheshti et al. handled the business and process analytics integration problem based on a process graph, which refers to large hybrid collections of heterogenous and partially unstructured process execution data [9]. They presented the process OLAP (P-OLAP), which is a very similar concept to the process cube presented by van der Aalst [8]. However, P-OLAP focuses on the scalability of big process graphs operations based on MapReduce rather than the actual integration of process and business analytics as it is presented in this paper. In addition, Silva et al. presented a decision-support oriented framework that integrates process analytics with other types of analytics for project selection [10]. The integration is achieved by decomposing a complex process into sub-manageable processes, which, in turn, are handled with multiple analytic techniques such as text mining, clustering, and social network analysis. However, the approach is limited to recommendation analysis.
More specifically, a few studies have integrated business analytics directly with process mining [11,12]. An approach to support business and IT users in the task of measuring and monitoring the performance of business process execution was presented by Grigori et al. [11]. They described well important concepts, such as process behavior and process state change, and even they described their own definition of process mining. However, when the paper was written, process mining techniques were not as mature as they are today. We can benefit from many mature process mining algorithms that give our approach better foundations and wide applicability, such as process discovery algorithms, conformance checking, and decision point analysis. Mansmann et al. presented an interesting attempt to integrate OLAP concepts and capabilities into process analysis [12]. Their approach focused on modeling a data warehouse and presented a formal solution for this problem by means of an extended snowflake schema that is quite complex. In our study, the schema becomes much simpler, since our approach leverages the advantages of process cubes which already integrate the OLAP concept with business process elements such as event class and case type.
Process cube, which is a relatively new concept, has been implemented in some domains such as education [13,14], resource allocation [15], and internal logistics [16]. Applications in the education domain were described in case studies based on video lectures from a Dutch university [13,14]. The nature of the data makes process cubes suitable for analyzing the video lecture-watching behavior depending on characteristics of the students (e.g., country, age, gender, school year), because the ability to slice and dice depending on different attributes of the process data yields meaningful results. Additionally, the authors implemented an automated process to generate periodic reports, which can be used by the lecturers to monitor and correlate the students’ behaviors with their grades. In our work, besides of the process cube integration, we also provide a process warehouse scheme and the ability to combine process analytics and data analytics for a more powerful analysis.
Furthermore, a resource process cube was introduced by Arias et al. [15]. The cube provided a flexible, extensible, and fine-grained way to extract historical information from event logs. Several resource-related dimensions were defined and used, such as frequency dimension, performance dimension, and cost dimension. Moreover, one of their major contributions is the ability to consider the resources at a generic subprocess level, rather than an activity level, because of the functions offered by process cubes. However, this approach was specifically designed for resource allocation, and although it can be adapted to different resource related company scenarios, our approach can be applied to other domains such as decision point analysis, as well as data analytics, such as classification and regression over the sliced data obtained from the process cube
Lastly, Knoll et al. presented a multidimensional process mining approach combined with lean management principles and value stream mapping (VSM) for reducing the waste in the internal logistics processes at a production plant at a German automotive manufacturer [16]. Process mining was used in all stages of the approach, starting with the event definitions and storage as event logs. Then, process cubes were constructed and used for multidimensional process analysis using structure-based and time-based analysis. In contrast, the capabilities of PRANAS go beyond these dimensions and are limited only by the availability of event-, case-, and process-related data.
3. PRANAS: A Process Analytics System
3.1. Framework
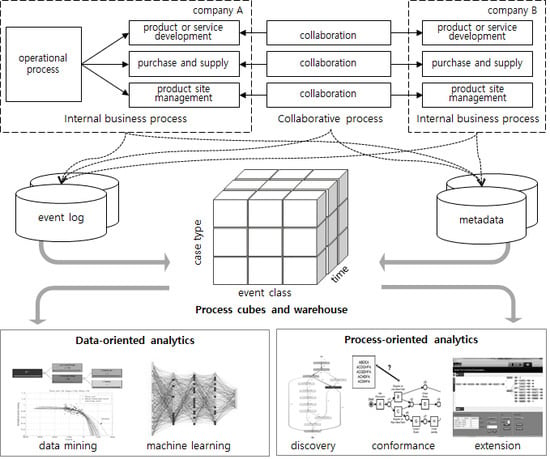
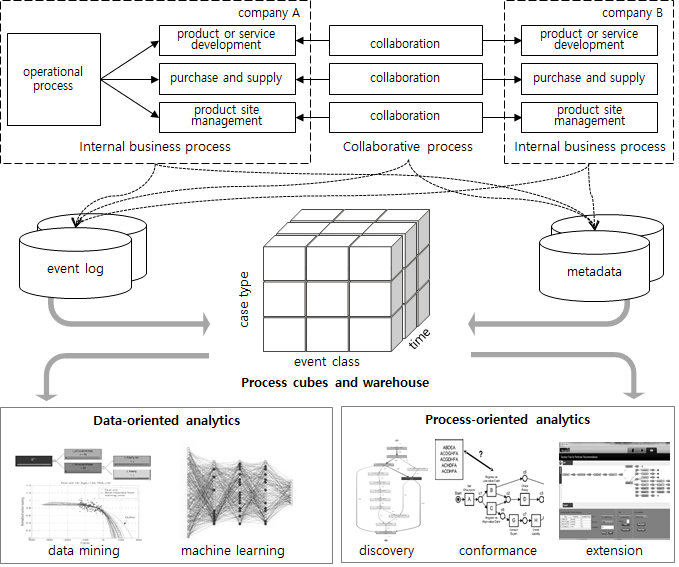
A framework of the PRocess ANalytics System, called PRANAS, was composed of three parts: The first was the business process environment including internal or collaborative processes, the second was the data storage of process warehouses and cubes that were generated from the event logs and their metadata, and the final was the analysis environment using the process cubes through data- and process-oriented analytics tools (see Figure 1).
3.2. Collaborative BSC
To analyze the performance of business process, one should first define performance measures of the target business process. In this research, to apply the proposed system to supply chain management, we present collaborative performance measures, called cBSC, on the basis of the Supply Chain Operations Reference (SCOR) model.
The Balanced Scorecard (BSC) is a strategic management tool which measures organizational performance in four perspectives: Finance, customer, internal business processes, and learning/growth [17]. Based on the BSC and the SCOR model, we derived the collaborative BSC (cBSC), which comprised four extended perspectives in terms of collaboration: Finance, partnership, collaboration process, and growth/coevolution. These new perspectives contained their collaborative critical success factors (cCSF), and moreover, SCOR-based collaborative key performance indicators (cKPI) were extracted for each cCSF considering the KPIs in the SCOR model. Table 1 shows an example of cCSFs and cKPIs for each perspective listed for the manufacturing industry. In this paper, a process warehouse was then designed for reporting and analyzing the cKPIs in each cCSFs. A process cube was also created from the process warehouse by choosing a proper set of dimensions and measures based on the multidimensional schema.
3.3. Process Warehouse
A process warehouse is constructed for process operation analysis that will be used to design process cubes. Figure 2 shows a star schema of the constructed process warehouse as an example in the manufacturing industry. The star schema in Figure 2 has four fact tables for finance, customer, process, and growth to make extensibility and maintenance as easy as possible in changing business process. Moreover, the four fact tables contain performance measures of cKPIs for each perspective. On the other hand, three-dimensional tables in the star schema for time, event class, and case type contain the attributes that can be used for the criteria of analyzing the cKPIs. In the fact tables, the columns are categorized into three categories: Measures for SCOR-based cKPI, measures for manufacturing operations, and the composite measures combining the cKPI and manufacturing measures.
3.4. Process Cube
A process cube is used to store significant events that have occurred during business execution. Event logs from business execution contain information about the recorded events and the case properties. Figure 3 (top) shows a fragment of some event log as an example, in which case types are composed of metadata of partner’s properties such as company type, the number of employees, capital, and geographical location. The process cube was designed from the recorded events combined with the metadata of the company partner.
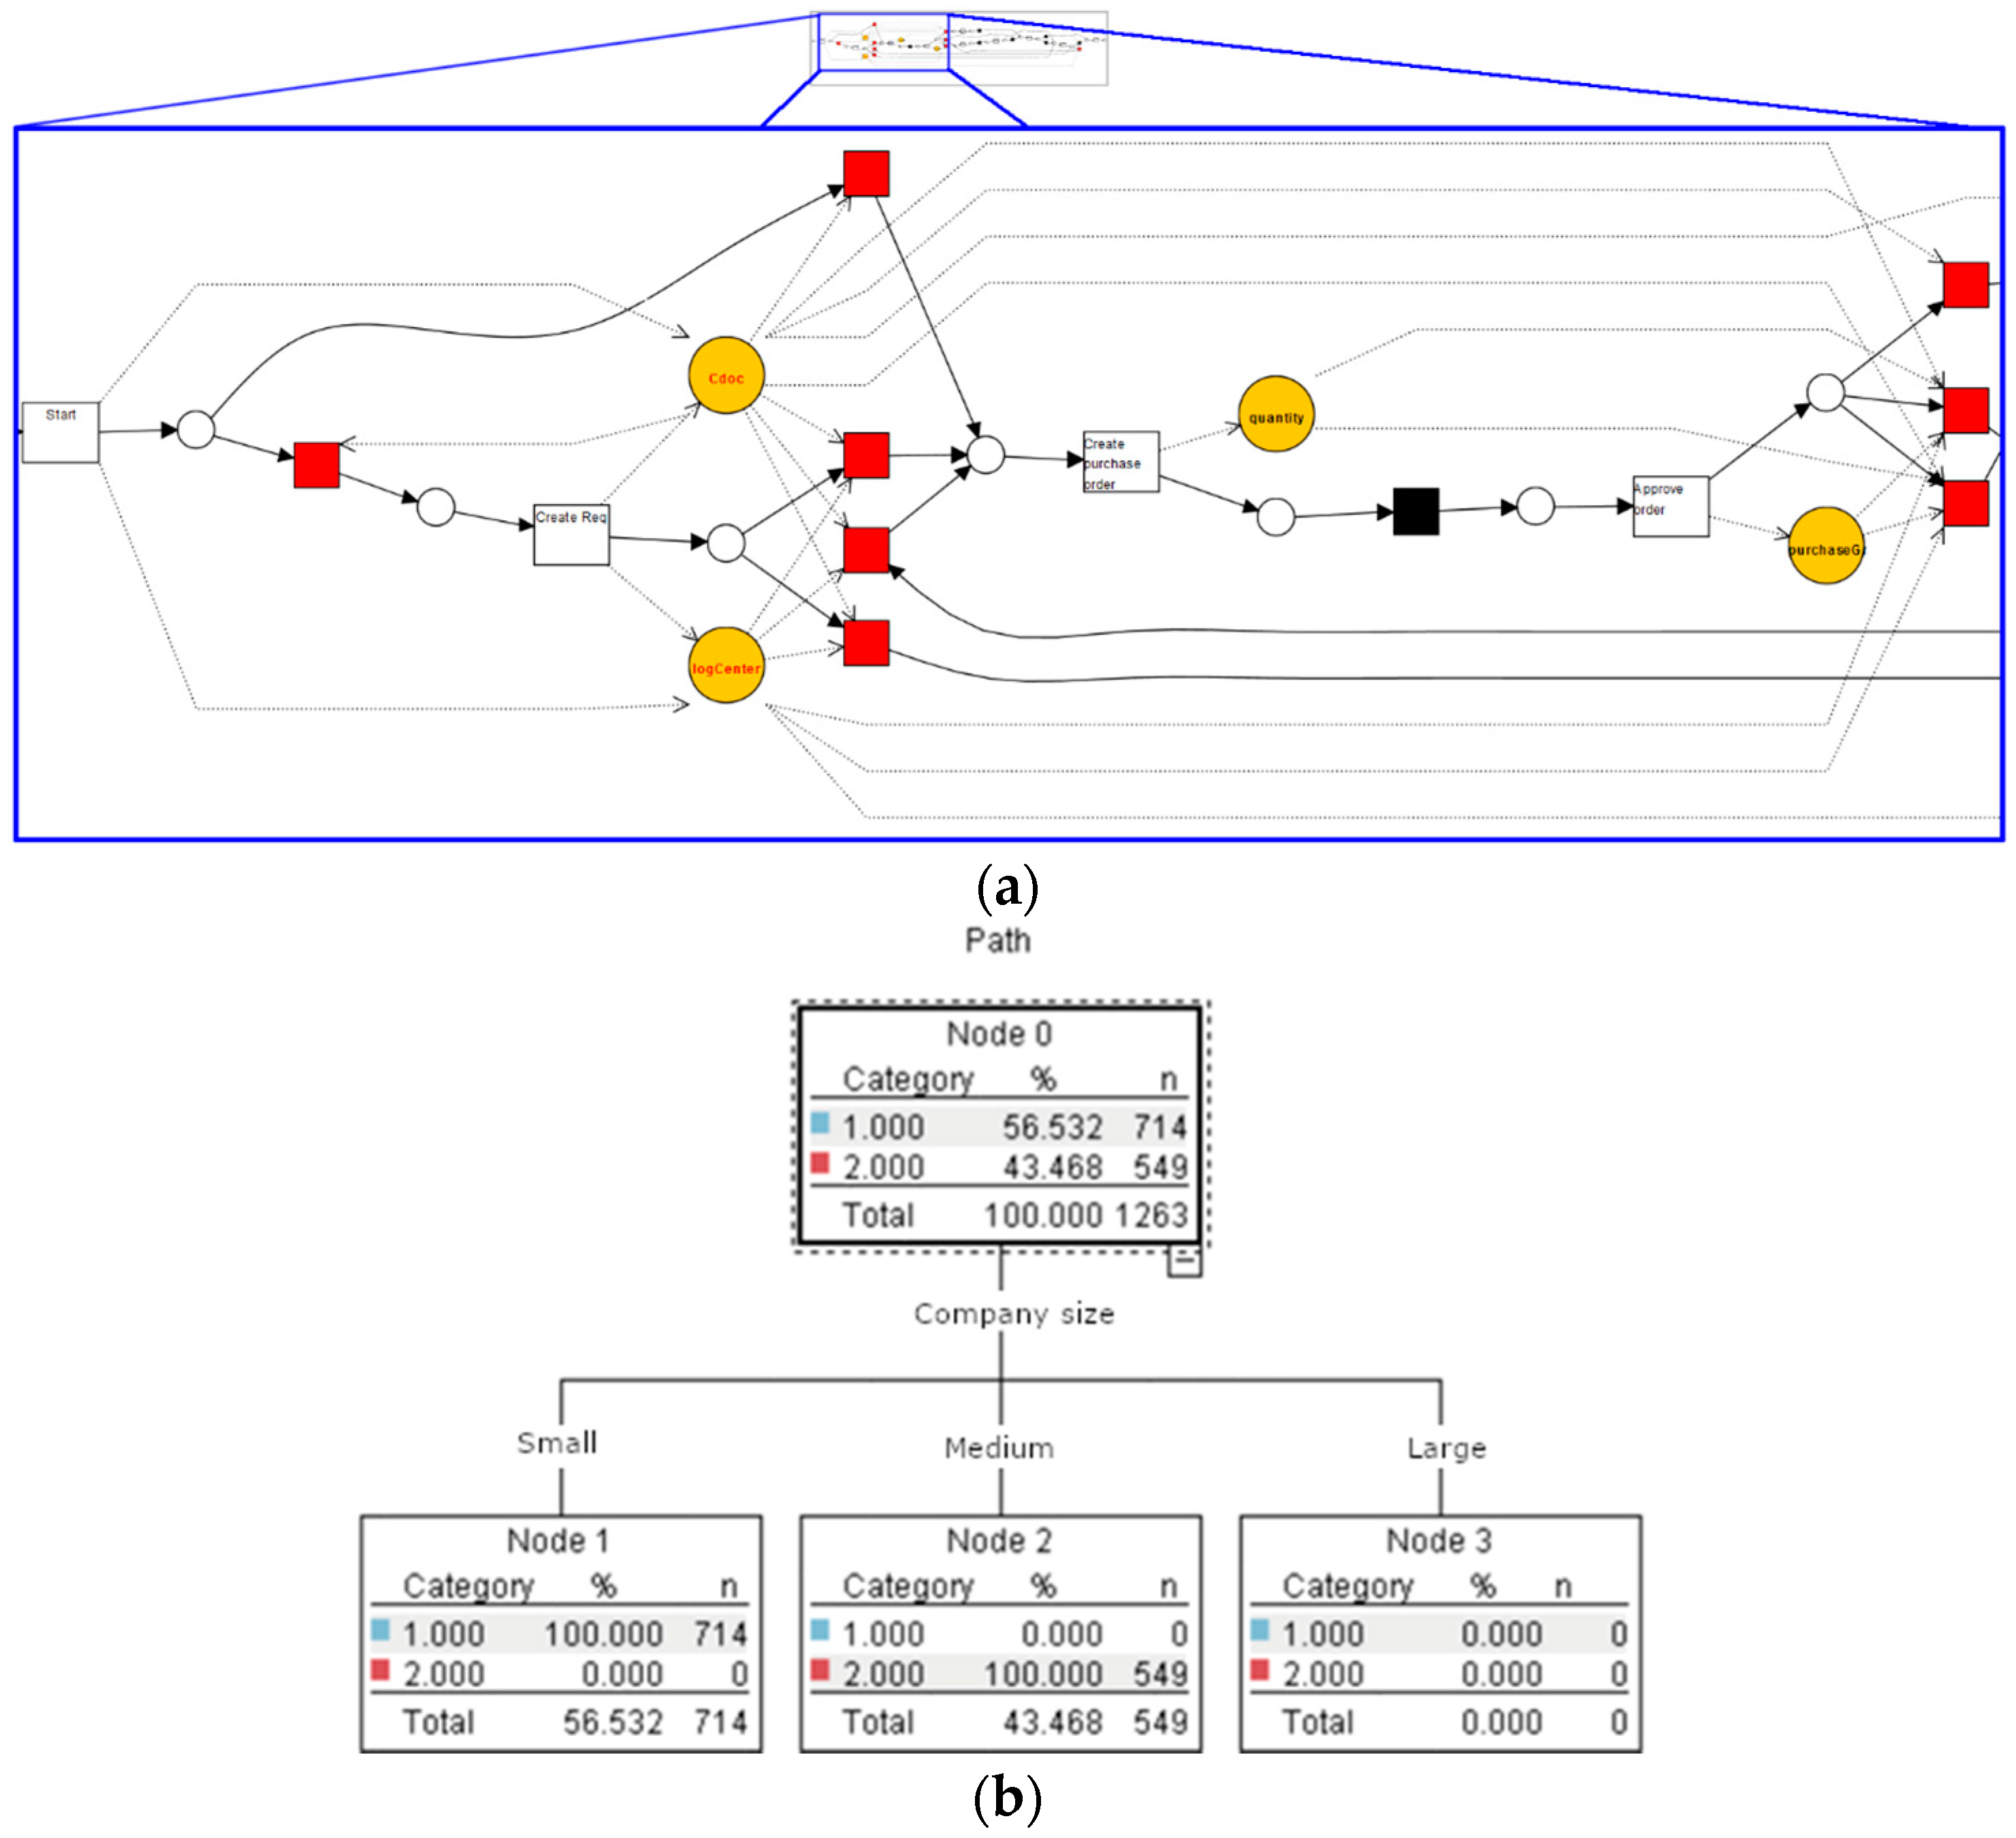
In the process cube of Figure 3 (left), events are grouped in cells based on dimensions of case type, event class, and time. As shown in the figure, the case type may be based on the case properties such as the company type (small, medium or large), the number of employees (e.g., <80 or ≥80), the capital amount (e.g., <500 million or ≥500 million), or the geographical location of the partner company. Moreover, the event class normally depends on the activity name and consists of ‘concurrent design’, ‘purchase change’, and ‘design change’ in the process cube. Finally, a time dimension may refer to a specific day, week, month, or year (e.g., 2015, 2016, 2017). Each process cell in the process cube refers to a collection of events, trace of cases, and process mining results, for example, a discovered process model or set of business rules.
A process cell in Figure 3 (right) contains the trace of events, related to the process ‘design change’ in collaboration with medium-sized companies in 2016, like {case 3: <ACDG>, case 5: <ADCG>, case 7: <AFG>}. The process cube, organized with such event data and process models, allows for convenient analysis of processes over time and for different groups of cases. In other words, through slicing, dicing, and changing the granularity, we can change an angle of the process cube.
4. Applications to Process Analytics
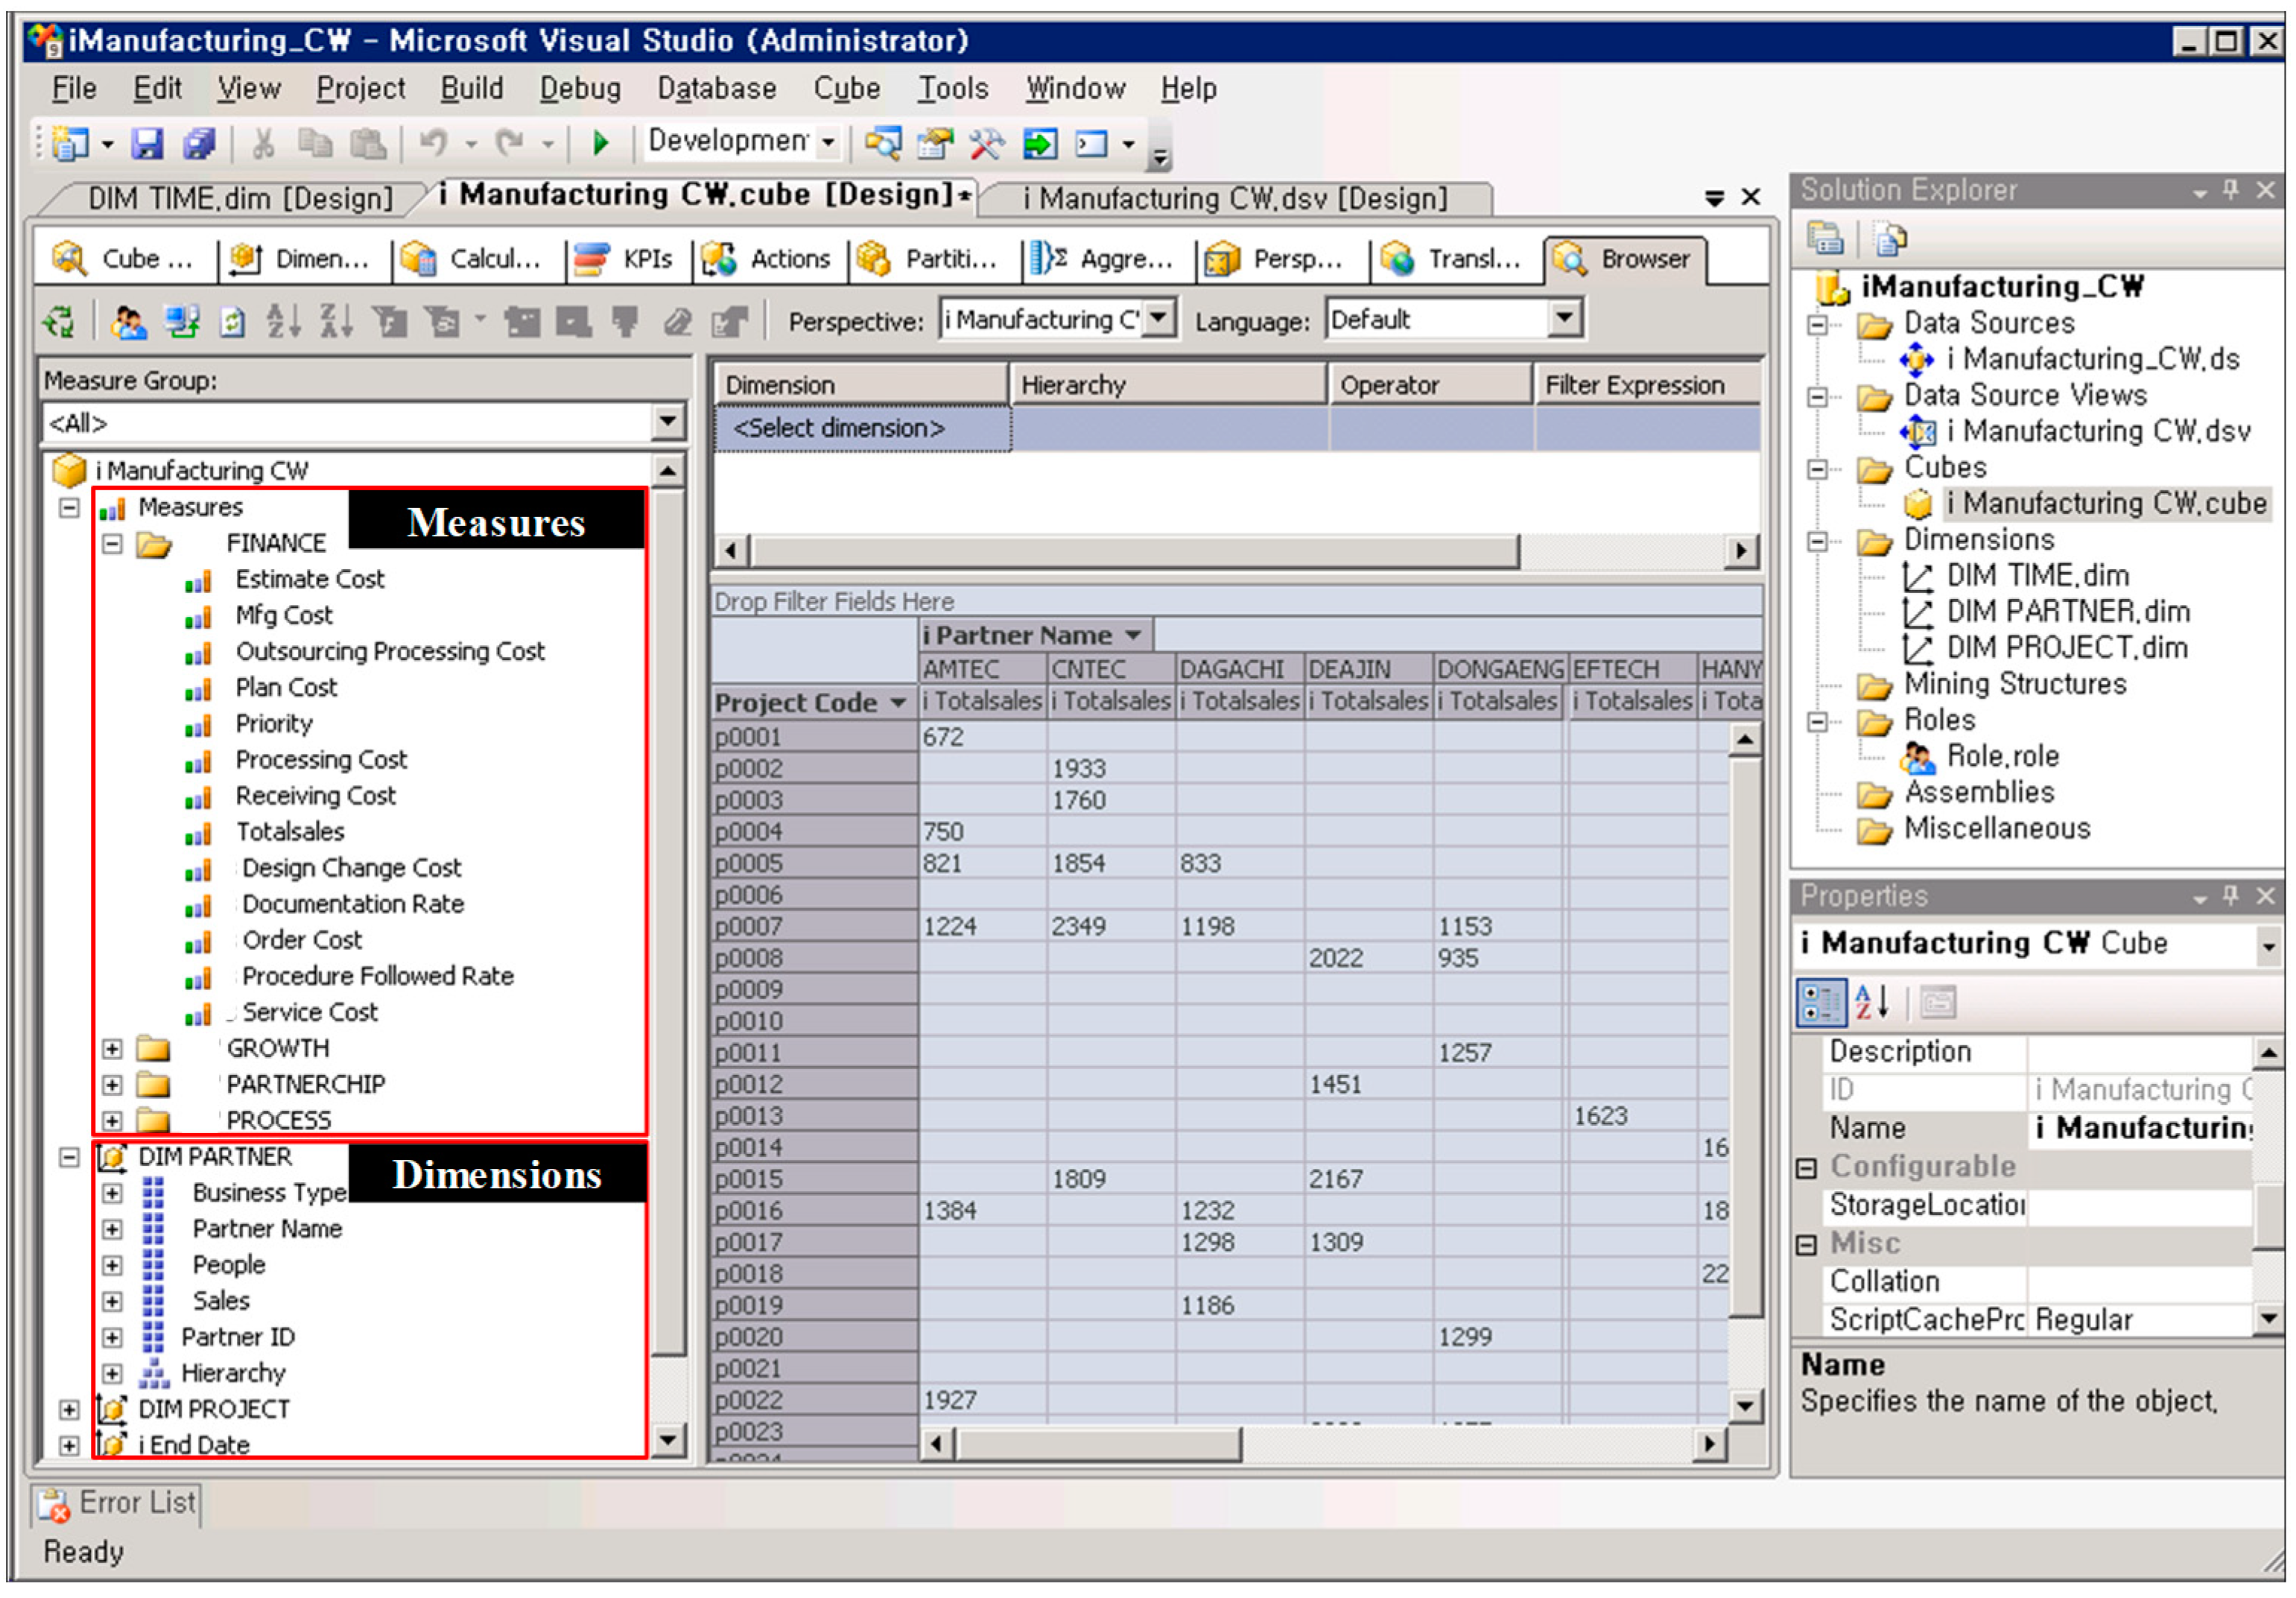
In this section, we demonstrate three applications of PRANAS to process analytics. The example applications explore the different type of analytics used in supply chain analytics: Descriptive, predictive, and prescriptive [18]. In this research, a process warehouse and a process cube were implemented in Microsoft SQL Server Business Intelligence Development Studio (BIDS) (It is contained as an additional package in Microsoft SQL Server 2008 R2, USA), as shown in Figure 4, while process mining methods were implemented on the ProM framework (ProM 6.1, Eindhoven University of Technology, Eindhoven, The Netherlands http://www.promtools.org/doku.php?id=prom61) [19]. The implemented system can be used to analyze and report the operation performance measures in multidimensions. In addition, process-oriented analysis can be performed using technologies of existing process mining from event trace and covered process models stored in the process warehouse.
All the data in the examples were extracted from the process warehouse and the process cube that was designed in Section 3.3 and Section 3.4. The first application is process-oriented analytics. This example illustrates process mining techniques such as process discovery and performer recommendation. The second application is data-oriented analytics. The core of the second example are data mining techniques such as classification and regression for on-time delivery prediction on a design change process. The final application is a hybrid scenario of process-oriented and data-oriented analytics. We discover a control-flow process model and the decision rules inside the process.
4.1. Process Discovery and Enhancement
The first application is the process-oriented analytics. Process mining is a research discipline that combines business process modeling with data mining methods to convey useful results. The basic input for process mining techniques is prepared from event log, that is, records of the actual process execution. The preparation for process mining can be made through the process warehouse and the process cube. In detail, the wanted attributes can be selected from the process warehouse, and the result is designed into the process cube. Then, the process cube can support three purposes of process mining, such as process discovery, conformance checking, and process enhancement [3]. Moreover, the cube can also be used for operational support through three main tasks: Detect, predict, and recommend. For example, recommendation refers to guiding users in selecting the next proper activity over a running instance, as well as other kinds of recommendations, such as which performer had better take the next activity in terms of time or cost.
Using the process cube, we can effectively preprocess the data. In this example process cube, we discover a subprocess model as shown in Figure 5a. After combining the discovered model with event data and metadata from the process cube, we then also apply a performer recommendation method, DTMiner, which stands for the decision tree miner [20]. This approach constructs decision trees based on event logs and recommends the best performer according to specific measures such as completion time or cost. When DTMiner is applied to a cell of interest in the process cube, the result shown in the Figure 5b can be obtained. Given a running instance, which has three completed activities, DTMiner uses historical event data to construct a decision tree, showing in red color the recommended performer for each possible path based on completion time or cost.
4.2. Performance Prediction
Since process warehouse and cubes in PRANAS include the functions of OLAP, data mining or machine learning techniques can be performed on the data schema. Therefore, the system can be utilized to analyze operation performance by choosing the suitable analytics algorithms such as classification, regression, and clustering. Suppose a manager is willing to analyze the last two years of data, as well as the collaboration processes related with all company sizes except small-sized companies. To filter the target data, two dicing operations are required for time dimension and class type dimension. After this, data analytics techniques such as decision tree and linear regression methods are applied. Two example scenarios of the data-oriented analytics are presented below.
- Classification for on-time delivery: Suppose a manager analyzes the process to find which product or project is expected to be frequently delayed. In this example, the classification models predict categorical classes which are ‘on-time delivery’ or ‘delayed delivery’ with the dimensions selected from the process cube. Figure 6a shows the result of using the decision tree classifier by adopting the classification techniques for the on-time delivery. The result of the first branch in decision tree can be interpreted as follows: If ‘Schedule Hit Rate’ (the compliance rate schedule) is more than 95%, products are expected to be on-time delivery with 98.06%.
- Regression for design change rate: Assume a manager needs to predict how many times the design changes will be done for a particular situation in the process cube. The results derived from the regression method for the design change rate based on linear regression is shown in Figure 6b. For the design change rate, in case of ‘Priority’ is not 2 (which means ‘medium’), the linear regression equation is:(DesignChangeRate) = 8.451 + 0.001 × (ReceivingCost − 10,686,667) + 0.434 × (Satisfaction − 84.933) + 0.088 × (EmailReplyTime − 22.333)
From the regression model, it can be said that the factors such as receiving cost, satisfaction, and email reply time mainly affect the design change rate.
4.3. Decision Point Analysis
In this subsection, we introduce a hybrid approach of process-oriented and data-oriented analytics. Decision mining, also known as decision point analysis, is an interesting approach that can potentially take a full advantage of the PRANAS. The authors of [21,22] have introduced similar techniques, in which a separation between control flow and data flow was distinguished. This characteristic particularly suites the PRANAS, since it can clearly separate the event log that is represented by the control-flow perspective as well as by the data-flow perspective. Suppose decision points in the event log are provided, and in each decision point the process splits in different branches. These branches are assigned as a dimension of the process cube. For example, in Figure 3, the events generated by companies of different sizes were taken to be analyzed. If a manager is interested in analyzing the branches of a specific decision point, the rolling-up operation can be used to extract the corresponding data. Figure 7a shows the discovered process model with decision points and data annotations obtained with the ProM plugin presented in [22]. Moreover, Figure 7b depicts a decision tree classifier from the decision point of company size obtained by rolling up the first two branches of the process, and then a decision tree was generated. With the result of the decision tree classifier, the effects of specific attributes on the path taken by the running process can be analyzed, which can help managers predict performance measures such as completion time or costs.
5. Conclusions and Future Work
The typical techniques of data-oriented analytics, such as regression, classification, and clustering, do not consider process-related aspects such as the order of business activities and the timestamp of generated data. Although a few process-oriented analytics such as process mining techniques consider various case data as well as process-related data, the concrete methods have not yet been clearly developed. Besides, the existing techniques of process mining often focus on only a single well-defined process rather than a process data complicatedly combined with the data storage. However, business processes change over time due to various reasons, such as work structure change and economic situation changes. Clearly, when business analysts analyze operational business performance, they should consider the execution of business process along with the design of business data. For this reason, the concepts of process cube and warehouse were presented in this paper to illustrate how they can be used for both of data-oriented analytics and process-oriented analytics.
In this paper, we designed the process analytics system called PRANAS that contains a process warehouse and a process cube. The analytics system was implemented for the operational performance analytics in supply chain management under the SCOR standard model. As the performance measures for operational process analysis, the collaborative BSC (cBSC) was designed by extending four perspectives of BSC in terms of collaboration among business partners. To illustrate the process analytics tools, three types of examples of analytics were given: Process-oriented analytics, data-oriented analytics, and hybrid analytics. In particular, the operation performance on a multidimensional level using the designed process cube was analyzed.
Previous studies on integration between data analytics and process analytics were not sufficient. To supplement the research necessity, the concept of process warehouse and cube can be useful. The proposed framework based on the process warehouse and cub is expected to be a helpful guide for designing business performance systems to be implemented using recently advanced techniques of data mining, as well as process mining. This is because the system was designed to support both aspects of data-oriented analytics and process-oriented analytics.
Although we showed a system implementation supporting the proposed process analytics system in this paper, many challenges still remain. The main purpose of operational analytics is to provide “near real-time” analytics in organizations, and therefore an automated procedure for generating insightful reports could be proposed. With this, the decision-making process inside the company would be systematically improved in terms of business process intelligence.
Author Contributions
Conceptualization, A.K. and J.-Y.J.; methodology, A.K. and J.-Y.J.; software, A.K. and J.O.; validation, A.K. and J.-Y.J.; investigation, A.K., J.O. and J.-Y.J.; Writing—Original draft preparation, A.K. and J.O.; Writing—Review and editing, J.O. and J.-Y.J.; visualization, A.K. and J.O.; supervision, J.-Y.J.; project administration, J.-Y.J.; funding acquisition, J.-Y.J. All authors have read and agreed to the published version of the manuscript
Funding
This work was supported by the National Research Foundation of Korea (NRF) grant funded by the Korea government (MSIT) (No. 2019R1F1A1064125).
Conflicts of Interest
The authors declare no conflict of interest.
References
- Vercellis, C. Business Intelligence: Data Mining and Optimization for Decision Making; John Wiley & Sons: Hoboken, NJ, USA, 2011. [Google Scholar]
- Chaudhuri, S.; Dayal, U.; Narasayya, V. An overview of business intelligence technology. Commun. ACM 2017, 54, 88–98. [Google Scholar] [CrossRef]
- Van der Aalst, W.M.P. Process Mining: Discovery, Conformance and Enhancement of Business Processes, 2nd ed.; Springer: Heidelberg, Germany, 2011. [Google Scholar]
- Görgülü, Z.-K.; Pickl, S. Adaptive business intelligence: The integration of data mining and systems engineering into an advanced decision support as an integral part of the business strategy. In Business Intelligence and Performance Management. Advanced Information and Knowledge Processing; Rausch, P., Sheta, A., Ayesh, A., Eds.; Springer: London, UK, 2013; pp. 43–58. [Google Scholar]
- Marjanovic, O. The next stage of operational business intelligence: Creating new challenges for business process management. In Proceedings of the 40th Annual Hawaii International Conference on System Sciences, Waikoloa, HI, USA, 3–6 January 2007; p. 215c. [Google Scholar]
- Kim, K.P. Functional integration with process mining and process analyzing for structural and behavioral properness validation of processes discovered from event log datasets. Appl. Sci. 2020, 10, 1493. [Google Scholar] [CrossRef] [Green Version]
- De Smedt, J.; vanden Broucke, S.; Obregon, J.; Kim, A.; Jung, J.-Y.; Vanthienen, J. Decision mining in a broader context: An overview of the current landscape and future directions. In Business Process Management Workshops. Lecture Notes in Business Information Processing; Springer: Cham, Switzerland, 2016; Volume 281, pp. 197–207. [Google Scholar]
- Van der Aalst, W.M.P. Process cubes: Slicing, dicing, rolling up and drilling down event data for process mining. In Asia Pacific Business Process Management. Lecture Notes in Business Information Processing; Springer: Cham, Switzerland, 2013; Volume 159, pp. 1–22. [Google Scholar]
- Beheshti, S.; Benatallah, B.; Motahari-Nezhad, H.R. Scalable graph-based OLAP analytics over process execution data. Distrib. Parallel Databases 2016, 34, 370–423. [Google Scholar] [CrossRef]
- Silva, T.; Jian, M.; Chen, Y. Process Analytics Approach for R&D Project Selection. ACM Trans. Manag. Inf. Syst. 2014, 5, 21. [Google Scholar]
- Grigori, D.; Casati, F.; Castellanos, M.; Dayal, U.; Sayal, M.; Shan, M.-C. Business process intelligence. Comput. Ind. 2004, 53, 321–343. [Google Scholar] [CrossRef] [Green Version]
- Mansmann, S.; Neumuth, T.; Scholl, M. OLAP technology for business process intelligence: Challenges and solutions. In Data Warehousing and Knowledge Discovery. Lecture Notes in Computer Science; Springer: Berlin, Germany, 2007; Volume 2114, pp. 111–122. [Google Scholar]
- Bolt, A.; de Leoni, M.; van der Aalst, W.M.P.; Gorissen, P. Exploiting process cubes, analytic workflows and process mining for business process reporting: A case study in education. In Data-Driven Process Discovery and Analysis, Lecture Notes in Business Information Processing; Springer: Vienna, Austria, 2015; Volume 244, pp. 33–47. [Google Scholar]
- Van der Aalst, W.M.P.; Guo, S.; Gorissen, P. Comparative process mining in education: An approach based on process cubes. In International Symposium on Data-Driven Process Discovery and Analysis. Lecture Notes in Business Information Processing; Springer: Berlin, Germany, 2013; Volume 203, pp. 110–134. [Google Scholar]
- Arias, M.; Rojas, E.; Munoz-Gama, J.; Sepúlveda, M. A framework for recommending resource allocation based on process mining. In Business Process Management Workshops. Lecture Notes in Business Information Processing; Springer: Cham, Switzerland, 2016; Volume 256, pp. 458–470. [Google Scholar]
- Knoll, D.; Reinhart, G.; Prüglmeier, M. Enabling value stream mapping for internal logistics using multidimensional process mining. Expert Syst. Appl. 2019, 124, 130–142. [Google Scholar] [CrossRef]
- Kaplan, R.S.; Norton, D.P. The Balanced Scorecard-Measures That Drive Performance; Harvard Business Review; Harvard Business School Press: Brighton, MA, USA, 1992. [Google Scholar]
- Herden, T.T.; Bunzel, S. Archetypes of supply chain analytics initiatives—An exploratory study. Logistics 2018, 2, 10. [Google Scholar] [CrossRef] [Green Version]
- Van Dongen, B.F.; de Medeiros, A.K.A.; Verbeek, H.M.W.; Weijters, A.J.M.M.; van der Aalst, W.M.P. The ProM framework: A new era in process mining tool support. In Applications and Theory of Petri Nets Lecture Notes in Computer Science; Springer: Berlin, Germany, 2015; Volume 3536, pp. 444–454. [Google Scholar]
- Kim, A.; Obregon, J.; Jung, J.-Y. Constructing decision trees from process logs for performer recommendation. In Business Process Management Workshops. Lecture Notes in Business Information Processing; Springer: Cham, Switzerland, 2013; Volume 171, pp. 224–236. [Google Scholar]
- Rozinat, A.; van der Aalst, W.M.P. Decision mining in ProM. In Business Process Management. Lecture Notes in Computer Science; Springer: Berlin, Germany, 2006; Volume 4102, pp. 420–425. [Google Scholar]
- De Leoni, M.; van der Aalst, W.M.P. Data-aware process mining: Discovering decisions in processes using alignments. In Proceedings of the 28th ACM Symposium on Applied Computing, Coimbra, Portugal, 18–22 March 2013; pp. 1454–1461. [Google Scholar]
Figure 1.
The framework of the process analytics system, PRANAS.
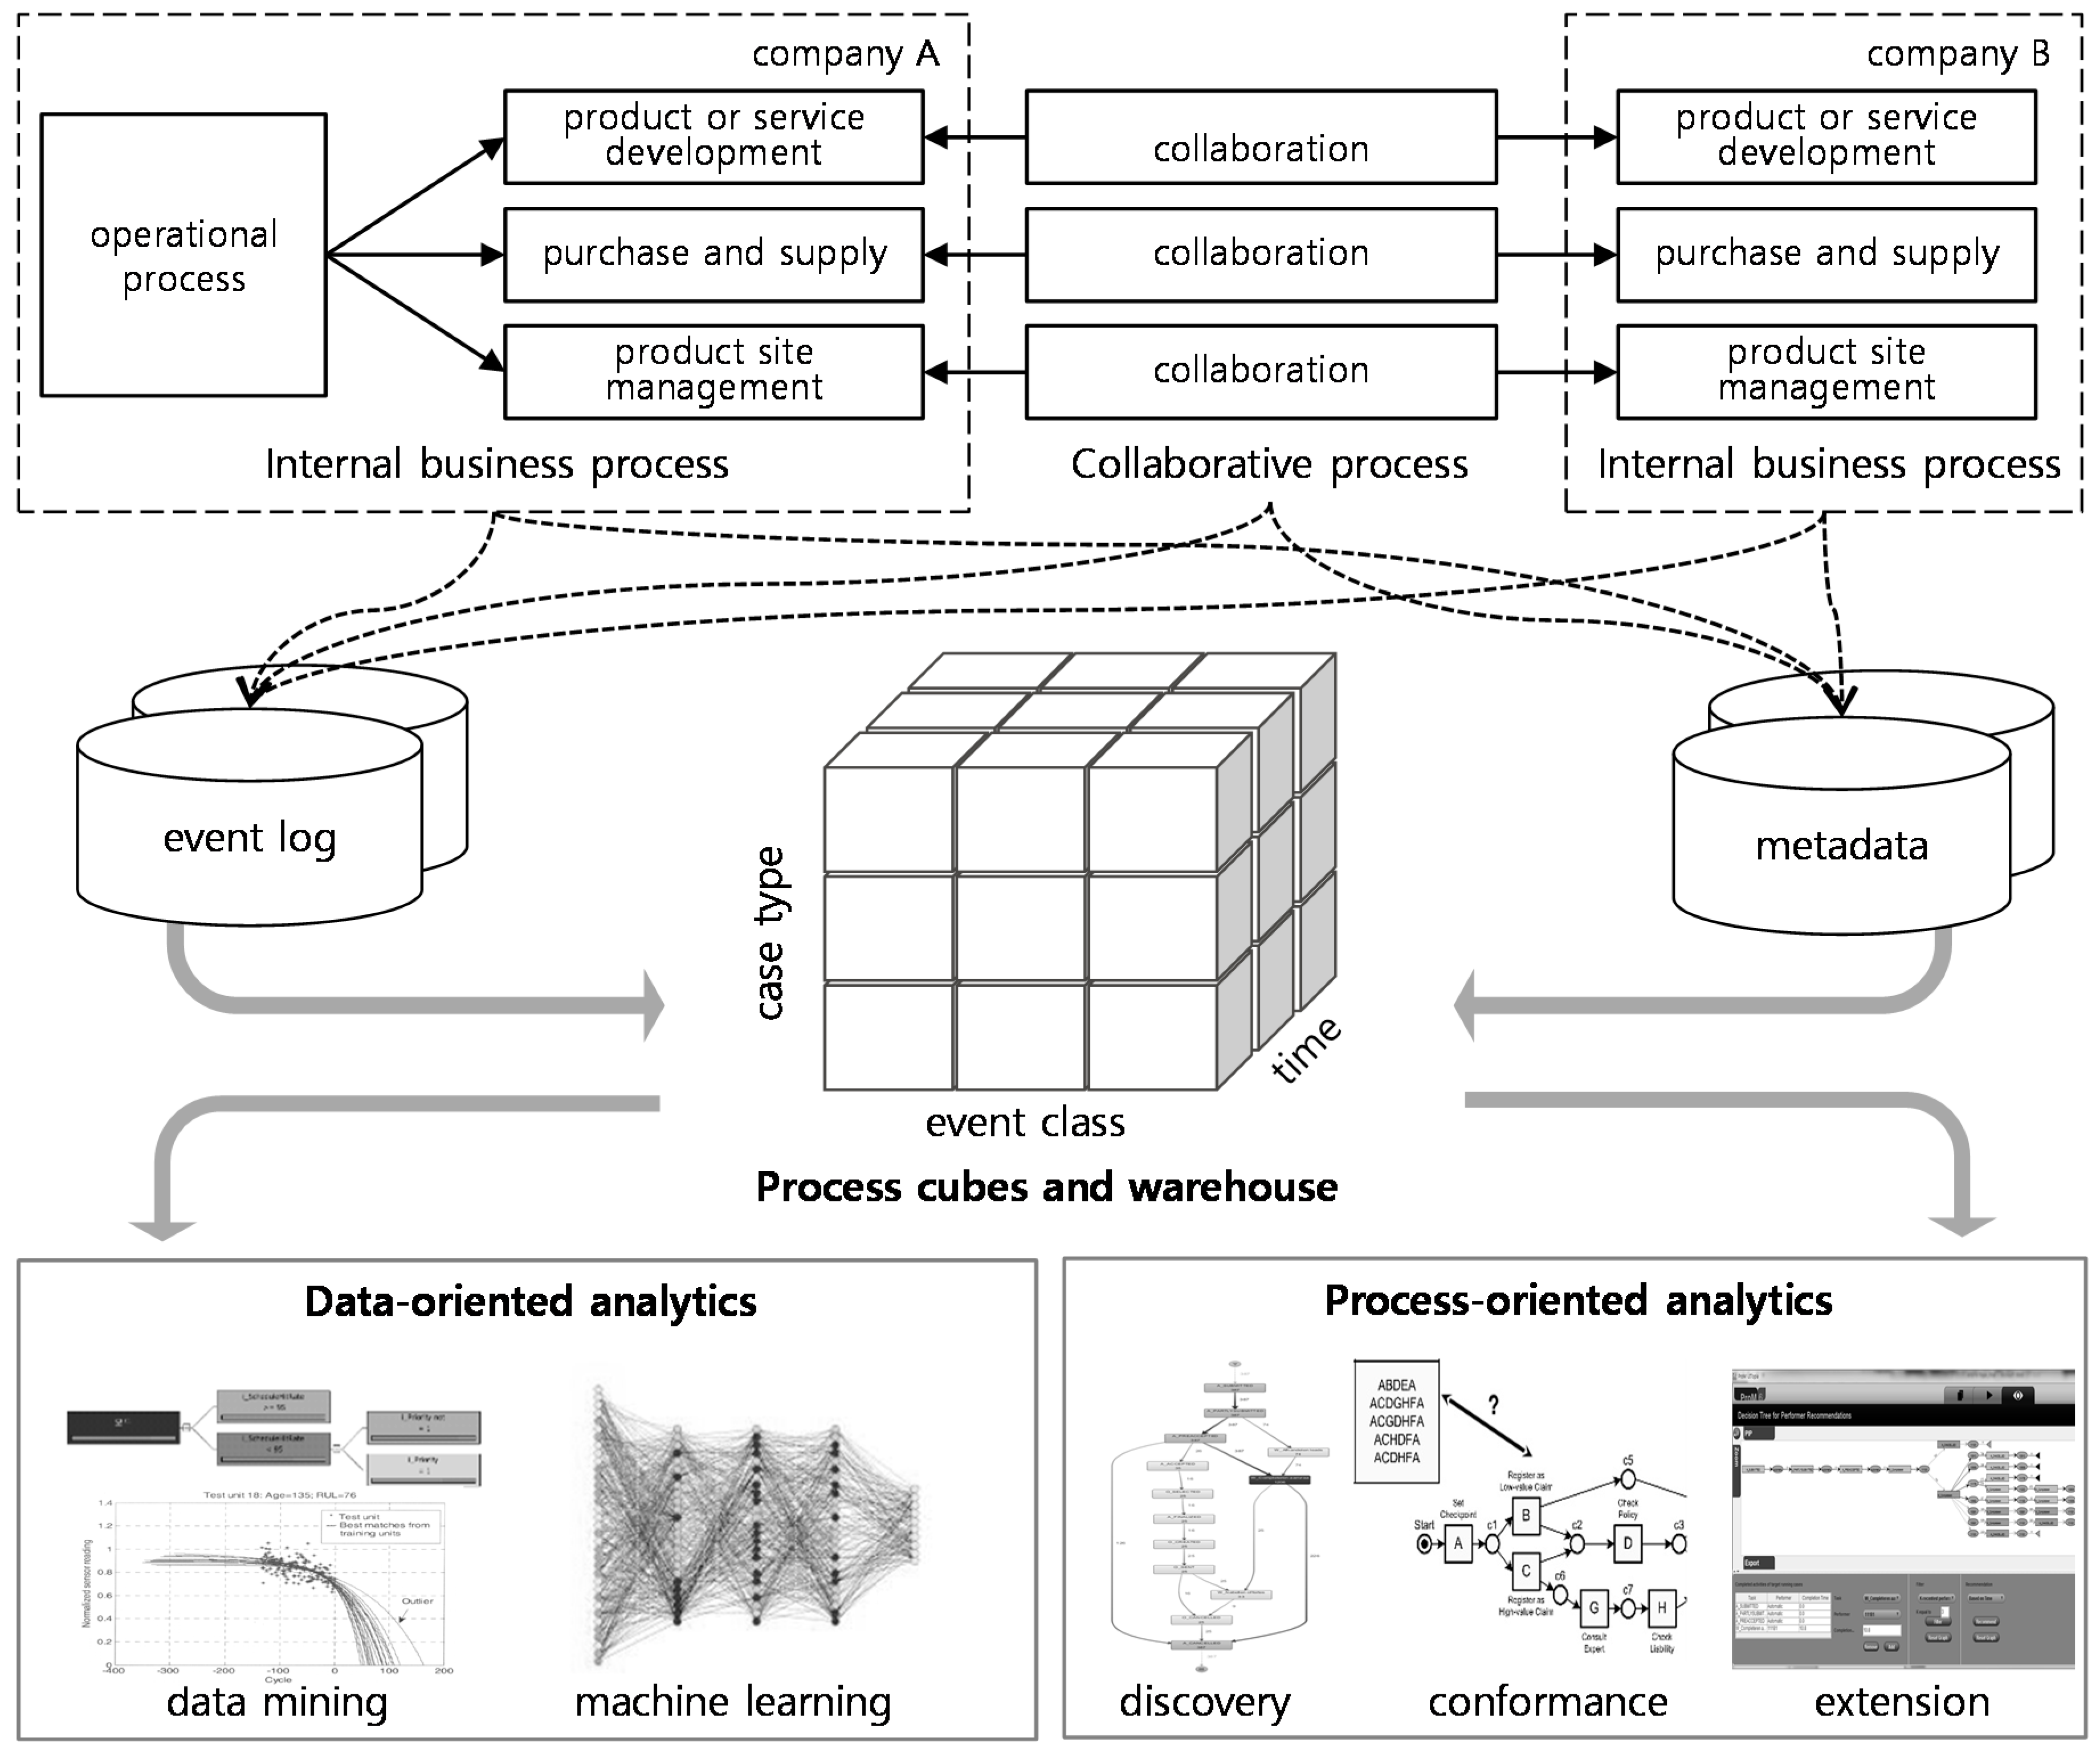
Figure 2.
A galaxy schema design for a process warehouse for the collaborative Balanced Scorecard (cBSC) under the Supply Chain Operations Reference (SCOR) models.
Figure 2.
A galaxy schema design for a process warehouse for the collaborative Balanced Scorecard (cBSC) under the Supply Chain Operations Reference (SCOR) models.
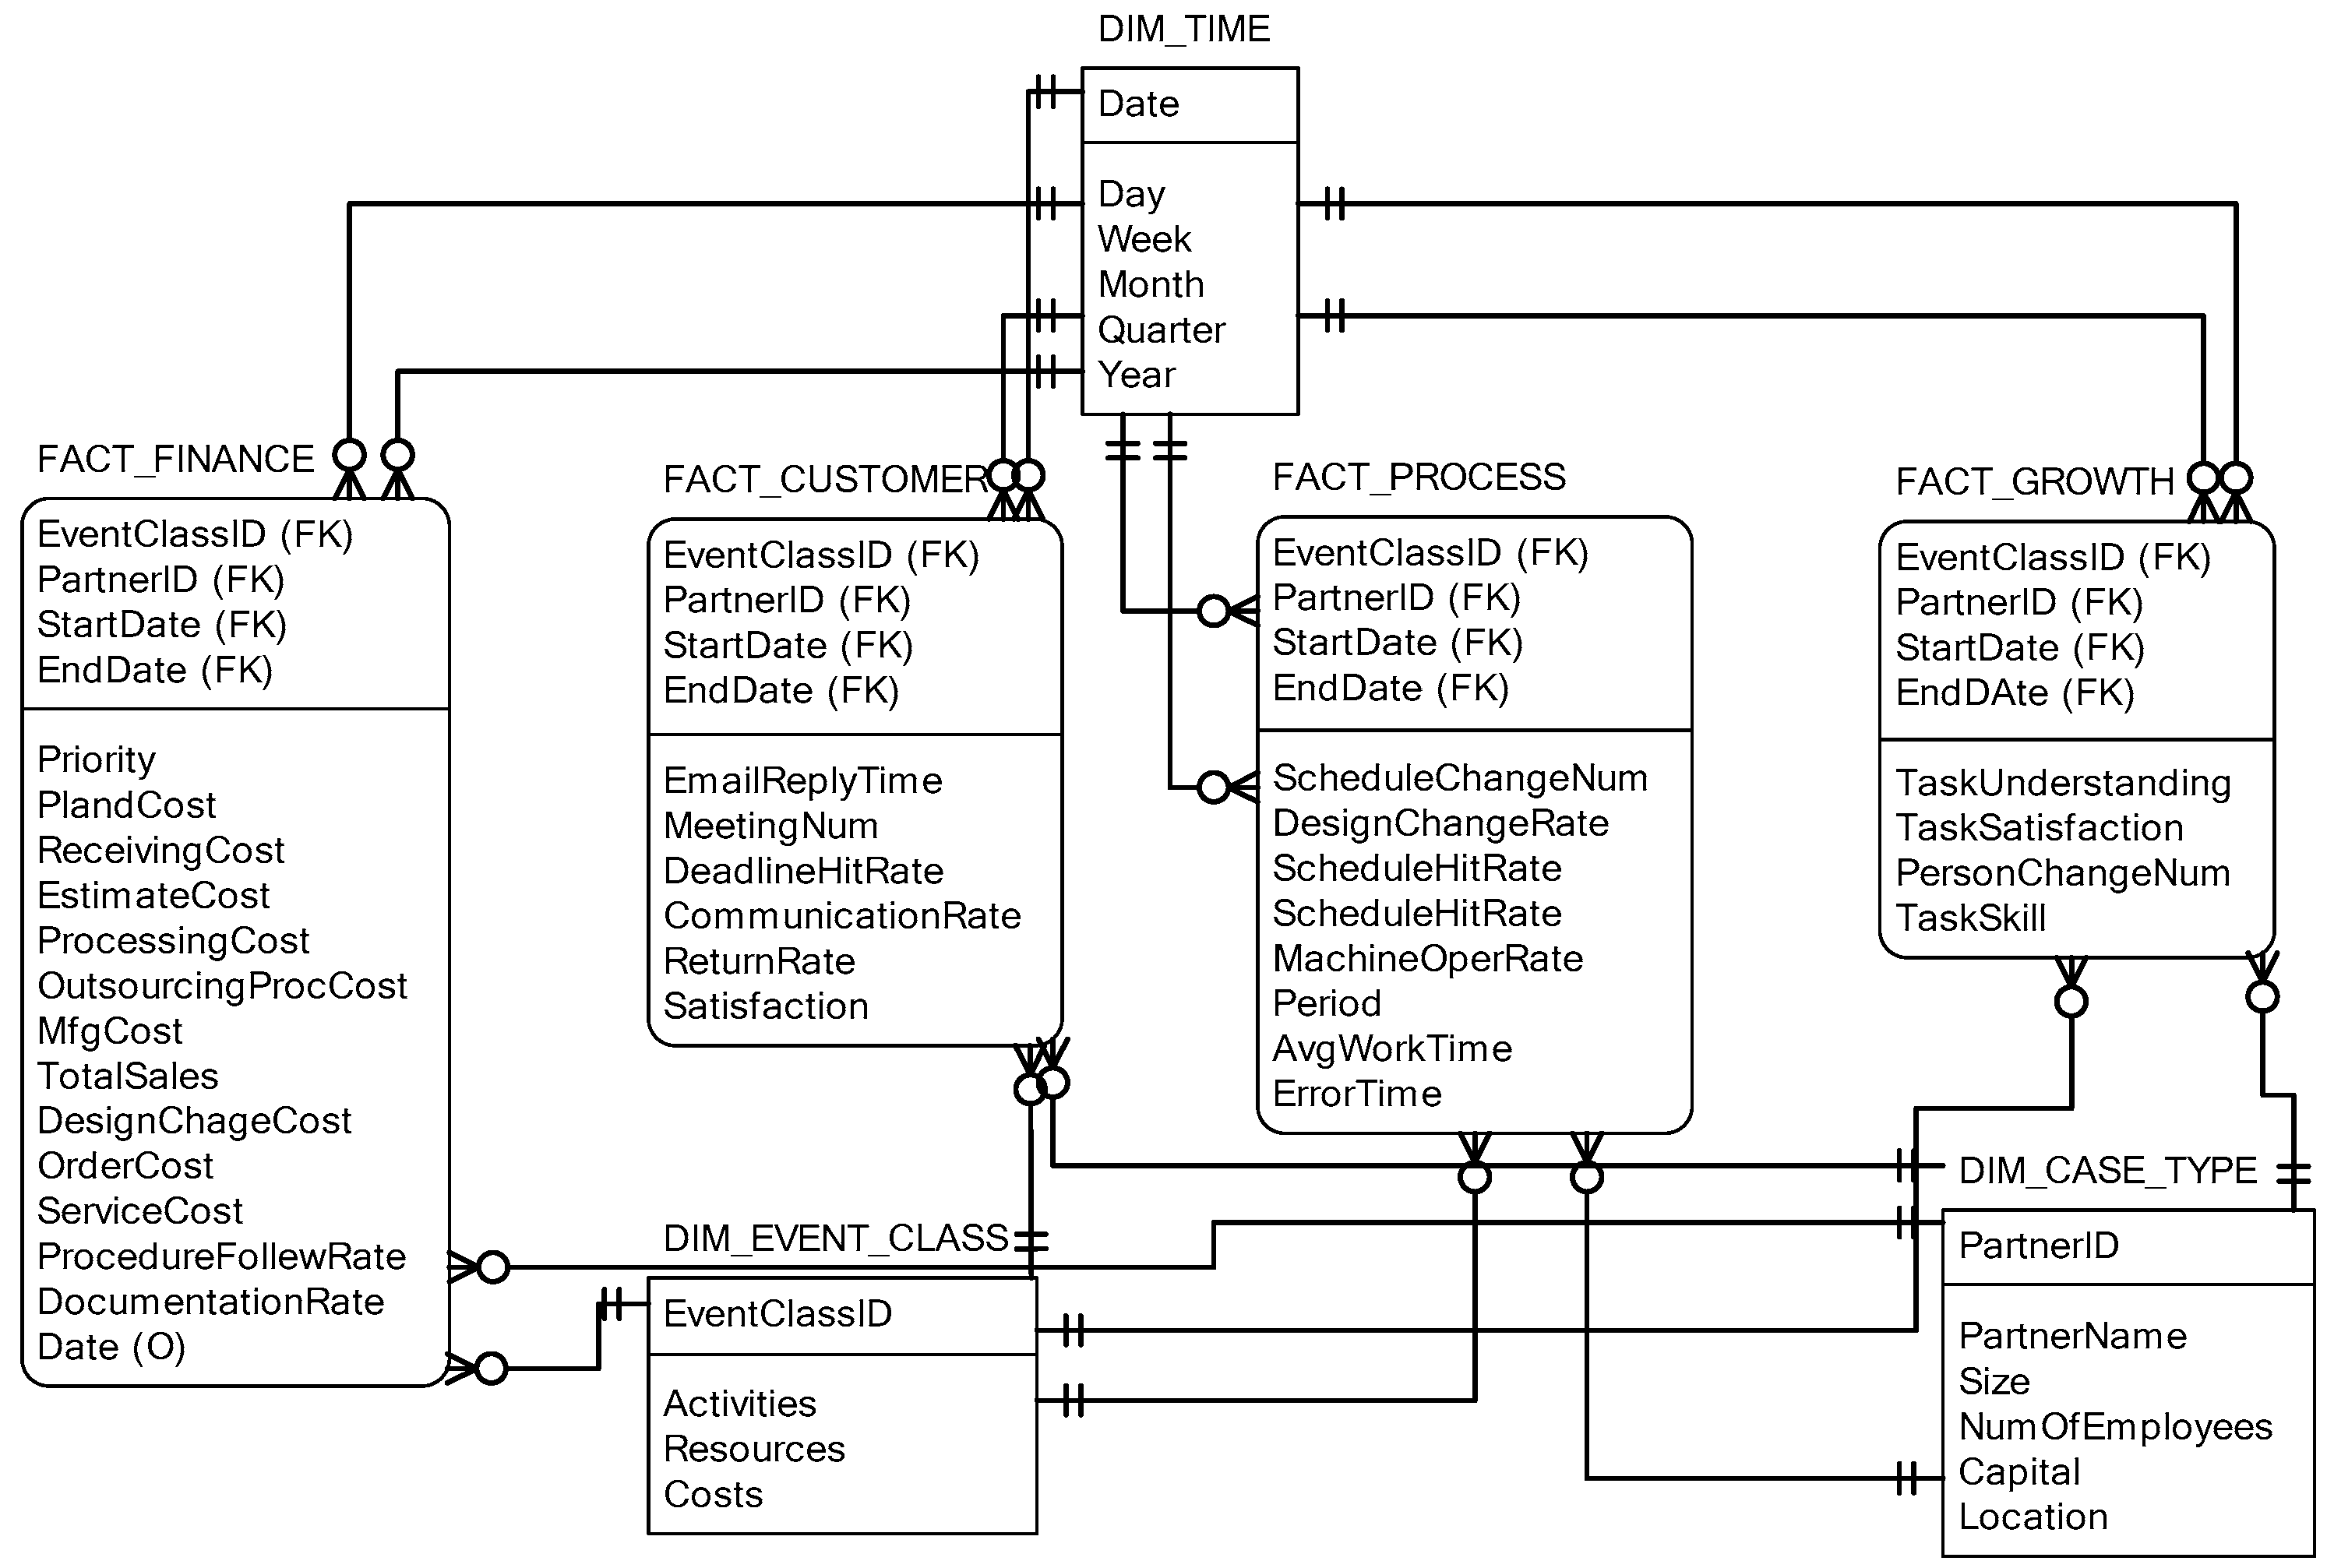
Figure 3.
The design of a process cube for collaborative operational events between partners in supply chain management.
Figure 3.
The design of a process cube for collaborative operational events between partners in supply chain management.
Figure 4.
Implementation of a process warehouse and a process cube for supporting operational data analysis in supply chain management.
Figure 4.
Implementation of a process warehouse and a process cube for supporting operational data analysis in supply chain management.

Figure 5.
Two examples of process-oriented analytics using PRANAS with process mining tools. (a) Discovered subprocess model; (b) Decision tree for performer recommendation using DTMiner.
Figure 5.
Two examples of process-oriented analytics using PRANAS with process mining tools. (a) Discovered subprocess model; (b) Decision tree for performer recommendation using DTMiner.

Figure 6.
Two examples of data-oriented analytics using PRANAS with Microsoft SQL Server BIDS. (a) Classification model for on-time delivery based on decision tree; (b) Regression model for design change rate based on linear regression.
Figure 6.
Two examples of data-oriented analytics using PRANAS with Microsoft SQL Server BIDS. (a) Classification model for on-time delivery based on decision tree; (b) Regression model for design change rate based on linear regression.

Figure 7.
Two examples of combined data-oriented and process-oriented analytics. (a) Discovered model with decision points using ProM; (b) Decision tree classifier for a decision point split by company size.
Figure 7.
Two examples of combined data-oriented and process-oriented analytics. (a) Discovered model with decision points using ProM; (b) Decision tree classifier for a decision point split by company size.

Table 1.
Collaborative Balanced Scorecard (cBSC) with collaborative critical success factors (cCSFs) and SCOR-based collaborative key performance indicators (cKPI) from four new perspectives.
Table 1.
Collaborative Balanced Scorecard (cBSC) with collaborative critical success factors (cCSFs) and SCOR-based collaborative key performance indicators (cKPI) from four new perspectives.
| Perspectives | cCSF | SCOR-Based cKPI |
|---|---|---|
| Finance | Collaboration value increase | output sales, yield |
| Collaboration cost cutting | design change cost, order processing cost, logistical cost, service cost | |
| Collaboration profitability improvement | sales profit, return rate | |
| Collaboration maturity improvement | procedure compliance rate | |
| Partnership/Customer | Satisfaction improvement of task conduction | deadline compliance rate, average time of task processing |
| Satisfaction improvement of output | return rate, change rate | |
| New partner secure | number of annual new partners | |
| Market share increase | obtain order rate | |
| Good communication | email response time, number of meetings | |
| Collaboration Process | Collaboration schedule compliance | schedule compliance or violation |
| Collaboration risk minimization | persistency rate of optimal stocks | |
| Product quality increase | number of defective products, defective product rate | |
| Product variability minimization | purchase prediction accuracy, number of schedule changes | |
| Productivity improvement of collaboration process | processing time, operation rate of facilities | |
| Growth/Coevolution | Satisfaction improvement of collaboration manager | collaboration satisfaction, collaboration task understanding degree |
| Persistency rate improvement of collaboration manager | number of manager changes | |
| Productivity improvement of collaboration manager | task ability and skill rate |
© 2020 by the authors. Licensee MDPI, Basel, Switzerland. This article is an open access article distributed under the terms and conditions of the Creative Commons Attribution (CC BY) license (http://creativecommons.org/licenses/by/4.0/).
Share and Cite
MDPI and ACS Style
Kim, A.; Obregon, J.; Jung, J.-Y. PRANAS: A Process Analytics System Based on Process Warehouse and Cube for Supply Chain Management. Appl. Sci. 2020, 10, 3521. https://doi.org/10.3390/app10103521
AMA Style
Kim A, Obregon J, Jung J-Y. PRANAS: A Process Analytics System Based on Process Warehouse and Cube for Supply Chain Management. Applied Sciences. 2020; 10(10):3521. https://doi.org/10.3390/app10103521
Chicago/Turabian StyleKim, Aekyung, Josue Obregon, and Jae-Yoon Jung. 2020. "PRANAS: A Process Analytics System Based on Process Warehouse and Cube for Supply Chain Management" Applied Sciences 10, no. 10: 3521. https://doi.org/10.3390/app10103521
Note that from the first issue of 2016, this journal uses article numbers instead of page numbers. See further details here.