Microplastic Contamination of Surface Water-Sourced Tap Water in Hong Kong—A Preliminary Study


Abstract
1. Introduction
2. Methodology
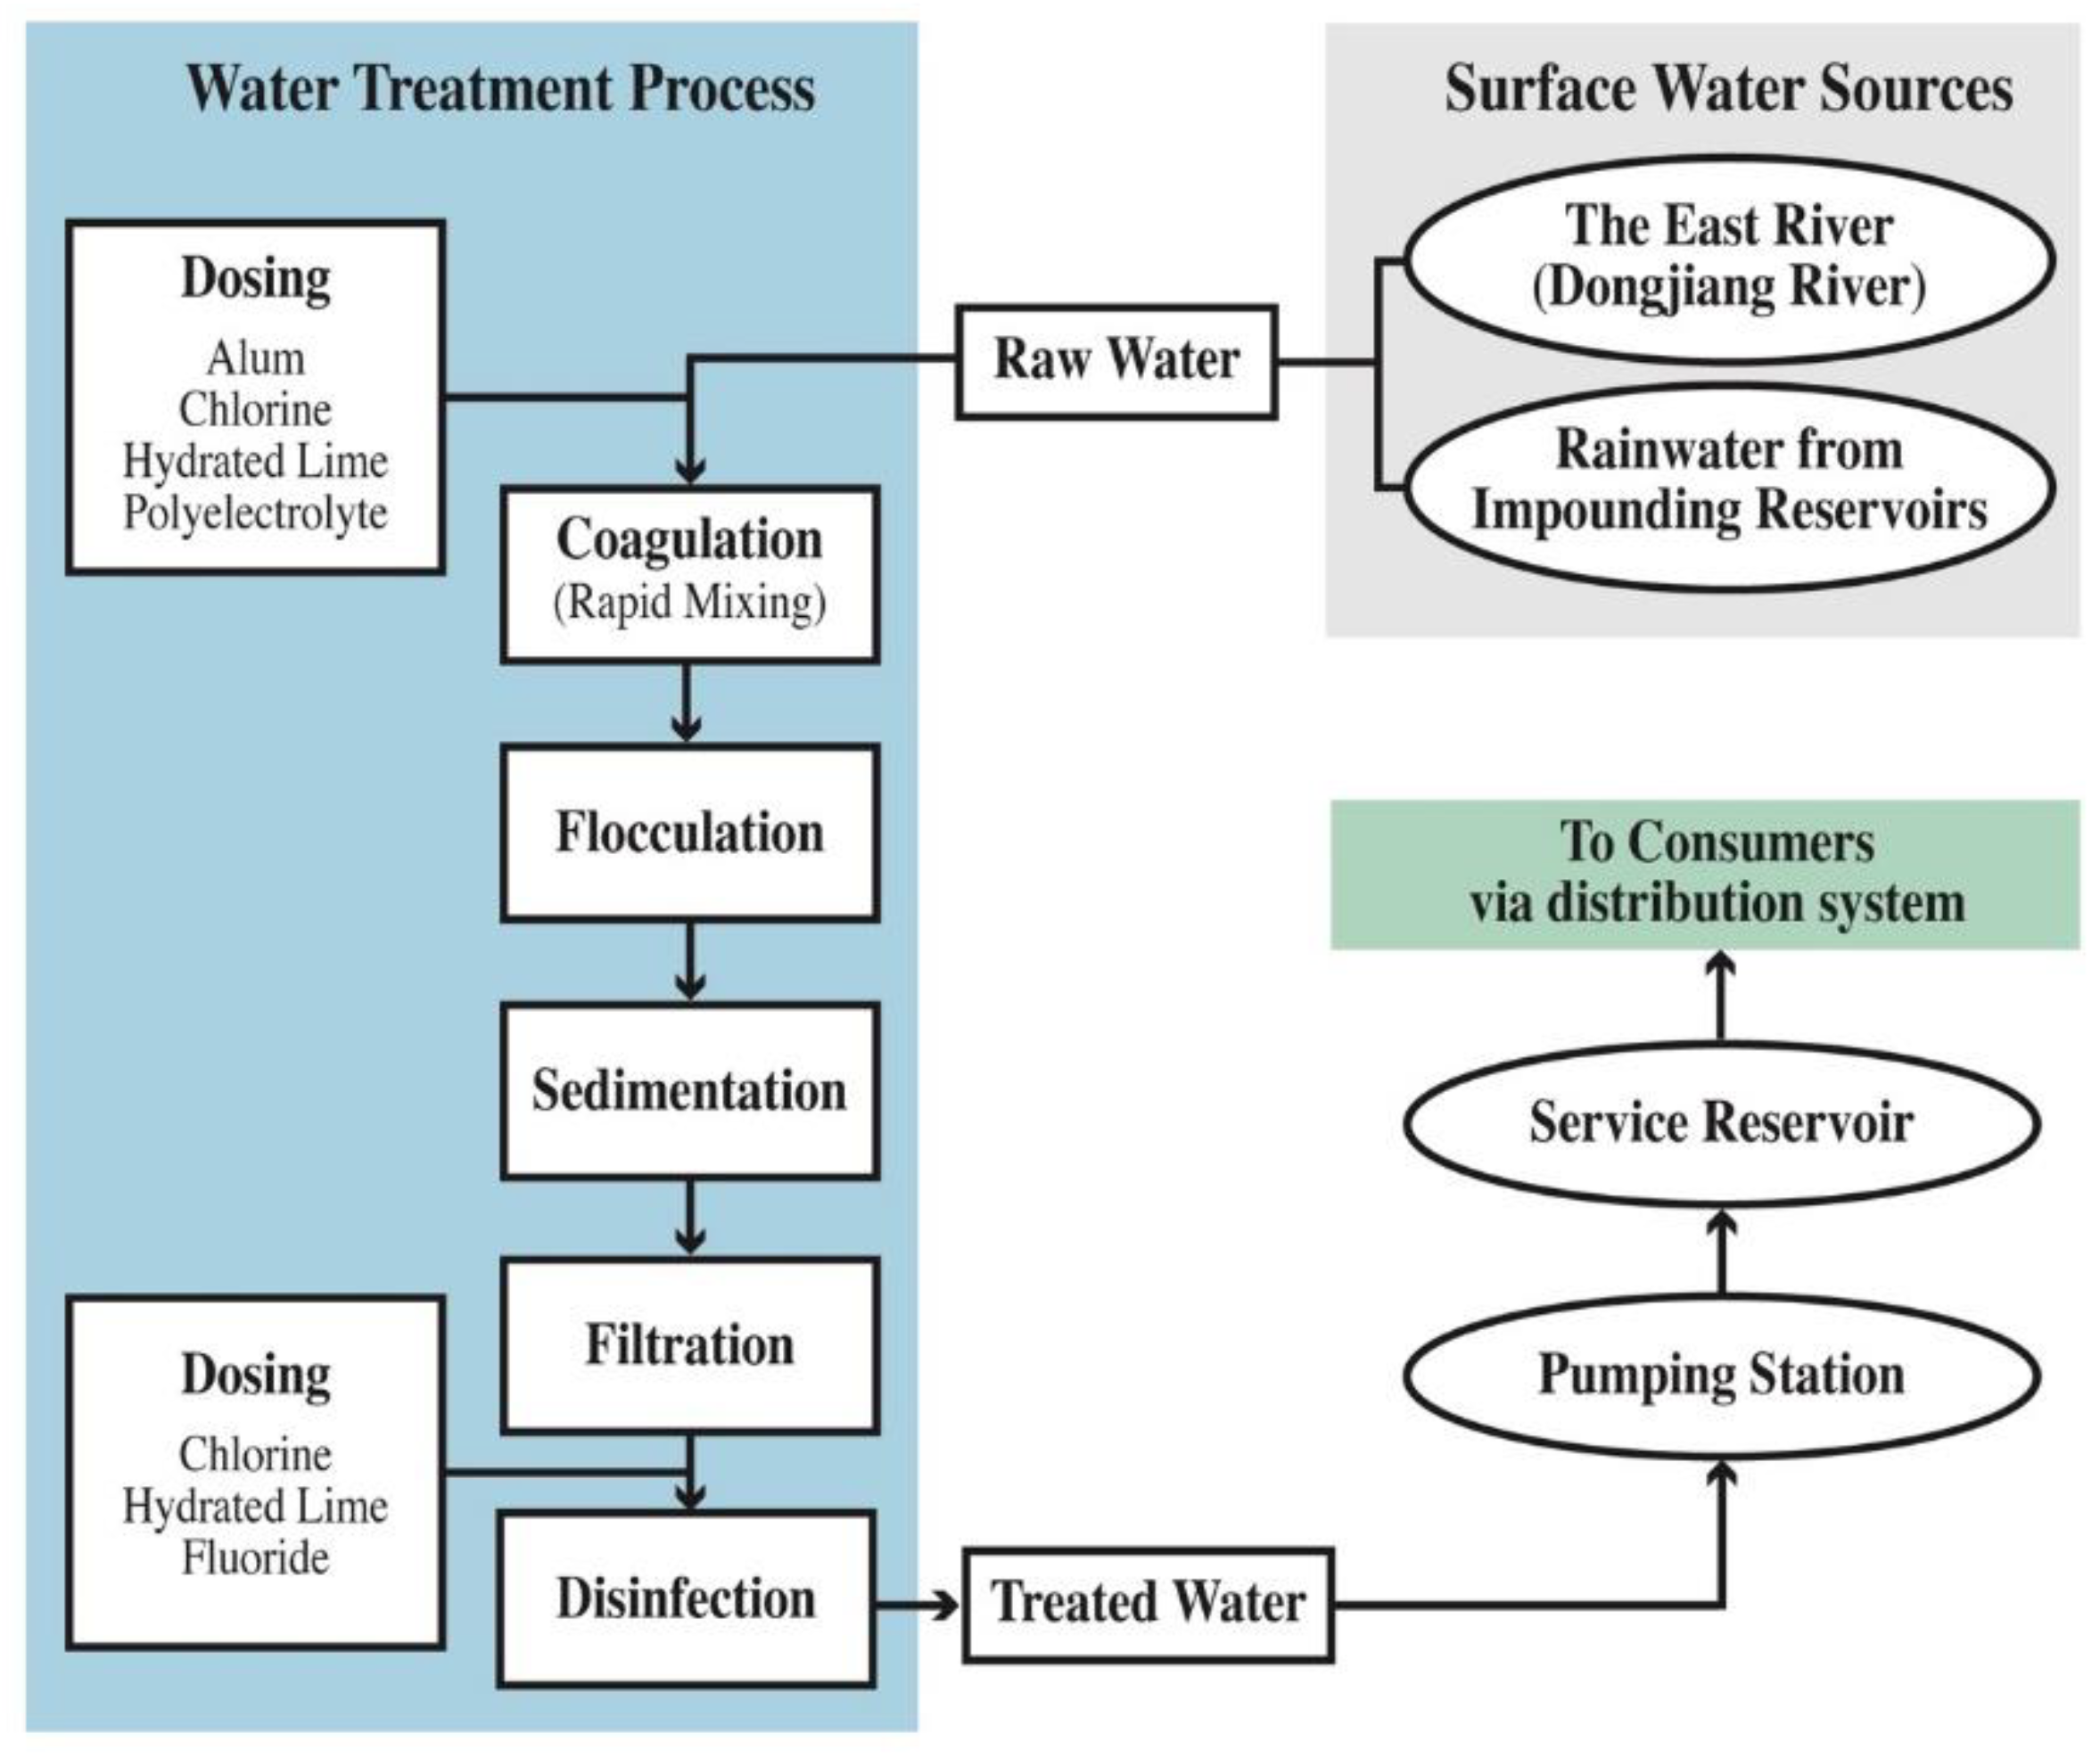
2.1. Sampling Sites
2.2. Sample Collection
2.3. Rose Bengal Staining and Quantification of Microplastics
2.4. Statistical Analysis
2.5. Quality Assurance and Quality Control
3. Results
3.1. Contamination Control
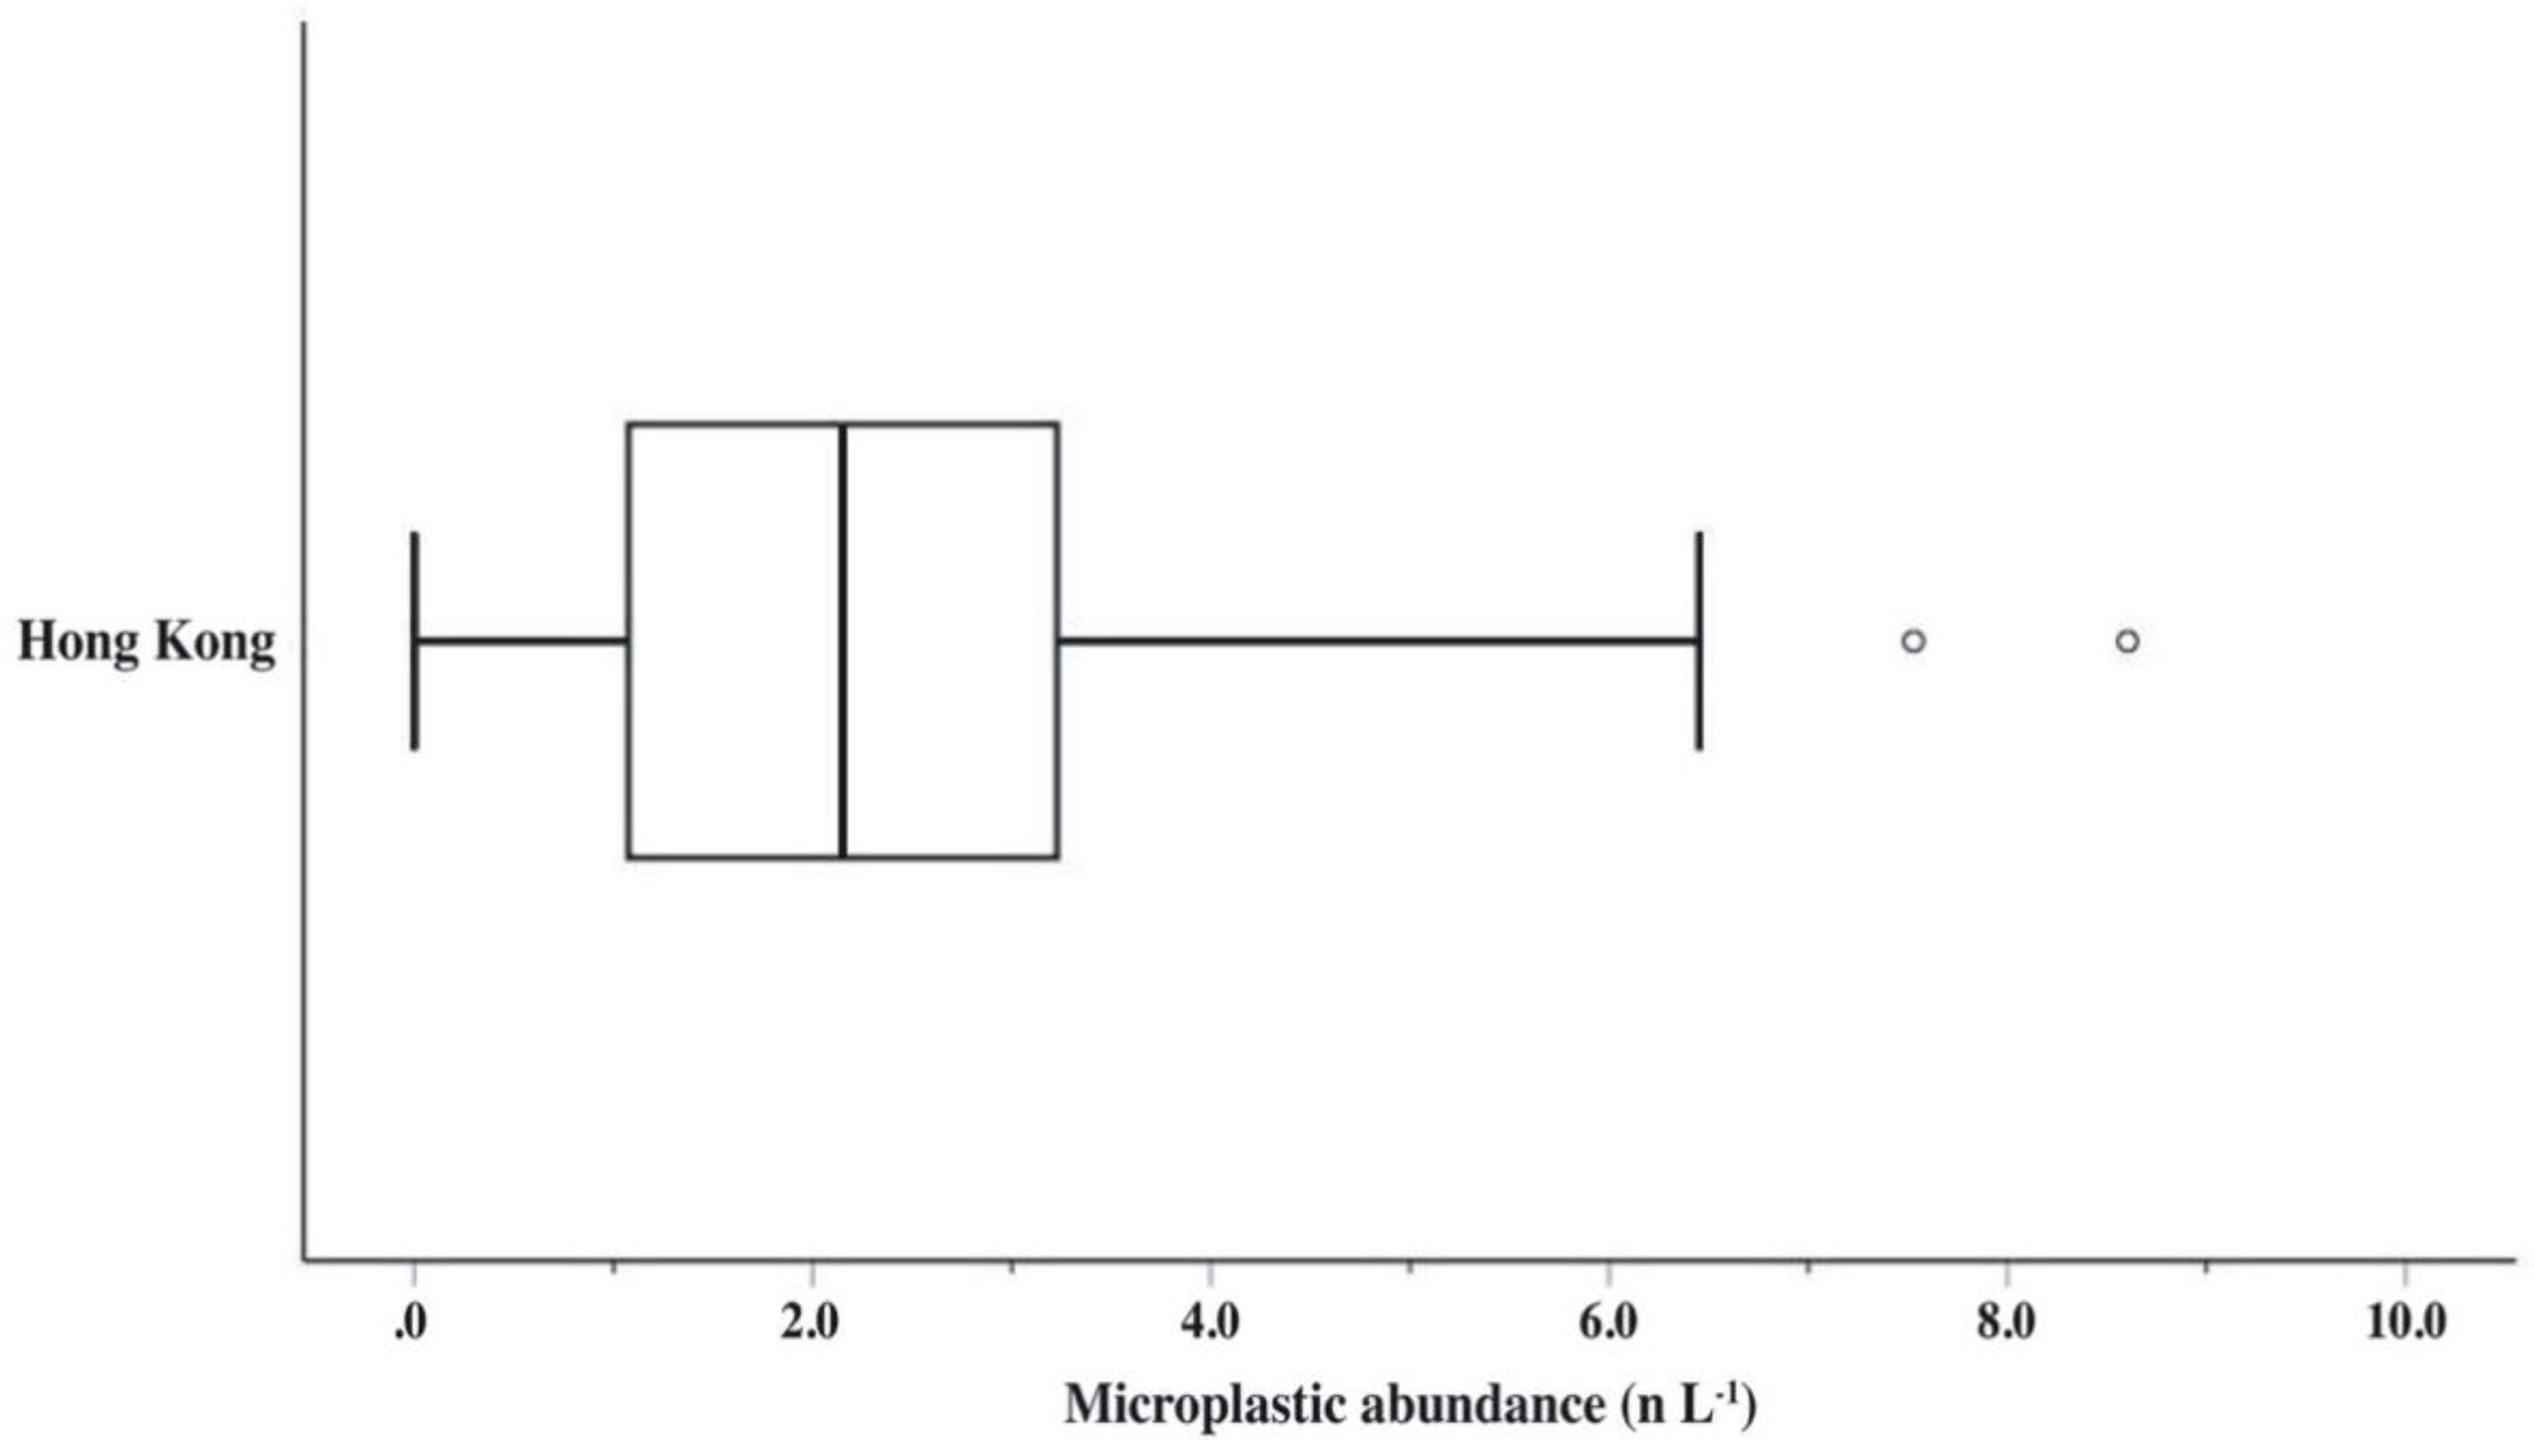
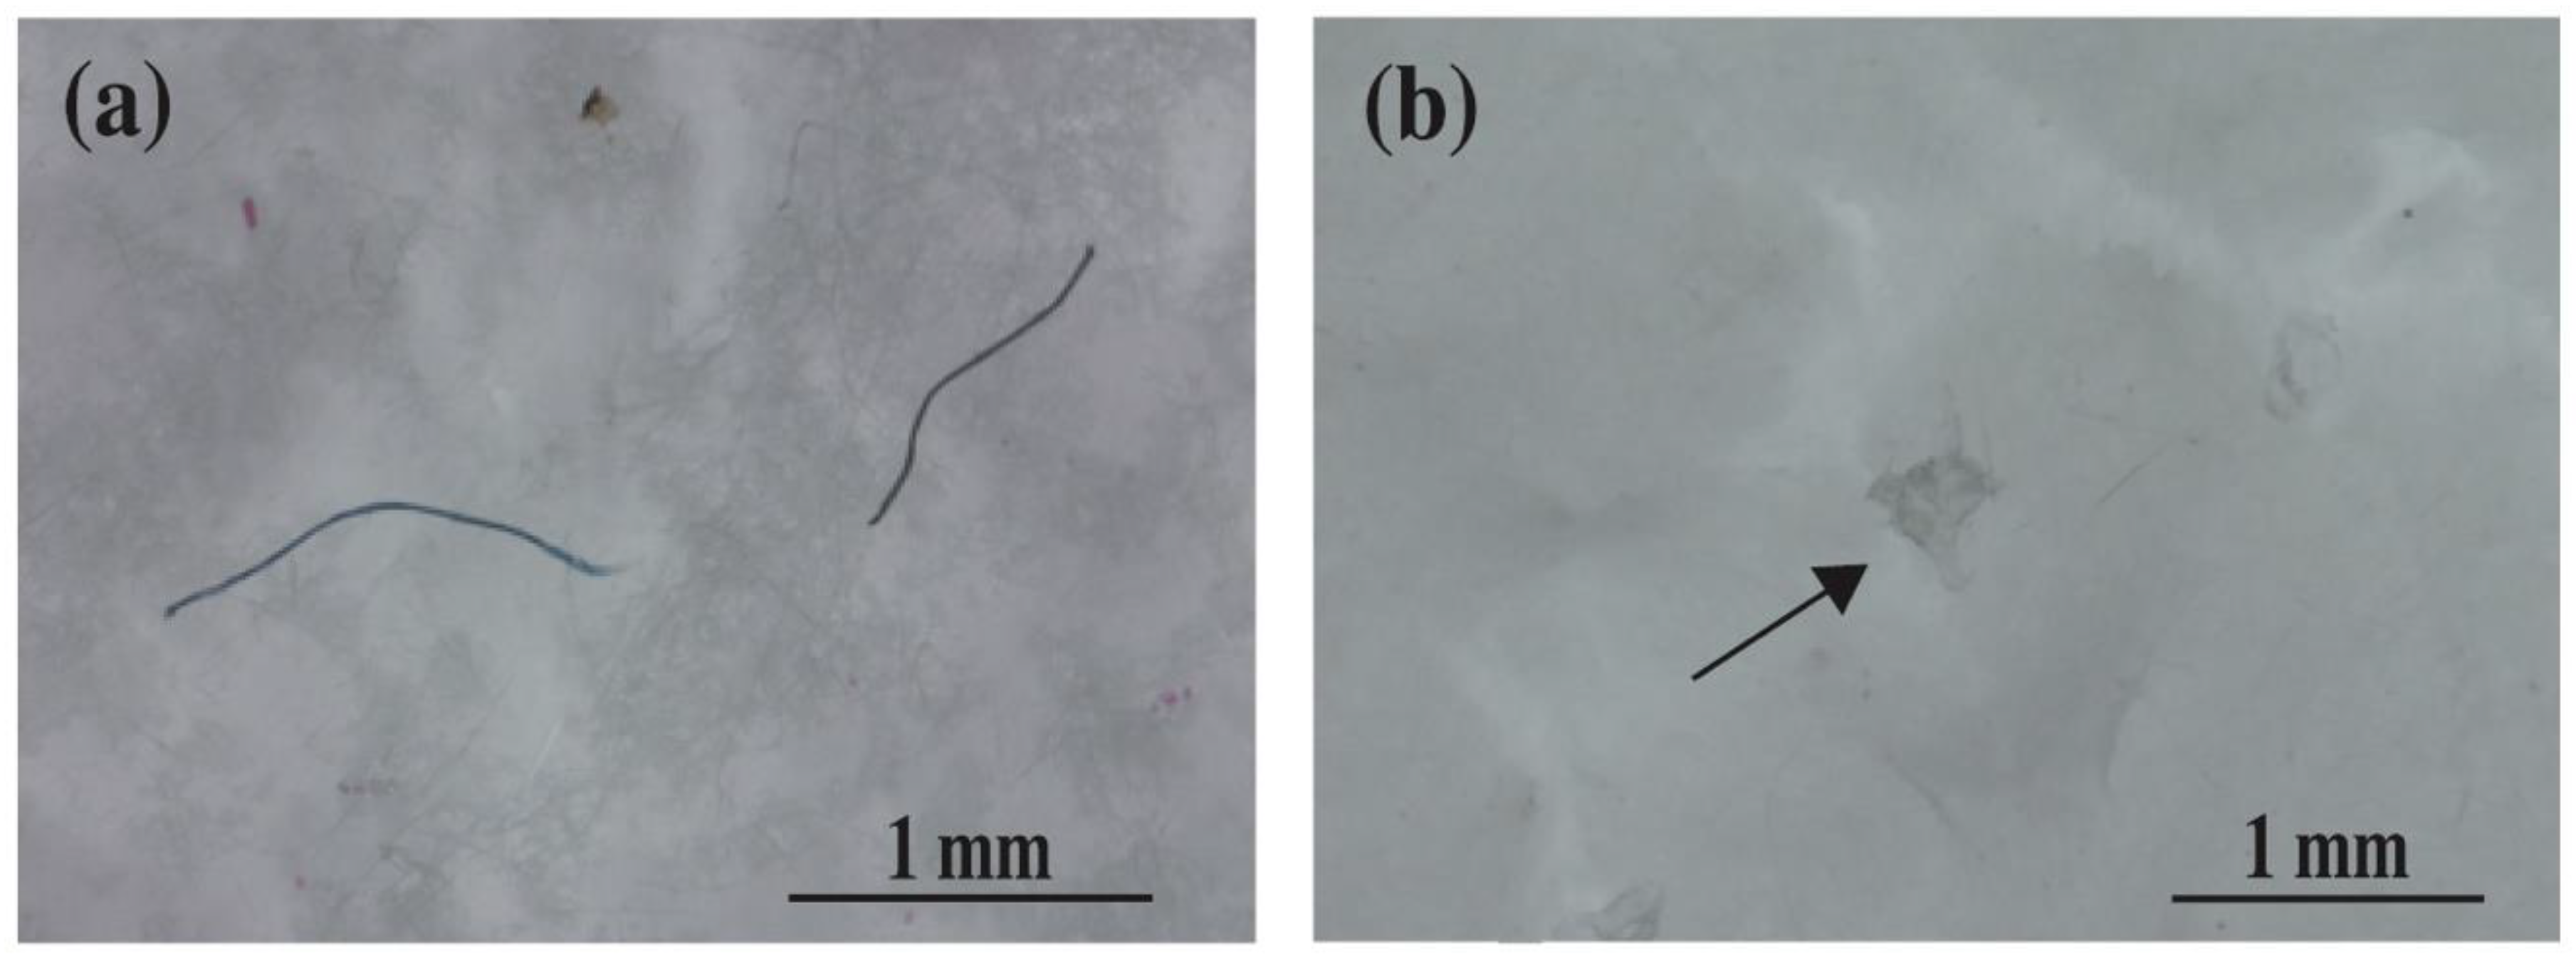
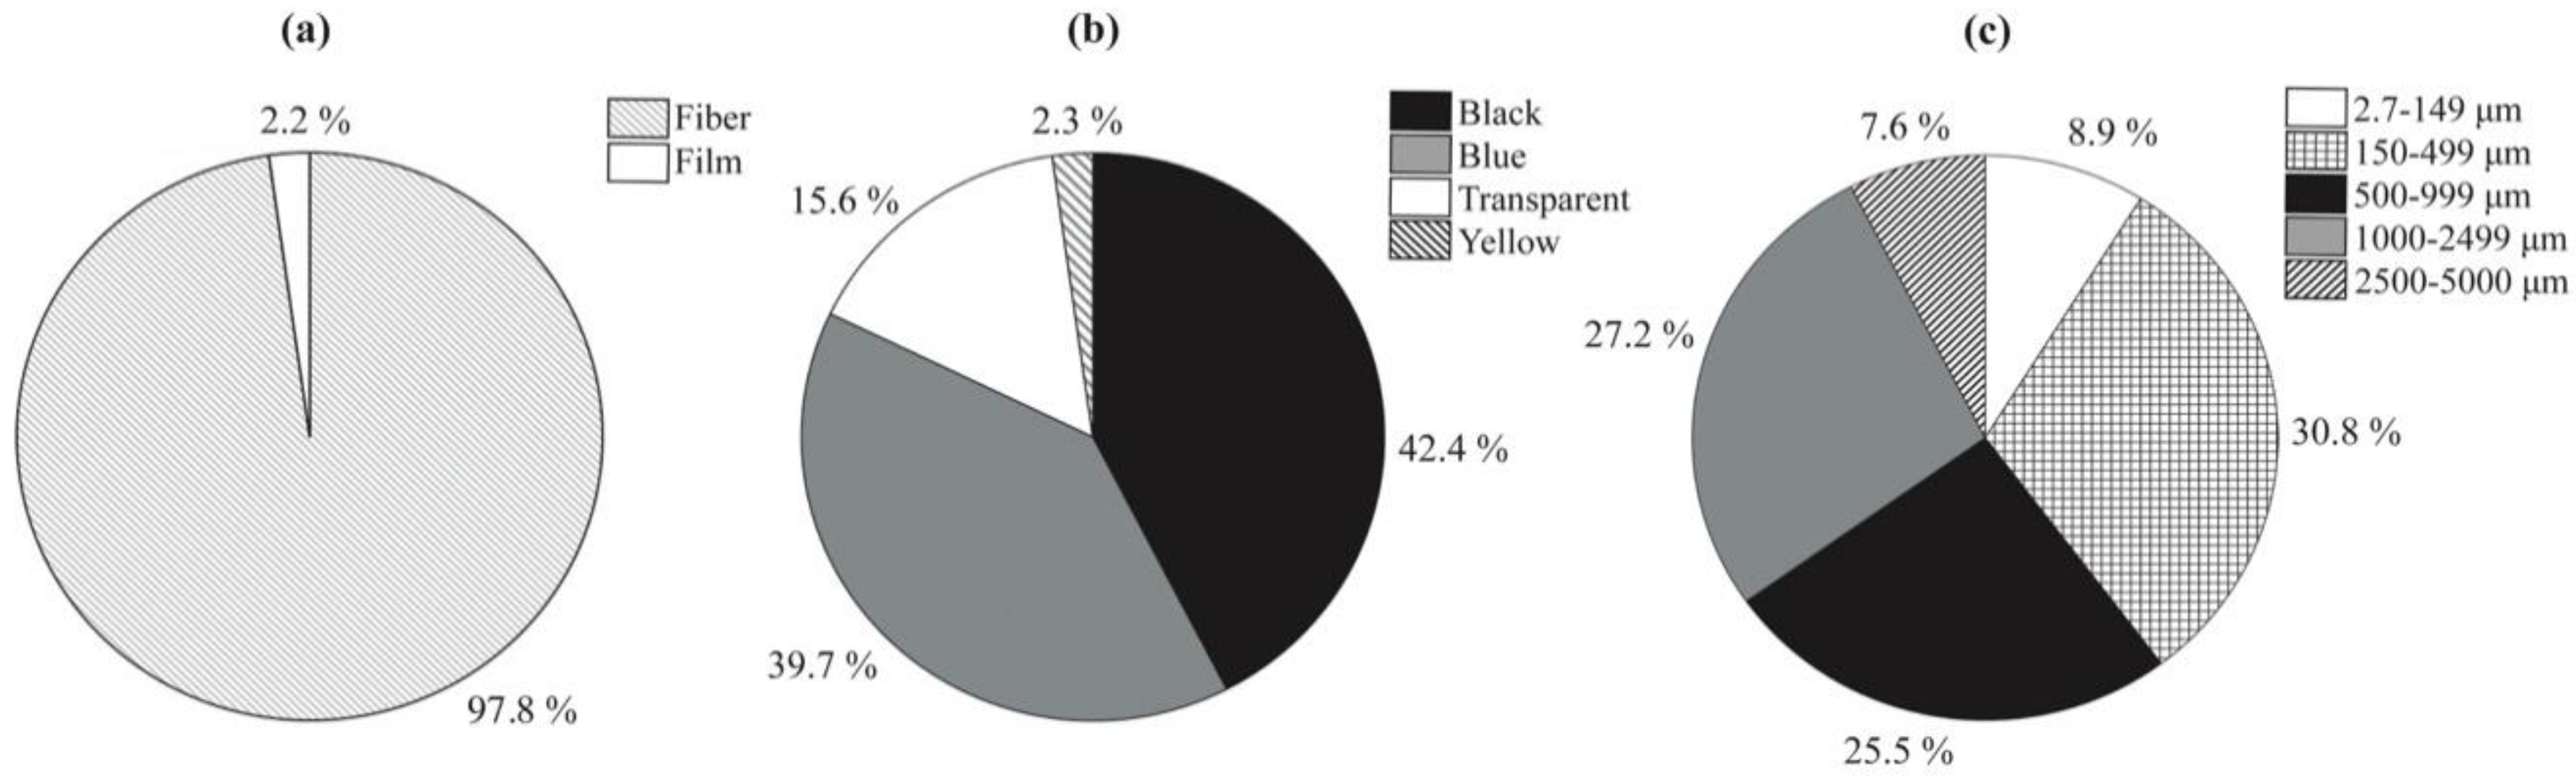
3.2. Abundances and Morphological Characteristics of Microplastics
4. Discussion
5. Conclusions
Supplementary Materials
Author Contributions
Funding
Acknowledgments
Conflicts of Interest
References
- PlasticsEurope. Plastics–the Facts 2019: An Analysis of European Plastics Production, Demand and Waste Data; Plastics Europe Market Research Group: Brussels, Belgium, 2019. [Google Scholar]
- Arthur, C.; Baker, J.; Bamford, H. Workshop Summary. In Proceedings of the International Research Workshop on the Occurrence, Effects, and Fate of Microplastic Marine Debris, Tacoma, WA, USA, 9–11 September 2008. [Google Scholar]
- Mani, T.; Hauk, A.; Walter, U.; Burkhardt-Holm, P. Microplastics profile along the Rhine River. Sci. Rep. 2015, 5, 1–7. [Google Scholar] [CrossRef] [PubMed]
- Lin, L.; Zuo, L.-Z.; Peng, J.-P.; Cai, L.-Q.; Fok, L.; Yan, Y.; Li, H.-X.; Xu, X.-R. Occurrence and distribution of microplastics in an urban river: A case study in the Pearl River along Guangzhou City, China. Sci. Total Environ. 2018, 644, 375–381. [Google Scholar] [CrossRef] [PubMed]
- Zhao, S.; Zhu, L.; Li, D. Microplastic in three urban estuaries, China. Environ. Pollut. 2015, 206, 597–604. [Google Scholar] [CrossRef] [PubMed]
- Yonkos, L.T.; Friedel, E.A.; Perez-Reyes, A.C.; Ghosal, S.; Arthur, C.D. Microplastics in four estuarine rivers in the Chesapeake Bay, USA. Environ. Sci. Technol. 2014, 48, 14195–14202. [Google Scholar] [CrossRef] [PubMed]
- Karthik, R.; Robin, R.; Purvaja, R.; Ganguly, D.; Anandavelu, I.; Raghuraman, R.; Hariharan, G.; Ramakrishna, A.; Ramesh, R. Microplastics along the beaches of southeast coast of India. Sci. Total Environ. 2018, 645, 1388–1399. [Google Scholar] [CrossRef]
- Lee, J.; Lee, J.S.; Jang, Y.C.; Hong, S.Y.; Shim, W.J.; Song, Y.K.; Hong, S.H.; Jang, M.; Han, G.M.; Kang, D. Distribution and size relationships of plastic marine debris on beaches in South Korea. Arch. Environ. Contam. Toxicol. 2015, 69, 288–298. [Google Scholar] [CrossRef]
- Avio, C.G.; Gorbi, S.; Regoli, F. Plastics and microplastics in the oceans: From emerging pollutants to emerged threat. Mar. Environ. Res. 2017, 128, 2–11. [Google Scholar] [CrossRef]
- Isobe, A.; Uchida, K.; Tokai, T.; Iwasaki, S. East Asian seas: A hot spot of pelagic microplastics. Mar. Pollut. Bull. 2015, 101, 618–623. [Google Scholar] [CrossRef]
- Desforges, J.-P.W.; Galbraith, M.; Ross, P.S. Ingestion of microplastics by zooplankton in the Northeast Pacific Ocean. Arch. Environ. Contam. Toxicol. 2015, 69, 320–330. [Google Scholar] [CrossRef]
- Van Cauwenberghe, L.; Janssen, C.R. Microplastics in bivalves cultured for human consumption. Environ. Pollut. 2014, 193, 65–70. [Google Scholar] [CrossRef]
- Lusher, A.; Mchugh, M.; Thompson, R. Occurrence of microplastics in the gastrointestinal tract of pelagic and demersal fish from the English Channel. Mar. Pollut. Bull. 2013, 67, 94–99. [Google Scholar] [CrossRef] [PubMed]
- Farrell, P.; Nelson, K. Trophic level transfer of microplastic: Mytilus edulis (L.) to Carcinus maenas (L.). Environ. Pollut. 2013, 177, 1–3. [Google Scholar] [CrossRef] [PubMed]
- Santana, M.; Moreira, F.; Turra, A. Trophic transference of microplastics under a low exposure scenario: Insights on the likelihood of particle cascading along marine food-webs. Mar. Pollut. Bull. 2017, 121, 154–159. [Google Scholar] [CrossRef] [PubMed]
- Setälä, O.; Fleming-Lehtinen, V.; Lehtiniemi, M. Ingestion and transfer of microplastics in the planktonic food web. Environ. Pollut. 2014, 185, 77–83. [Google Scholar] [CrossRef] [PubMed]
- Wright, S.L.; Thompson, R.C.; Galloway, T.S. The physical impacts of microplastics on marine organisms: A review. Environ. Pollut. 2013, 178, 483–492. [Google Scholar] [CrossRef]
- Cole, M.; Lindeque, P.; Halsband, C.; Galloway, T.S. Microplastics as contaminants in the marine environment: A review. Mar. Pollut. Bull. 2011, 62, 2588–2597. [Google Scholar] [CrossRef]
- World Health Organization. Microplastics in Drinking-Water; WHO: Geneva, Switzerland, 2019. [Google Scholar]
- Yang, D.; Shi, H.; Li, L.; Li, J.; Jabeen, K.; Kolandhasamy, P. Microplastic pollution in table salts from China. Environ. Sci. Technol. 2015, 49, 13622–13627. [Google Scholar] [CrossRef]
- Liebezeit, G.; Liebezeit, E. Synthetic particles as contaminants in German beers. Food Addit. Contam. Part A 2014, 31, 1574–1578. [Google Scholar] [CrossRef]
- Liebezeit, G.; Liebezeit, E. Non-pollen particulates in honey and sugar. Food Addit. Contam. Part A 2013, 30, 2136–2140. [Google Scholar] [CrossRef]
- Pivokonsky, M.; Cermakova, L.; Novotna, K.; Peer, P.; Cajthaml, T.; Janda, V. Occurrence of microplastics in raw and treated drinking water. Sci. Total Environ. 2018, 643, 1644–1651. [Google Scholar] [CrossRef]
- Mason, S.A.; Welch, V.G.; Neratko, J. Synthetic polymer contamination in bottled water. Front. Chem. 2018, 6, 1–11. [Google Scholar] [CrossRef] [PubMed]
- Kosuth, M.; Mason, S.A.; Wattenberg, E.V. Anthropogenic contamination of tap water, beer, and sea salt. PLoS ONE 2018, 13, 1–18. [Google Scholar] [CrossRef] [PubMed]
- Water Supplies Department of HKSAR. Hong Kong: The Facts-Water Supplies. Available online: https://www.wsd.gov.hk/en/publications-and-statistics/pr-publications/the-facts/index.html (accessed on 30 November 2019).
- Water Supplies Department of HKSAR Quality Water. Water: Learn & Conserve, Teaching Kit for Liberal Studies; Water Supplies Department: Hong Kong, China, 2011. [Google Scholar]
- Bellas, J.; Martínez-Armental, J.; Martínez-Cámara, A.; Besada, V.; Martínez-Gómez, C. Ingestion of microplastics by demersal fish from the Spanish Atlantic and Mediterranean Coasts. Mar. Pollut. Bull. 2016, 109, 55–60. [Google Scholar] [CrossRef] [PubMed]
- Cheung, P.K.; Cheung LT, O.; Fok, L. Seasonal variation in the abundance of marine plastic debris in the estuary of a subtropical macro-scale drainage basin in South China. Sci. Total Environ. 2016, 562, 658–665. [Google Scholar] [CrossRef]
- Fok, L.; Cheung, P.K. Hong Kong at the Pearl River Estuary: A hotspot of microplastic pollution. Mar. Pollut. Bull. 2015, 99, 112–118. [Google Scholar] [CrossRef]
- Cheung, P.K.; Fok, L.; Hung, P.L.; Cheung, L.T. Spatio-temporal comparison of neustonic microplastic density in Hong Kong waters under the influence of the Pearl River Estuary. Sci. Total Environ. 2018, 628, 731–739. [Google Scholar] [CrossRef]
- Cheung LT, O.; Lui, C.Y.; Fok, L. Microplastic contamination of wild and captive flathead grey mullet (mugil cephalus). Int. J. Environ. Res. Public Health 2018, 15, 597. [Google Scholar] [CrossRef]
- Xu, X.; Wong, C.; Tam, N.F.; Lo, H.-S.; Cheung, S.-G. Microplastics in invertebrates on soft shores in Hong Kong: Influence of habitat, taxa and feeding mode. Sci. Total Environ. 2020, 715, 136999. [Google Scholar] [CrossRef]
- Orb. Water: Tap, Bottled & Microplastics. Available online: https://orbmedia.org/blog/water-tap-bottled-microplastics (accessed on 2 April 2020).
- Mintenig, S.; Löder, M.; Primpke, S.; Gerdts, G. Low numbers of microplastics detected in drinking water from ground water sources. Sci. Total Environ. 2019, 648, 631–635. [Google Scholar] [CrossRef]
- Ding, J.; Jiang, Y.; Liu, Q.; Hou, Z.; Liao, J.; Fu, L.; Peng, Q. Influences of the land use pattern on water quality in low-order streams of the Dongjiang River basin, China: A multi-scale analysis. Sci. Total Environ. 2016, 551, 205–216. [Google Scholar] [CrossRef]
- Fan, Y.; Zheng, K.; Zhu, Z.; Chen, G.; Peng, X. Distribution, sedimentary record, and persistence of microplastics in the Pearl River catchment, China. Environ. Pollut. 2019, 251, 862–870. [Google Scholar] [CrossRef] [PubMed]
- Cai, L.; Wang, J.; Peng, J.; Tan, Z.; Zhan, Z.; Tan, X.; Chen, Q. Characteristic of microplastics in the atmospheric fallout from Dongguan city, China: Preliminary research and first evidence. Environ. Sci. Pollut. Res. 2017, 24, 24928–24935. [Google Scholar] [CrossRef] [PubMed]
- Klein, M.; Fischer, E.K. Microplastic abundance in atmospheric deposition within the Metropolitan area of Hamburg, Germany. Sci. Total Environ. 2019, 685, 96–103. [Google Scholar] [CrossRef] [PubMed]
- Hidalgo-Ruz, V.; Gutow, L.; Thompson, R.C.; Thiel, M. Microplastics in the marine environment: A review of the methods used for identification and quantification. Environ. Sci. Technol. 2012, 46, 3060–3075. [Google Scholar] [CrossRef]
- Koelmans, A.A.; Nor NH, M.; Hermsen, E.; Kooi, M.; Mintenig, S.M.; De France, J. Microplastics in freshwaters and drinking water: Critical review and assessment of data quality. Water Res. 2019, 155, 410–422. [Google Scholar] [CrossRef]
- Strand, J.; Feld, L.; Murphy, F.; Mackevica, A.; Hartmann, N.B. Analysis of Microplastic Particles in Danish Drinking Water; Aarhus University, DCE-Danish Centre for Environment and Energy: Aarhus, Denmark, 2018. [Google Scholar]


| Study Area | Water Source | Sample Size | Sampling Method | Filter Pore Size (μm) | Mean Microplastic Abundance (n L−1) | Predominant Particle Size (μm) | Predominant Shape Type | Reference |
|---|---|---|---|---|---|---|---|---|
| Germany | Groundwater | 15 | Sampling at the outlet of a drinking water treatment plant, at a water metre and at a water tap | 0.2 | 0.0007 | In the range of 50–150 | Fragments | Mintenig et al. [35] |
| Demark | Groundwater | 17 | Sampling at a water tap | 0.2 | 0.58 | Not specified | Fibres (82%) | Strand et al. [42] |
| Czech Republic | Surface water a | 36 | Sampling at the outlet of a drinking water treatment plant | 0.2 | 443 (WTP1) | In the range of 1–10 | Fragments | Pivokonsky et al. [23] |
| 338 (WTP2) | ||||||||
| 628 (WTP3) | ||||||||
| Global | Not specified | 159 | Sampling at a water tap | 2.5 | 5.45 | Not specified, fibre lengths ranged from 100–5000 | Fibres (98.3%) | Kosuth, Mason and Wattenberg [25] |
| Hong Kong | Surface water | 110 | Sampling at a filter-unattached water tap | 2.7 | 2.181 | In the range of 150–499 (30.8%) | Fibres (97.8%) | This study |
© 2020 by the authors. Licensee MDPI, Basel, Switzerland. This article is an open access article distributed under the terms and conditions of the Creative Commons Attribution (CC BY) license (http://creativecommons.org/licenses/by/4.0/).
Share and Cite
Lam, T.W.L.; Ho, H.T.; Ma, A.T.H.; Fok, L. Microplastic Contamination of Surface Water-Sourced Tap Water in Hong Kong—A Preliminary Study. Appl. Sci. 2020, 10, 3463. https://doi.org/10.3390/app10103463
Lam TWL, Ho HT, Ma ATH, Fok L. Microplastic Contamination of Surface Water-Sourced Tap Water in Hong Kong—A Preliminary Study. Applied Sciences. 2020; 10(10):3463. https://doi.org/10.3390/app10103463
Chicago/Turabian StyleLam, Theresa Wing Ling, Hiu Tung Ho, Anson T.H. Ma, and Lincoln Fok. 2020. "Microplastic Contamination of Surface Water-Sourced Tap Water in Hong Kong—A Preliminary Study" Applied Sciences 10, no. 10: 3463. https://doi.org/10.3390/app10103463
APA StyleLam, T. W. L., Ho, H. T., Ma, A. T. H., & Fok, L. (2020). Microplastic Contamination of Surface Water-Sourced Tap Water in Hong Kong—A Preliminary Study. Applied Sciences, 10(10), 3463. https://doi.org/10.3390/app10103463