Sewage Sludge Hydrochar: An Option for Removal of Methylene Blue from Wastewater

 ,
,  ,
,  and
and 
Abstract
:Featured Application
Abstract

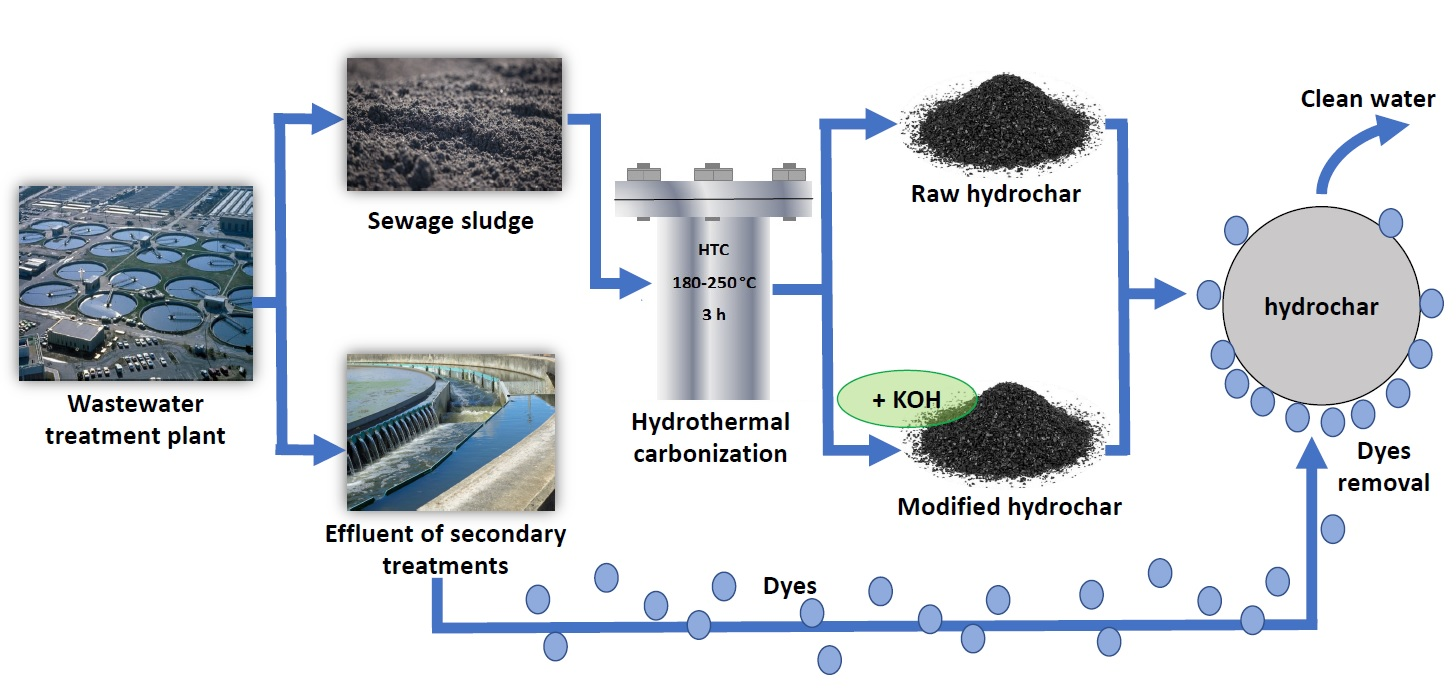
1. Introduction
- preparation of three hydrochars from municipal sewage sludge by performing HTC at 190, 220 and 250 °C with a reaction time of 3 h;
- modification with KOH in order to increase the adsorption capacity of hydrochars;
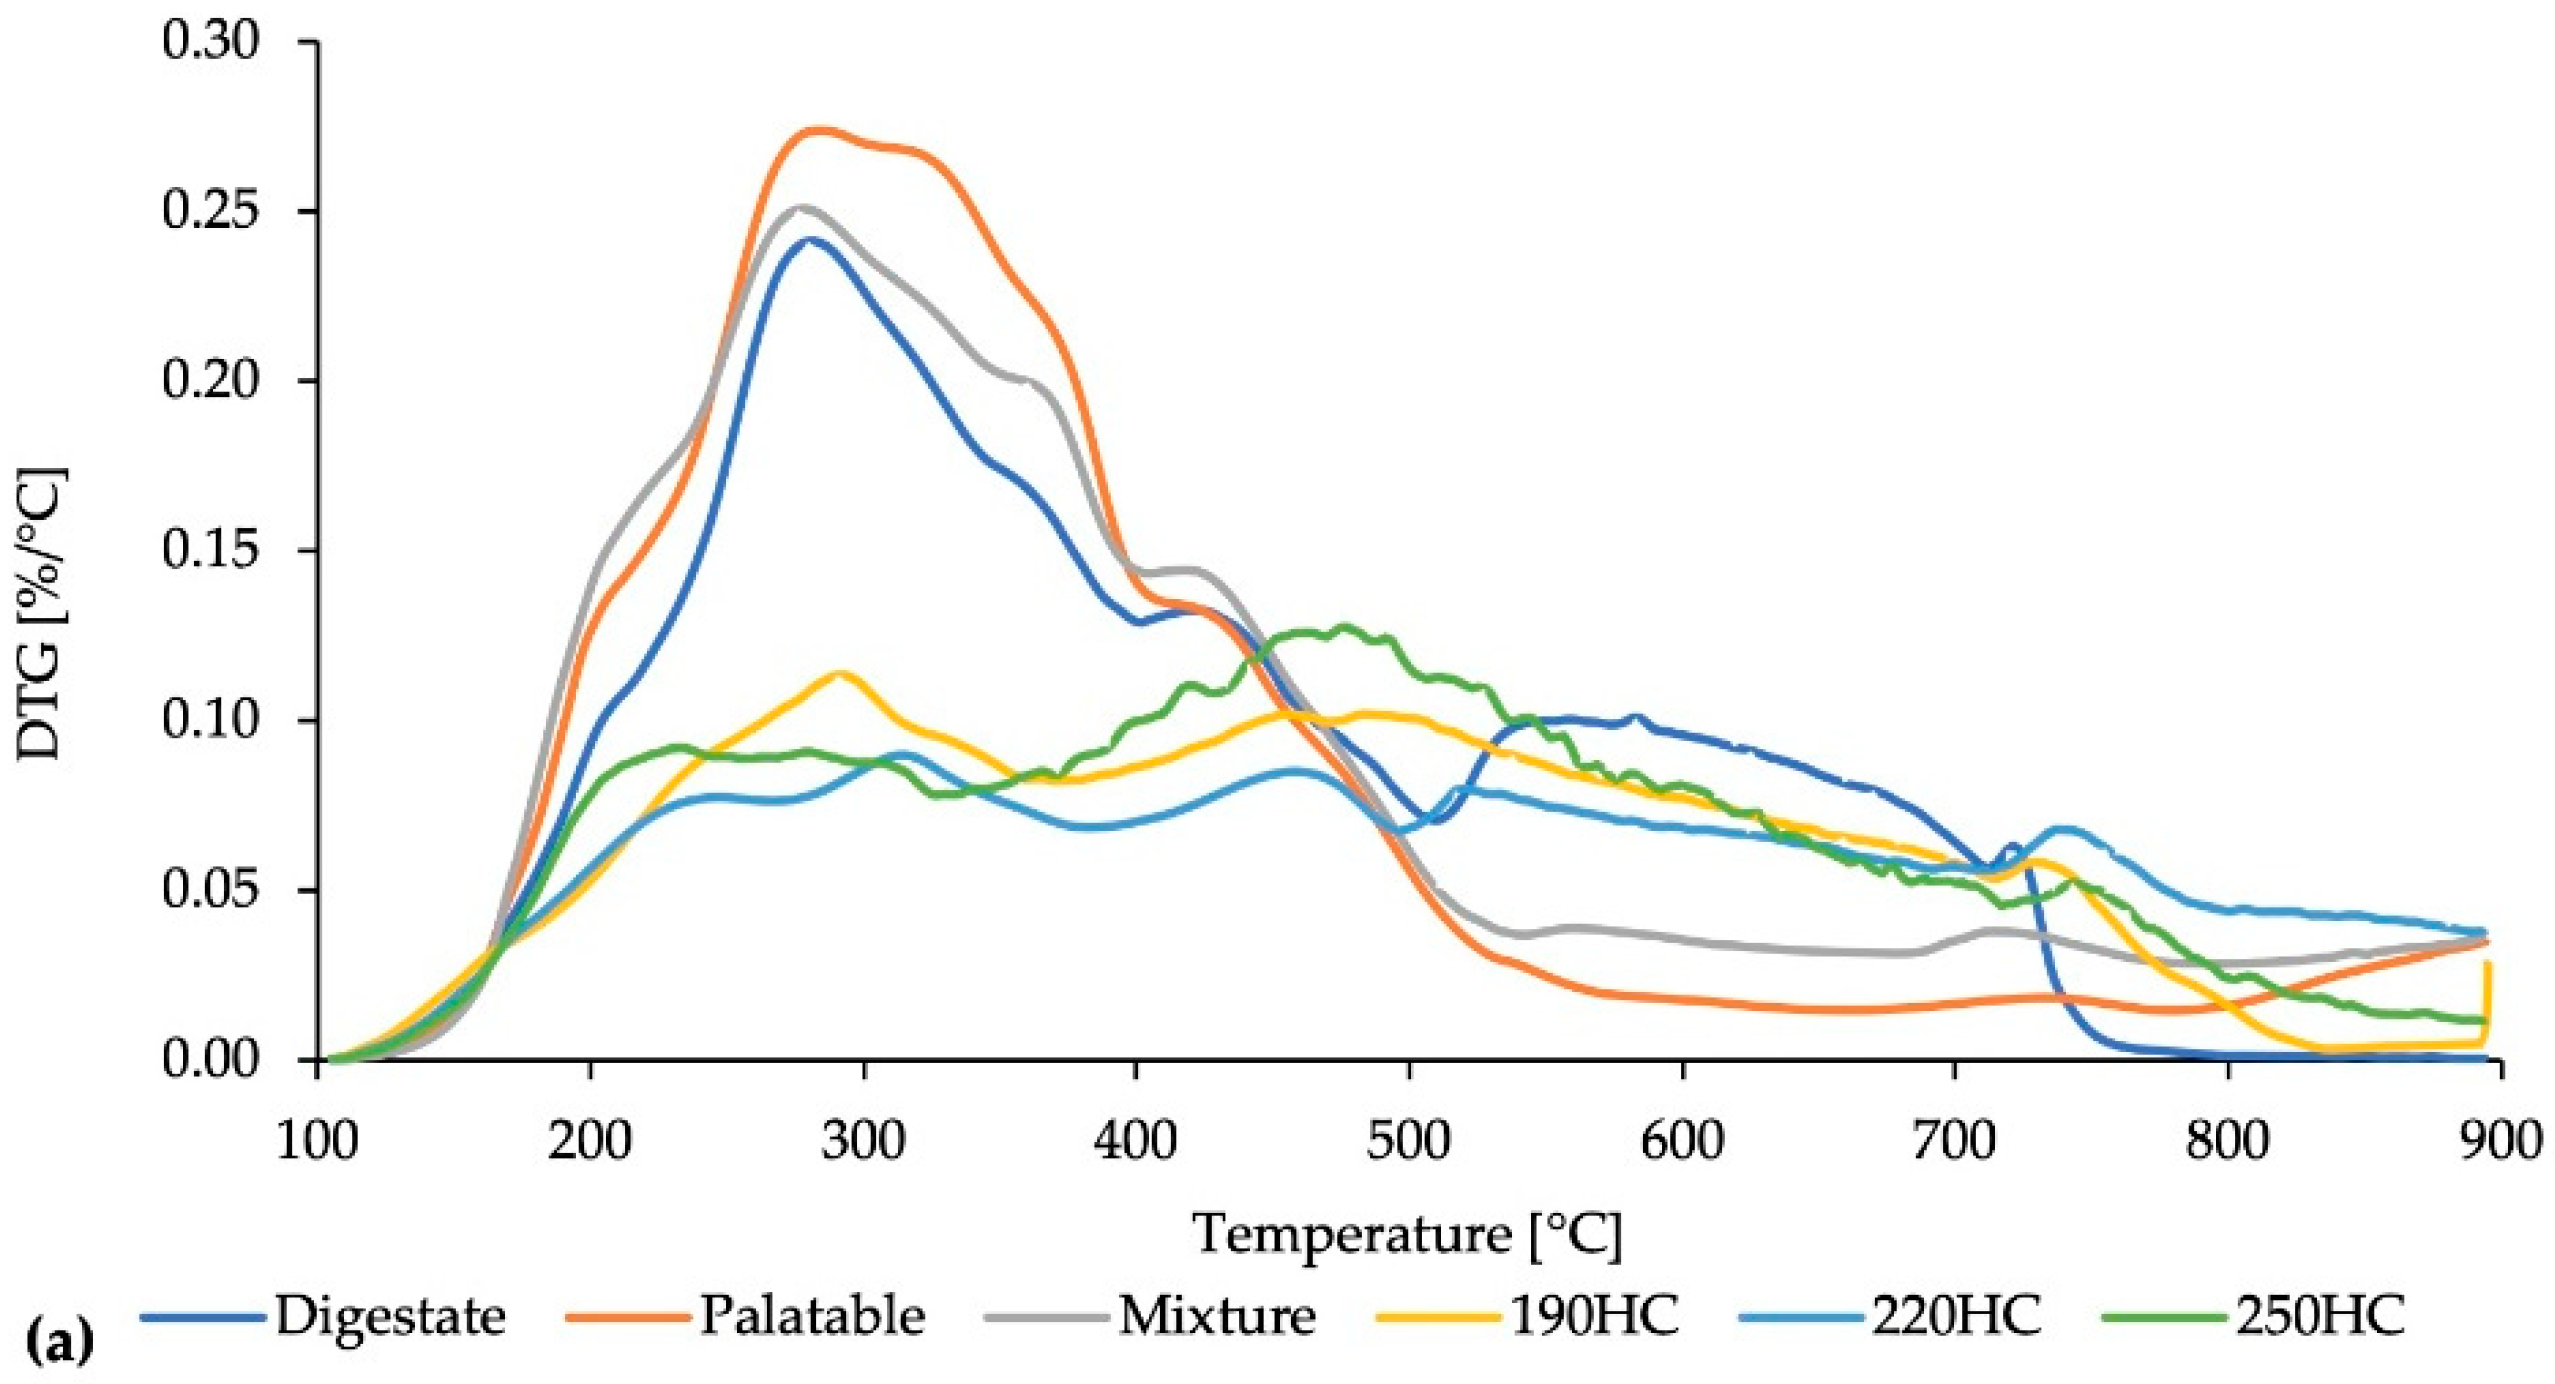
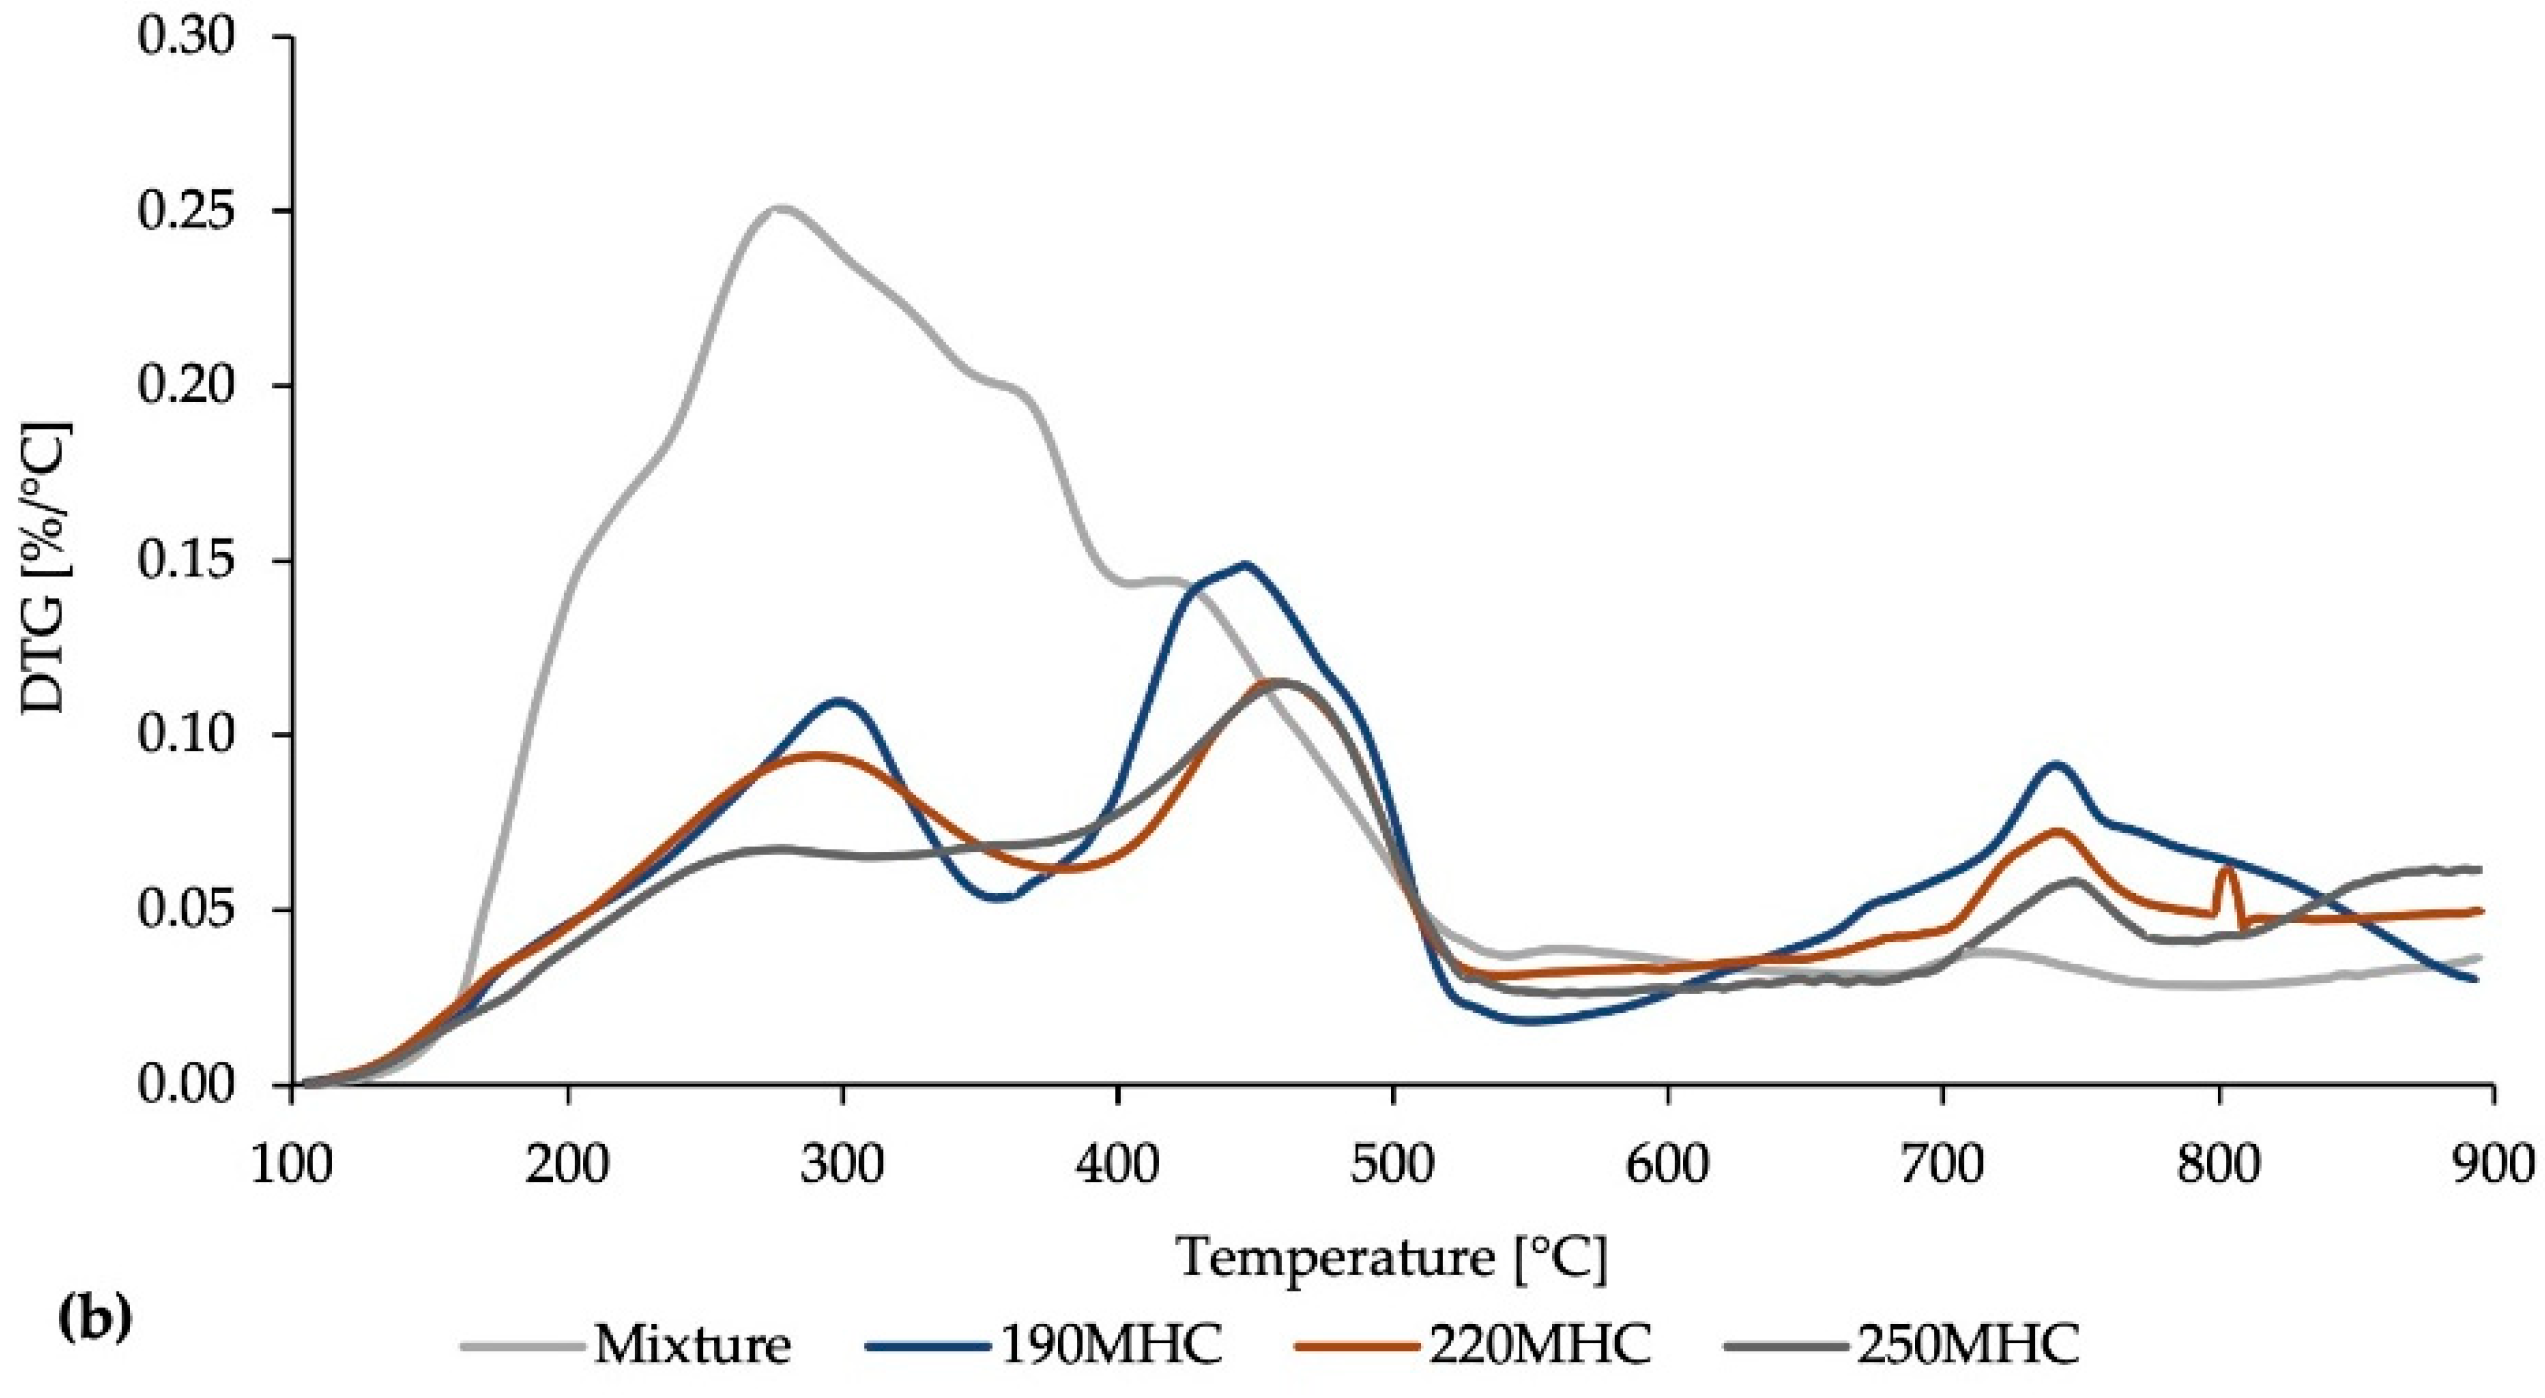
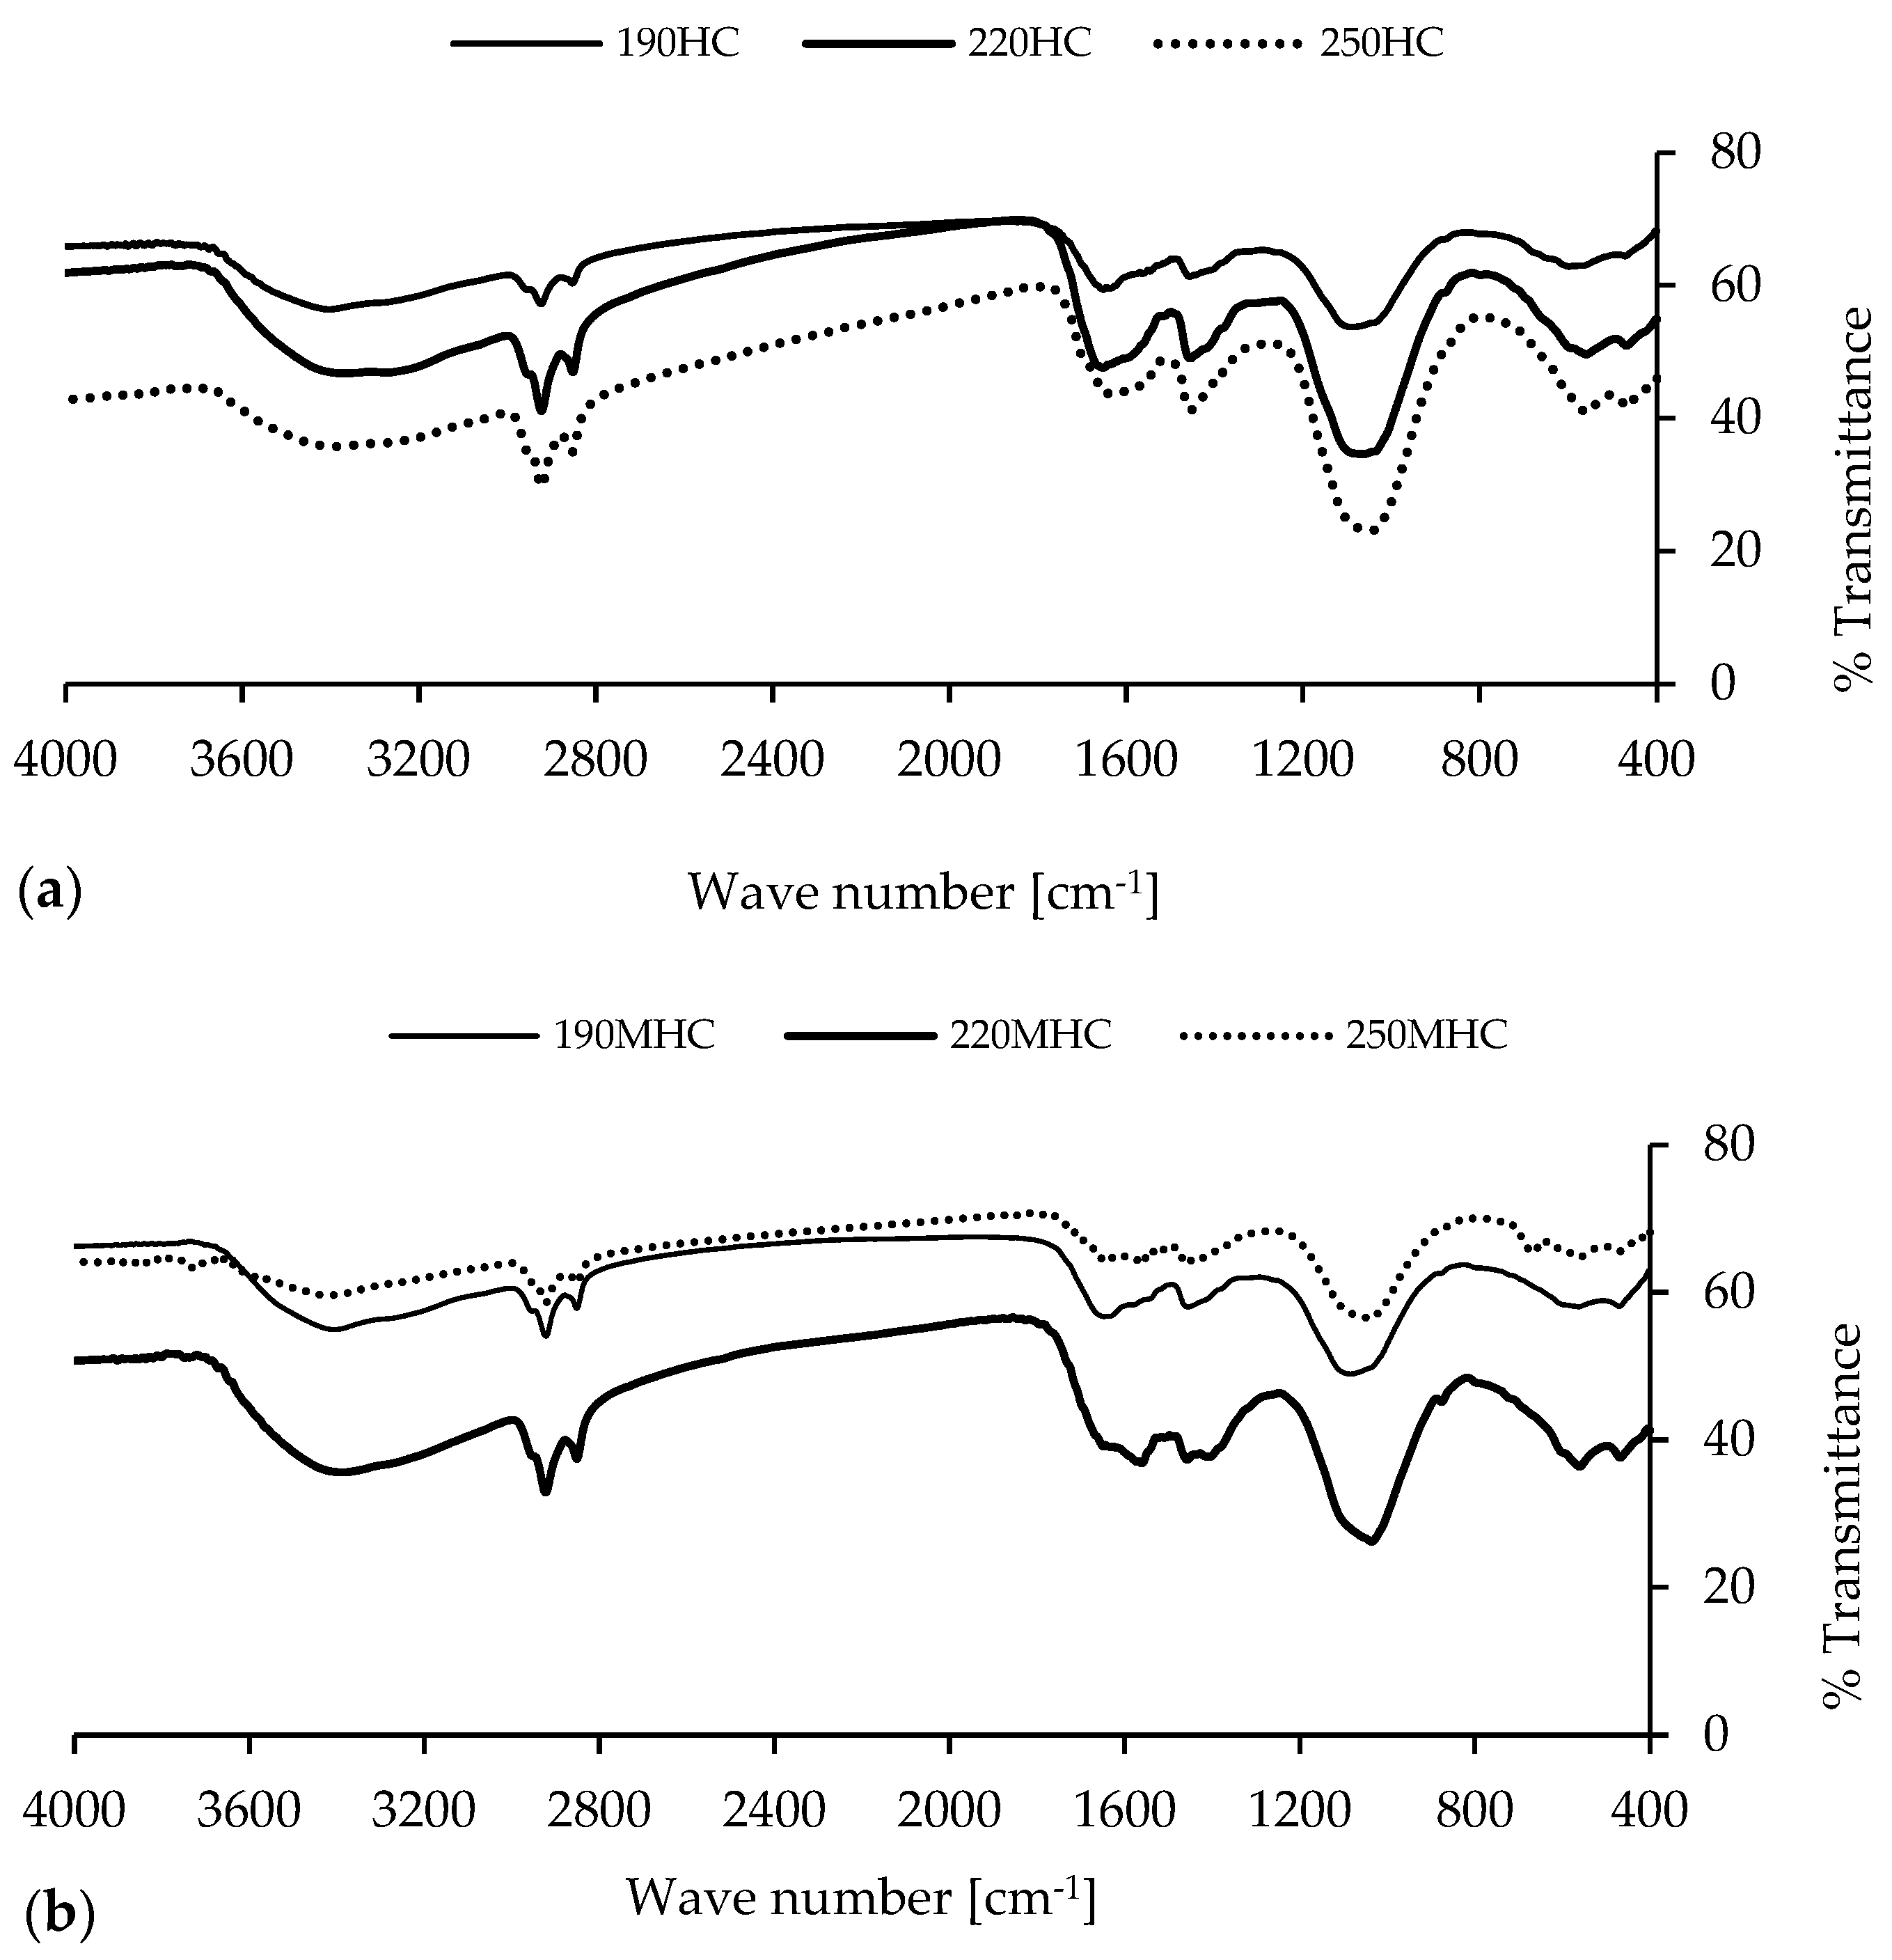
- comparison of the physicochemical properties of raw and modified hydrochars using elemental analysis, thermogravimetry (TGA), nitrogen physisorption analysis, Fourier-transform infrared spectroscopy (FTIR), inductively coupled plasma spectroscopy (ICP) and flow injection mercury system (FIMS);
- comparison of the potential application of raw and modified hydrochars as adsorbents for MB removal by performing batch adsorption studies, namely adsorption isotherms and adsorption kinetics tests.
2. Materials and Methods
2.1. Materials
2.2. Preparation and Modification of Hydrochar
2.3. Materials Characterization
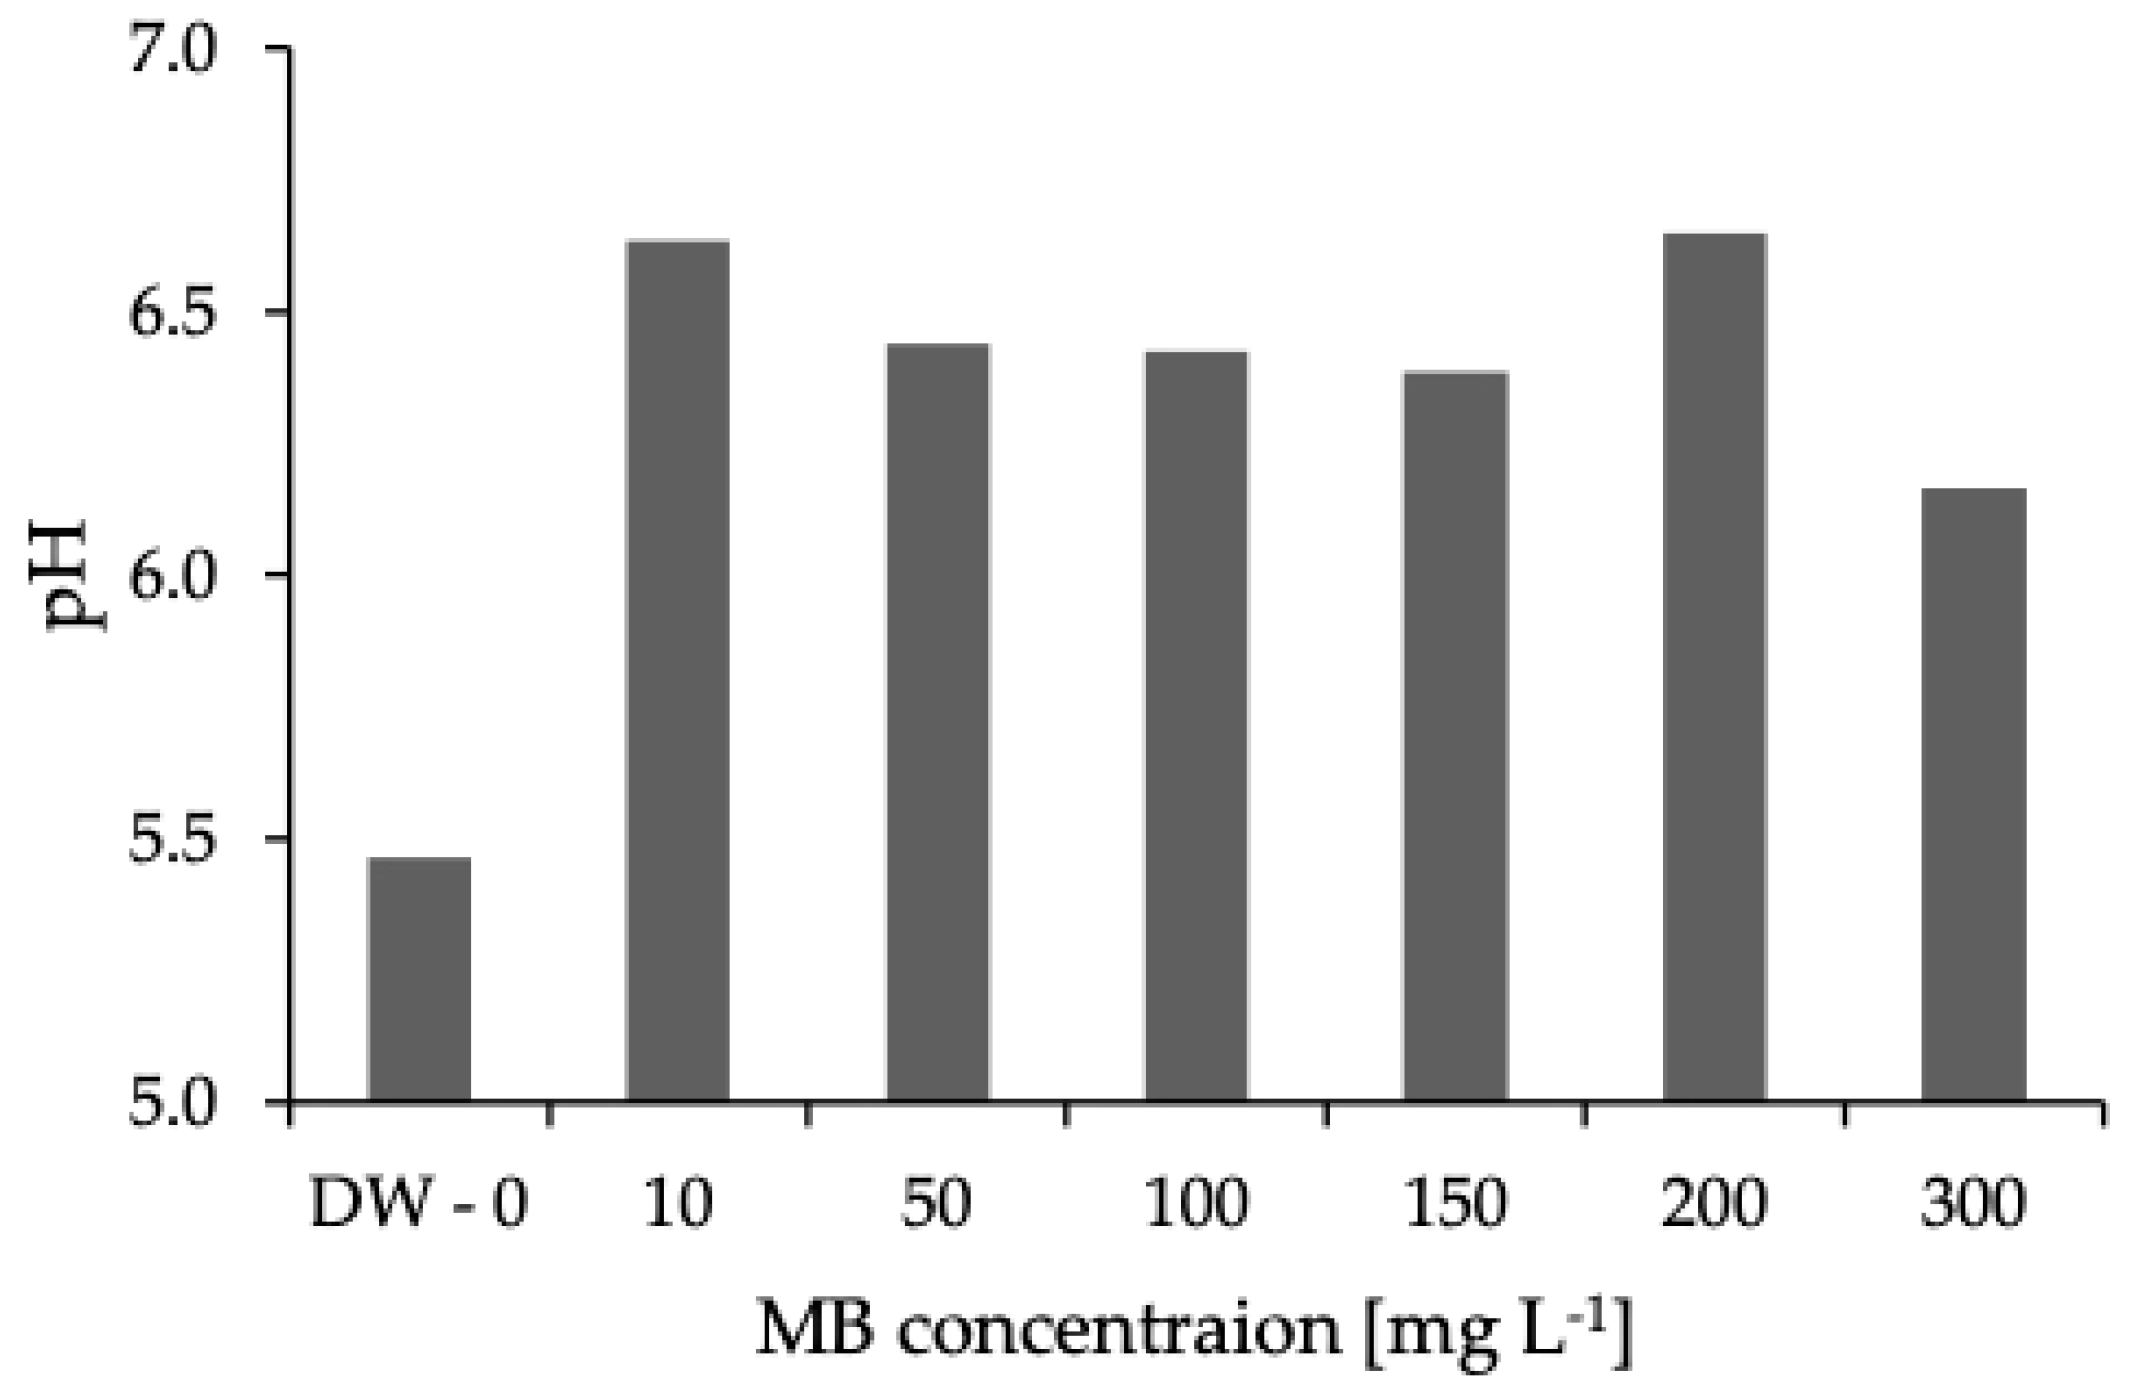
2.4. Batch Adsorption Study
3. Results and Discussion
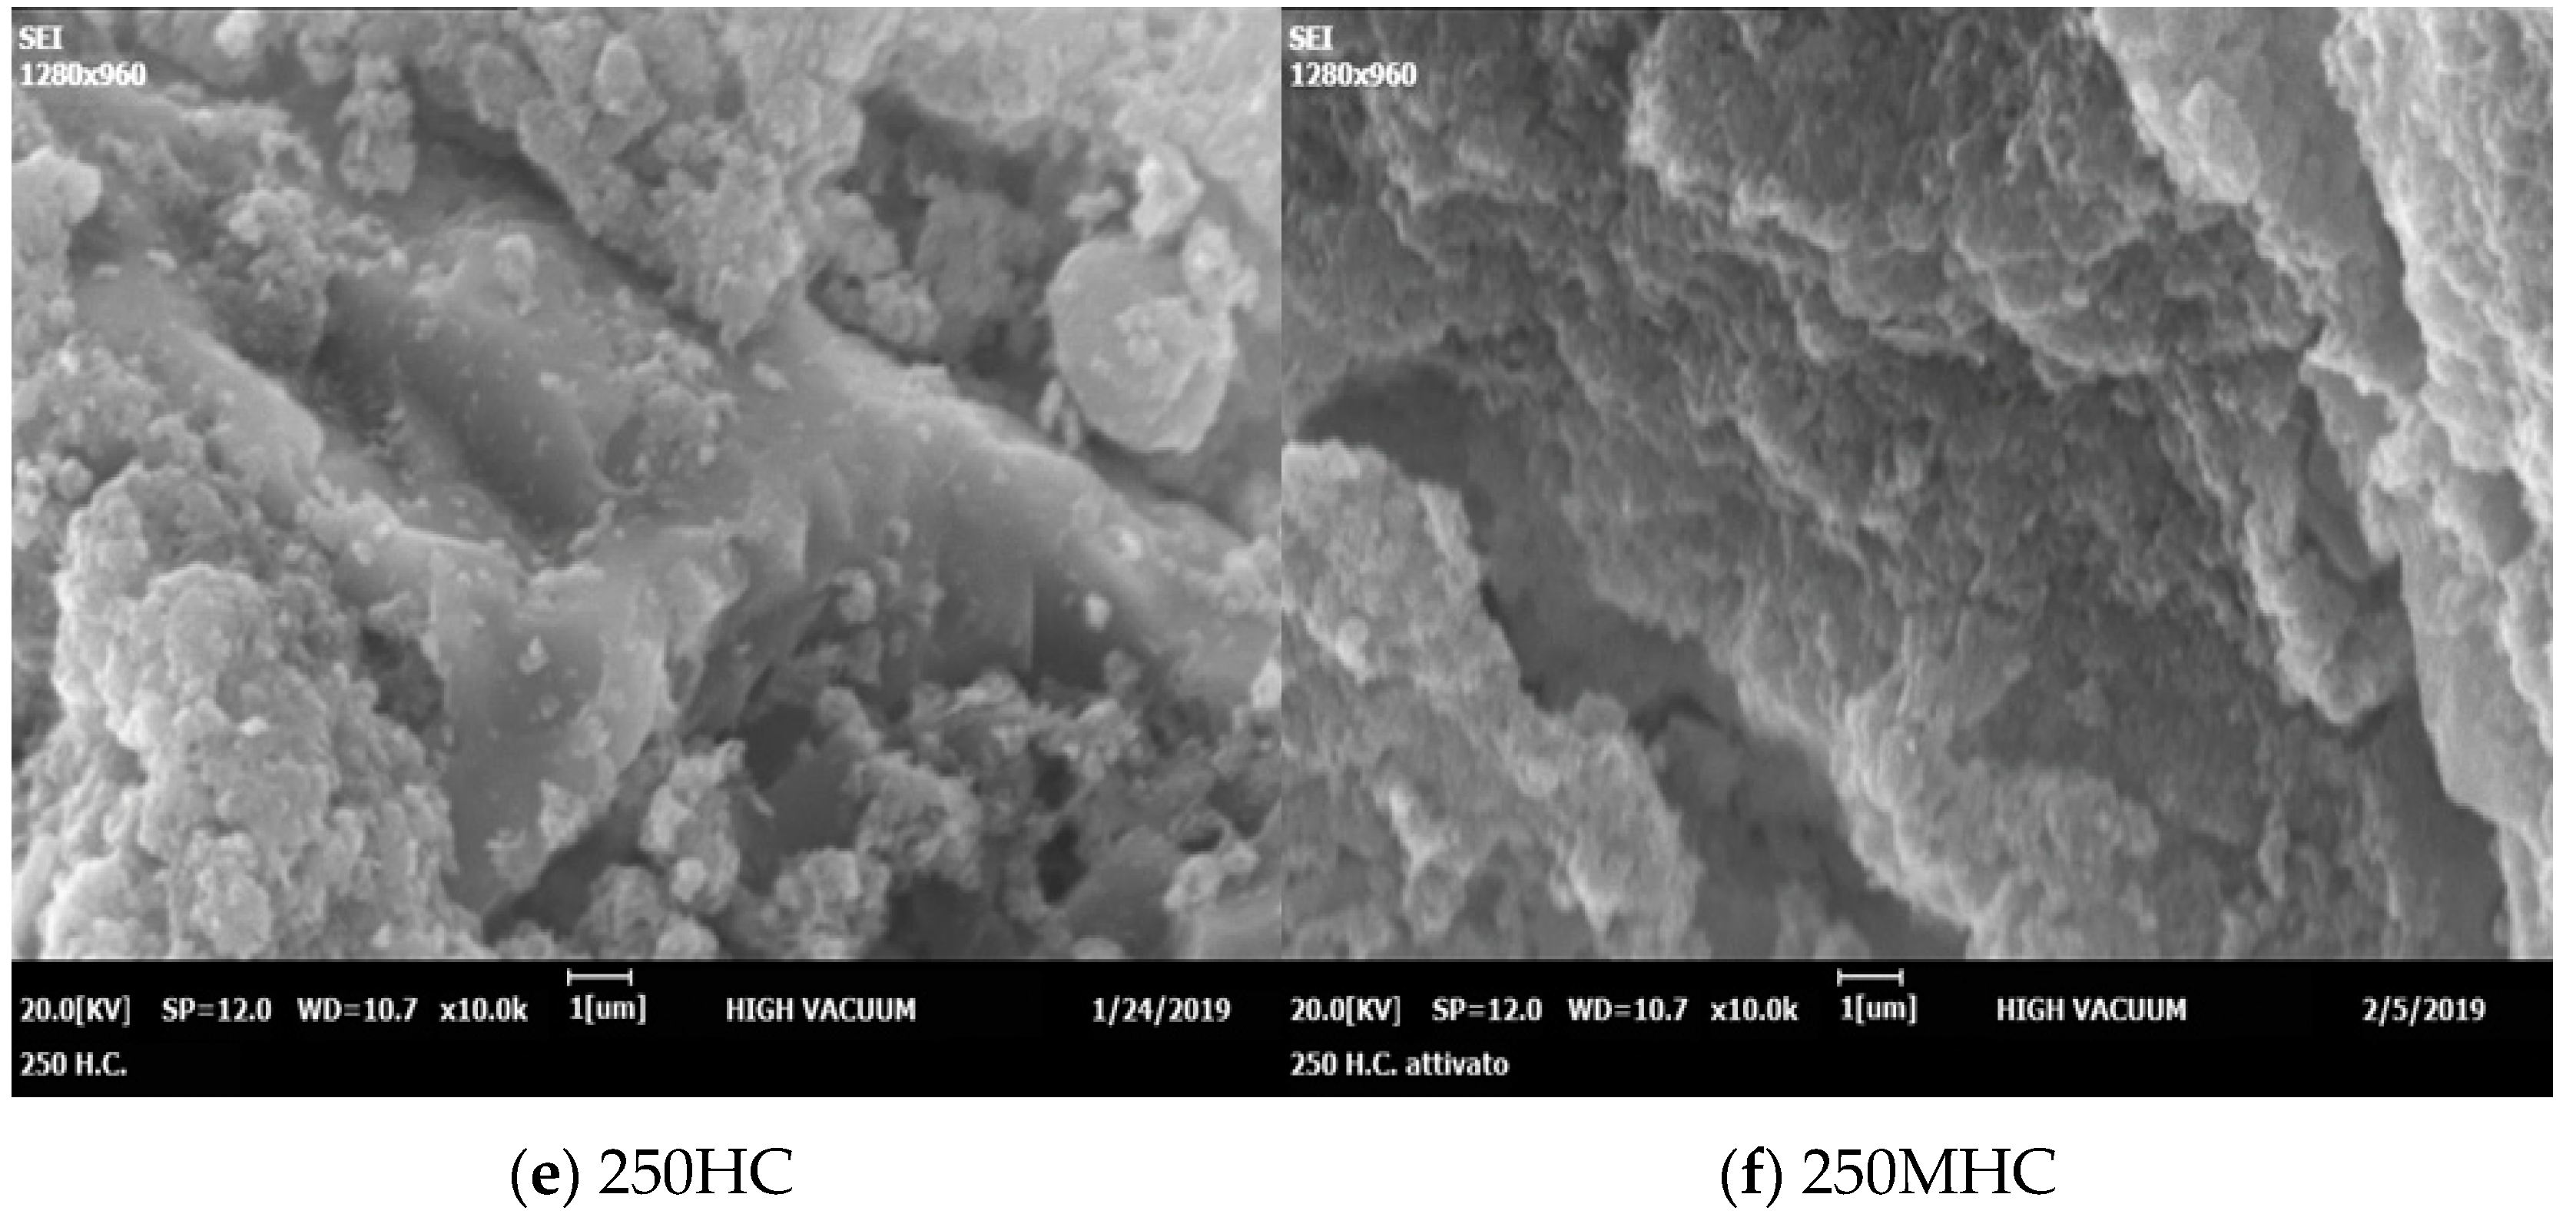
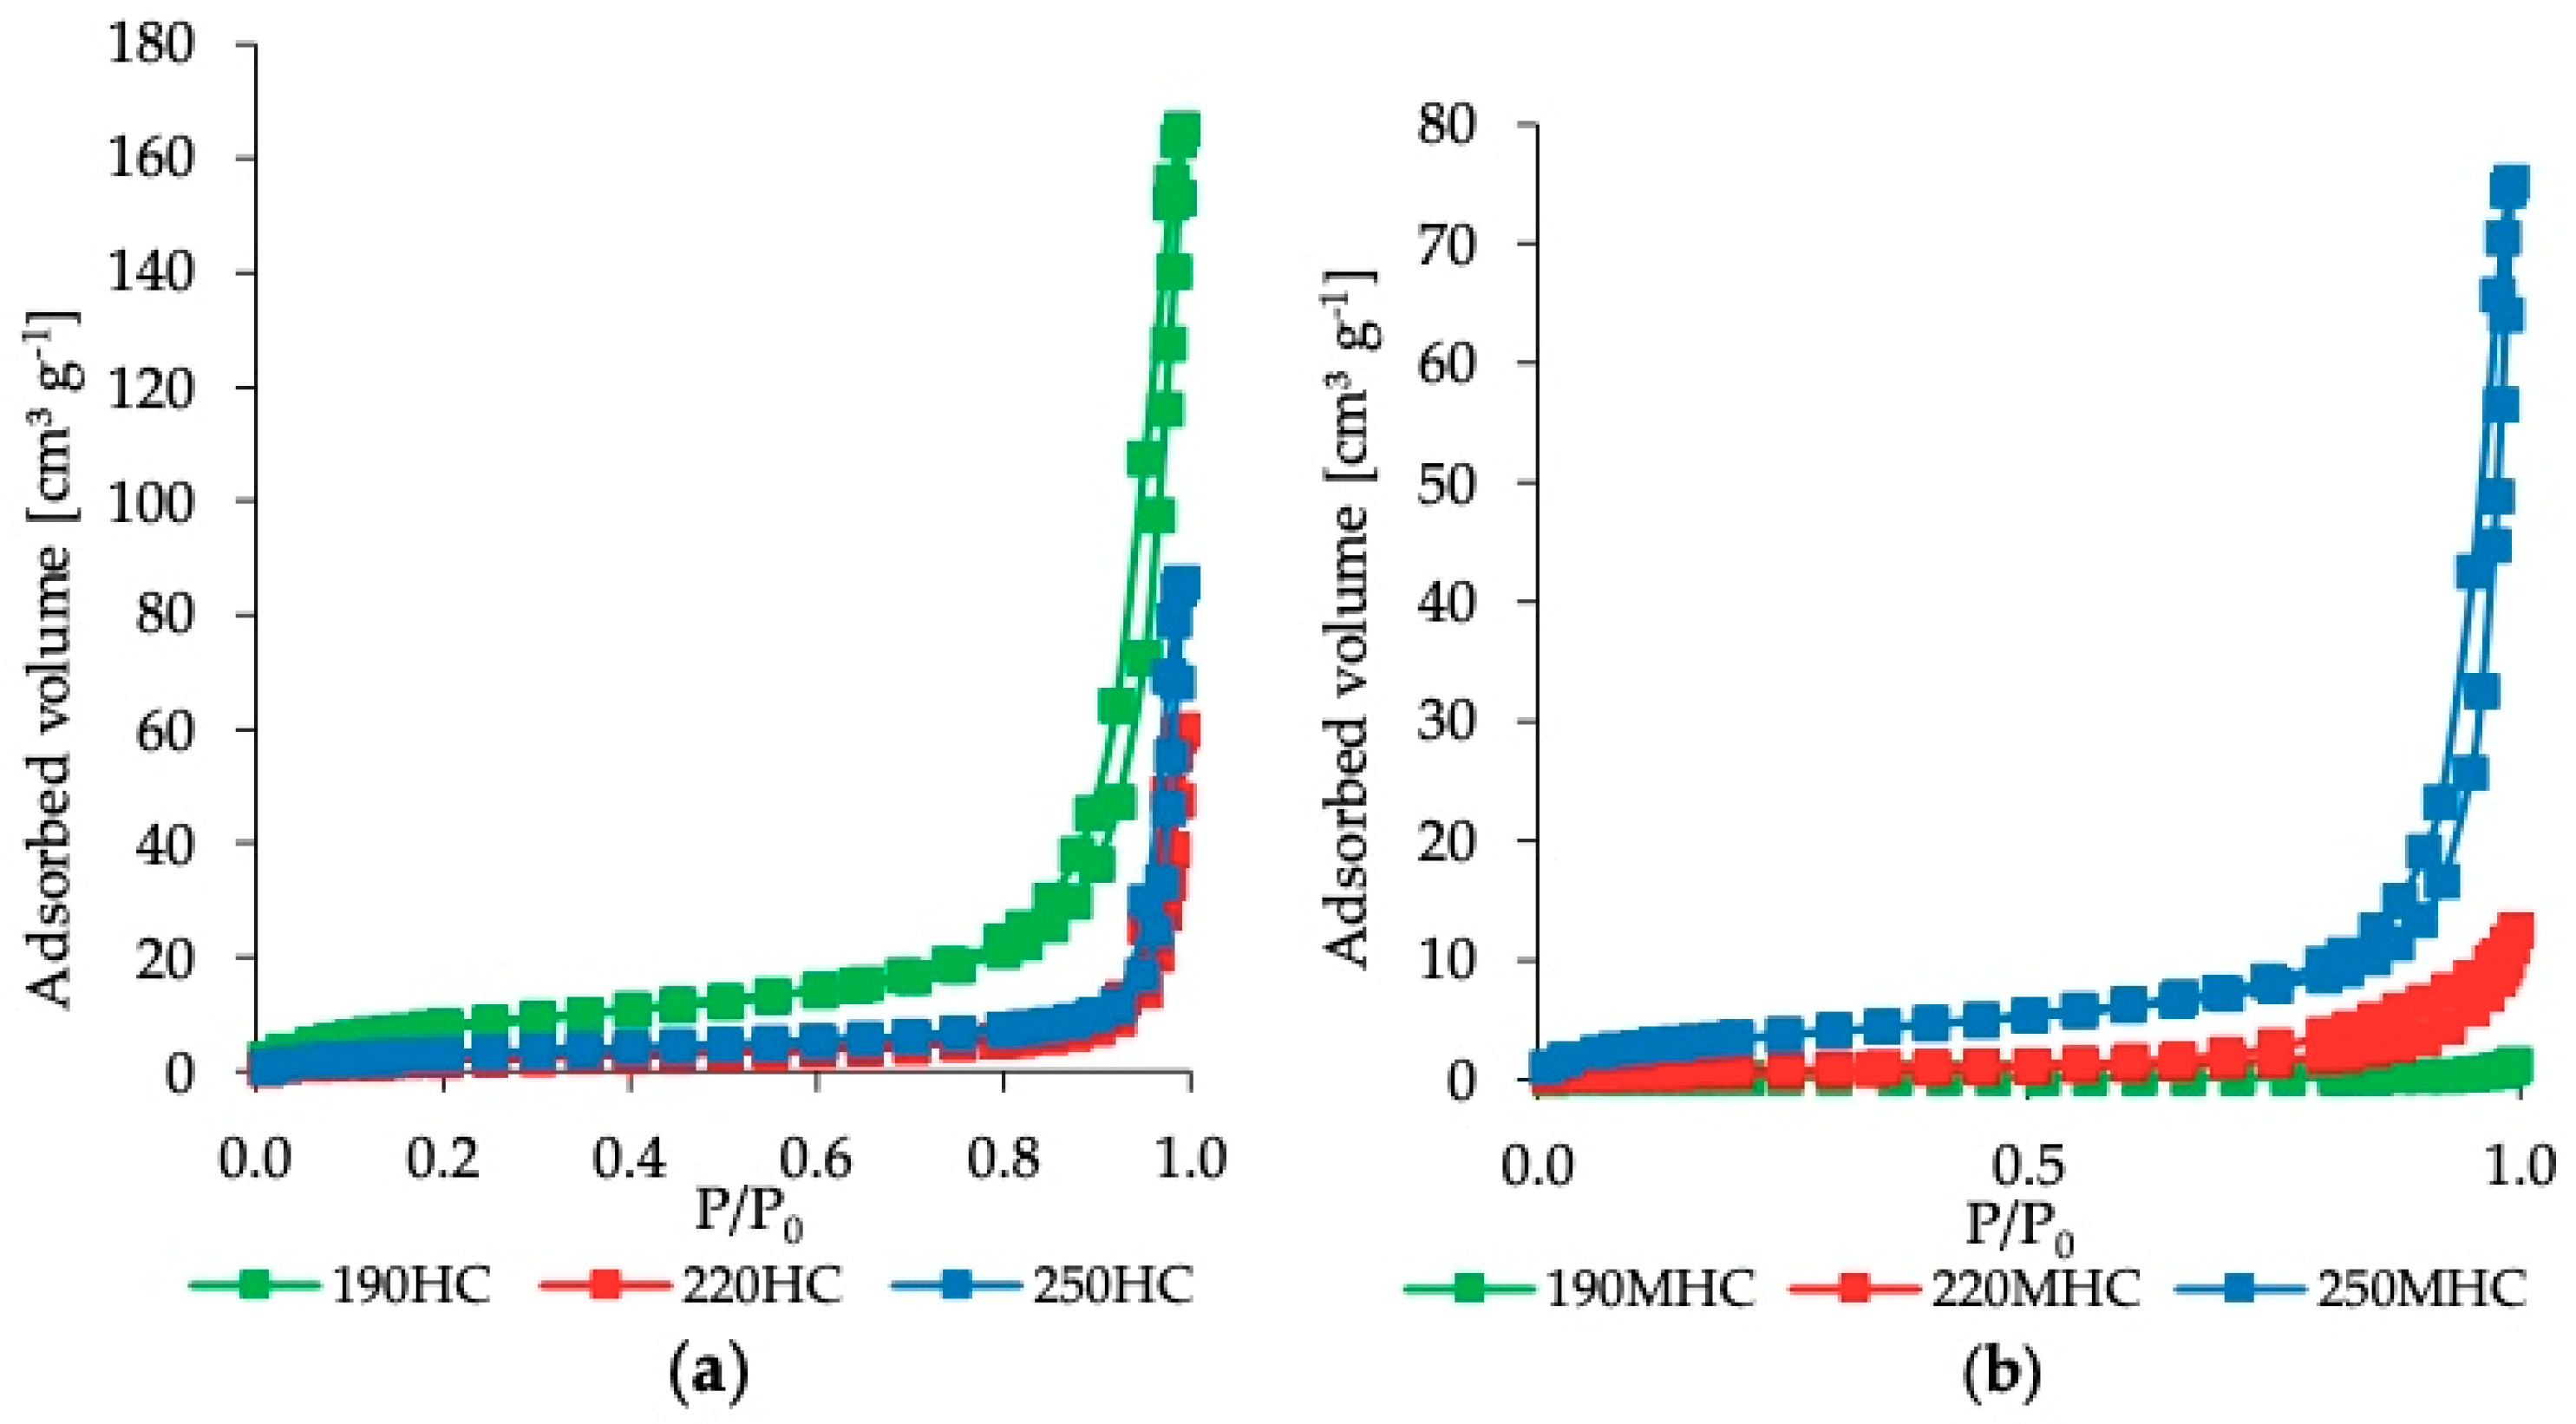
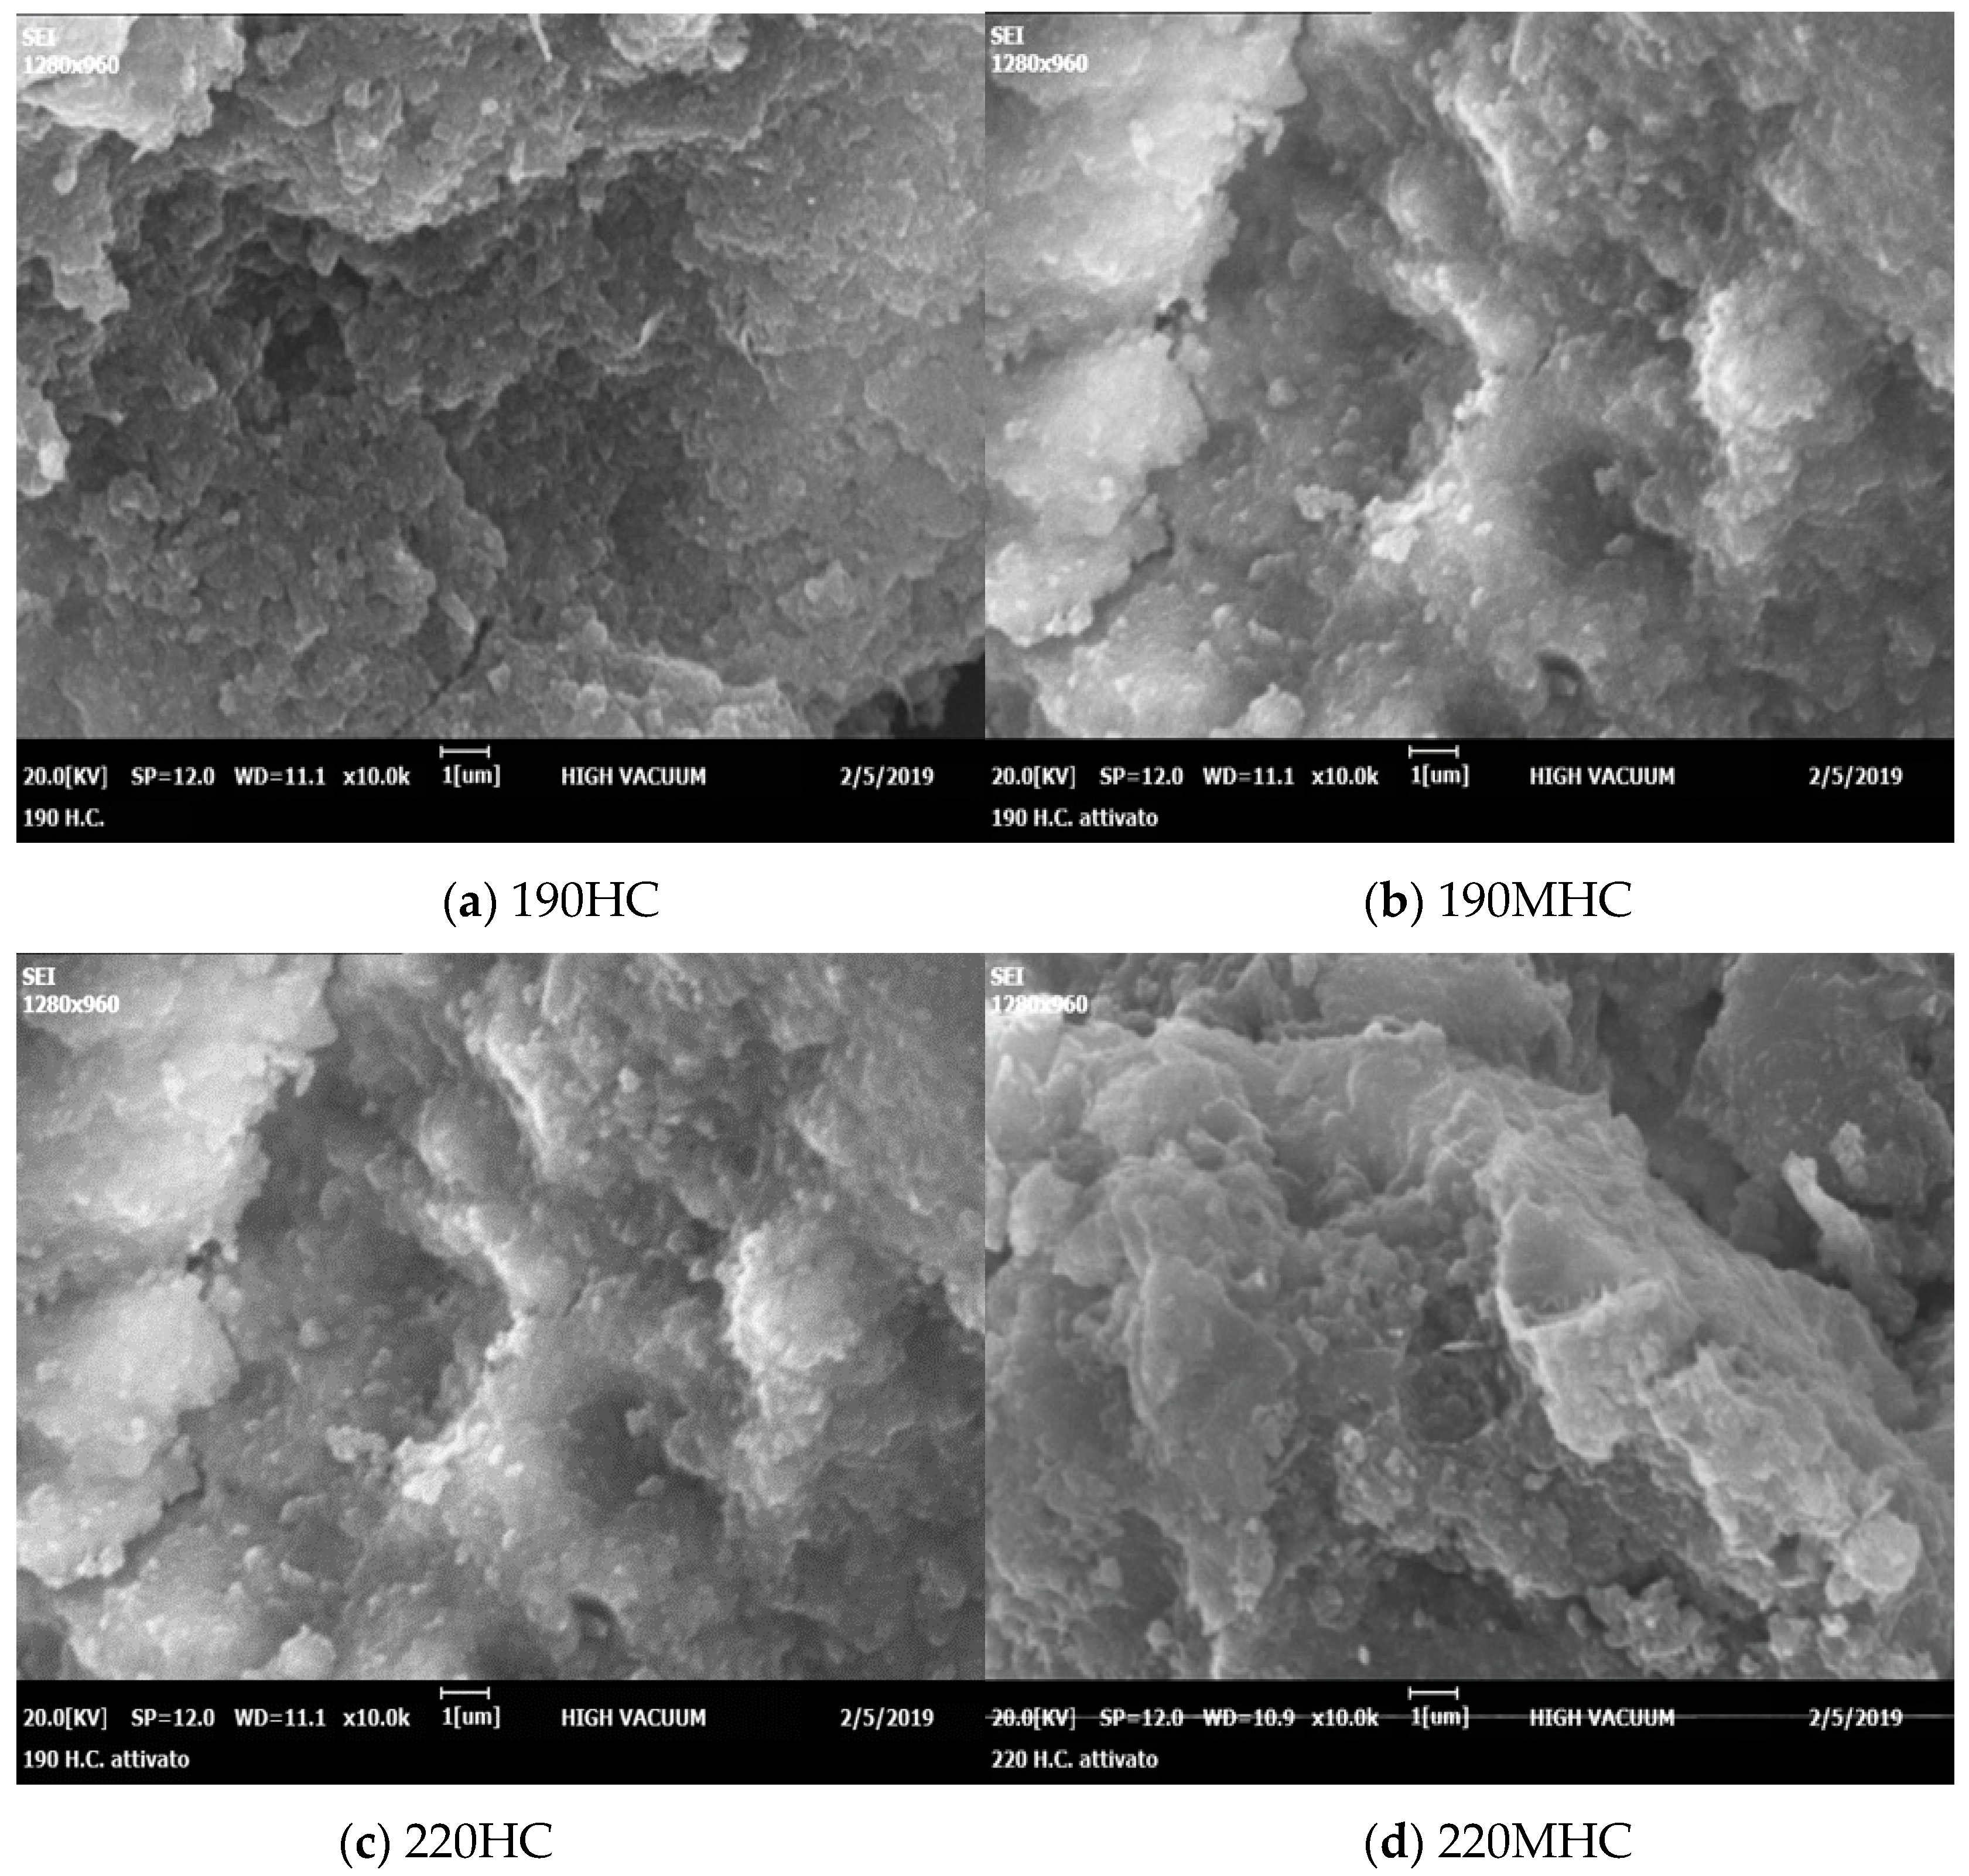
3.1. Characterization
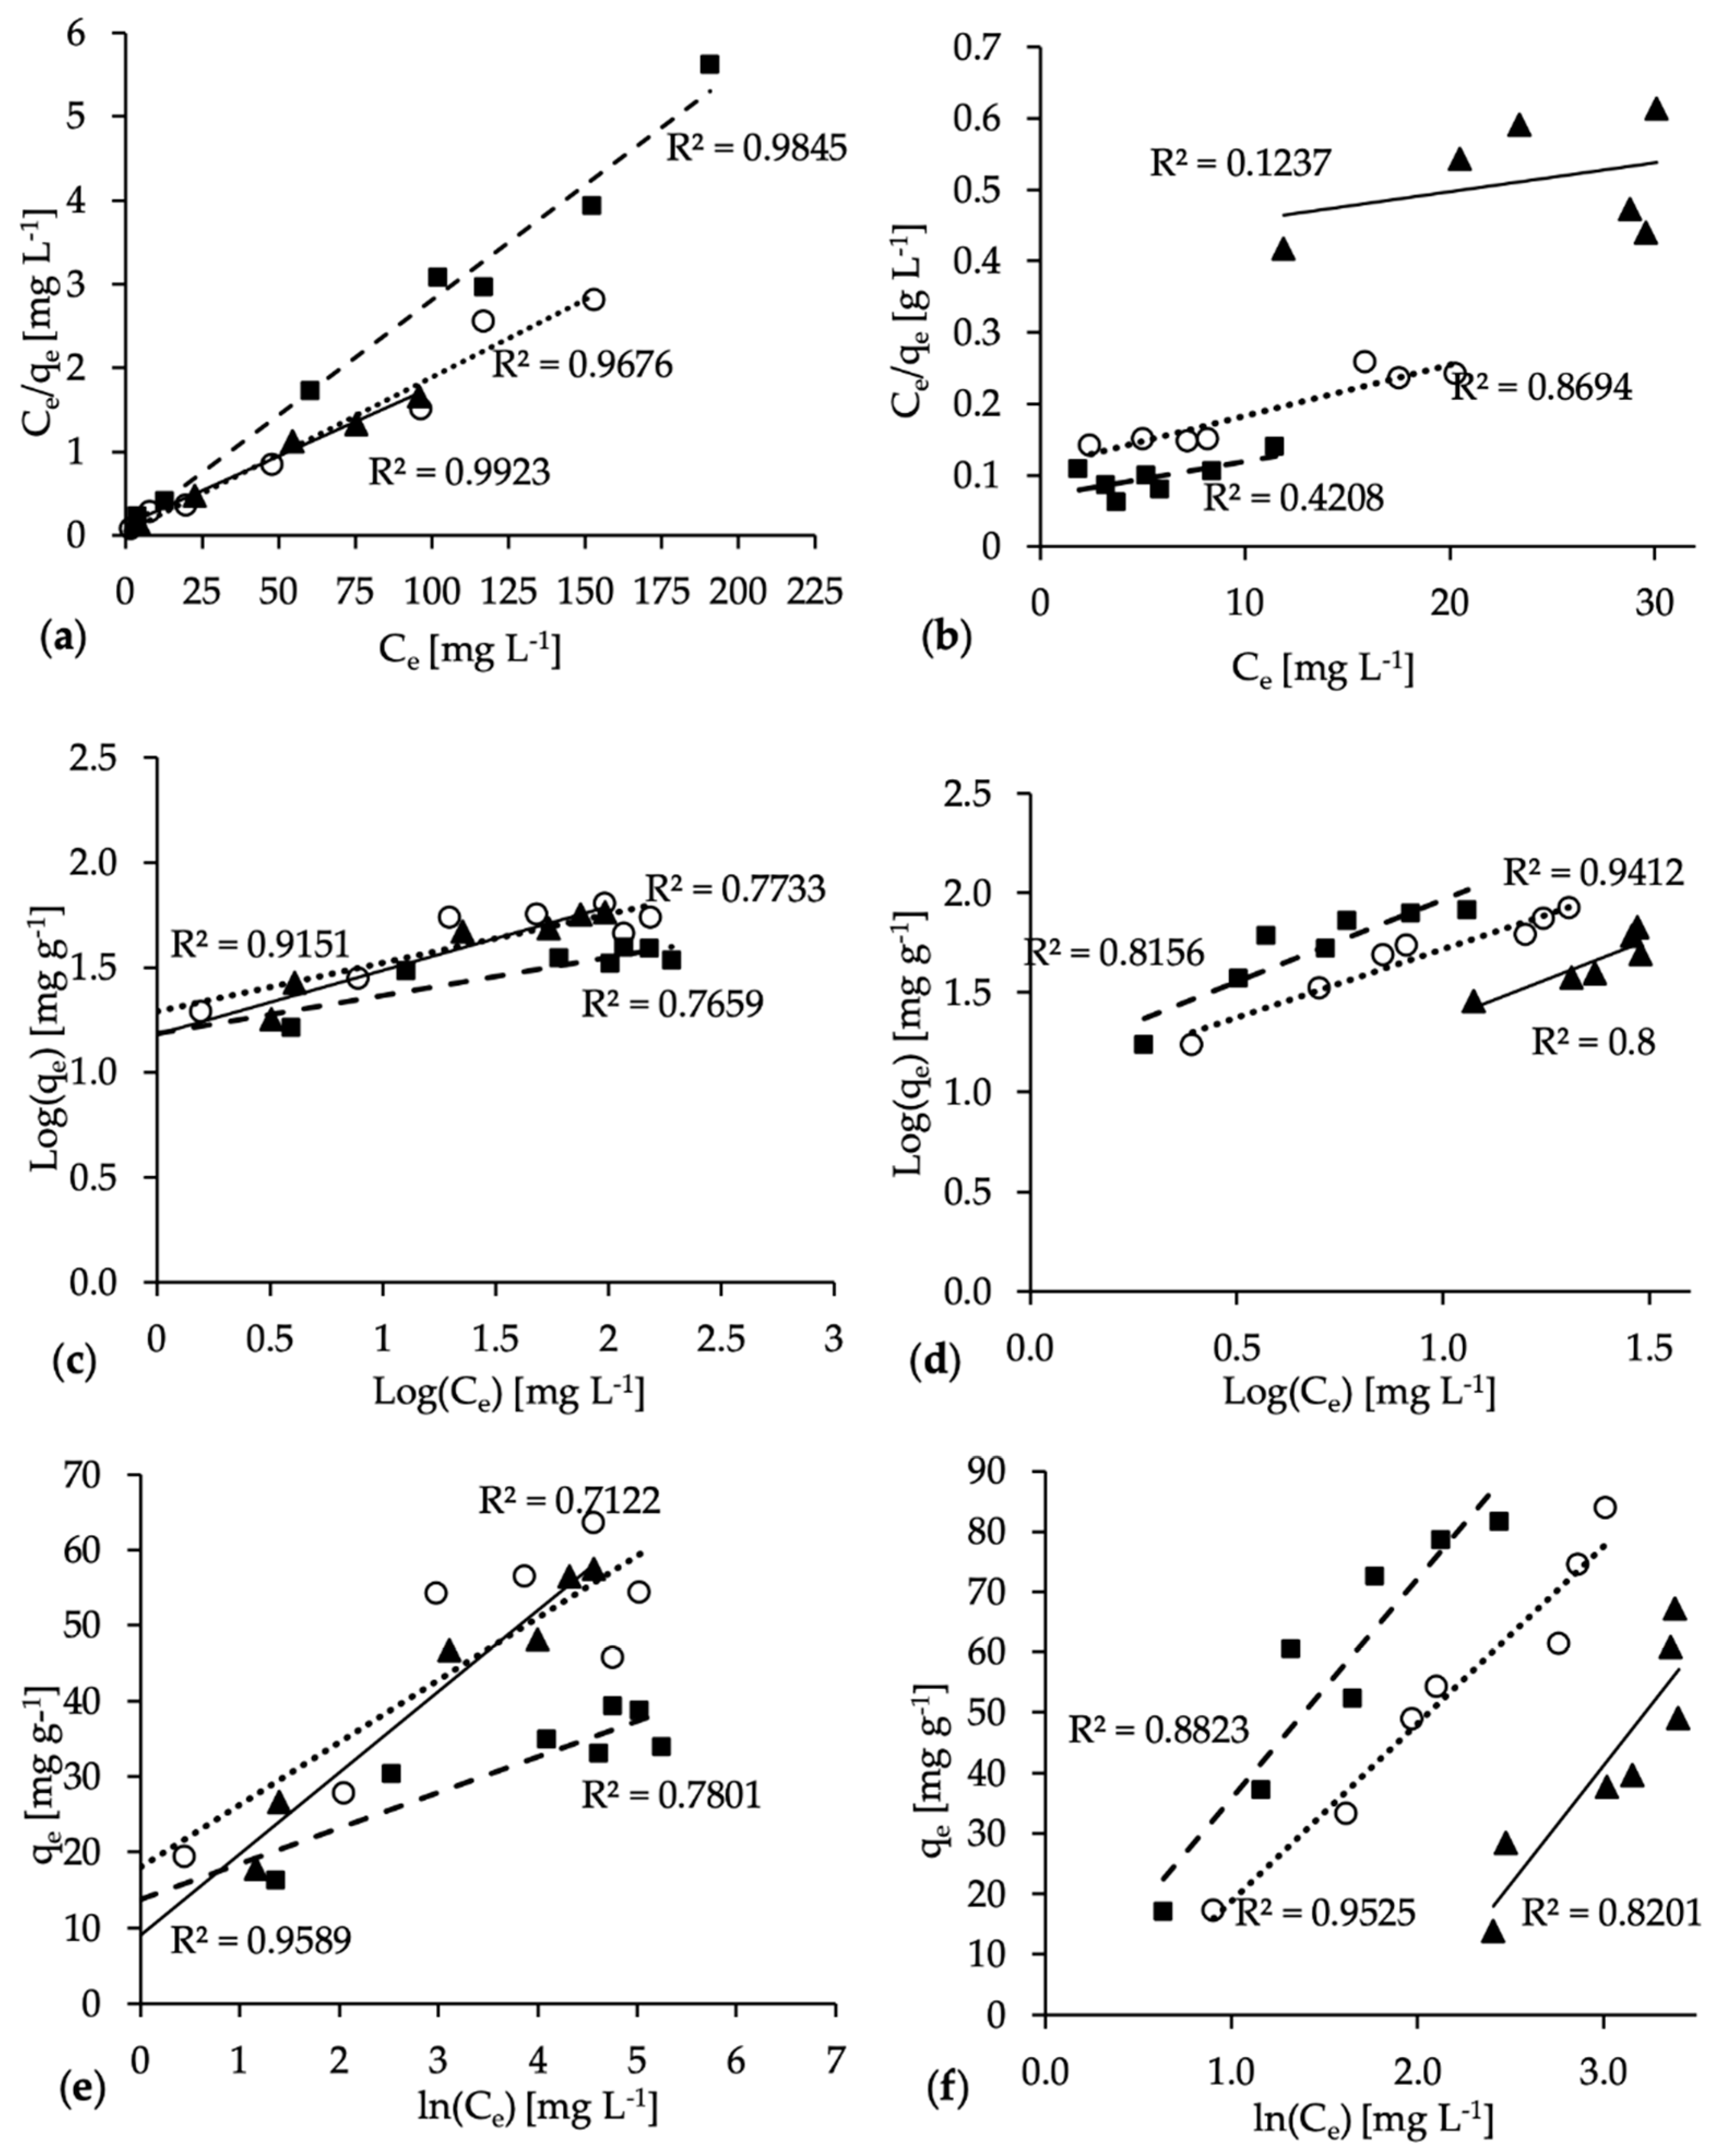
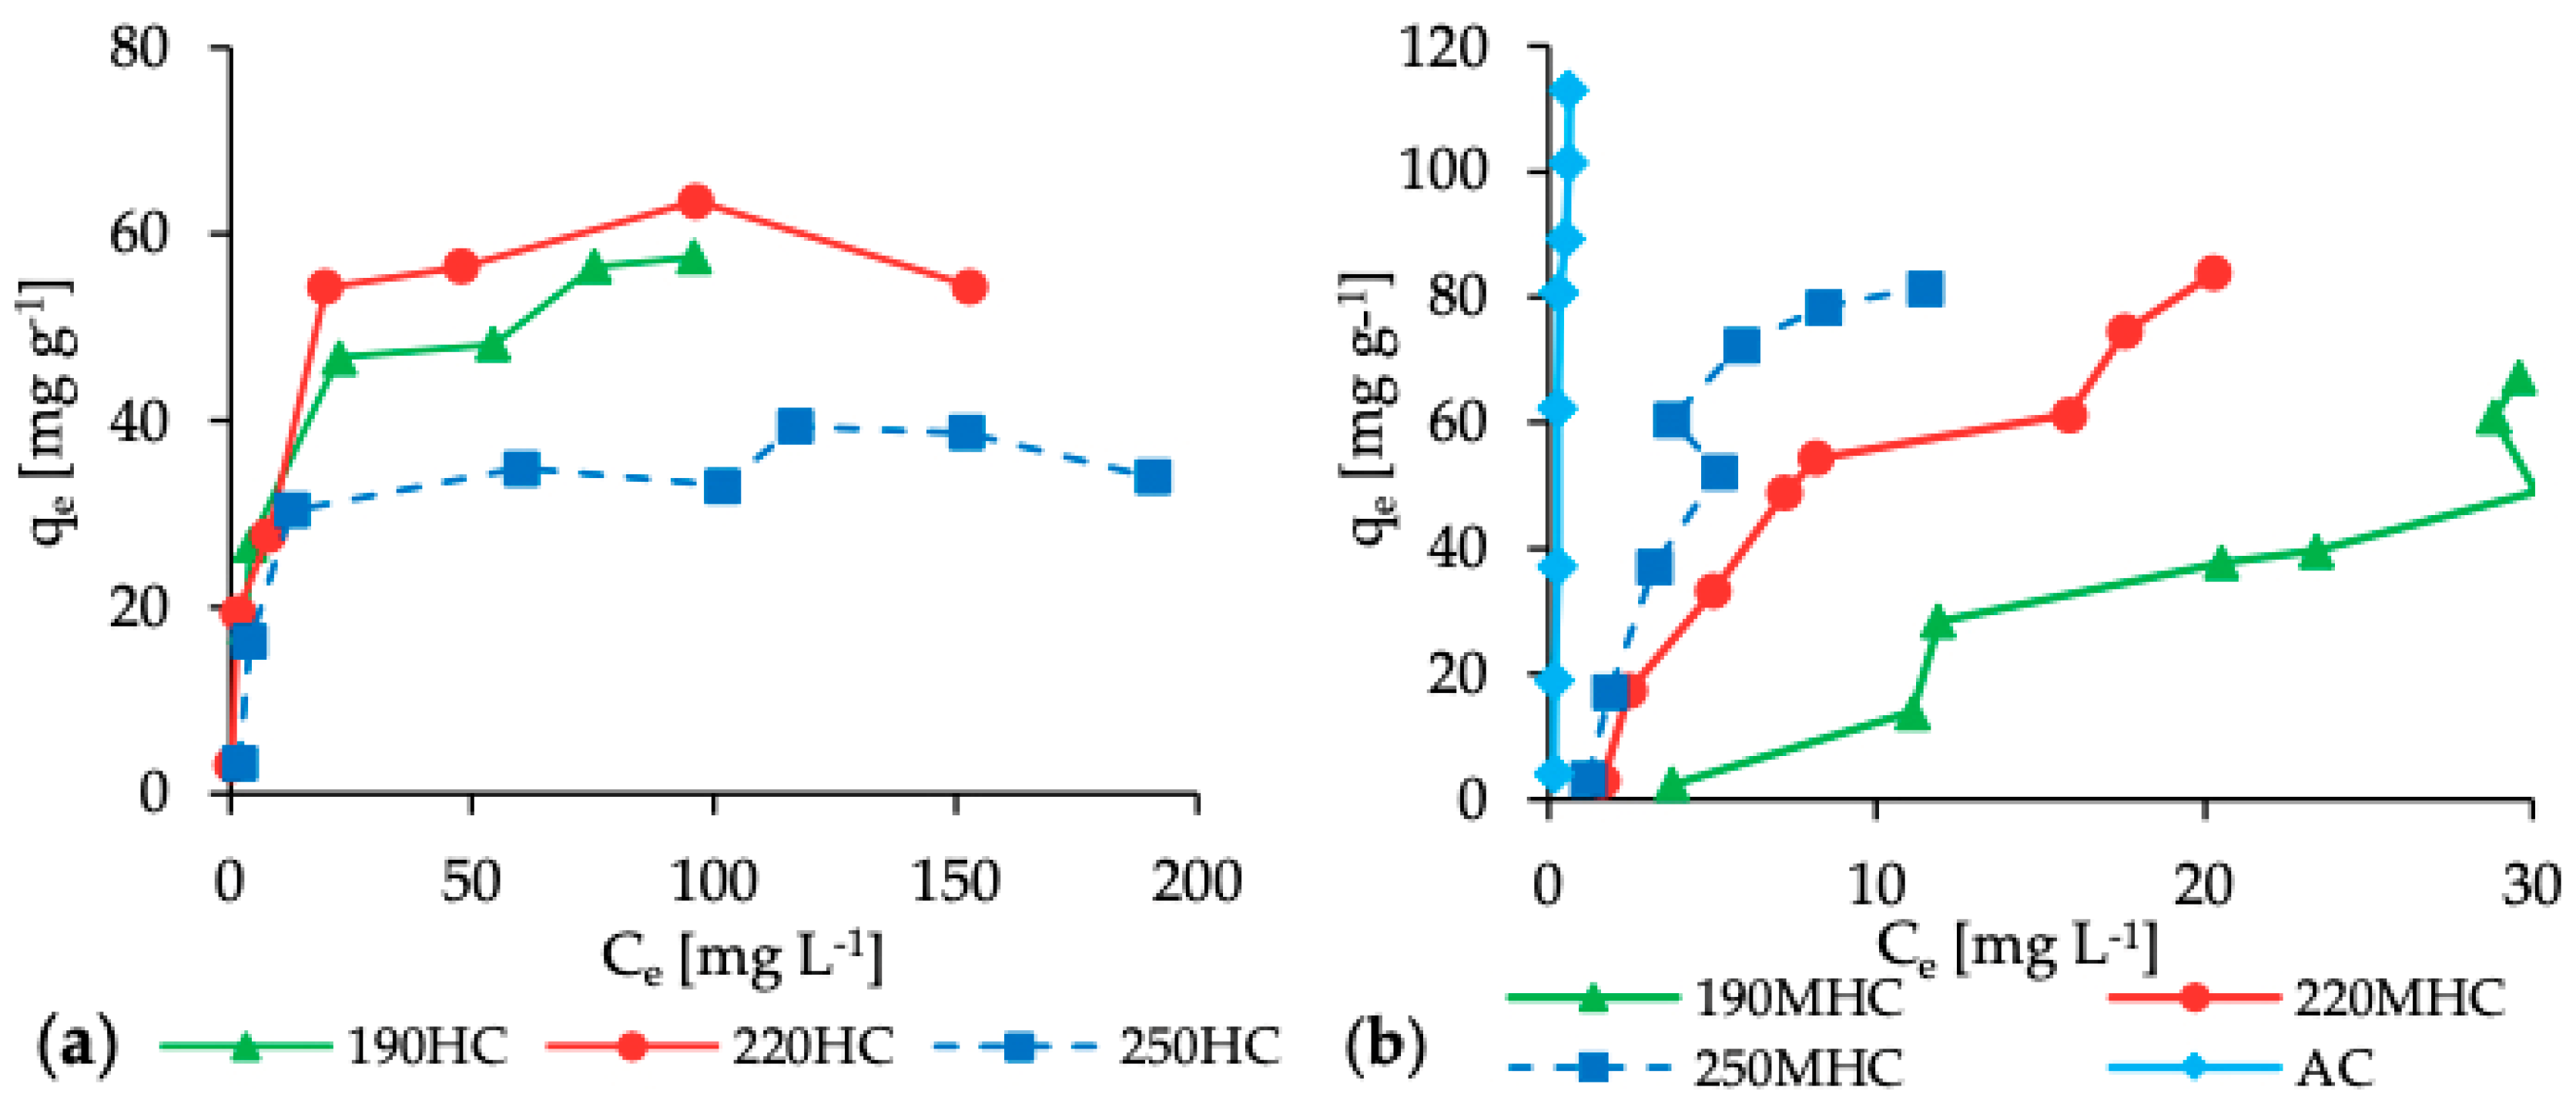
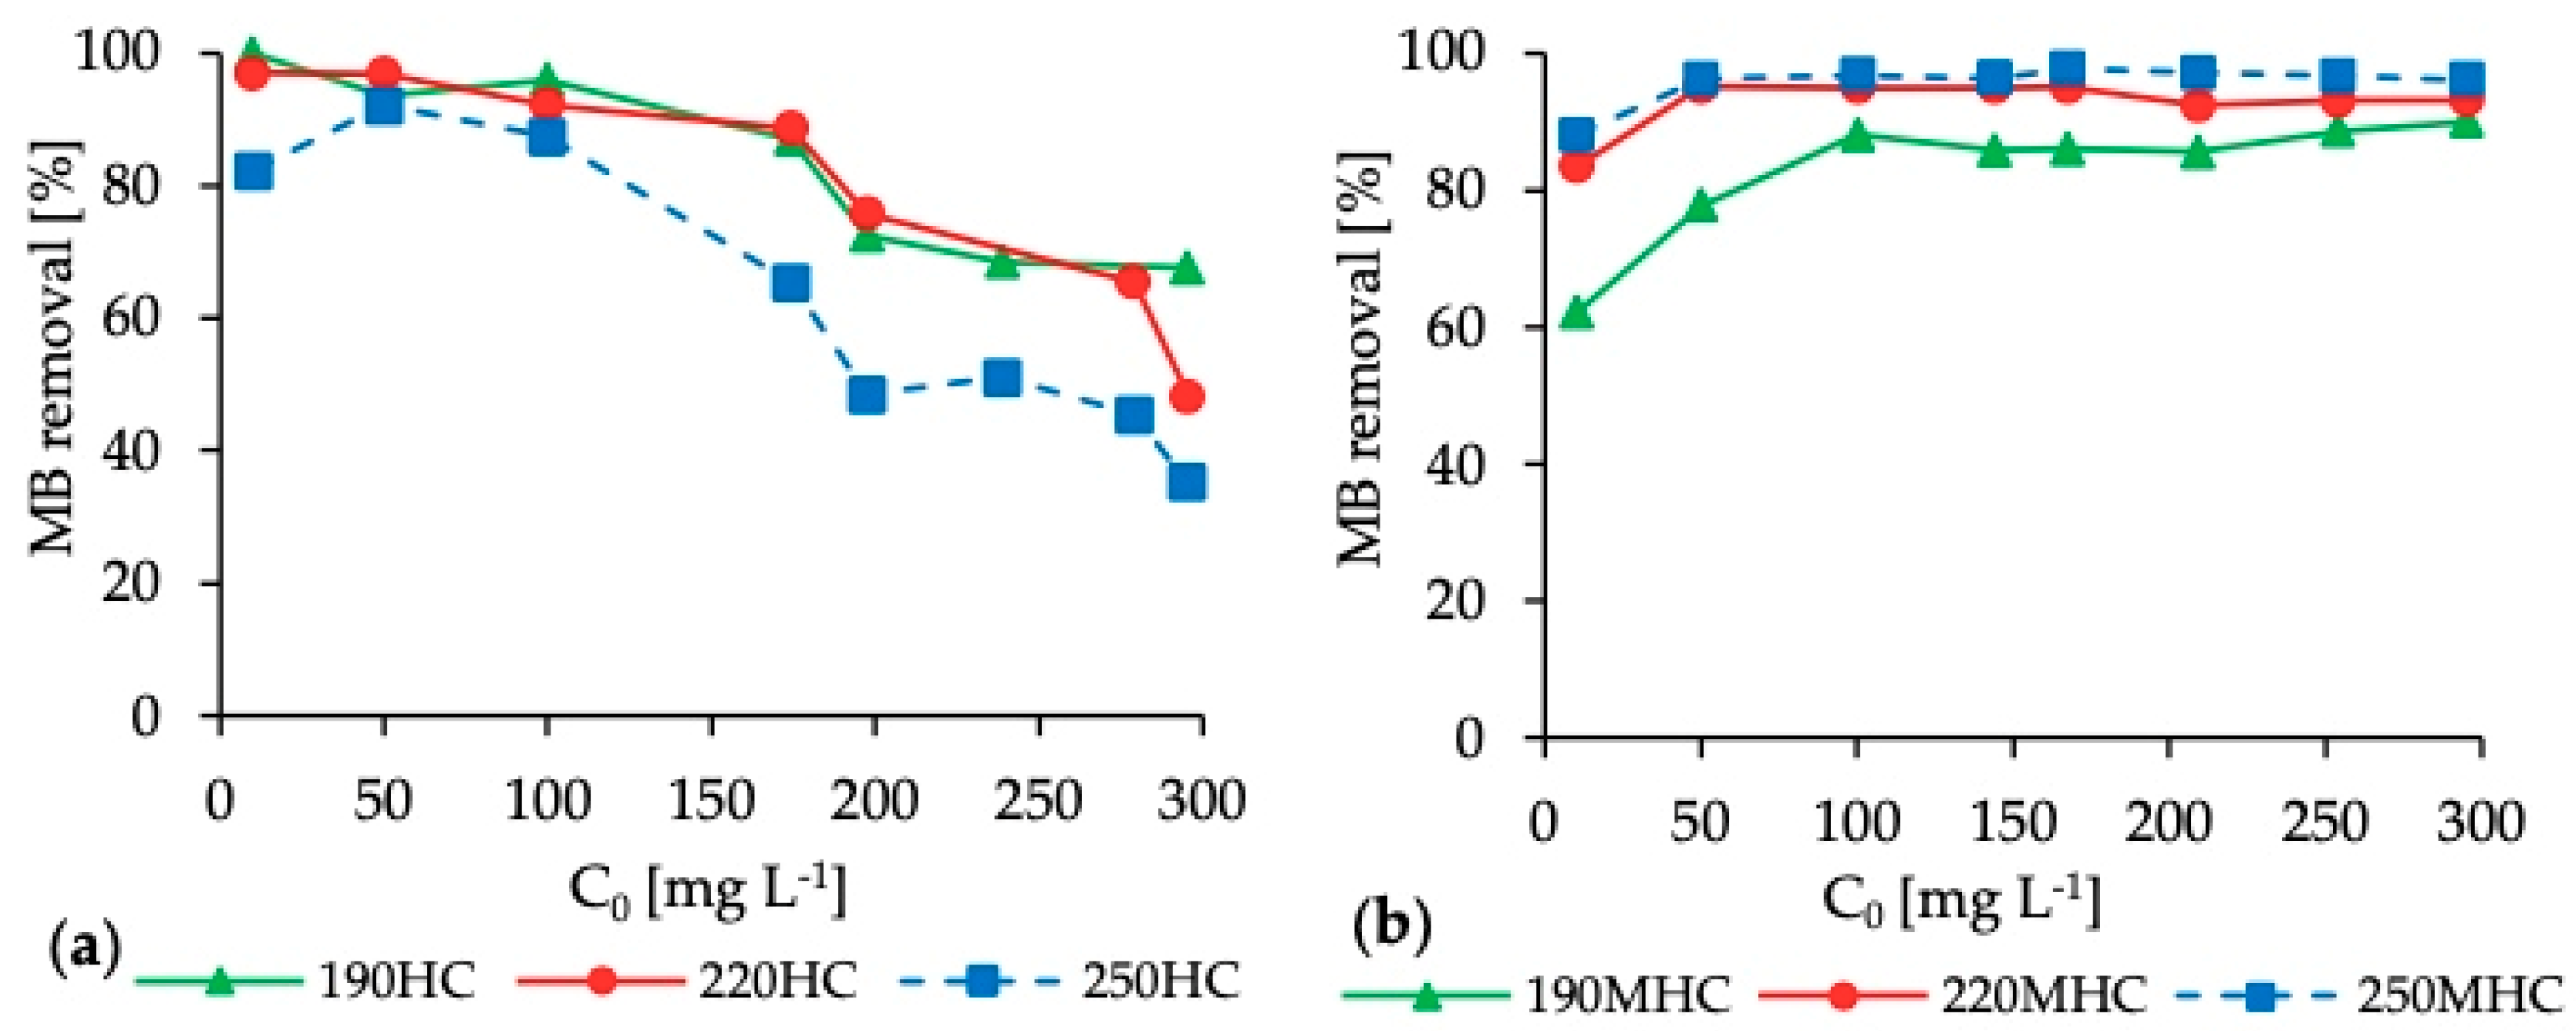
3.2. Adsorption Isotherms
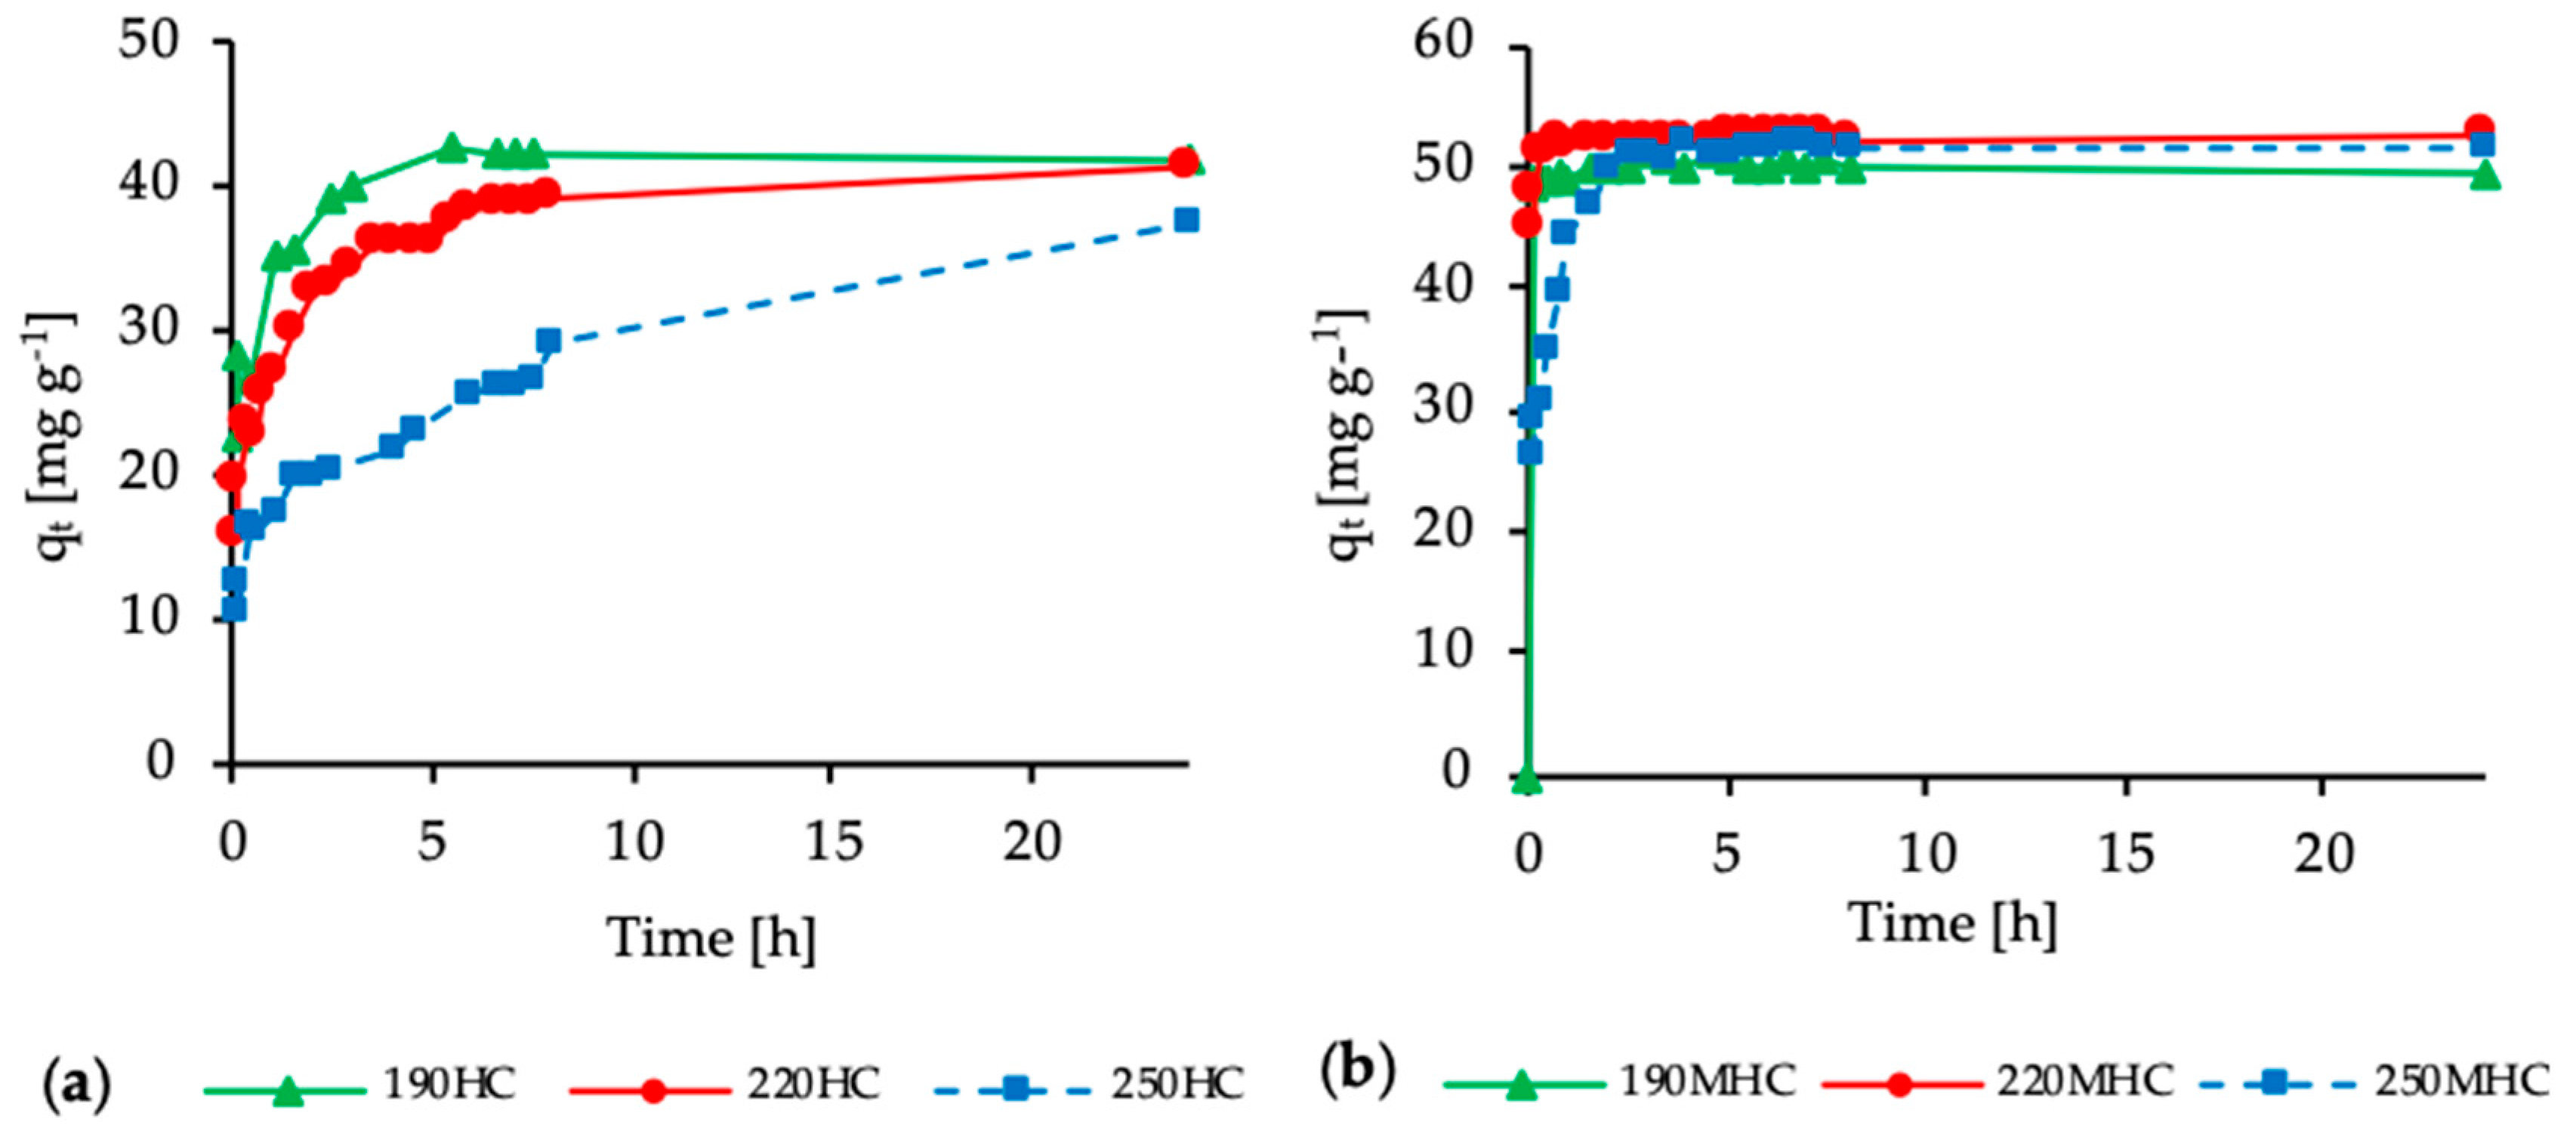
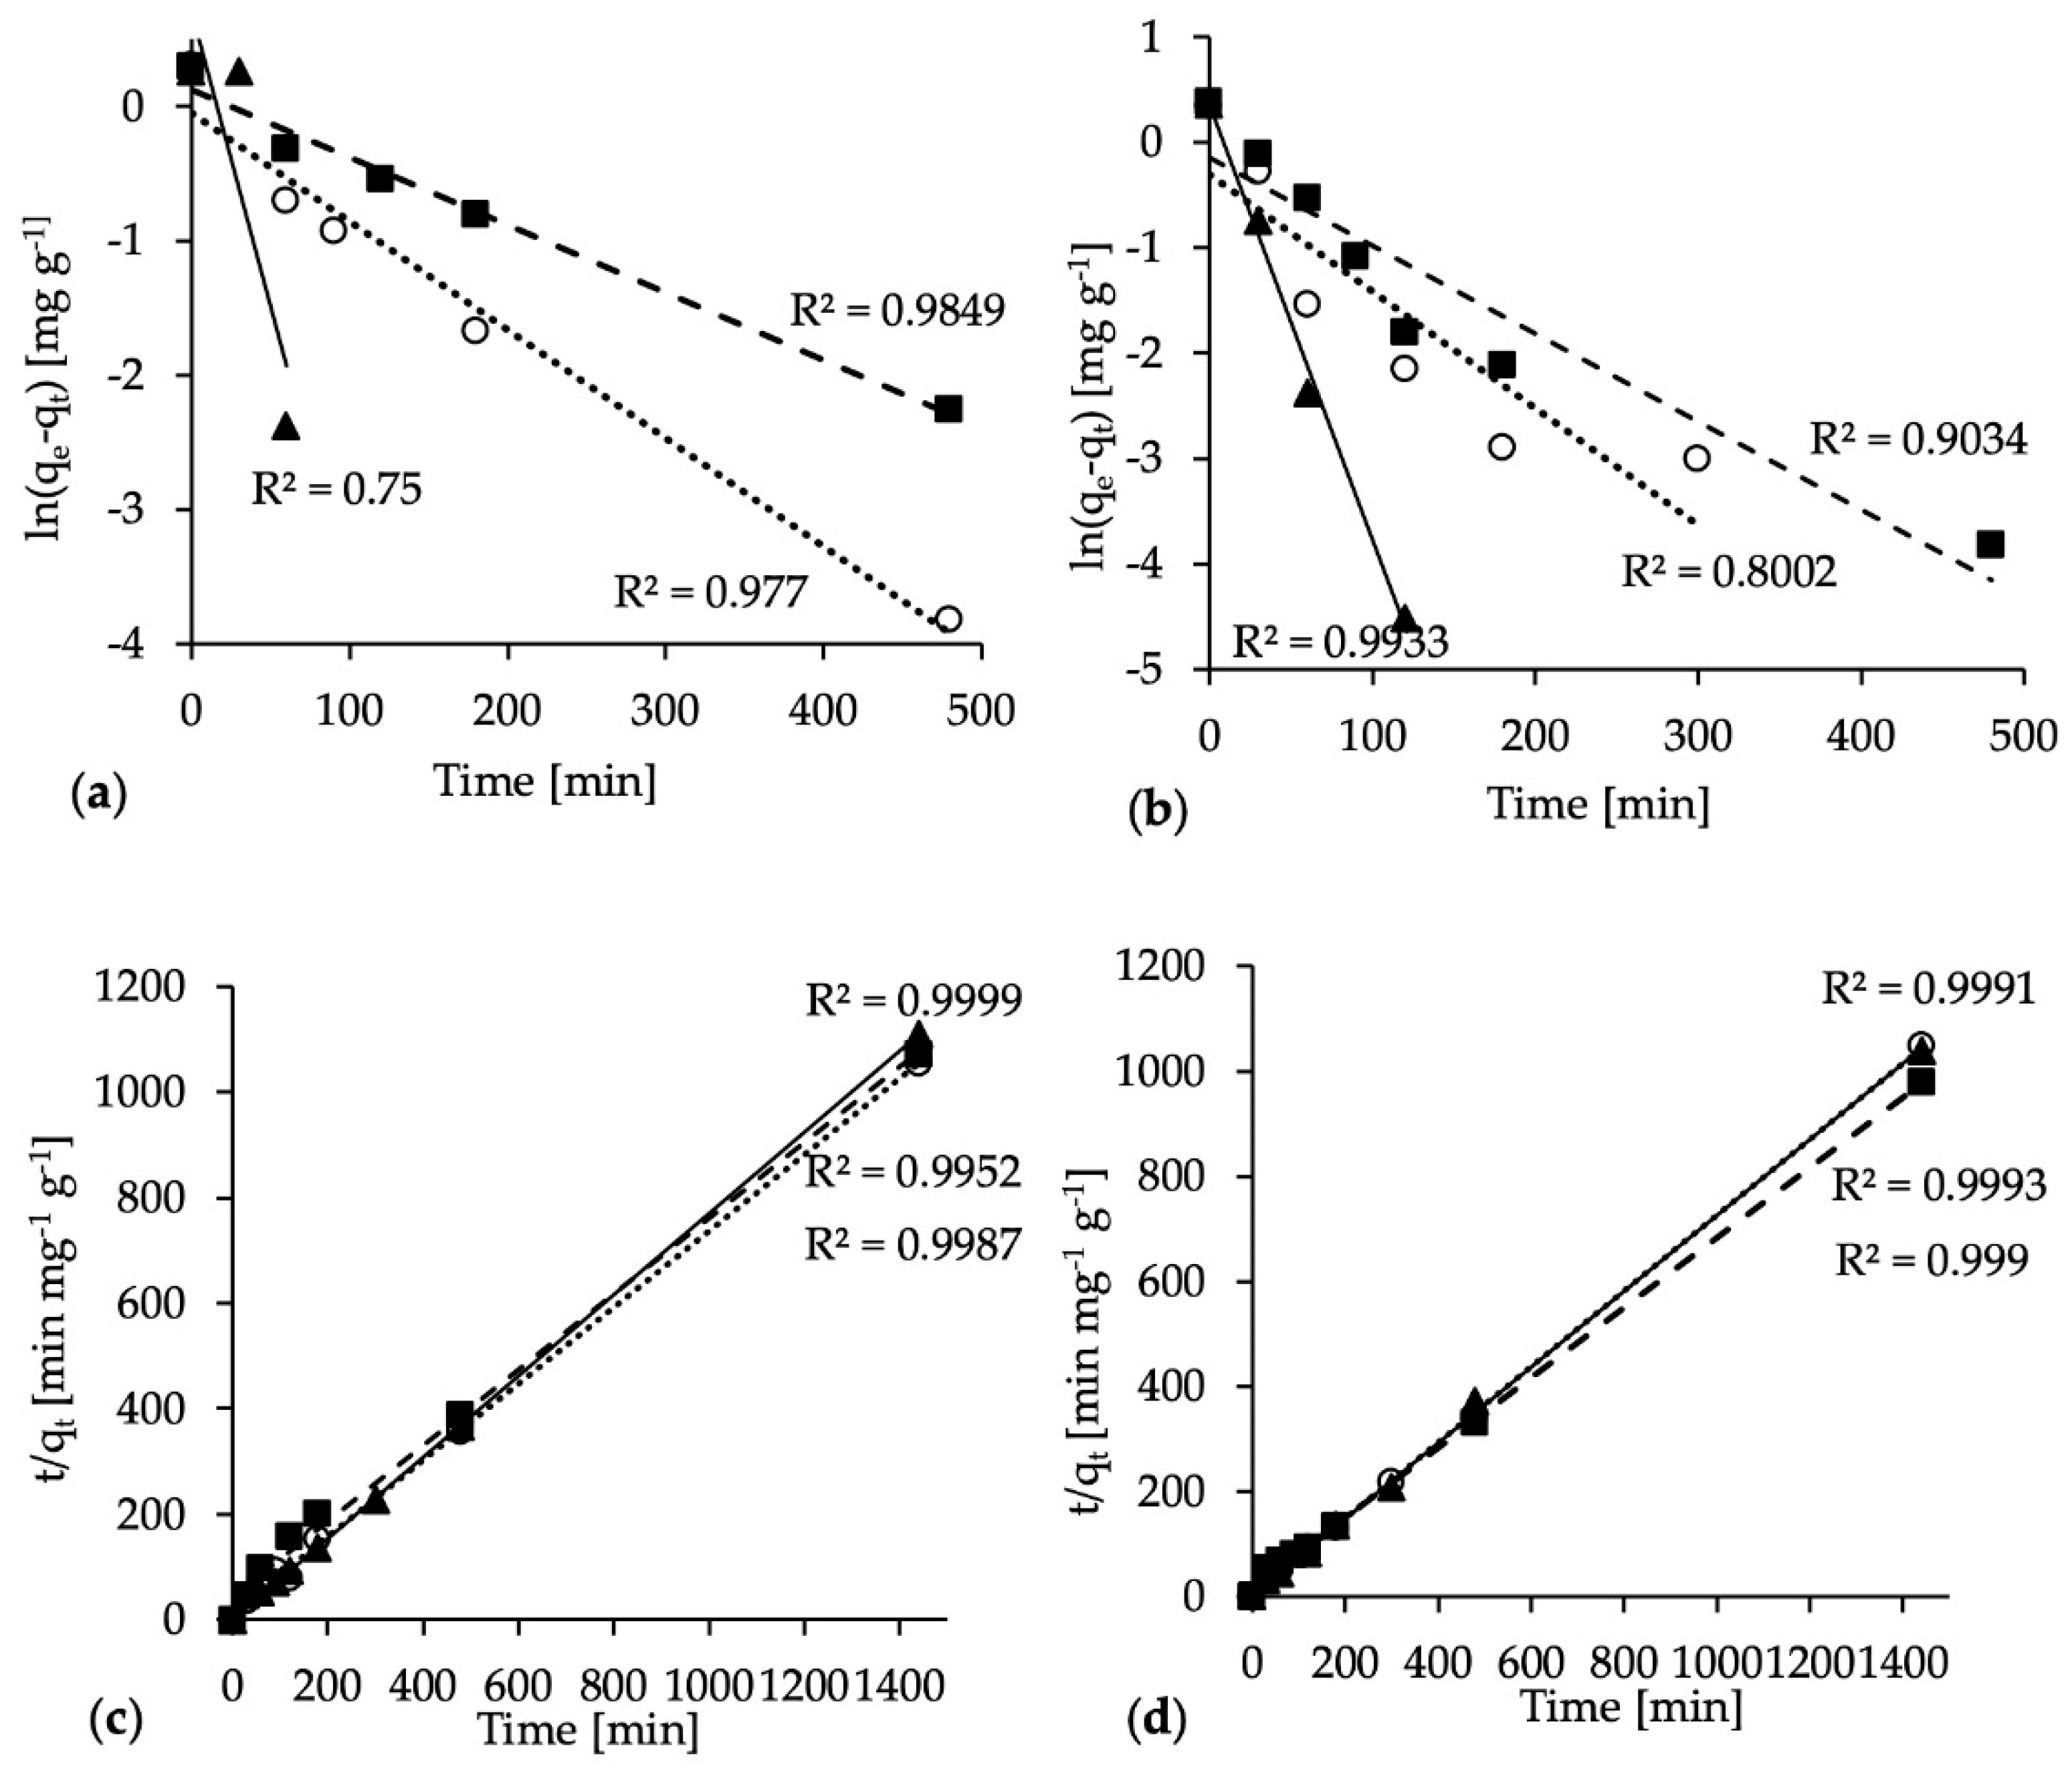
3.3. Adsorption Kinetics
3.4. Effect of KOH Modification
4. Conclusions
Author Contributions
Funding
Acknowledgments
Conflicts of Interest
Appendix A


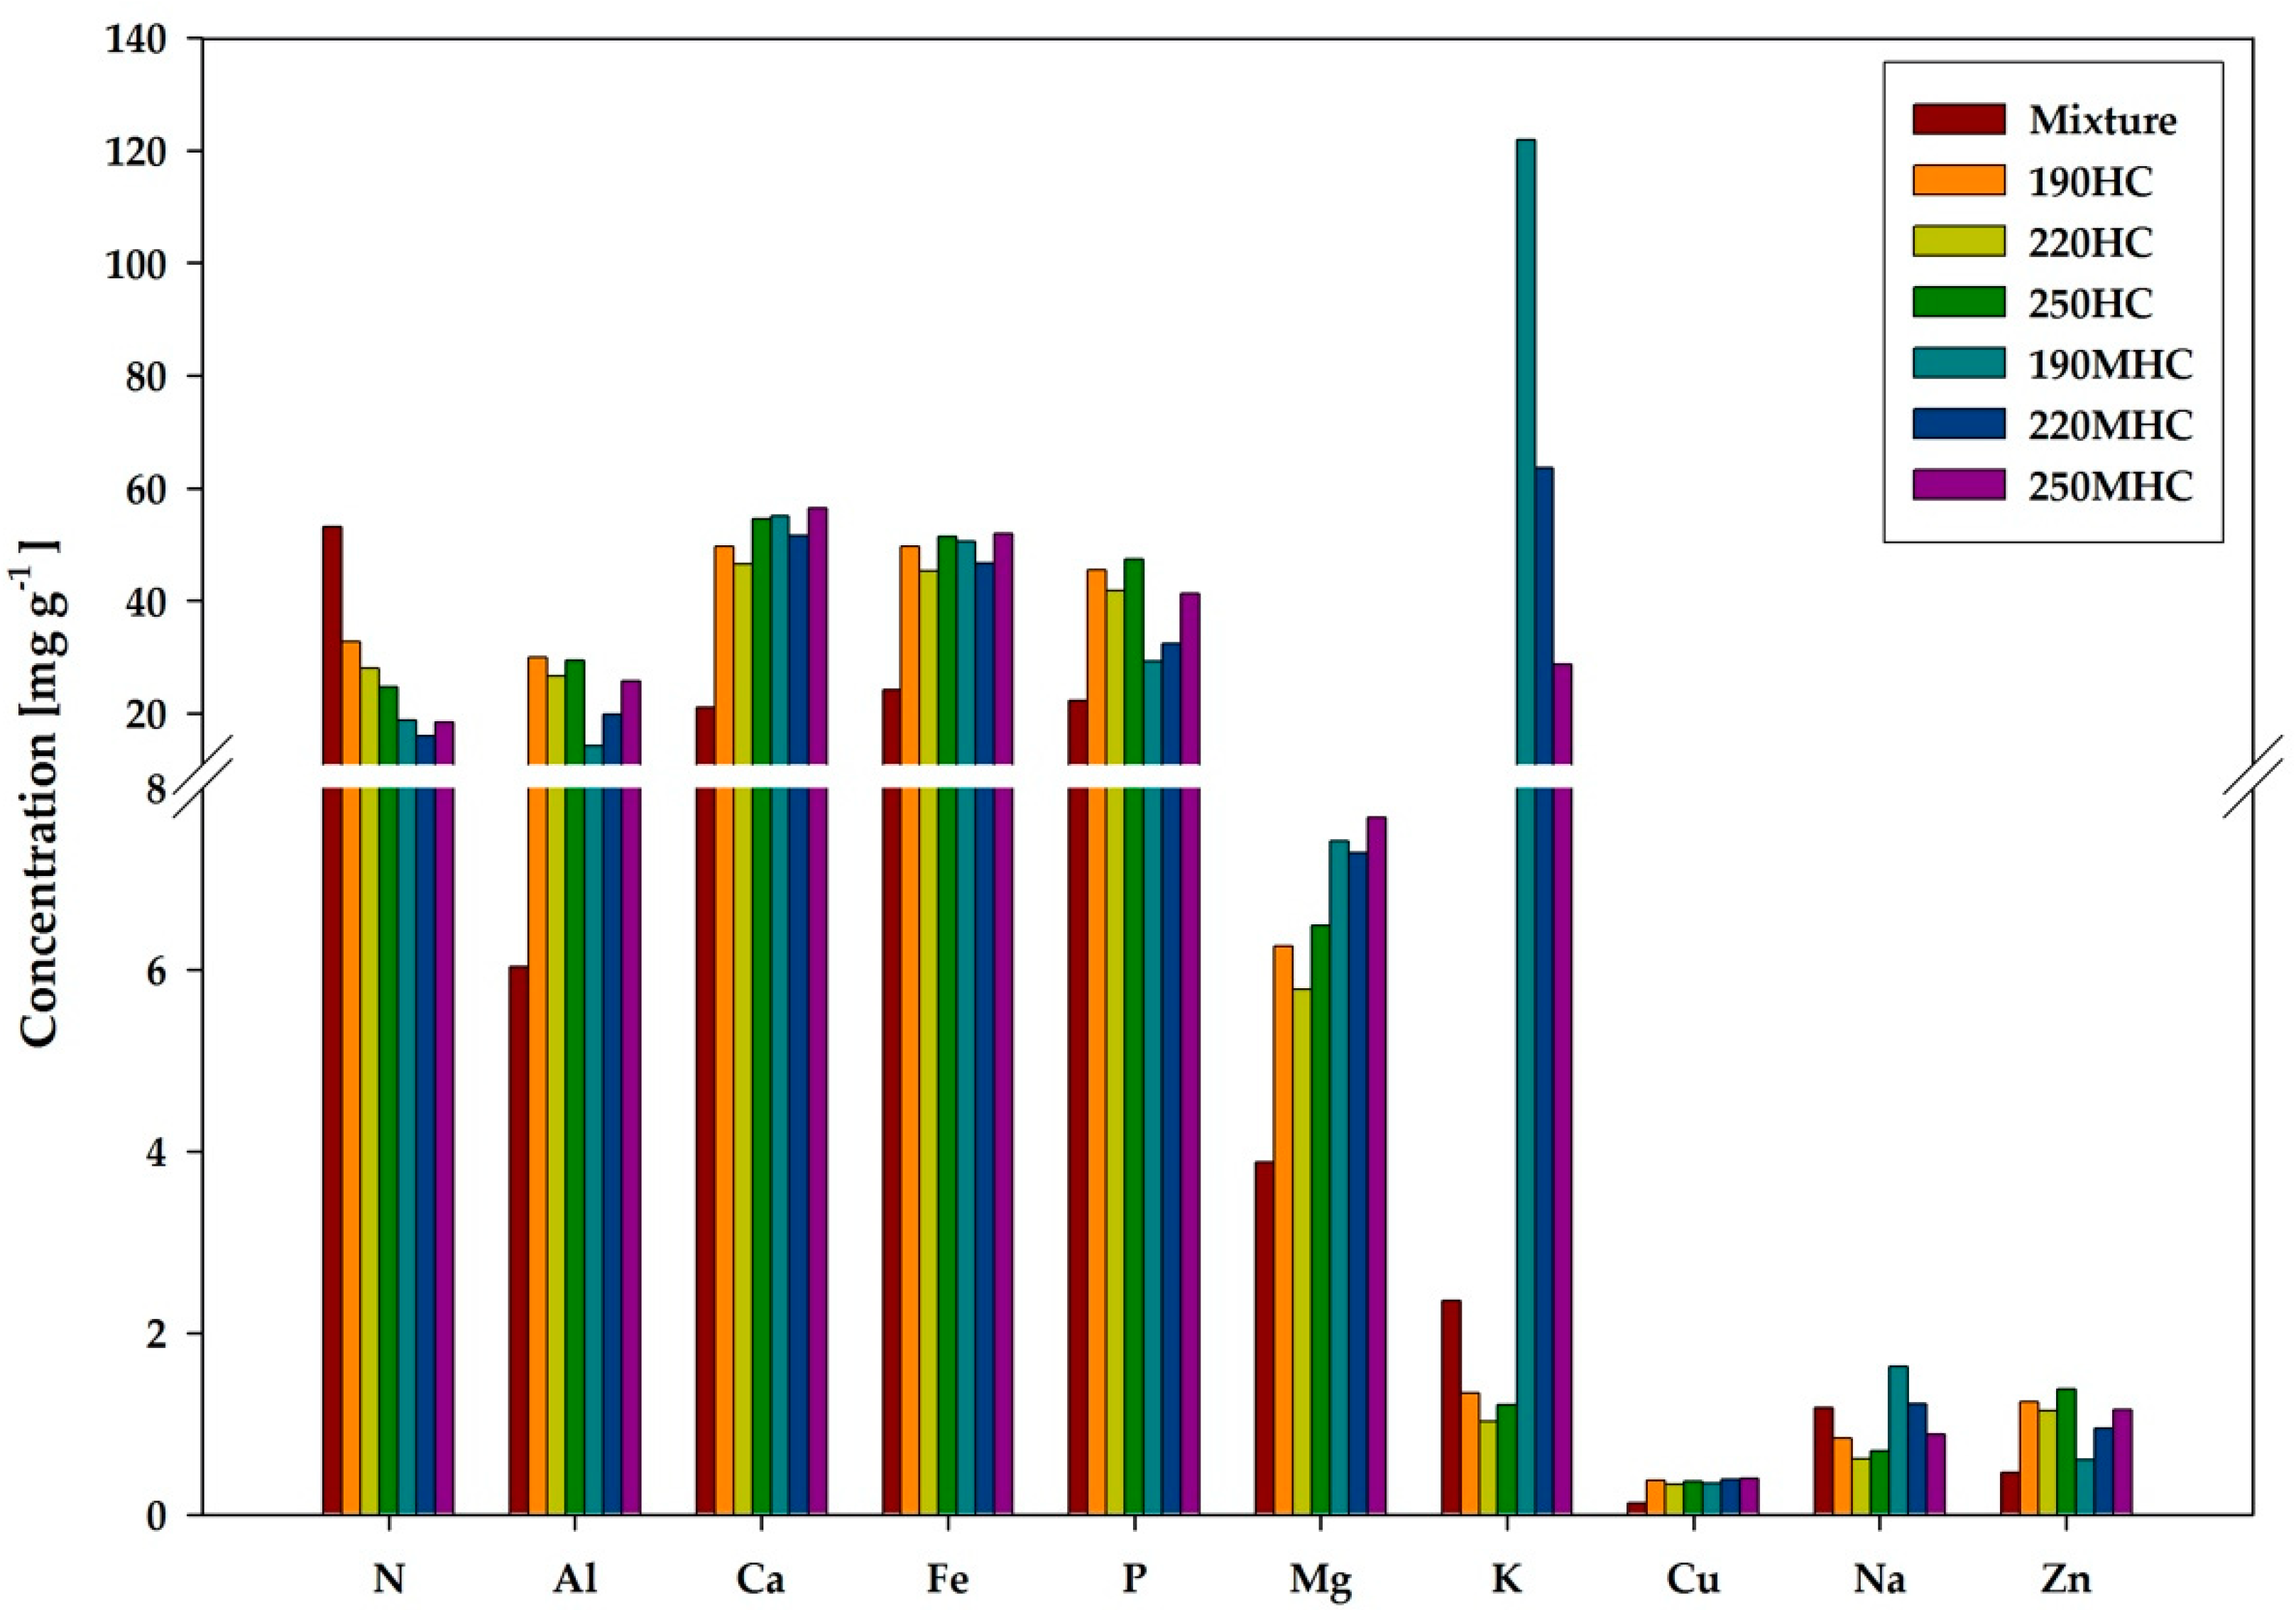
| Digestate | Palatable | Mixture 1 | 190HC | 220HC | 250HC | 190MHC | 220MHC | 250MHC | |
|---|---|---|---|---|---|---|---|---|---|
| N | 46,400 | 54,300 | 53,200 | 32,800 | 28,000 | 24,700 | 18,800 | 16,000 | 18,500 |
| Al | 6500 | 6000 | 6000 | 30,000 | 26,600 | 29,400 | 14,200 | 19,900 | 25,800 |
| Cd | 0.9 | 1.0 | 1.0 | 1.6 | 1.4 | 1.5 | 1.5 | 2.1 | 1.6 |
| Ca | 26,000 | 20,000 | 21,000 | 50,000 | 47,000 | 55,000 | 55,000 | 52,000 | 56,000 |
| Cr | 18 | 19 | 19 | 28 | 26 | 33 | 31 | 27 | 38 |
| Fe | 27,000 | 24,000 | 24,000 | 50,000 | 45,000 | 51,000 | 50,000 | 47,000 | 52,000 |
| P | 25,000 | 22,000 | 22,000 | 46,000 | 42,000 | 47,000 | 29,000 | 32,000 | 41,000 |
| Mg | 6000 | 3500 | 4000 | 6000 | 6000 | 6500 | 7400 | 7300 | 7700 |
| Hg | 0.5 | 0.4 | 0.4 | 1.5 | 1.1 | 1.2 | 0.5 | 0.9 | 1.0 |
| Ni | 8 | 7.5 | 7.5 | 26 | 25 | 29 | 19 | 22 | 30 |
| Pb | 32 | 29 | 29 | 62 | 57 | 75 | 65 | 65 | 72 |
| K | 4900 | 1900 | 2400 | 1300 | 1000 | 1200 | 121,800 | 63,600 | 28,700 |
| Cu | 140 | 130 | 130 | 370 | 330 | 360 | 340 | 380 | 400 |
| Na | 2750 | 900 | 1170 | 840 | 610 | 700 | 1630 | 1210 | 890 |
| Zn | 490 | 460 | 470 | 1240 | 1140 | 1380 | 600 | 950 | 1160 |
| C0 [mg L−1] | 190HC | 220HC | 250HC | |||||||||
|---|---|---|---|---|---|---|---|---|---|---|---|---|
| Ce [mg L−1] | HC Mass [g] | qe [mg g−1] | MB Removal [%] | Ce [mg L−1] | HC Mass [g] | qe [mg g−1] | MB Removal [%] | Ce [mg L−1] | HC Mass [g] | qe [mg g−1] | MB Removal [%] | |
| 10 | 2 | 0.0150 | 3 | 80 | 0 | 0.0126 | 3 | 97 | 2 | 0.0101 | 3 | 82 |
| 50 | 3 | 0.0105 | 18 | 94 | 2 | 0.0100 | 19 | 97 | 4 | 0.0113 | 16 | 92 |
| 100 | 4 | 0.0144 | 27 | 96 | 8 | 0.0133 | 28 | 92 | 13 | 0.0115 | 30 | 87 |
| 174 | 22 | 0.0130 | 47 | 87 | 20 | 0.0114 | 54 | 89 | 60 | 0.0131 | 35 | 65 |
| 198 | 54 | 0.0119 | 48 | 73 | 48 | 0.0106 | 57 | 76 | 102 | 0.0116 | 33 | 48 |
| 239 | 75 | 0.0116 | 56 | 69 | n.a. | n.a. | n.a. | n.a. | 117 | 0.0124 | 39 | 51 |
| 279 | n.a. | n.a. | n.a. | n.a. | 96 | 0.0115 | 64 | 65 | 152 | 0.0131 | 39 | 45 |
| 295 | 96 | 0.0139 | 80 | 68 | 153 | 0.0105 | 54 | 48 | 191 | 0.0123 | 34 | 35 |
| C0 [mg L−1] | 190MHC | 220MHC | 250MHC | |||||||||
|---|---|---|---|---|---|---|---|---|---|---|---|---|
| Ce [mg L−1] | HC Mass [g] | qe [mg g−1] | MB Removal [%] | Ce [mg L−1] | HC Mass [g] | qe [mg g−1] | MB Removal [%] | Ce [mg L−1] | HC Mass [g] | qe [mg g−1] | MB Removal [%] | |
| 10 | 4 | 0.0105 | 2 | 62 | 2 | 0.0108 | 3 | 83 | 1 | 0.0107 | 3 | 88 |
| 50 | 11 | 0.0112 | 14 | 78 | 2 | 0.0110 | 17 | 95 | 2 | 0.0112 | 17 | 96 |
| 100 | 12 | 0.0124 | 28 | 88 | 5 | 0.0114 | 33 | 95 | 3 | 0.0104 | 37 | 97 |
| 144 | 21 | 0.0131 | 38 | 86 | 7 | 0.0112 | 49 | 95 | 5 | 0.0106 | 52 | 96 |
| 167 | 23 | 0.0145 | 40 | 86 | 8 | 0.0117 | 54 | 95 | 4 | 0.0108 | 60 | 98 |
| 209 | 30 | 0.0146 | 49 | 86 | 16 | 0.0126 | 61 | 92 | 6 | 0.0112 | 73 | 97 |
| 254 | 29 | 0.0148 | 61 | 89 | 18 | 0.0127 | 74 | 93 | 8 | 0.0125 | 79 | 97 |
| 295 | 30 | 0.0158 | 67 | 90 | 20 | 0.0131 | 84 | 93 | 11 | 0.0139 | 82 | 96 |
References
- Ferrentino, R.; Langone, M.; Andreottola, G.; Rada, E.C. An anaerobic side-stream reactor in wastewater treatment: A review. WIT Trans. Ecol. Environ. 2014, 191, 1435–1446. [Google Scholar]
- Saetea, P.; Tippayawong, N. Recovery of Value-Added Products from Hydrothermal Carbonization of Sewage Sludge. ISRN Chem. Eng. 2013, 2013, 1–6. [Google Scholar] [CrossRef] [Green Version]
- Sharma, H.B.; Sarmah, A.K.; Dubey, B. Hydrothermal carbonization of renewable waste biomass for solid biofuel production: A discussion on process mechanism, the influence of process parameters, environmental performance and fuel properties of hydrochar. Renew. Sustain. Energy Rev. 2020, 123, 109761. [Google Scholar] [CrossRef]
- Villamil, J.A.; de la Rubia, M.A.; Diaz, E.; Mohedano, A.F. Technologies for Wastewater Sludge Utilization and Energy Production: Hydrothermal Carbonization of Lignocellulosic Biomass and Sewage Sludge; Elsevier Inc.: Amsterdam, The Netherlands, 2020; ISBN 9780128162040. [Google Scholar]
- Merzari, F.; Langone, M.; Andreottola, G.; Fiori, L. Methane production from process water of sewage sludge hydrothermal carbonization. A review. Valorising sludge through hydrothermal carbonization. Crit. Rev. Environ. Sci. Technol. 2019, 49, 1–42. [Google Scholar] [CrossRef]
- Román, S.; Libra, J.; Berge, N.; Sabio, E.; Ro, K.; Li, L.; Ledesma, B.; Alvarez, A.; Bae, S. Hydrothermal carbonization: Modeling, final properties design and applications: A review. Energies 2018, 11, 216. [Google Scholar] [CrossRef] [Green Version]
- Funke, A.; Ziegler, F. Hydrothermal carbonization of biomass: A summary and discussion of chemical mecha- nisms for process engineering. Biofuels Bioprod. Biorefining 2010, 4, 160–177. [Google Scholar] [CrossRef]
- Lucian, M.; Volpe, M.; Fiori, L. Hydrothermal Carbonization Kinetics of Lignocellulosic Agro-Wastes: Experimental Data and Modeling. Energies 2019, 12, 516. [Google Scholar] [CrossRef] [Green Version]
- Fang, J.; Zhan, L.; Ok, Y.S.; Gao, B. Minireview of potential applications of hydrochar derived from hydrothermal carbonization of biomass. J. Ind. Eng. Chem. 2018, 57, 15–21. [Google Scholar] [CrossRef]
- Román, S.; Valente Nabais, J.M.; Ledesma, B.; González, J.F.; Laginhas, C.; Titirici, M.M. Production of low-cost adsorbents with tunable surface chemistry by conjunction of hydrothermal carbonization and activation processes. Microporous Mesoporous Mater. 2013, 165, 127–133. [Google Scholar] [CrossRef]
- Purnomo, C.W.; Castello, D.; Fiori, L. Granular Activated Carbon from Grape Seeds Hydrothermal Char. Appl. Sci. 2018, 8, 331. [Google Scholar] [CrossRef] [Green Version]
- Hammud, H.H.; Shmait, A.; Hourani, N. Removal of Malachite Green from water using hydrothermally carbonized pine needles. RSC Adv. 2015, 5, 7909–7920. [Google Scholar] [CrossRef]
- Wei, J.; Liu, Y.; Li, J.; Yu, H.; Peng, Y. Removal of organic contaminant by municipal sewage sludge-derived hydrochar: Kinetics, thermodynamics and mechanisms. Water Sci. Technol. 2018, 78, 947–956. [Google Scholar] [CrossRef] [Green Version]
- Sun, K.; Tang, J.; Gong, Y.; Zhang, H. Characterization of potassium hydroxide (KOH) modified hydrochars from different feedstocks for enhanced removal of heavy metals from water. Environ. Sci. Pollut. Res. 2015, 22, 16640–16651. [Google Scholar] [CrossRef]
- Diaz, E.; Manzano, F.J.; Villamil, J.; Rodriguez, J.J.; Mohedano, A.F. Low-Cost Activated Grape Seed-Derived Hydrochar through Hydrothermal Carbonization and Chemical Activation for Sulfamethoxazole Adsorption. Appl. Sci. 2019, 9, 5127. [Google Scholar] [CrossRef] [Green Version]
- Falco, C.; Marco-Lozar, J.P.; Salinas-Torres, D.; Morallón, E.; Cazorla-Amorós, D.; Titirici, M.M.; Lozano-Castelló, D. Tailoring the porosity of chemically activated hydrothermal carbons: Influence of the precursor and hydrothermal carbonization temperature. Carbon N. Y. 2013, 62, 346–355. [Google Scholar] [CrossRef] [Green Version]
- Park, J.E.; Lee, G.B.; Hong, B.U.; Hwang, S.Y. Regeneration of Activated Carbons Spent by Waste Water Treatment Using KOH Chemical Activation. Appl. Sci. 2019, 9, 1–10. [Google Scholar]
- Regmi, P.; Garcia Moscoso, J.L.; Kumar, S.; Cao, X.; Mao, J.; Schafran, G. Removal of copper and cadmium from aqueous solution using switchgrass biochar produced via hydrothermal carbonization process. J. Environ. Manag. 2012, 109, 61–69. [Google Scholar] [CrossRef]
- Spataru, A.; Jain, R.; Chung, J.W.; Gerner, G.; Krebs, R.; Lens, P.N.L. Enhanced adsorption of orthophosphate and copper onto hydrochar derived from sewage sludge by KOH activation. RSC Adv. 2016, 6, 101827–101834. [Google Scholar] [CrossRef]
- Lucian, M.; Fiori, L. Hydrothermal carbonization of waste biomass: Process design, modeling, energy efficiency and cost analysis. Energies 2017, 10, 211. [Google Scholar] [CrossRef] [Green Version]
- Merzari, F.; Lucian, M.; Volpe, M.; Andreottola, G.; Fiori, L. Hydrothermal carbonization of biomass: Design of a bench-Scale reactor for evaluating the heat of reaction. Chem. Eng. Trans. 2018, 65, 43–48. [Google Scholar]
- Volpe, M.; Wüst, D.; Merzari, F.; Lucian, M.; Andreottola, G.; Kruse, A.; Fiori, L. One stage olive mill waste streams valorisation via hydrothermal carbonisation. Waste Manag. 2018, 80, 224–234. [Google Scholar] [CrossRef] [PubMed]
- Sun, K.; Ro, K.; Guo, M.; Novak, J.; Mashayekhi, H.; Xing, B. Sorption of bisphenol A, 17α-ethinyl estradiol and phenanthrene on thermally and hydrothermally produced biochars. Bioresour. Technol. 2011, 102, 5757–5763. [Google Scholar] [CrossRef] [PubMed]
- Fiori, L.; Valbusa, M.; Lorenzi, D.; Fambri, L. Modeling of the devolatilization kinetics during pyrolysis of grape residues. Bioresour. Technol. 2012, 103, 389–397. [Google Scholar] [CrossRef]
- García, R.; Pizarro, C.; Lavín, A.G.; Bueno, J.L. Biomass proximate analysis using thermogravimetry. Bioresour. Technol. 2013, 139, 1–4. [Google Scholar] [CrossRef]
- CNR-IRSA. Metodi Analitici Per i Fanghi; CNR-IRSA: Montelibretti, Italy, 1985. [Google Scholar]
- Guo, J.Z.; Li, B.; Liu, L.; Lv, K. Removal of methylene blue from aqueous solutions by chemically modified bamboo. Chemosphere 2014, 111, 225–231. [Google Scholar] [CrossRef]
- Qian, W.; Luo, X.; Wang, X.; Guo, M.; Li, B. Removal of methylene blue from aqueous solution by modi fi ed bamboo hydrochar. Ecotoxicol. Environ. Saf. 2018, 157, 300–306. [Google Scholar] [CrossRef]
- Langmuir, I. The constitution and fundamental properties of solids and liquids. J. Am. Chem. Soc. 1916, 38, 2221–2295. [Google Scholar] [CrossRef] [Green Version]
- Freundlich, H. Uber Die Adsorption in Losungen. Zeitschrift fur Physikalische Chemie 1906, 57, 385–470. [Google Scholar] [CrossRef]
- Malik, P.K. Use of activated carbons prepared from sawdust and rice-husk for adsoprtion of acid dyes: A case study of acid yellow 36. Dye. Pigment. 2003, 56, 239–249. [Google Scholar] [CrossRef]
- Foo, K.Y.; Hameed, B.H. Preparation, characterization and evaluation of adsorptive properties of orange peel based activated carbon via microwave induced K 2CO 3 activation. Bioresour. Technol. 2012, 104, 679–686. [Google Scholar] [CrossRef]
- Ho, Y.S.; Ng, J.C.Y.; McKay, G. Kinetics of pollutant sorption by biosorbents: Review. Sep. Purif. Methods 2000, 29, 189–232. [Google Scholar] [CrossRef]
- Ho, Y.S.; McKay, G. Pseudo-second order model for sorption processes. Process Biochem. 1999, 34, 451–465. [Google Scholar] [CrossRef]
- Zhai, Y.; Peng, C.; Xu, B.; Wang, T.; Li, C. Hydrothermal carbonisation of sewage sludge for char production with different waste biomass: Effects of reaction temperature and energy recycling. Energy 2017, 127, 167–174. [Google Scholar] [CrossRef]
- He, C.; Giannis, A.; Wang, J. Conversion of sewage sludge to clean solid fuel using hydrothermal carbonization: Hydrochar fuel characteristics and combustion behavior. Appl. Energy 2013, 111, 257–266. [Google Scholar] [CrossRef]
- Kang, S.; Li, X.; Fan, J.; Chang, J. Characterization of hydrochars produced by hydrothermal carbonization of lignin, cellulose, d-xylose, and wood meal. Ind. Eng. Chem. Res. 2012, 51, 9023–9031. [Google Scholar] [CrossRef]
- Berge, N.D.; Ro, K.S.; Mao, J.; Flora, J.R.V.; Chappell, M.A.; Bae, S. Hydrothermal carbonization of municipal waste streams. Environ. Sci. Technol. 2011, 45, 5696–5703. [Google Scholar] [CrossRef]
- Sing, K.S.W.; Everett, D.H.; Haul, R.A.W.; Moscou, L.; Pierotti, R.A.; Rouquérol, J.; Siemieniewska, T. Reporting physisorption data for gas/solid systems with special reference to the determination of surface area and porosity. Pure Appl. Chem. 1985, 57, 603–619. [Google Scholar] [CrossRef]
- Hameed, B.H.; Ahmad, A.L.; Latiff, K.N.A. Adsorption of basic dye (methylene blue) onto activated carbon prepared from rattan sawdust. Dye. Pigment. 2007, 75, 143–149. [Google Scholar] [CrossRef]
- El Qada, E.N.; Allen, S.J.; Walker, G.M. Adsorption of Methylene Blue onto activated carbon produced from steam activated bituminous coal: A study of equilibrium adsorption isotherm. Chem. Eng. J. 2006, 124, 103–110. [Google Scholar] [CrossRef]
- Ahmed, T.; Noor, W.; Faruk, O.; Bhoumick, M.C.; Uddin, M.T. Removal of methylene blue (MB) from waste water by adsorption on jackfruit leaf powder (JLP) in continuously stirred tank reactor. J. Phys. Conf. Ser. 2018, 1086. [Google Scholar] [CrossRef] [Green Version]
- Wiedner, K.; Rumpel, C.; Steiner, C.; Pozzi, A.; Maas, R.; Glaser, B. Chemical evaluation of chars produced by thermochemical conversion (gasification, pyrolysis and hydrothermal carbonization) of agro-industrial biomass on a commercial scale. Biomass Bioenergy 2013, 59, 264–278. [Google Scholar] [CrossRef]
- Wang, X.; Li, C.; Zhang, B.; Lin, J.; Chi, Q.; Wang, Y. Migration and risk assessment of heavy metals in sewage sludge during hydrothermal treatment combined with pyrolysis. Bioresour. Technol. 2016, 221, 560–567. [Google Scholar] [CrossRef] [PubMed]
- Huang, R.; Zhang, B.; Saad, E.M.; Ingall, E.D.; Tang, Y. Speciation evolution of zinc and copper during pyrolysis and hydrothermal carbonization treatments of sewage sludges. Water Res. 2018, 132, 260–269. [Google Scholar] [CrossRef] [PubMed]
- Xiong, J.B.; Pan, Z.Q.; Xiao, X.F.; Huang, H.J.; Lai, F.Y.; Wang, J.X.; Chen, S.W. Study on the hydrothermal carbonization of swine manure: The effect of process parameters on the yield/properties of hydrochar and process water. J. Anal. Appl. Pyrolysis 2019, 144, 104692. [Google Scholar] [CrossRef]
- Volpe, M.; Fiori, L. From olive waste to solid biofuel through hydrothermal carbonisation: The role of temperature and solid load on secondary char formation and hydrochar energy properties. J. Anal. Appl. Pyrolysis 2017, 124, 63–72. [Google Scholar] [CrossRef]
- Wang, L.; Li, A.; Chang, Y. Hydrothermal treatment coupled with mechanical expression at increased temperature for excess sludge dewatering: Heavy metals, volatile organic compounds and combustion characteristics of hydrochar. Chem. Eng. J. 2016, 297, 1–10. [Google Scholar] [CrossRef]
- Fu, J.; Chen, Z.; Wang, M.; Liu, S.; Zhang, J.; Zhang, J.; Han, R.; Xu, Q. Adsorption of methylene blue by a high-efficiency adsorbent (polydopamine microspheres): Kinetics, isotherm, thermodynamics and mechanism analysis. Chem. Eng. J. 2015, 259, 53–61. [Google Scholar] [CrossRef]
- Chen, L.; Bai, B. Equilibrium, kinetic, thermodynamic, and in situ regeneration studies about methylene blue adsorption by the raspberry-like TiO2@yeast microspheres. Ind. Eng. Chem. Res. 2013, 52, 15568–15577. [Google Scholar] [CrossRef]
- Pathania, D.; Sharma, S.; Singh, P. Removal of methylene blue by adsorption onto activated carbon developed from Ficus carica bast. Arab. J. Chem. 2017, 10, S1445–S1451. [Google Scholar] [CrossRef] [Green Version]


| Samples | Mass Yield [%] | Elemental Composition (wt%, db) | Ash [%] | VM [% db] | FC [% db] | Atomic Ratio | Surface Area [m2 g−1] | ||||
|---|---|---|---|---|---|---|---|---|---|---|---|
| C [%] | H [%] | N [%] | O 1 [%] | H/C | O/C | ||||||
| Digestate | - | 25.6 | 4.0 | 3.6 | 21.9 | 45.0 | 50.2 | 4.8 | 1.88 | 0.64 | - |
| Palatable | - | 35.9 | 5.4 | 5.8 | 24.4 | 28.4 | 65.6 | 5.9 | 1.81 | 0.51 | - |
| Mixture | - | 34.4 2 | 5.2 2 | 5.5 2 | 24.1 | 30.8 | 63.4 | 5.7 | 1.81 | 0.53 | - |
| 190HC | 83.3 | 26.9 | 5.1 | 3.0 | 20.5 | 44.5 | 55.2 | 0.3 | 2.28 | 0.57 | 31.00 |
| 220HC | 76.3 | 28.2 | 4.0 | 1.8 | 18.5 | 47.5 | 52.4 | 0.1 | 1.70 | 0.49 | 8.82 |
| 250HC | 62.9 | 36.3 | 5.0 | 5.0 | 8.7 | 45.0 | 54.9 | 0.1 | 1.65 | 0.17 | 11.85 |
| 190MHC | 51.5 | 29.4 | 4.1 | 1.9 | 15.8 | 48.8 | 51.1 | 0.1 | 1.67 | 0.40 | 0.29 |
| 220MHC | 71.2 | 33.6 | 4.4 | 3.0 | 9.5 | 49.5 | 50.0 | 0.5 | 1.57 | 0.20 | 2.74 |
| 250MHC | 84.7 | 30.6 | 4.0 | 2.1 | 11.2 | 52.1 | 45.3 | 2.6 | 1.57 | 0.27 | 13.36 |
| Samples | Langmuir Equation | Freundlich Equation | Tempkin Equation | ||||||
|---|---|---|---|---|---|---|---|---|---|
| qm (mg g−1) | KL (L mg−1) | R2 | KF (L mg−1) | n | R2 | B | K (L g−1) | R2 | |
| 190HC | 70.51 | 0.05 | 0.9923 | 5.78 | 5.81 | 0.9151 | 12.49 | 1.20 | 0.9589 |
| 220HC | 54.29 | 0.38 | 0.9676 | 9.74 | 2.44 | 0.7733 | 8.78 | 6.12 | 0.7122 |
| 250HC | 37.64 | 0.14 | 0.9845 | 5.83 | 2.52 | 0.7659 | 6.43 | 2.57 | 0.7801 |
| 190MHC | 247.06 | 0.01 | 0.1237 | 3.60 | 1.24 | 0.8000 | 34.51 | 0.17 | 0.8201 |
| 220MHC | 140.13 | 0.06 | 0.8694 | 10.74 | 1.45 | 0.9412 | 29.35 | 0.70 | 0.9525 |
| 250MHC | 203.16 | 0.07 | 0.4208 | 13.89 | 1.21 | 0.8156 | 36.36 | 0.98 | 0.8823 |
| Sample | Pseudo First-Order | Pseudo Second-Order | ||||
|---|---|---|---|---|---|---|
| qe (mg g−1) | k1 (min−1) | R2 | qe (mg g−1) | k2 (g mg−1 min−1) | R2 | |
| 190HC | 22.46 | 0.0125 | 0.8897 | 42.15 | 0.0041 | 0.9997 |
| 220HC | 21.18 | 0.0053 | 0.9378 | 41.56 | 0.0008 | 0.9990 |
| 250HC | 24.94 | 0.0021 | 0.8783 | 36.65 | 0.0003 | 0.9631 |
| 190MHC | 4.79 | 0.0390 | 0.3351 | 49.54 | −0.0080 | 0.9999 |
| 220MHC | 13.03 | 0.0740 | 0.7815 | 52.56 | 0.0190 | 0.9999 |
| 250MHC | 37.95 | 0.0310 | 0.9501 | 52.01 | 0.0030 | 0.9998 |
© 2020 by the authors. Licensee MDPI, Basel, Switzerland. This article is an open access article distributed under the terms and conditions of the Creative Commons Attribution (CC BY) license (http://creativecommons.org/licenses/by/4.0/).
Share and Cite
Ferrentino, R.; Ceccato, R.; Marchetti, V.; Andreottola, G.; Fiori, L. Sewage Sludge Hydrochar: An Option for Removal of Methylene Blue from Wastewater. Appl. Sci. 2020, 10, 3445. https://doi.org/10.3390/app10103445
Ferrentino R, Ceccato R, Marchetti V, Andreottola G, Fiori L. Sewage Sludge Hydrochar: An Option for Removal of Methylene Blue from Wastewater. Applied Sciences. 2020; 10(10):3445. https://doi.org/10.3390/app10103445
Chicago/Turabian StyleFerrentino, Roberta, Riccardo Ceccato, Valentina Marchetti, Gianni Andreottola, and Luca Fiori. 2020. "Sewage Sludge Hydrochar: An Option for Removal of Methylene Blue from Wastewater" Applied Sciences 10, no. 10: 3445. https://doi.org/10.3390/app10103445
APA StyleFerrentino, R., Ceccato, R., Marchetti, V., Andreottola, G., & Fiori, L. (2020). Sewage Sludge Hydrochar: An Option for Removal of Methylene Blue from Wastewater. Applied Sciences, 10(10), 3445. https://doi.org/10.3390/app10103445