Article

A Fine Fast Acquisition Scheme for a Communication and Navigation Fusion System

School of Electronic Engineering, Beijing University of Posts and Telecommunications, Beijing 100876, China
*
Author to whom correspondence should be addressed.
Appl. Sci. 2020, 10(10), 3434; https://doi.org/10.3390/app10103434
Submission received: 13 February 2020 / Revised: 24 April 2020 / Accepted: 6 May 2020 / Published: 15 May 2020
(This article belongs to the Special Issue Indoor Localization Systems: Latest Advances and Prospects)

Abstract

:
A novel communication and navigation fusion system (CNFS) based on cellular communication system is developed to realize high-accuracy localization. Because of the small signal coverage of every transmitter and the fluctuation of received signal and noise, the CNFS positioning receiver requires fast processing of signal and stable performance. As the first operation performed by receiver, signal acquisition with fast speed and stable detection performance should be realized. This paper proposed a novel fast acquisition method with fine detection performance using search space reduction (SSR) and DD-MAX/TC-CACFAR techniques. SSR method is utilized to reduce the size and number of search space in the cross ambiguity function (CAF) evaluation stage. DD-MAX/TC-CACFAR method is employed to realize fine and stable detection performance in signal detection stage. The expressions of acquisition time are then derived considering the size and number of search space and the detection performance. Theoretical performance analysis and Monte Carlo simulation, which contain the comparison with other acquisition method, are presented to demonstrate the effectiveness of proposed method. Simulation and analysis results show that the proposed method can realize fast acquisition with fine and stable detection performance.

1. Introduction

The global navigation satellite systems (GNSS) provides accurate outdoor positioning and timing information for both military and civilian applications as the most widely used navigation system. However, there is no prevailing technology for GNSS-deprived areas such as urban canyons and indoor environments, where satellite signals are severely attenuated or blocked [1,2,3]. The ubiquity of cellular communication networks provides widely signal coverage, which can be used for positioning purposes to be a complementary solution in GNSS-deprived areas [4]. The fundamental positioning techniques utilized in cellular networks are classified as proximity, angle of arrival (AOA), signal strength, and signal propagation time [3]. These techniques have several typical applications in cellular networks from 1G to 5G such as the enhanced 911 (E911) location requirements and positioning reference signal (PRS) developed in 4G system [5,6]. However, the poor positioning accuracy of these applications cannot meet the development of location-based service (LBS) requirements [7,8].
CNFS is developed to realize high-accuracy localization in constrained conditions based on signal propagation time technique. CNFS multiplexes the communication and navigation signal in the same frequency band and allocates different power levels for the two signals. This superposition technique has been applied in China’s mobile multimedia broadcasting (CMMB) system for fine outdoor and indoor localization [9,10,11,12]. Direct-sequence spread spectrum code division multiple access (DSSS-CDMA) system employing binary phase-shift keying (BPSK) modulation is used in the positioning system in CNFS. Signal propagation time, typically represented by time difference of arrival (TDOA) or time of arrival (TOA), is estimated by exploiting the correlation properties of the pseudorandom noise (PRN) sequences.
As with GNSS positioning receiver, the first operation performed by a CNFS positioning receiver is the signal acquisition, which can provide a rough estimation of the signal transmitted by the fusion signal transmitter. Signal transmitters of cellular network have dense distribution but a very small signal coverage of every transmitter, which leads to high demands on the speed of signal processing. Meanwhile, the distribution property and complex environments cause huge power differences of receiver received signals from different transmitters, and then cause the fluctuation of detection performance in acquisition stage. Fluctuation in detection performance means an increase in probability of false alarm (PFA). The positioning receiver usually takes a long time, which is defined as false alarm penalty time (FAPT), to re-enter the acquisition status if false alarm occurs [13,14,15]. This additional FAPT significantly increases the mean acquisition time (MAT). On the other hand, signal acquisition is the most time-consuming procedure in the signal processing of positioning receiver and has a significant impact on the time to first fix (TTFF) [15]. Therefore, it is important to realize a fast and stable acquisition in CNFS.
Typical acquisition system for DSSS-CDMA applications described in literature [16,17,18,19] are based on the evaluation and processing of the CAF. Some undesired components such as noise and interference degrade the readability of the CAF so further processing is needed. The whole procedure of acquisition can be split into two main specific aspects: the CAF evaluation and the signal detection. In order to realize fast and stable acquisition, a number of techniques have been utilized based on either or both the two aspects.
Serial search, parallel search and the hybrid of both are the basic search techniques to test every hypothesis in the 2D search space. Serial search confirms the hypothesis with lowest computational load but longest time consumption [20,21]. Parallel search can be realized using fast Fourier transform (FFT) or massive parallel correlators but the drawback of huge resource consumption cannot be avoided [22,23,24]. The time spent in testing a cell is usually identified as dwell time, and multiple dwell techniques are utilized to reduce MAT. Typical double dwell (DD) structure divides the acquisition into two stages: coarse acquisition stage and fine acquisition stage. Different search steps, integration method (coherent, non-coherent) or integration time are utilized in different dwell stage [14,16,25,26,27,28]. Folding and dual folding techniques are proposed in [15] to reduce the code phase search space by folding the receiver replica PRN code and the incoming signal, and the correlation is performed using FFT. However, the improvement of MAT (decreases) is at the expense of lower signal to noise ratio (SNR). Reference [25] uses compressed sensing (CS) technique in acquisition, which can exploit the sparsity of received GNSS signal and reduce the number of required correlators. Two-dimensional compressed correlator (TDCC) is introduced in [26,27] to compress the code phase and frequency search space by coherently combining the signal energy in the neighboring hypotheses. However, the SNR loss is also inevitable as the compression rate increases.
The detection strategies are chosen so as to optimize some performance metrics such as MAT and PFA [13,14,17,29,30]. Constant false alarm rate (CFAR) algorithm and its effect on reducing the MAT are analyzed in literature [13]. Reference [29] adds threshold generation mode (TM) in DD serial search to obtain optimal threshold. However, the threshold crossing (TC) detection strategy used in both studies have worse detection performance than MAX criterion. Reference [14] combines the MAX criterion and threshold crossing (TC) criterion to realize a trade-off between detection performance, hardware complexity and acquisition time, which is called MAX/TC criterion. Reference [17] uses Bayesian approach to realize fine acquisition strategy but the prior probability of each cell in search space is needed. MAX/TC criteria is applied in DD structure and the influence of different integration is analyzed in literature [30]. However, the influence of a different threshold is not analyzed.
The search space size reduction techniques mentioned above has its limitation if they are directly applied in CNFS. Compared with GNSS, the signal transmitter used in CNFS has a definite position which can benefit search space size reduction. On the other hand, the choice of detection strategies should consider the fluctuation of background interference, which causes the fluctuation of PFA and increases MAT significantly.
In this paper, a novel fast acquisition method based on search space reduction (SSR) and DD-MAX/TC-CACFAR is proposed to realize fast acquisition with fine performance. Firstly, in the CAF evaluation stage, the SSR method reduces search space size and number based on adjacent transmitter information (ATI) and code phase prior information (CPPI). The ATI is obtained from the new designed navigation message or the server. The CPPI is obtained from the acquisition result of the PRN code which has been acquired. The coarse-to-fine double dwell structure is utilized to obtain accuracy frequency estimation without causing the increase of search space size. Secondly, in the signal detection stage, a novel detection strategy is used to realize fine detection performance. The MAX/TC criterion together with cell-averaging CFAR (CACFAR) is performed in double dwell structure, which is called DD-MAX/TC-CACFAR method. Therefore, the CNFS positioning receiver can have fine and stable detection performance when there is fluctuation of noise, which can also effectively reduce MAT. Comparative simulations and experiments indicate the superiority of the proposed method. Different performance corresponding to different parameters of the proposed detection strategy is firstly analyzed and comparisons with exists strategies are given. MAT is then analyzed and compared with other methods.
The rest of this paper is organized as follows: Section 2 gives the introduction of CNFS system and the basic acquisition procedure which contains CAF evaluation and signal detection. Section 3 gives the detailed description of the proposed fast acquisition method and Section 4 gives the analysis of acquisition time. Comparative simulations and performance analysis are performed to verify the proposed method on detection performance and acquisition time in Section 5. Section 6 presents the conclusions.

2. System Model and Acquisition Method

2.1. System Model

The positioning part in CNFS is a DSSS-CDMA system whose navigation message is modulated onto the PRN code by employing BPSK modulation. The signal transmitter of CNFS is called fusion signal base station (FSBS) which can be realized by adding a positioning signal generator in the communication base station as shown in Figure 1. The communication and positioning signal are transmitted in the same frequency band and allocate different power levels as described above. Therefore, the interference of positioning signal to communication signal can be avoided by keeping the positioning signal transmitted with lower power. The power difference is at least −18 dB based on a large number of experiments. When the duplexing mode of communication system is frequency division duplexing (FDD), the superposed CNFS positioning signal can be transmitted continuously in the downlink frequency band of communication signal. The fusion signal transmitted by FSBS can be expressed as Equations (1) and (2) below
s ( i ) ( t ) = s OFDM ( i ) ( t ) + s P ( i ) ( t )
s P ( i ) ( t ) = d ( i ) ( t ) c ( i ) ( t ) cos ( 2 π f c t + φ )
where s ( i ) ( t ) indicates the downlink fusion signal, s OFDM ( i ) ( t ) indicates the downlink communication signal and s P ( i ) ( t ) indicates the CNFS positioning signal. d ( i ) ( t ) represents the navigation message, c ( i ) ( t ) denotes the PRN code, f c is the carrier frequency and φ is initial carrier phase. Interference cancellation (IC) technique is used to reduce the interference of communication signal to the positioning signal. Therefore, we focus on the CNFS positioning signal s P ( i ) ( t ) and ignore the impact of communication signal in the following analysis.
The characteristics of the FSBS mean that the positioning system share the same network topology as the communication system. The typical cellular network is as shown in Figure 2 CNFS positioning signal can realize multiple coverage in this network based on several weak signal processing techniques [31,32]. Besides this typical cellular network, different topology is applied according to different environments. The position of signal transmitters remains constant and the distance between two transmitters is small compared with the distance between satellites in GNSS system. These characteristics give the opportunity to realize fast acquisition in CNFS positioning receiver.

2.2. Acquisition Method

2.2.1. CAF Evaluation

CAF evaluation is the stage where the CAF is generated and processed. The radio frequency front end of CNFS positioning receiver firstly receives CNFS positioning signal and converts it to an intermediate frequency (IF) signal. The analog-to-digital converter (ADC) module is then utilized to realize the sampling of IF signal. Therefore, the received signal in discrete time domain can be expressed in the complex form as
r ( n ) = i = 1 N BS A ( i ) d ( i ) ( nT s ) c ( i ) ( nT s ) e j ( 2 π ( f IF + f d ( i ) ) nT s + φ 0 ( i ) ) + v ( nT s )
where N BS is the total number of FSBS signal received, T s denotes the sampling duration, A is the amplitude of the signal, c ( nT s ) is the PRN code utilized in CNFS, d ( nT s ) is the navigation message, f IF is the intermediate frequency, f d is the Doppler frequency, φ 0 is the initial phase of the carrier and v ( nT s ) is the additive white Gaussian noise (AWGN) with one-sided power spectral density (PSD) of N 0 .
Generally, CAF evaluation techniques used inside the receivers are based on the matched filter method or cyclic correlation method in time domain, or fast Fourier transform (FFT) method in frequency domain [33]. They give the same (or nearly the same) results and the choice of these methods mainly depends on the implementation of receiver hardware and software. Figure 3 gives the structure of match filter method. The received signal r ( n ) is multiplied by two orthogonal sinusoids at different frequency and two branches of signal are generated, which are called in-phase and quadrature branches. The two signals are then multiplied by local replica code at different code ID or different delay. Coherent and non-coherent integration are used to improve the SNR of processed signal. For the convenience of analysis, only one FSBS signal is considered. The FFT based parallel acquisition approach in time domain uses FFT and Invert FFT (IFFT) to realize the correlation between received and local PRN code. PMF-FFT method combines the partial match filter (PMF) and FFT module, whose structure is shown in Figure 4. The integration result P MF ( τ e , f e ) and P PMF FFT ( τ e , f e ) can be expressed as Equations (4) and (5).
P MF ( τ e , f e ) = 1 N nc i = 1 N nc a 2 sin c 2 ( f e T coh ) R 2 ( τ e ) + v p ( n )
P PMF FFT ( τ e , f e ) = 1 N nc i = 1 N nc a 2 ( sin ( π f e PT s ) sin ( π f e NPT s π kN / F ) sin ( π f e T s ) sin ( π f e PT s π k / F ) ) 2 R 2 ( τ e ) + v p ( n )
R ( τ e ) = { 1 | τ e | / T c , 0 , | τ e | < T c others
f e = f IF + f d f l ,   τ e = τ τ l
where τ e is the difference between received signal delay τ and local replica code delay τ l , f e is the difference between received signal carrier frequency f IF + f d and local generated sinusoids frequency f l , N nc is the number of data summed in non-coherent integration (NCT) calculation, a is the signal amplitude. T coh is the coherent integration time (CIT), v p ( n ) is noise component with power σ n 2 after integration process, P is the length of partial match filter, N is the number of partial match filter, F is the length of FFT operation, and k indicates the index of FFT output. R ( τ e ) is the coherent integration result of code in received signal with local replica code, T c is the chip duration of the PRN code. If the code in the received signal is the same as local replica code, R ( τ e ) is called autocorrelation function which can be expressed as Equation (6).
f l = f d , min + i f ,   i = 1 , 2 , , S f
τ l = τ min + j τ ,   j = 1 , 2 , , S c
The CAF results defined over a bi-dimensional grid that is usually referred to as the search space. Equations (4)–(6) indicates that CAF P MF ( 0 , 0 ) or P PMF FFT ( 0 , 0 ) have biggest value. Therefore, positioning receiver can obtain the coarse estimation of f d and τ by testing CAF values corresponding to different f l and τ l . Besides the difference in hardware implementation, the difference between match filter method and PMF-FFT method in CAF value is the power attenuation caused by frequency bias and the picket fence effect of FFT. The proposed method in this paper focuses on the search space reduction and the improvement of detection strategy. Therefore, the differences of CAF evaluation methods have no influence on the analysis of the proposed method.
Figure 5 is the schematic diagram of search space. The size of search space ( S f × S c ) is defined based on several factors such as the period of PRN code and receiver possible kinstate. Generally speaking, the search space needs to traverse all code phase in one code period and Doppler frequency corresponding to maximum relative speed between receiver and base station. The number of bi-dimensional search space generally depends on all code ID used in CNFS system.
The size and the number of search space have significant impact on acquisition time. Smaller size and number lead to shorter acquisition time. Multiple dwell technique can be used to reduce the search space size and number. Double dwell is taken as an example. first dwell gives the coarse estimation with big search size while second dwell gives the fine estimation. On the other hand, in the signal detection stage, the existence of interference may lead to poor detection performance, which leads to longer acquisition time. Coherent and non-coherent integration are commonly used to improve the SNR, and a fine detection strategy is also utilized to improve the detection performance.

2.2.2. Signal Detection

Once the CAF is evaluated, the positioning receiver can make the decision regarding the presence of FSBS and give the coarse estimation of f d and τ . The MAX/TC criterion is widely used in DSSS-CDMA system to realize a trade-off between detection performance, hardware complexity, and acquisition time. The whole search space is divided into several blocks, and each block includes B f × B c cells. The blocks are tested one-by-one while the cells in a block are tested in parallel. Different CAF evaluation method described in Section 2.2.1 can realize different block size based on different hardware resources. If the maximum CAF value in a block exceeds the pre-defined threshold, the successful detection is declared. Otherwise, it moves to the next block.
The CAF value in each cell is also called detection variable. The decision of a cell is made based on two hypotheses: H0 and H1. H0-cell indicates the wrong estimation of f d and τ while H1-cell indicates the correct estimation. Block that contains H1-cell is called H1-block while others are called H0-blocks.
The statistical characteristics of detection variable in a cell are determined by CAF evaluation method and detection method. The match filter method with NCT and power detection is taken as an example hereinafter. Assuming that the random variable in H0-cell is X and the random variable in H1-cell is Y . The probability density function (PDF) of both random variables can be expressed as [13]
f X ( x ) = x N nc 1 ( 2 σ n 2 ) N nc Γ ( N nc ) e x 2 σ n 2
f Y ( y ) = 1 2 σ n 2 e y + N nc a 2 2 σ n 2 ( y σ n 2 N n a 2 ) N nc 1 2 I 0 ( a N nc y σ n 2 )
where Γ ( · ) donates the gamma function, I 0 ( · ) is the modified Bessel function of the first kind and zero order. For H1-block, there are three disjoint events: correct detection P Bd , missed detection P Bm and error (false alarm in H1-block) P Be . For H0-block, there are two disjoint events: correct rejection P Bcr , false alarm P Bfa . The probability of them can be expressed as [14]
P Bd = th f Y ( y ) [ 0 y f X ( x ) dx ] B f B c dy
P Bm = 0 th f Y ( y ) du [ 0 th f X ( x ) dx ] B f B c 1
P Be = 1 P Bd P Bm
P Bcr = [ 0 th f X ( x ) dx ] B f B c
P Bfa = 1 P Bcr
where th is the detection threshold. Different B f B c and th lead to different performance, hardware complexity, and acquisition time. Fast acquisition requires a high probability of correct detection and low PFA in H1 block and H0 block. However, the fluctuation of background noise often causes the changes in these probabilities, which may increase the acquisition time.

3. Fast Acquisition Method

Based on the analysis above, the reduction of acquisition time requires the reduction of search space and the improvement of detection performance. Therefore, a fast double dwell acquisition method based on SSR and DD-MAX/TC-CACFAR method is proposed here to realize fast acquisition in CNFS positioning receiver.

3.1. Search Space Reduction Method

The location of FSBSs are fixed, which gives CNFS positioning receiver the opportunity to obtain the prior information to reduce the size and the number of search space. Based on the characteristic of PRN code, network topology, and the requirement of area division, the number of total PRN code IDs used in the current positioning system is 64. It takes a long time to iterate through all possibilities of code ID. When the positioning receiver receives signal from a certain FSBS, the code IDs belong to adjacent FSBSs can be confirmed. In this case, the adjacent transmitter information (ATI) is provided by navigation message or server. The second frame of navigation message, where the assistant information including ATI is provided, is shown as Figure 6 below:
Several factors need to be considered such as the limitation of navigation message length, LDPC encoding requirements and the characteristic of topology. Therefore, ATI in navigation message only contains 6 code ID of adjacent FSBSs. Take a typical cellular network shown in Figure 7 as an example, receiver (red spot A) in the FSBS1 hexagon area can receive positioning signals transmitted from at least four FSBSs (FSBS1 to FSBS4). After the decoding of these navigation messages, the code IDs of FSBS5 to FSBS14 can be obtained by the positioning receiver. Assuming that receiver moves from position A to position B, signals transmitted from FSBS10 and FSBS11 should be received and processed by the receiver. Because of the ATI obtained before, the code ID search range is reduced from 64 to 10. On the other hand, all the FSBS information is stored on a server. Therefore, the ATI can also be obtained by accessing server database using mobile communication system. Besides the topology in Figure 7, specific network topology changes according to environments. CNFS also needs an indoor distribution system to realize coverage supplement in indoor environments, the network of which has no fixed topology. However, no matter how the topology changes, adjacent transmitters always exist.
Fixed location of signal transmitters in CNFS also means that the relative location between transmitters is fixed. Meanwhile, the distance between two adjacent transmitters is pretty small compared with the distance between two satellites in GNSS system. Assuming that the maximum distance between two transmitters is d BS . Considering the limitation of the acquisition sensitivity, the positioning receiver cannot receive signals transmitted from two transmitters that the distance between both is more than 3 d BS . For a DSSS-CDMA system, the delay estimation is equivalent to the code phase estimation. Therefore, the maximum code phase difference c dmax of received signal can be expressed as
c dmax = 3 d BS cT c
where c is the light speed. After the receiver realizes successful acquisition of the first signal. The code phase search range S c of the following signal can be reduced based on the code phase estimation of the acquired signal
c iR { ( c 0 c dmax ,   c 0 + c dmax ) , ( c 0 c dmax + N p τ ,   N p τ ) ( 0 ,   c 0 + c dmax ) , c 0 c dmax c 0 < c dmax
where c iR is the code phase search range of i-th signal, c 0 is the code phase estimation result of the firstly acquired signal, which is also called CPPI, N p is the chip number of one period code. If there is no CPPI available, the code phase search space size is expressed as
S c = N p τ c
After the CPPI is obtained, the code phase search space size becomes
S rc = 2 c dmax τ
Search space number and code phase search space size is reduced using ATI and CPPI. Small frequency search step is needed to obtain the required Doppler estimates. However, smaller search step causes the increase of frequency search space size. Therefore, a double dwell (DD) coarse-to-fine structure is used here to solve the problem. Coarse frequency estimation is acquired with big frequency search step. Frequency fine estimation stage with small frequency search step is then carried out to refine the Doppler estimation in second dwell to get the required accuracy before it is passed to the tracking stage.

3.2. DD-MAX/TC-CACFAR Detection Method

SSR method described above can dramatically reduce the acquisition time. However, the acquisition time is also influenced by detection performance. The decrease of probability of detection and increase of probability of false alarm cause long acquisition time. DD-MAX/TC-CACFAR detection method described in this section add adaptive threshold in MAX/TC criterion to realize stable detection performance when the background noise fluctuates.
The search space is still divided into several blocks. Detection threshold is generated based on the detection variables in cells in the block. Therefore, the threshold is also a random variable. For the convenience of description, P ( τ e , f e ) is rewritten as P k , where k is the index of CAF value in one block. The threshold can be expressed as
U = T B f B c 1 k = 1 , k k m B f B c P k
k m = max k ( P k ) , k = 1 , 2 , , B f B c
where T donates the multiple parameter. Because the maximum variable is removed in the sums, all CAF values in Equation (21) can be seen as random variable X in Equation (10). In the case, U obeys Gamma distribution with shape parameter being ( B f B c 1 ) N nc and scale parameter being 2 T σ n 2 B f B c 1 . If we set L = B f B c 1 for convenience, the PDF of U can be expressed as
f U ( u ) = = ( L ) LN nc ( 2 T σ n 2 ) LN nc Γ ( LN nc ) u LN nc 1 e Lu / 2 T σ n 2
where Γ ( ) donates the gamma function. The five probabilities: probability of correct detection P Bdi , probability of missed detection P Bmi , probability of error (false alarm in H1-block) P Bei , probability of correct rejection P Bcri , and probability of false alarm P Bfai can be expressed as
P Bdi = 0 f Y ( y ) [ 0 y f X ( x ) dx ] L 0 y f U ( u ) dudy P Bmi = 0 f U ( u ) [ 0 u f X ( x ) dx ] L 0 u f Y ( y ) dydu P Bei = 1 P Bdi P Bmi P Bcri = 0 f U ( u ) [ 0 u f X ( x ) dx ] L du P Bfai = 1 P Bcri
where different subscript i donates different detection stage. i = 1 represents first dwell coarse acquisition and i = 2 represents second dwell fine acquisition. System only declares successful acquisition when both stages realize successful detection. Therefore, the detection performance of the acquisition process can be expressed as the equation
P Bd = P Bd 1 P Bd 2 P Bm = 1 P Bd P Be P Be = P Be 1 P Be 2 P Bcr = 1 P Bfa P Bfa = P Bfa 1 P Bfa 2
This double dwell structure can effectively reduce the probability of false alarm P Bfa (probability of error P Be ). Compared with fixed threshold, the threshold in proposed DD-MAX/TC-CACFAR method can be adjusted automatically based on the background noise. The detection performance can maintain acceptable changes when there is fluctuation of background noise.

4. Derivation of Acquisition Time

The previous section discussed search space and probability characteristics of detection, which provided the fundamental parameters for the acquisition time analysis. MAT mentioned in Section 1 only consider the bi-dimensional search space, but the number of search space is not taken into account. Therefore, the MAT analyzed in this section consider three factors which are search space size, search space number and the detection performance. The derivation of MAT is based on the knowledge of Markov chain and flowchart (Mason Gain Formula).
The search process is depicted using flowchart in Figure 8. The block is represented by pie and is also called status. Code ID, code phase estimation and frequency coarse estimation is obtained in the first dwell and fine frequency estimation is obtained in the second dwell. In the first dwell, the search starts with the first block and all the blocks are tested one by one. The H1-block is located at p-th block and p is integer whose range is from 1 to N B and N B is the block number. If H1-cell in H1-block is successfully detected, the status switches into second dwell. We can assume that there is only one block in second dwell because the number of cells to be tested is dramatically reduced. Successful acquisition is declared if the H1-cell in the second dwell is successfully detected.
The transfer between two status is represented by transfer function (TF) H ( z ) or h ( z ) . The TF between two H0-blocks is represented by H 0 ( z ) which is shown in Figure 9a. Status will transfer to false alarm status when false alarm occurs. System can then detect this false alarm in tracking loop easily. The extra time spent in this process is called FAPT. The TF H 1 ( z ) from H1-block to H0-block has similar structure as shown in Figure 9b. h 1 ( z ) is the TF from H1-block in second dwell to the H0-block next to H1-block in first dwell. All the TF is expressed as the equation below:
H Bd ( z ) = P Bd 1 z t 1 , h Bd ( z ) = P Bd 2 z t 2 H Bm ( z ) = P Bm 1 z t 1 , h Bm ( z ) = P Bm 2 z t 2 H Be ( z ) = P Be 1 z t 1 , h Be ( z ) = P Be 2 z t 2 H Bcr ( z ) = P Bcr 1 z t 1 ,   h Bcr ( z ) = P Bcr 2 z t 2 H Bfa ( z ) = P Bfa 1 z t 1 , h Bfa ( z ) = P Bfa 2 z t 2 H p ( z ) = z t p H 0 ( z ) = H Bcr ( z ) + H Bfa ( z ) ( h Bcr + h Bfa ( z ) H p ( z ) ) H 1 ( z ) = H Bm ( z ) + H Be ( z ) ( h Bcr ( z ) + h Bfa ( z ) H p ( z ) ) h 1 ( z ) = h Bm ( z ) + h Be ( z ) H p ( z )
where P Bd 1 , P Bm 1 , and P Be 1 donate the probability of block detection, block miss detection and block error in the first dwell, P Bd 2 , P Bm 2 , and P Be 2 donate the corresponding probability in the second dwell, t 1 and t 2 is the dwell time in first and second dwell, t p is the FAPT.
The search can start at any block, and the TF from the beginning to acquisition status is given as
F 1 ( z ) = H D ( z ) 1 H S ( z ) H 0 N B 1 ( z ) i = 1 N B π i H 0 N B i ( z )
H D ( z ) = H Bd ( z ) h Bd ( z )
H S ( z ) = H 1 ( z ) + H Bd ( z ) [ h Bm ( z ) + h Be ( z ) H p ( z ) ]
where π i is the probability information about the beginning of the search. It is reasonable to assume that π i = 1 / N B . Then, Equation (27) can be rewritten as
F 1 ( z ) = H D ( z ) ( 1 H 0 N B ( z ) ) N B ( 1 H S ( z ) H 0 N B 1 ( z ) ) ( 1 H 0 ( z ) )
The time taken ( T ¯ 1 ) for the search space which has H1-block (H1-SS) can be obtained by calculating derivative of the TF in Equation (30)
T ¯ 1 = [ dF 1 ( z ) dz ] z = 1 = 1 H D ( 1 ) [ H D ( 1 ) + H S ( 1 ) + ( N B 1 ) H 0 ( 1 ) ( 1 H D ( 1 ) 2 ) ] = 1 P Bd [ t 1 ( 1 + P A ) + t 2 ( P Be 1 + P Bd 1 + P A P Bfa 1 ) + t p ( P Be 1 P Bfa 2 + P Bd 1 P Be 2 + P A P Bfa ) ]
P A = ( N B 1 ) ( 1 P Bd 2 )
If the H1-SS is the first H1-SS with successful acquisition, the block number N B is obtained according to the Equation (31)
N B = S f S c B f B c
Acquisition module can reduce the code phase search space size using CPPI after the first code successfully acquired. Therefore, the block number N B and the acquisition time T ¯ 1 taken for the following H1-SS can be expressed as
N rB = S f S rc B f B c
T ¯ r 1 = 1 P Bd [ t 1 ( 1 + P rA ) + t 2 ( P Be 1 + P Bd 1 + P rA P Bfa 1 ) + t p ( P Be 1 P Bfa 2 + P Bd 1 P Be 2 + P rA P Bfa ) ]
P rA = ( N rB 1 ) ( 1 P Bd 2 )
For the search space where all blocks are H0-blocks (H0-SS), the time taken with and without CPPI can be expressed as
T ¯ 0 = N B ( t 1 + P Bfa 1 t 2 + P Bfa t p ) T ¯ r 0 = N rB ( t 1 + P Bfa 1 t 2 + P Bfa t p )
The positioning receiver tests every search spaces one by one until all available search spaces are tested. The positioning results can be given as soon as N A ( N A 4 ) PRN codes are successfully detected and tracking. MAT is defined as the time taken for successfully acquiring N A PRN codes. Assuming there are N S PRN codes after SSR method, the worst case is that all N S search spaces are tested until N A PRN codes are successfully detected and tracked, and the best case is that the first N A search spaces are H1-SSs. Before the first H1-SS is detected, the time taken in every search space is T ¯ 0 . Once the first successfully acquisition shows up, the time taken in every search space becomes T ¯ r 1 or T ¯ r 0 because of the CPPI. Suppose that, among all N S search spaces, the first H1-SS is the i-th search space and the N A -th H1-SS is the j-th search space, the acquisition time corresponding to this case can be expressed as
T ( i , j ) = ( i 1 ) T ¯ 0 + ( j i N A + 1 ) T ¯ r 0 + T ¯ 1 + ( N A 1 ) T ¯ r 1
Each search space can be H1-SS with equal probability among all N S search spaces. Based on the analysis above, the MAT can be expressed as
T ¯ acq = i = 1 N S N A + 1 [ j = i + N A 1 N S C j i 1 N A 2 C N S N A T ( i , j ) ]
Equation (39) indicates that factors including search space number N S , block number N B , dwell time t 1 and t 2 , FAPT t p and detection performance have impact on MAT. SSR method introduced in Section 3.1 dramatically reduces the search space number and block number. DD-MAX/TC-CACFAR method introduced in Section 3.2 can effectively improve the detection performance to reduce the MAT.

5. Simulation Results and Analysis

5.1. Experimental Platform and Parameters Setting

In order to verify the performance of proposed method and explore the relationship between parameters and the MAT, Monte Carlo simulations are utilized for the evaluation. The CNFS positioning signal is transmitted by FSBS positioning signal generator, which is shown in Figure 10a. Different FSBS positioning signal generators realize the synchronization using atomic clock. MATLAB software is used to analyze the detection performance and the acquisition time based on the data collected by signal collector as shown in Figure 10b. The effect of SSR method changes according to the different network topology. According to the analysis in Section 3.1, the number of signals received and the network topology influence the number of PRN code ID in the ATI that the positioning receiver obtained. The network topology, especially the distance between FSBSs, influences the CPPI. In order to give comprehensive evaluation, The PRN code ID and the relative delay of the transmitted signal are adjusted to simulate the actual scenarios.
The values of parameters are shown in Table 1. Equations (4) and (5) indicates that the tolerance of frequency error is influenced by CIT. Therefore, the frequency search step and CIT are negatively correlated. Because of the existence of data bit transition, the most common choice of CIT is half the data bit duration. The frequency error f e is set to the maximum possible, which is the half of frequency search step. The parameters stay unchanged unless there are specific instructions for performance study corresponding to different value of parameters. Match filter method is used here to generate the CAF. As described in Section 2.2.1, different CAF evaluation methods differ in terms of the attenuation of integration and hardware implementation. If the difference in hardware implementation such as the hardware resource consumption is not considered, the impact of different CAF evaluation methods on the performance of the proposed method is reflected in the impact on SNR of processed signal and the block size. Therefore, the proposed method can be analyzed effectively and comprehensively without testing all CAF evaluation methods as long as different SNR and block size are taken into consideration. The methods for comparison also focus on the search space reduction and the improvement of detection strategy. The comparisons are effective as long as the same CAF evaluation method is used in these methods.

5.2. Performanc Analysis

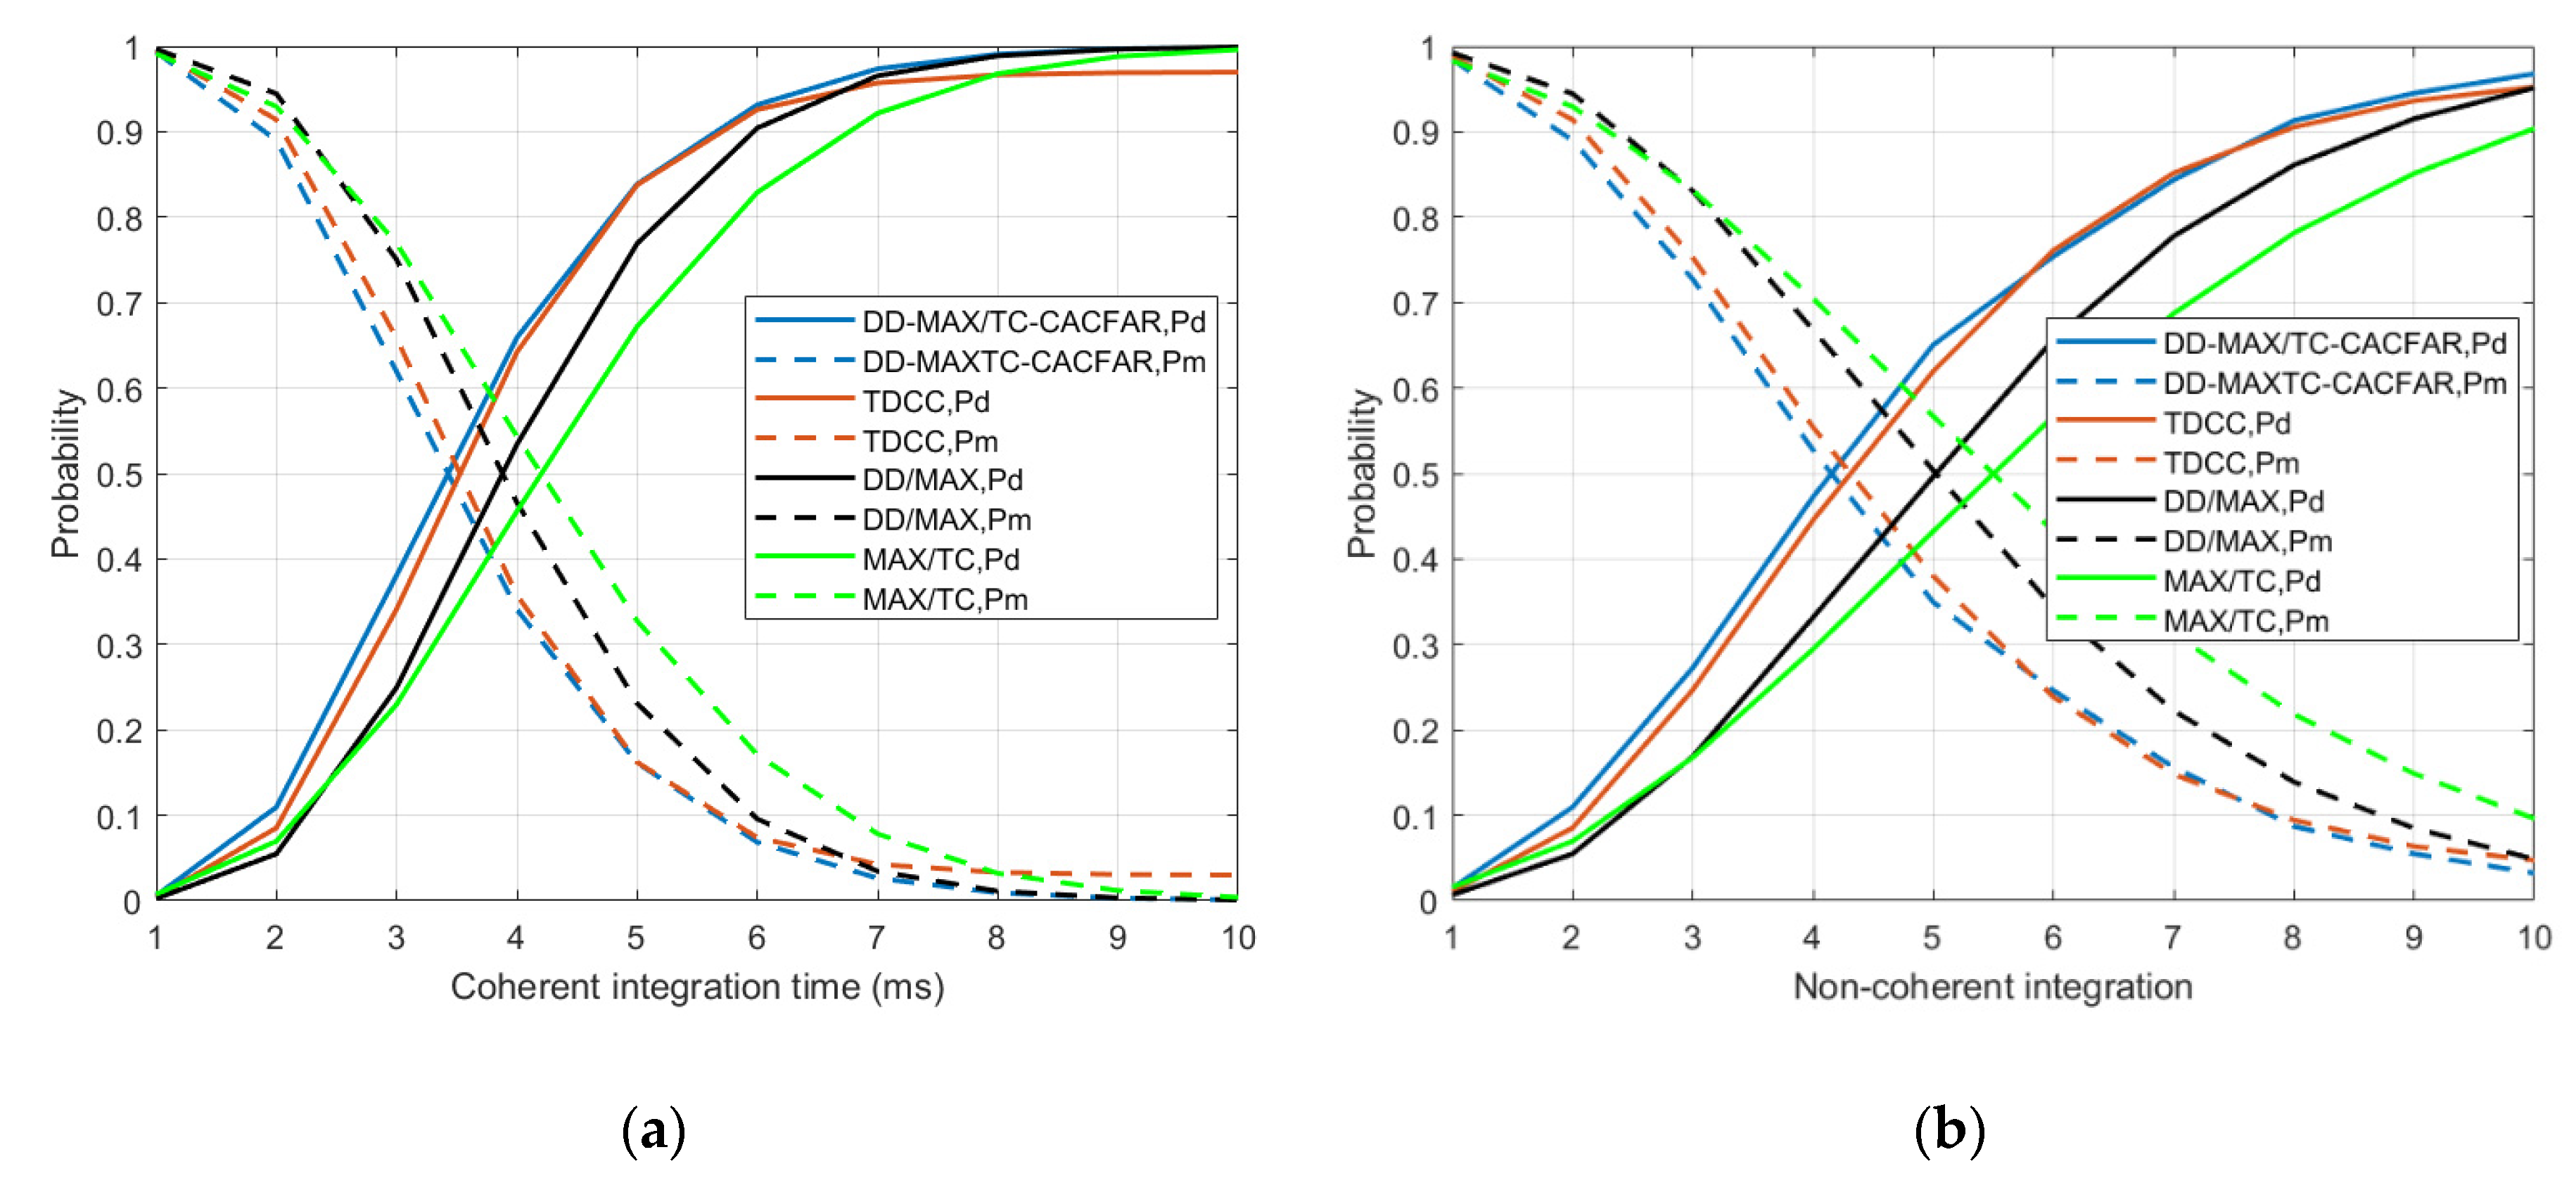
5.2.1. Detection Performance

The threshold in DD-MAX/TC-CACFAR method can be adjusted adaptively based on the noise power. However, the setting of multiple parameter T can still influence the detection performance. Therefore, the performance of DD-MAX/TC-CACFAR method corresponding to different T is firstly analyzed. Probability of correct rejection P Bcr and probability of false alarm P Bfa in H0-block versus different multiple parameter T are shown in Figure 10. P Bcr and P Bfa are not affected by SNR and the lower bound of T can be obtained based on the requirements of both. As the multiple parameter T increases, higher P Bcr and lower P Bfa can be realized. B = B f B c and N nc also have influence on P Bcr and P Bfa . With T unchanged, an increase in B will cause the decrease of P Bcr and an increase in N nc will cause the increase of P Bcr . As a matter of fact, the choice of B mainly depends on the implementation of the receiver. The larger the B , the more hardware resources the receiver consumes. In CNFS positioning receiver, the default setting of B is 70. Though there are only two values of N nc in Figure 11, we can draw the conclusion that N nc has greater effect on P Bcr and P Bfa . Positioning receiver can meet the requirement of P Bcr and P Bfa with smaller T when a larger value of N nc is used.
Figure 12 gives the influence of multiple parameter T on probability of detection P Bd and probability of error P Bm when SNR = −36 dB. The increase of T leads to the decrease of P Bd and the increase of P Bm . NCT can improve the SNR of received signal. Therefore, P Bd can be effectively improved with larger N nc . The receiver cannot meet the requirement of P Bd 0.9 if N nc = 1 when the SNR of received signal is −36 dB. When the influence of T on P Bcr and P Bfa is taken into consideration at the same time, the value of T is limited in a certain range. Considering the situation of B = 70 and N nc = 2 , the value of T can be in the range of ( 5 , 8 ) to meet the requirement of P Bd 0.9 and P Bcr 0.99 . Though larger N nc leads to better detection performance, we cannot set the value of N nc as larger as possible because of the square loss of NCT. The influence of coherent integration, NCT, and SNR of the received signal is analyzed after.
Three other different methods— MAX/TC, DD/MAX, and TDCC method—are simulated here as the comparison [26,30]. Detection performance of TDCC method is in terms of one cell in search space while the other three methods are in terms of one block. Therefore, the corresponding probabilities in the TDCC method are rewritten as Equation (40).
P Bd = 1 B f B c th f Y ( y ) i = 1 B f B c ( 0 th f X ( x ) ) i 1 P Bm = ( 0 th f X ( x ) ) B f B c 1 0 th f Y ( y ) P Be = 1 P Bd P Bm P Bcr = ( 0 th f X ( x ) ) B f B c P Bfa = 1 P Bcr
All probabilities P Bd , P Bm , P Be , P Bcr , and P Bfa are rewritten as P d , P m , P e , P cr , and P fa for clear description in the following analysis. Figure 13 gives the ROC curves of these four methods. Because of the TC criterion, TDCC method has the worst ROC curves compared with the other three methods. TC criterion test every cell one by one, so P d decrease seriously when P fa is high enough. All methods except MAX/TC use double dwell technique, which can effectively reduce P fa by performing tests twice. However, this double dwell structure cannot compensate the weakness of TC criterion used in TDCC method. When the received signal has a higher SNR, the detection performance can be effectively improved using double dwell structure. However, this technique also causes lower P d when the SNR of received signal is low enough. DD/MAX method adds double dwell technique in MAX/TC method. Therefore, DD/MAX method has better performance than MAX/TC method. However, DD/MAX has lower P d when P fa is high enough compared with MAX/TC method. DD-MAX/TC-CACFAR gives better performance than DD/MAX method because of the CACFAR technique and the coarse-to-fine structure utilized. Equation (4) indicates that smaller frequency estimation error leads to smaller attenuation. The first dwell of these two methods has similar detection performance while the second dwell of the DD-MAX/TC-CACFAR method has smaller integration gain loss, which is about 2 dB according to the parameters described above.
Figure 14 shows the P d , P m , and P fa of these methods versus SNR. The two figures realize different SNR by two approaches. Figure 14a changes signal power while Figure 14b changes noise power. P fa remains 0.001 in Figure 14a for the comparison of P d and P m under different SNR environments. The DD-MAX/TC-CACFAR method has higher P d compared with the other three method. Figure 14b shows the advantage of the CACFAR technique utilized in DD-MAX/TC-CACFAR method. The detection threshold in DD-MAX/TC-CACFAR and TDCC method adaptively changed based on the noise power, which ensures the constant P fa when noise power changes. Therefore, P fa of DD-MAX/TC-CACFAR and TDCC method remains the value of 0.001. The fixed threshold used in the other two methods cause the huge change of P fa . DD/MAX and MAX/TC methods can have smaller P fa than that of DD-MAX/TC-CACFAR method and TDCC method in this situation. However, this decrease of P fa causes the decrease of P d . Therefore, a constant false alarm is especially important when the noise power fluctuates.
Figure 15 shows the influence of coherent and non-coherent integration. Both can effectively improve the P d . On the other hand, the frequency error loss and square loss of CIT and NCT becomes bigger as with large CIT and NCT. The effect becomes smaller when CIT or NCT is large enough. In practical applications, the choice of CIT and NCT requires consideration of other factors such as the sensitivity requirements, receiver hardware resources, and data bit transition.
Analysis above shows that the DD-MAC/TC-CACFAR method can realize a high probability of detection and stable low probability of false alarm (probability of error), which can effectively reduce MAT.

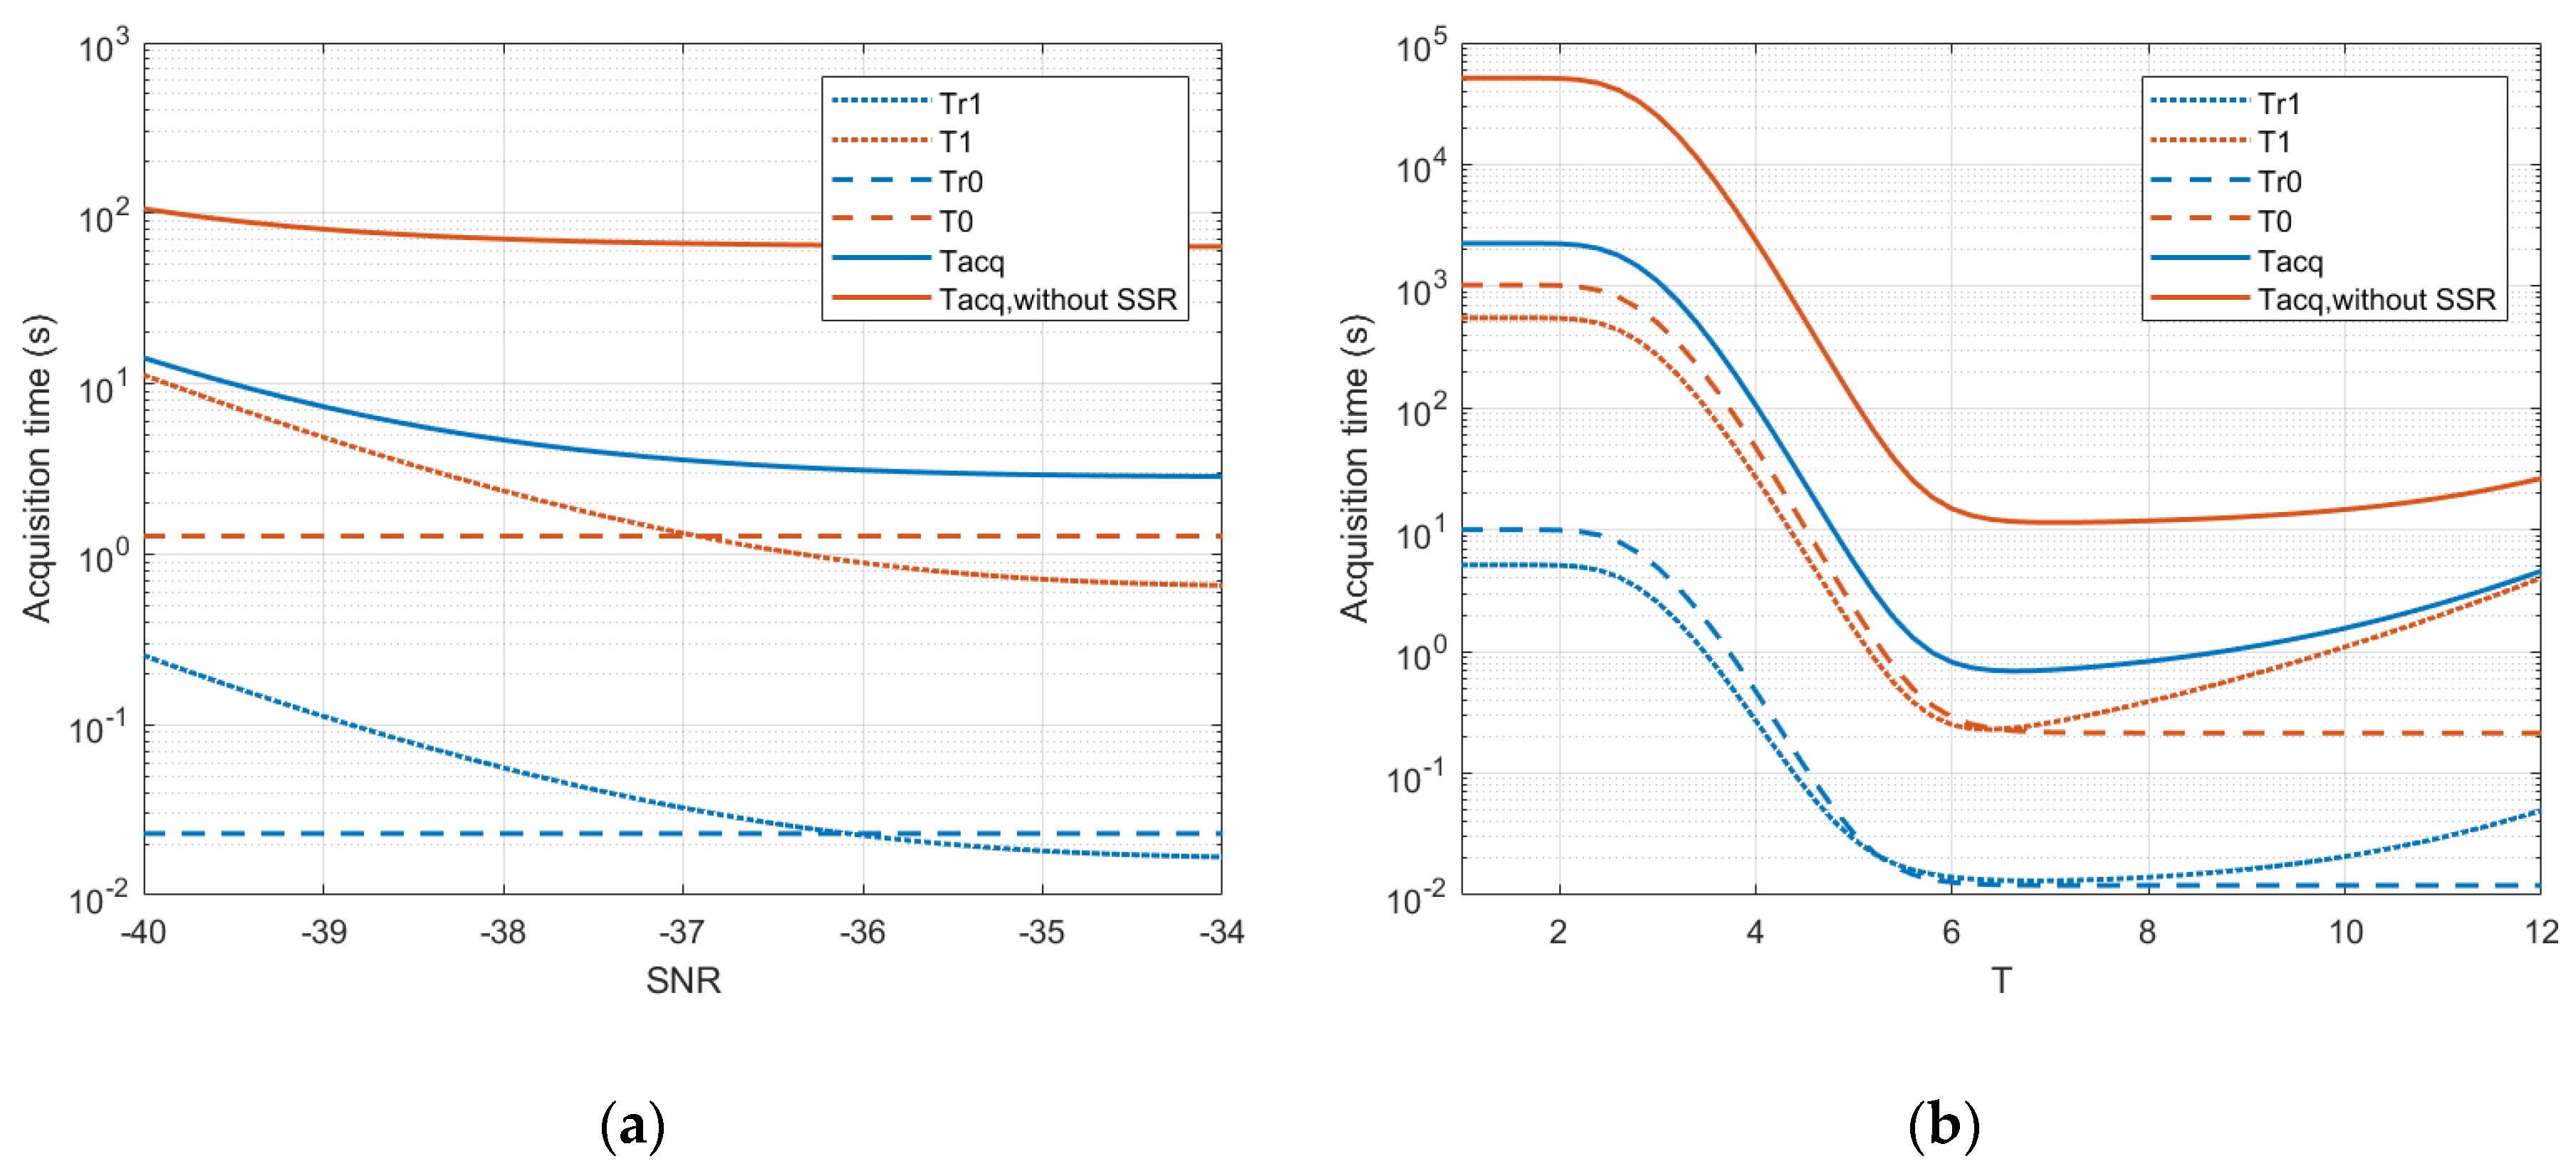
5.2.2. Acquisition Time Analysis

The proposed SSR method uses ATI and CPPI to reduce search space number N S and block number N B . The number of adjacent FSBSs is related to the signals received. Limited by the signal power transmitted by FSBS and the sensitivity of positioning receiver, the positioning receiver receives up to 7 signals from different base stations in general. The number of adjacent FSBSs is listed in Table 2. Compared with the situation without ATI, the search space number is reduced from 64 to at least 12.
The code phase search step and the chip number in one period of PRN code indicates that the original size of code phase search space is 20,460. Chip duration is about 30 m. Maximum distance d BS between FSBSs is less than 1000 m due to the limitation of the signal power transmitted by FSBS and the sensitivity of positioning receiver. Therefore, the maximum relative code phase difference of signal transmitted by FSBSs positioning signal generator is less than 103 based on Equation (17). Considering the code phase in one positioning signal as the code phase baseline, the relative code phase differences of the signals transmitted by other generators are set to random numbers in this range. Based on the analysis in Section 3.1, the code phase search space size becomes 206. In this case, the new search space size is shown in Table 3 below. The block number is reduced from 2046 to 21.
Monte Carlo simulations are utilized to evaluation the effect of proposed method on acquisition time. The effect of SSR method on acquisition time is shown in Figure 16. “Tr1”, “T1”, “Tr0”, “T0”, and “Tacq” in the legend indicate T ¯ r 1 , T ¯ 1 , T ¯ r 0 , T ¯ 0 , and T ¯ acq in Equations (31), (35), (37), and (39) in the following figures. Figure 16a gives the time taken for H1-SS, H0-SS and all search spaces with and without SSR method versus SNR. Figure 16b gives the comparison versus multiple parameter T . Because of the significant reduce of search space size and number, time taken for H1-SS, H0-SS, and MAT is effectively reduced. The MAT has about 10 times reduction. Different multiple parameter T leads to different acquisition time. When T is smaller than about 6, MAT is dominated by the P fa . Therefore, MAT can be reduced as the T increases. MAT is dominated by large P m and small P d when T is bigger than 6. Acquisition time grows faster as the T becomes bigger. The choice of T requires consideration based on the detection performance in Figure 11, Figure 12 and the acquisition time in Figure 16b. In this paper, T is set to 5.5 to realize a reasonable probability of false alarm (P_fa = 0.001) and acquisition time.
Figure 17 shows the acquisition time of four methods versus SNR, which can be analyzed together with Figure 14. The changes in signal power in Figure 17a is realized by adjusting signal transmitting power of FSBS. Because the actual power of the noise of the received signal cannot be accurately controlled, so the changes of noise power in Figure 17b is realized by adding simulative noise with different power on received signal. Because of the constant P fa of all methods in Figure 17a, the changes of acquisition time versus SNR is dominated by P d . Higher P d with higher SNR can decrease the acquisition time. MAT and the time taken for H1-SS and H0-SS of proposed method is the shortest compared with the other three methods. This advantage is realized based on the SSR method and DD-MAX/TC-CACFAR method described in Section 3. TDCC method uses compressed correlator to reduce the search space size by about 50%, which leads to shorter acquisition time than DD/MAX and MAX/TC methods. The proposed SSR method uses CPPI to reduce the search space size by about 99% and uses ATI to reduce the search space number by about 81%. DD/MAX and MAX/TC methods focus on improving the detection performance so that the MAT can also be reduced. The proposed DD-MAX/TC-CACFAR method can effectively improve the detection performance compared with the other three methods because of the utilization of double dwell coarse-to-fine technique and CACFAR technique. The high P fa of DD/MAX and MAX/TC methods in Figure 14b is the key factor leading to long acquisition time in Figure 17b when SNR is less than about −35 dB. The lower P d of DD/MAX and MAX/TC methods leads to high acquisition time compared with the other two methods when SNR is more than about −35 dB.
Figure 18 shows the influence of CIT and NCT on acquisition time. As a matter of fact, the influence of CIT and NCT is nearly the same as the influence of SNR. Acquisition time decreases as the CIT or NCT increases. On the other hand, the frequency error loss and square loss of CIT and NCT becomes bigger with larger CIT and NCT. The larger CIT and NCT require more data, which indicates more time. Therefore, time taken for H0-SS, which the increase of SNR has no effect on, increases as the CIT and NCT increase.

6. Conclusions

This paper proposed an acquisition method with short acquisition time and fine detection performance for CNFS. The size and number of search spaces is firstly reduced using SSR method in CAF evaluation stage. The ATI obtained from navigation message is used to reduce the search space number. The search space size is reduced using the CPPI obtained from the acquired signal and the double dwell coarse-to-fine structure. Then in the signal detection stage, the DD-MAX/TC-CACFAR detection method is proposed to realize fine and stable detection performance, which can also effectively reduce the acquisition time. The MAX/TC and CFAR technique is utilized in the double dwell structure. On the one hand, the double dwell structure effectively decreases the probability of false alarm. On the other hand, the CACFAR technique ensures the constant false by adjusting the detection threshold automatically when there is fluctuation of background noise. In this case, the extra time caused by FAPT can be effectively reduce so that the acquisition time can be effectively reduced. Performance analysis and simulation results show that the SSR method together with DD-MAX/TC-CACFAR method can effectively reduce the acquisition time with fine detection performance even when there is fluctuation of background noise.

Author Contributions

Conceptualization, Z.D.; Methodology, B.J.; Validation, Z.D.; Formal analysis, Z.D.; Investigation, B.J., S.T., and X.F.; Data curation, B.J., S.T., and X.F.; Writing—original draft preparation, B.J.; Writing—review and editing, B.J.; Supervision, Z.D.; Project administration, Z.D. All authors have read and agreed to the published version of the manuscript.

Funding

This research was funded by the National Key R&D Plan of China (no. 2016YFB0502001).

Conflicts of Interest

The authors declare no conflict of interest.

References

  1. Costa, E. Simulation of the Effects of Different Urban Environments on GPS Performance Using Digital Elevation Models and Building Databases. IEEE Trans. Intell. Transp. Syst. 2011, 12, 819–829. [Google Scholar] [CrossRef]
  2. Lin, T.; Ma, M.; Broumandan, A.; Lachapelle, G. Demonstration of a high sensitivity GNSS software receiver for indoor positioning. Adv. Space Res. 2013, 51, 1035–1045. [Google Scholar] [CrossRef]
  3. Laoudias, C.; Moreira, A.; Kim, S.; Lee, S.; Wirola, L.; Fischione, C. A Survey of Enabling Technologies for Network Localization, Tracking, and Navigation. IEEE Commun. Surv. Tutor. 2018, 20, 3607–3644. [Google Scholar] [CrossRef] [Green Version]
  4. Del Peral-Rosado, J.A.; Raulefs, R.; López-Salcedo, J.A.; Seco-Granados, G. Survey of Cellular Mobile Radio Localization Methods: From 1G to 5G. IEEE Commun. Surv. Tutor. 2018, 20, 1124–1148. [Google Scholar] [CrossRef]
  5. FCC. FCC Wireless 911 Requirements. Available online: https://transition.fcc.gov/pshs/services/911-services/enhanced911/archives/factsheet_requirements_012001.pdf (accessed on 20 May 2019).
  6. Chen, C.Y.; Wu, W.R. Three-Dimensional Positioning for LTE Systems. IEEE Trans. Veh. Technol. 2017, 66, 3220–3234. [Google Scholar] [CrossRef]
  7. Cherian, S.S.; Rudrapatna, A.N. LTE Location Technologies and Delivery Solutions. Bell Labs Tech. J. 2013, 18, 175–194. [Google Scholar] [CrossRef]
  8. Liu, Y.; Shi, X.F.; He, S.B.; Shi, Z.G. Prospective Positioning Architecture and Technologies in 5G Networks. IEEE Netw. 2017, 31, 115–121. [Google Scholar] [CrossRef]
  9. Mo, J.; Deng, Z.L.; Jia, B.Y.; Jiang, H.J.; Bian, X.M. A Novel FLL-Assisted PLL with Fuzzy Control for TC-OFDM Carrier Signal Tracking. IEEE Access 2018, 6, 52447–52459. [Google Scholar] [CrossRef]
  10. Deng, Z.L.; Yu, Y.P.; Yuan, X.; Wan, N.; Yang, L. Situation and Development Tendency of Indoor Positioning. China Commun. 2013, 10, 42–55. [Google Scholar] [CrossRef]
  11. Deng, Z.; Jia, B.; Tang, S.; Fu, X.; Mo, J. Fine Frequency Acquisition Scheme in Weak Signal Environment for a Communication and Navigation Fusion System. Electronics 2019, 8, 829. [Google Scholar] [CrossRef] [Green Version]
  12. Yuan, X. Research on the Key Technologies of TC-OFDM Indoor Positioning Receiver Baseband Signal Processing. Ph.D. Thesis, BUPT, Beijing, China, 2013. [Google Scholar]
  13. Oh, H.S.; Han, D.S. An adaptive double-dwell PN code acquisition system in DS-CDMA communications. Signal Process. 2005, 85, 2327–2337. [Google Scholar] [CrossRef]
  14. Corazza, G.E. On the MAX/TC criterion for code acquisition and its application to DS-SSMA systems. IEEE Trans. Commun. 1996, 44, 1173–1182. [Google Scholar] [CrossRef]
  15. Wang, K.; Jiang, R.; Li, Y.; Zhang, N. A new algorithm for fine acquisition of GPS carrier frequency. GPS Solut. 2014, 18, 581–592. [Google Scholar] [CrossRef]
  16. Li, H.; Cui, X.W.; Lu, M.Q.; Feng, Z.M. Dual-Folding Based Rapid Search Method for Long PN-Code Acquisition. IEEE Trans. Wirel. Commun. 2008, 7, 5286–5296. [Google Scholar] [CrossRef]
  17. Tahir, M.; Lo Presti, L.; Fantino, M. A Novel Acquisition Strategy for Weak GNSS Signals Based on MAP Criterion. IEEE Trans. Aerosp. Electron. Syst. 2014, 50, 1913–1928. [Google Scholar] [CrossRef]
  18. Benachenhou, K.; Hamadouche, M.; Taleb-Ahmed, A. New formulation of GNSS acquisition with CFAR detection. Int. J. Satell. Commun. Netw. 2017, 35, 215–230. [Google Scholar] [CrossRef]
  19. Guo, Y.; Huan, H.; Tao, R.; Wang, Y. Weak DSSS signal acquisition with fine Doppler frequency estimation. Electron. Lett. 2017, 54, 79–81. [Google Scholar] [CrossRef]
  20. Cheng, U.; Hurd, W.J.; Statman, J.I. Spread-spectrum code acquisition in the presence of Doppler shift and data modulation. IEEE Trans. Commun. 1990, 38, 241–250. [Google Scholar] [CrossRef]
  21. Polydoros, A.; Weber, C. A Unified Approach to Serial Search Spread-Spectrum Code Acquisition—Part I: General Theory. IEEE Trans. Commun. 1984, 32, 542–549. [Google Scholar] [CrossRef]
  22. Akopian, D. Fast FFT based GPS satellite acquisition methods. IEE Proc.-Radar Sonar Navig. 2005, 152, 277–286. [Google Scholar] [CrossRef] [Green Version]
  23. Grant, P.M.; Spangenberg, S.M.; Scott, I.; McLaughlin, S.; Povey, G.J.R.; Cruickshank, D.G.M. Doppler estimation for fast acquisition in spread spectrum communication systems. In Proceedings of the 1998 IEEE 5th International Symposium on Spread Spectrum Techniques and Applications—Proceedings. Spread Technology to Africa (Cat. No.98TH8333), Sun City, South Africa, 4 September 1998; Volume 101, pp. 106–110. [Google Scholar]
  24. Van Diggelen, F. Global Locate Indoor GPS Chipset & Services. In Proceedings of the 14th International Technical Meeting of the Satellite Division of The Institute of Navigation, Salt Lake City, UT, USA, 11–14 September 2001; pp. 1515–1521. [Google Scholar]
  25. Kong, S.H. A Deterministic Compressed GNSS Acquisition Technique. IEEE Trans. Veh. Technol. 2013, 62, 511–521. [Google Scholar] [CrossRef]
  26. Kong, S.H.; Kim, B. Two-Dimensional Compressed Correlator for Fast PN Code Acquisition. IEEE Trans. Wirel. Commun. 2013, 12, 5859–5867. [Google Scholar] [CrossRef]
  27. Kim, B.; Kong, S.H. Determination of Detection Parameters on TDCC Performance. IEEE Trans. Wirel. Commun. 2014, 13, 2422–2431. [Google Scholar] [CrossRef]
  28. Wang, Z.; Zhuang, Y.; Yang, J.; Zhang, H.F.; Dong, W.; Wang, M.; Hua, L.C.; Liu, B.; Shi, L.X. A Double Dwell High Sensitivity GPS Acquisition Scheme Using Binarized Convolution Neural Network. Sensors 2018, 18, 1482. [Google Scholar] [CrossRef] [PubMed] [Green Version]
  29. Yeom, S.; Jung, Y.; Lee, S. An Adaptive Threshold Technique for Fast PN Code Acquisition in DS-SS Systems. IEEE Trans. Veh. Technol. 2011, 60, 2870–2875. [Google Scholar] [CrossRef]
  30. Lu, W.J.; Zhang, Y.B.; Lei, D.Y.; Yu, D.S. Efficient Weak Signals Acquisition Strategy for GNSS Receivers. IEICE Trans. Commun. 2016, 99, 288–295. [Google Scholar] [CrossRef]
  31. Wang, C.; Deng, Z.; Hu, A.; Zhang, Y.; Zhao, W.; Dong, S. A weak signal acquisition method for indoor passive location on mobile communications. In Proceedings of the 7th China Satellite Navigation Conference, CSNC 2016, Changsha, China, 18–20 May 2016; pp. 397–407. [Google Scholar]
  32. Mo, J.; Deng, Z.; Jiao, J.; Jiang, S.; Yu, S.; Xu, F. Weak signal acquisition algorithm for indoor positioning receiver. In Proceedings of the 7th China Satellite Navigation Conference, CSNC 2016, Changsha, China, 18–20 May 2016; pp. 549–556. [Google Scholar]
  33. Borio, D. A Statistical Theory for GNSS Signal Acquisition. Ph.D. Thesis, Polytecnico di Torino, Torino, Italy, 2008. [Google Scholar]
Figure 1. Structure of FSBS.
Applsci 10 03434 g001
Figure 2. CNFS network topology.
Applsci 10 03434 g002
Figure 3. Structure of match filter method.
Applsci 10 03434 g003
Figure 4. Structure of PMF-FFT method.
Applsci 10 03434 g004
Figure 5. Search space.
Applsci 10 03434 g005
Figure 6. Second frame of navigation message.
Applsci 10 03434 g006
Figure 7. Schematic diagram of adjacent FSBS.
Applsci 10 03434 g007
Figure 8. Flowchart of search procedure.
Applsci 10 03434 g008
Figure 9. (a) Transfer function between two H0-blocks; (b) Transfer function from H1-block to H0-block.
Applsci 10 03434 g009
Figure 10. (a) FSBS positioning signal generator; (b) Signal collector.
Applsci 10 03434 g010
Figure 11. P Bcr and P Bfa versus multiple parameter T .
Applsci 10 03434 g011
Figure 12. P Bd and P Bm versus multiple parameter T .
Applsci 10 03434 g012
Figure 13. ROC curves.
Applsci 10 03434 g013
Figure 14. (a) P d and P m versus SNR ( P fa = 0.001 ) (noise power remains constant); (b) P d and P fa versus SNR (signal power remains constant).
Applsci 10 03434 g014
Figure 15. (a) P d and P m versus CIT ( P fa = 0.001 , SNR = −36 dB, N nc = 2 ); (b) P d and P m versus NCT ( P fa = 0.001 , SNR = −36 dB, CIT = 2 ms).
Applsci 10 03434 g015
Figure 16. (a) Acquisition time versus SNR ( P fa = 0.001 ); (b) acquisition time versus multiple parameter T (SNR = −36 dB).
Applsci 10 03434 g016
Figure 17. (a) Acquisition time versus SNR ( P fa = 0.001 ) (noise power remains constant); (b) acquisition time versus versus SNR (signal power remains constant).
Applsci 10 03434 g017
Figure 18. (a) Acquisition time versus CTIT ( P fa = 0.001 , SNR = −36 dB, N nc = 2 ); (b) acquisition time versus NCT ( P fa = 0.001 , SNR = −36 dB, CIT = 2 ms).
Applsci 10 03434 g018
Table 1. Simulation parameters.
ParametersValue
PRN code length10,230
Available PRN code number64
Code rate10.23 MHz
Navigation message data rate100 bps
Code phase search step0.5 chip
Frequency search space−3 kHz to 3 kHz
Frequency search step in first dwell1000 Hz/ T coh
Frequency search step in second dwell100 Hz/ T coh
Block size70
Block number2046
CIT5 ms
NCT number2
False alarm penalty time500 ms
Table 2. Number of adjacent FSBSs.
Number of Signals ReceivedNumber of Adjacent FSBSs Obtained
410
511
612
710
Table 3. New search space size.
ParametersValue
PRN code number12
Cell number in one block70
Block number21

