Experiment Study of the Failure Mechanism and Evolution Characteristics of Water–Sand Inrush Geo-Hazards


1
State Key Laboratory of Geomechanics and Geotechnical Engineering, Institute of Rock and Soil Mechanics, Chinese Academy of Sciences, Wuhan 430071, China
2
College of Earth and Planetary Sciences, University of Chinese Academy of Sciences, Beijing 100049, China
*
Author to whom correspondence should be addressed.
Appl. Sci. 2020, 10(10), 3374; https://doi.org/10.3390/app10103374
Submission received: 22 April 2020
/
Revised: 6 May 2020
/
Accepted: 7 May 2020
/
Published: 13 May 2020
(This article belongs to the Section Earth Sciences)
Abstract
:Water–sand inrush disasters are frequently encountered during underground engineering construction in karst terrain. The objective of this paper is to study the failure mechanism and evolution characteristics of water–sand inrush caused by the instability of filling medium in karst cavity, as well as the impacts of soil compactness, hydraulic pressure and confining pressure on the instability process. In response to this purpose, a stress-controlled seepage test apparatus in consideration of particle loss was designed, and a series of seepage tests were performed correspondingly. The test results indicate that: (1) Based on the nonlinear feature analysis of water-outflow pattern, the water–sand inrush process can be divided into the “slow flow” stage, “transition flow” stage and “pipe flow” stage by Transition Point I, II. (2) The decreasing soil compactness and increasing hydraulic pressure both exponentially facilitate the seepage-erosion process by increasing the particle-erosion ability; the increasing confining pressure extends the “slow flow” stage and shortens the duration of the “transition flow” stage, ultimately advancing the occurrence of the “pipe flow” stage; the existence of critical hydraulic pressure for the seepage-erosion progress is confirmed, the occurrence of the “pipe flow” stage is significantly advanced once the hydraulic pressure over the critical value. (3) The particle loss caused by the seepage-erosion process is the internal mechanism of water–sand inrush, the variation characteristics of water-outflow pattern are crucial external manifestations correspondingly. Therefore, with the monitoring of water-outflow pattern variation tendency as indicators, the critical status of water–sand inrush can be near-real-time identified, which offers experimental foundation for the early warning and forecast of the occurrence of water–sand inrush.
1. Introduction
Karst terrain is extensively developed all over the world, covering about 12% of the planet’s dry, ice-free land [1]. With the exponential growth of the world’s population, the rapid urban expansion and increasing demand for transportation facility make engineering construction in extremely complex geo-conditions an inevitable choice [2]. For the architectures in karst area, the geo-disasters such as sinkhole collapse, subsidence, floods and landslides induced by the instability of soluble rocks are frequently encountered [2,3,4,5]. Those typical karst geo-disasters have aroused researcher’s attention, and the correspondent mechanism exploration and treatment methods are also investigated extensively.
However, besides the geo-disasters mentioned above, the occurrence of water–sand inrush disaster during underground construction in karst area is becoming more frequent. In the first decade of the 21st century, the underground accidents caused by water–sand inrush accounted for 77.3% of serious safety accidents in China’s large-scale infrastructure construction process. China’s karst landforms are widely distributed, with a total area of 3.44 million square kilometers, accounting for 15.6% of the global karst area [6]. Furthermore, karst landforms are also abnormally developed in 55 countries and regions along the “Belt and Road”, covering almost the whole of Asia and half of Europe, accounting for about 2/3 of the total global karst zone [7], which makes water–sand inrush geo-hazards one of the biggest threats for the underground engineering, even for the successful implementation of globalization.
Numerous investigations have been conducted concerned with this type of geo-hazards, mostly derived from the risk evaluation theories of water outburst disasters in the mining industry since the mid-20th century. The “water-inrush coefficient” criterion, followed by the “water-inrush index” [6,8] were initially proposed based on the geologic conceptualization model that the coal seam floor is assumed as a piece of “resistance stratum” subjected to hydraulic pressure with two ends anchored, the water outburst is supposed to occur immediately when hydraulic pressure reaches the threshold value. Subsequently, in consideration of coupling effects of mining-induced stress and hydraulic pressure beneath the confined aquifer, the hypothesis of “three zones” and “zero fracture” theory [8] were suggested to finely analyze the stability state of “resistance stratum”. The bearing capability of confined aquifer was theoretically analyzed based on the elastic–plastic mechanics and fracture mechanics, and the critical energy release position was further identified by Bieniawski [9] through Hoek–Brown criterion. Yang et al. [10] introduced the “flow–stress–damage” model into tracing the initiation, propagation and coalescence of the fractures during the whole water-outburst process. These research achievements mentioned above made significant explorations in the risk assessment of water inrush through coal seam floor and fractured rock masses. However, as indicated by engineering practices and literature research, a considerable number of water inrush accidents were induced by the instability of filling medium under hydraulic pressure in karst cavity during underground construction [11], as briefly shown in Figure 1. Moreover, quite a few were characterized with distinct hysteresis phenomenon due to the progressive seepage-erosion process [12], for which those theories mentioned above would lose reliability and rationality from the perspective of instability mechanism.
In recent years, numerical methods and laboratory tests in consideration of particle loss were employed to explore the progress of water–sand inrush through granular soil. The nonlinear fluid–solid coupling model based on continuum medium mechanics were developed to depict the porosity evolution and expansion of seepage channels [13]. Zhou et al. [14] investigated the onset and development of water–sand inrush in karst geo-structure through DEM–CFD coupling method. Georg and Douchko [15] developed a simplified model of the local lithology to depict the evolution characteristics of karst in vicinity of tunnels in long/short term. These numerical research results could partially describe the seepage-erosion phenomenon along with water–sand inrush process, but the applicability remains further confirmed by validation tests. Ma et al. [16] experimentally investigated the impacts of particle transfer on the porosity and permeability of karst collapse pillar under varying pore pressure, particle size mixture and compaction level. Liu et al. [17,18] further explored the variation characteristics of fluidized grain concentration and Reynolds number as the advancing of seepage-erosion process. However, previous experimental researches mainly concentrated on the variation of flow parameters (porosity, permeability, Reynolds number) as the advancing of water–sand inrush, the evolution characteristics of seepage-erosion process was not adequately comprehended. More importantly, the early warning method was rarely involved in previous research, which is crucial to prevent the occurrence of water–sand inrush disasters in field conditions.
The objective of this paper is to investigate the failure mechanism and evolution process of water–sand inrush caused by the instability of filling medium in karst cavity, and to quantify the impacts of crucial controlling factors. In response to this purpose, a stress-controlled seepage test apparatus in consideration of soil particle loss behavior was designed and a series of seepage tests were conducted correspondingly. The evolution process of water–sand inrush under varying soil compactness, hydraulic pressure and confining pressure was obtained through monitoring the variation of flow characteristics: water-outflow rate, sands erosion rate and sands mass concentration, by which the nonlinear characteristics of seepage-erosion progress under varying controlling factors was illustrated. Furthermore, the critical status of water–sand inrush was found to be indicated by the identification of water-outflow pattern, which provides experimental basis for the early warning and forecast of water–sand inrush’s occurrence.
2. Testing Apparatus and Methods
2.1. Testing Apparatus
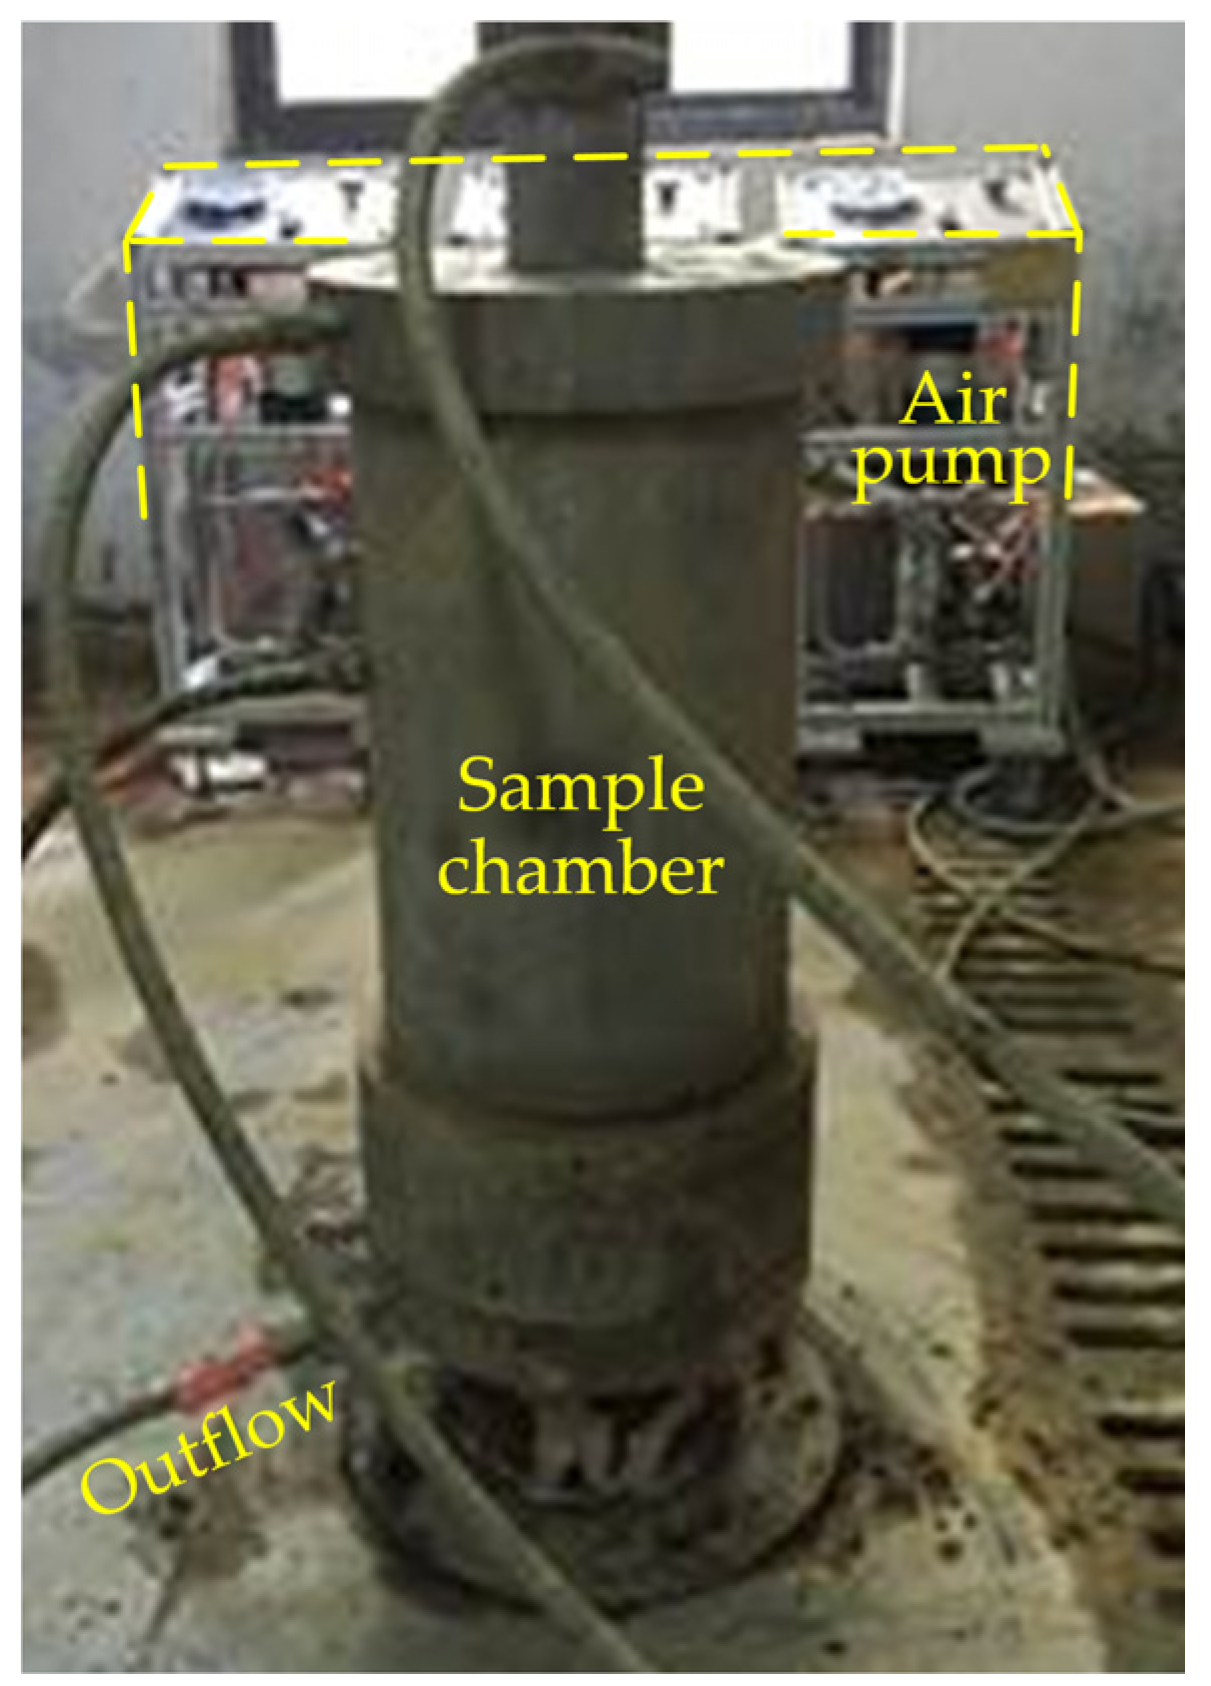
The seepage testing apparatus mainly consists of a sample chamber, a triaxial loading system, and a water-soil collection system, as shown in Figure 2 and Figure 3. The brief description of each component is presented in the following texts.
- Sample chamber: The soil sample chamber, where the soil sample is loaded, is 150 mm in diameter, and 300 mm in height. The rubber membrane attaches the inner wall of sample chamber, which creates an enclosed space between the rubber membrane and soil chamber.
- Triaxial loading system: The triaxial load system independently provides axial pressure, confining pressure, and hydraulic pressure to simulate the triaxial stress state. The triaxial loads, up to 4.0 MPa, with the precision of 10 KPa, are individually supplied by three pneumatic pumps with pressure-servo control function. The confining pressure is applied by the pressured water in the annulus space between the rubber membrane and sample chamber.
- Water–Soil Collection System: Meshed perforated plate I, with the hole diameter of 5 mm, is placed on the top of soil specimen to guarantee the water pressure is uniformly distributed. The water and eroded soil particles passing through Meshed perforated plate II are individually collected by the water and soil collection device. The mesh size of perforated plate II adopted in this test is determined by the design criteria of geotextile filter’s opening size. The threshold of O90/d90 (O90 is the geotextile pore opening size corresponding to d90) generally varies between 1.0 and 4.0, Watson and John [19] proposed an empirical formula to determine geotextile’s pore opening size: O90/d90 = −0.028Cu + 2.34. For the soil sample adopted in this test, Cu = 6.02, d90 = 2.21 mm, thus the minimum mesh size of perforated plate II is 4.80 mm to avoid soil particles’ bridge forming. Considering the results of pre-tests, the mesh size of perforated plate II is finally set as 10.0 mm, ensuring at least 90% sand particles to pass through without clogging.
2.2. Experiment Program
2.2.1. Soil Specimen
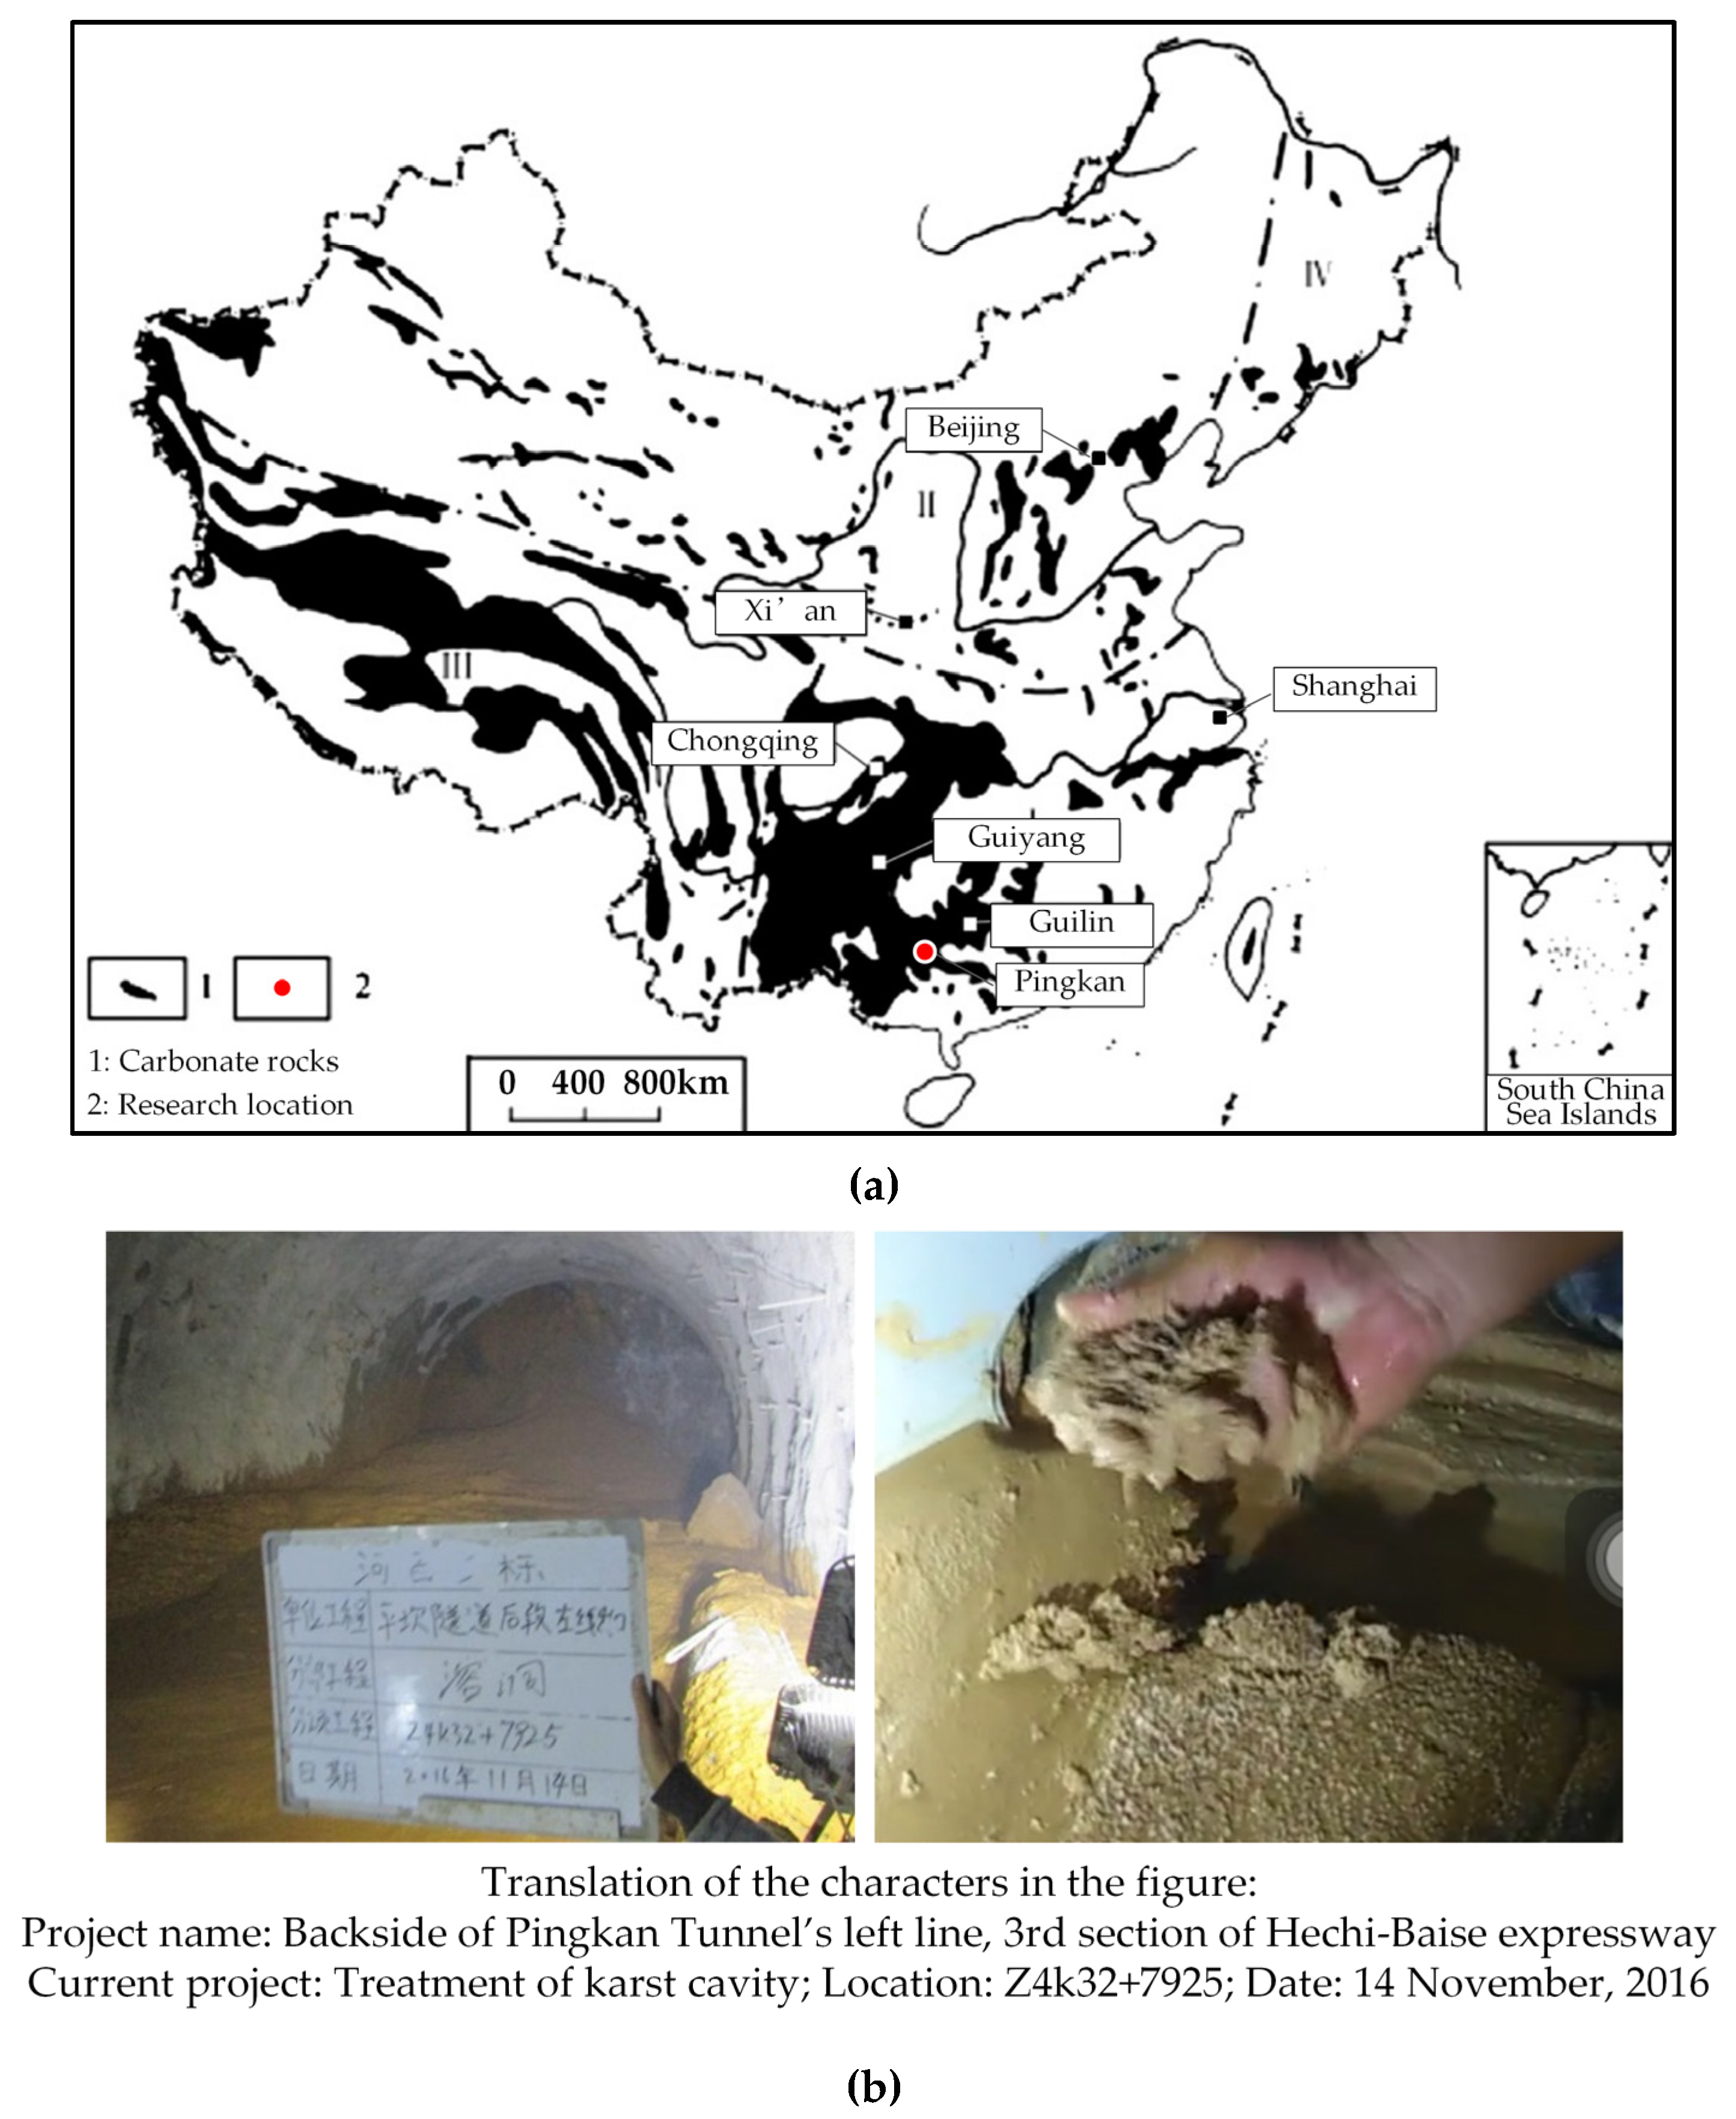
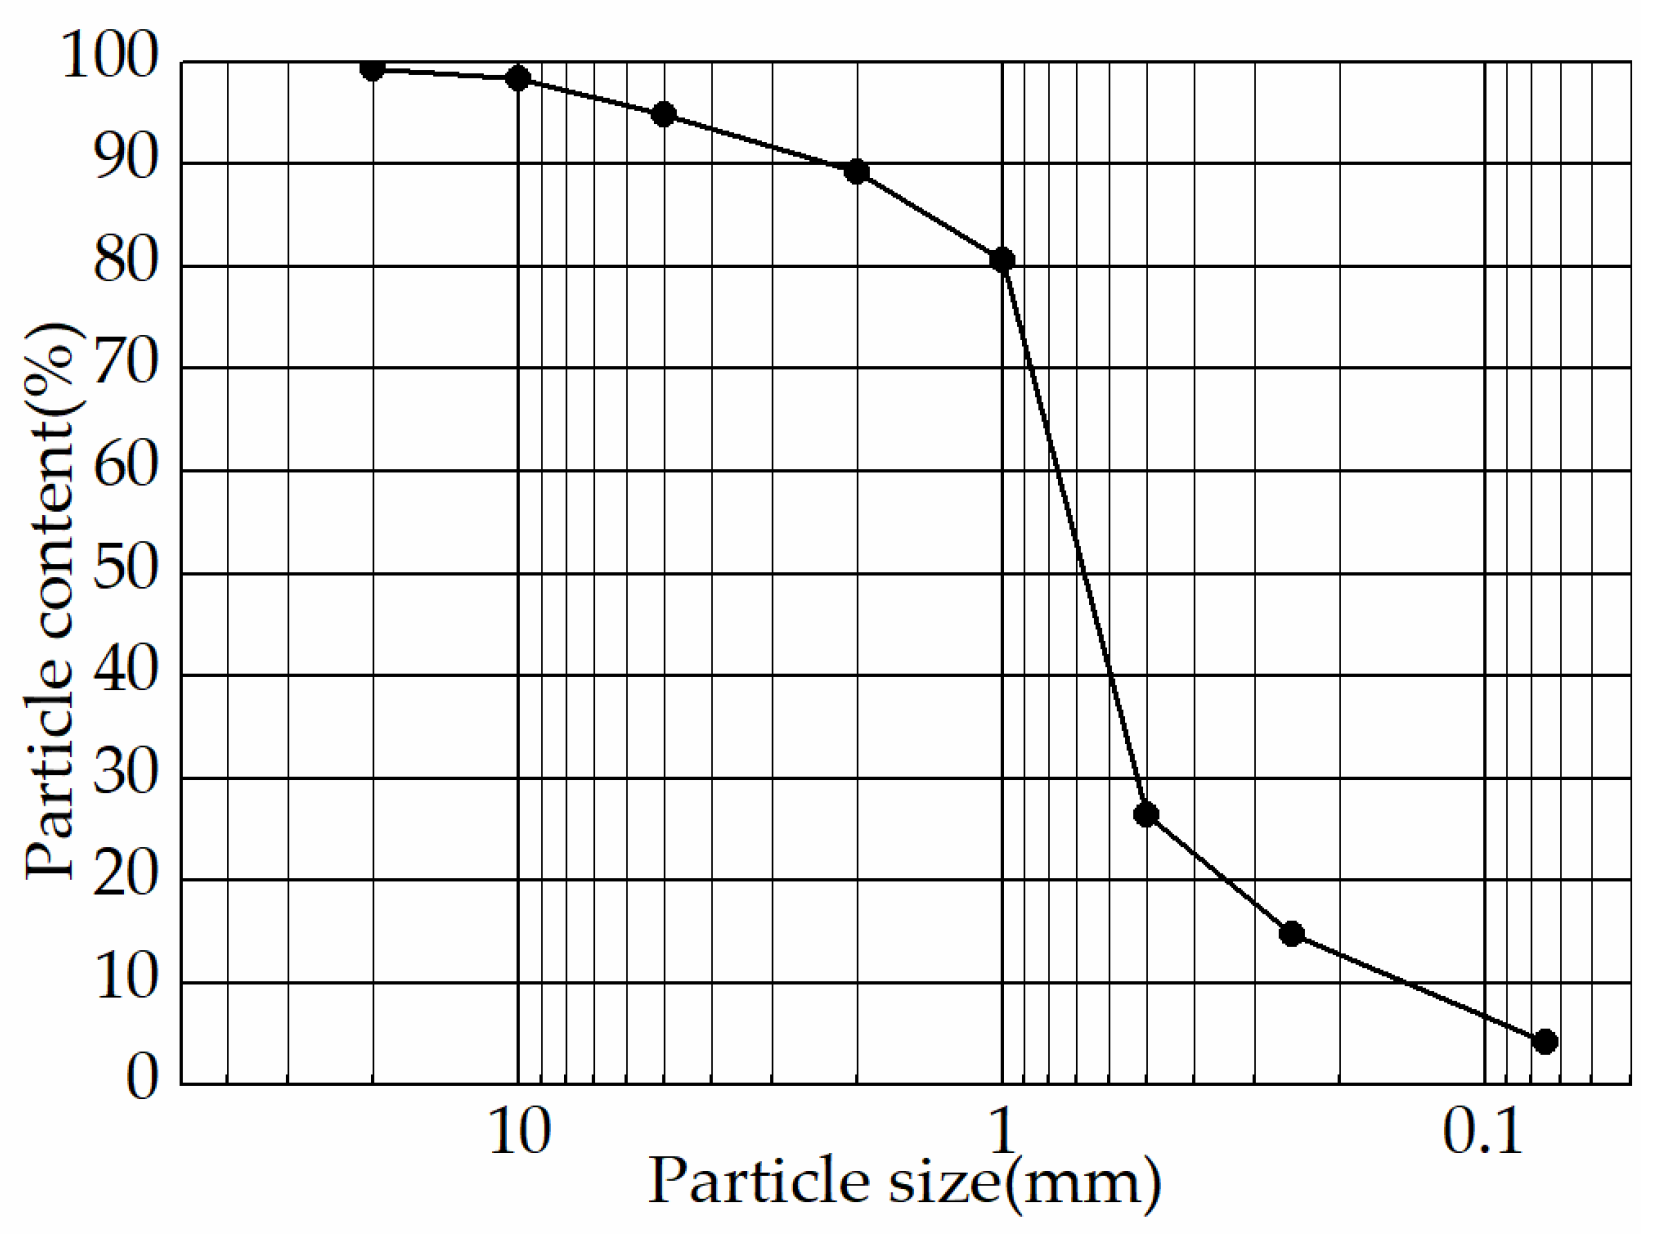
The soil sample adopted in this test is from Pingkan transportation tunnel, Guangxi Province, China, the location of Pingkan tunnel is shown in Figure 4a. Pingkan tunnel, with the length of 3276.5 m, a maximum burial depth of approximately 120 m, is located in the mountainous region, where the karst landforms are extremely developed. The karst fissures and fill-type cavity are widely distributed along the tunnel axis. In addition, the terrain of mountain summit is in favor of water collection and the rainfall is abundant as well. Several large-scale water–sand inrush accidents occurred during construction process, as shown in Figure 4b. This soil sample is widely distributed in southwest China, and qualified with a broad representation of sandy-type soil filled in karst cavities [20], the physical properties are listed in Table 1 and Figure 5.
2.2.2. Experiment Program
Extracting the controlling factors influencing the stability of filling medium in karst cavity is crucial. The filling medium are mostly soil particles being flushed into karst cavities by surface water, or rock fragments fell off the ceiling of karst caves, deposited and consolidated under the action of self-weight and underground water. Georg and Douchko [15] concluded water–sand inrush is likely to occur under high hydraulic pressure through case studies in completely weather granite. Walsh [22] and Jamiolahmady et al. [23] pointed out the hydraulic pressure also has considerable compression on rock and soil mass, and eventually affect its consolidation and liquefaction process; the confining pressure is widely considered as controlling factors for the compaction state of rock and soil mass, further affects its mechanic and permeability characteristics [24]. Based on the literature analysis, the compaction state of filling medium, hydraulic pressure and confining stress are deemed as significant influencing factors on the evolution of water–sand inrush.
According to the disaster statistics in Pingkan tunnel, water–sand inrush cases occurred more frequently during the period from April to October, which is the rainy season for nearly the whole area of Southwest China. Based on the field investigation and literature research, the hydraulic pressure of underground karst water mostly below 1.0 MPa, unless the karst water is deep-buried or under the action of high tectonic stress. Therefore, in this test, the hydraulic pressure(Pw) of karst water is set to three levels: 0.2, 0.4, 0.6 MPa; the confining pressure(Pc) is set to 0.0, 0.2, 0.4 MPa; the compaction state of the filling medium is controlled by relative density(Dr) [25], which is set to Loose, Intermediate and Dense, with the relative density(Dr) of being 0.25, 0.50, 0.75, the experiment scheme is shown in Table 2. The experiment assumptions and schemes employed in this study could be well applied into the mountain regions with wide distribution of karst terrains.
2.3. Experiment Procedures
In order to study the initiation and evolution characteristics of water–sand inrush in practical situation, as well as the effects of hydraulic pressure, confining stress and initial compactness of filling medium on water–sand inrush progress, a series of seepage tests were conducted, and the operation procedure is summarized as follows:
- Soil specimen loading: before start, Vaseline is smeared uniformly on the inside of specimen chamber to prevent water leakage along the inner wall; the soil sample is loaded into the specimen chamber by layers, then compacted to the specific compactness. The perforated plate I is placed on the top of the soil sample after loaded.
- Specimen saturation: In order to simulate the hydraulic state of filling medium in karst cavity filled with water, the soil specimen will be fully saturated before seepage tests start. After the soil sample is loaded, the low-pressured water is applied on the top of soil sample to pre-saturate the soil sample, until the flow rate of discharged water maintains stable.
- Water and soil particles collection: after the saturation step, load the hydraulic pressure and confining pressure to launch the seepage test. Eroded sand particles are separated and assembled by a sieve, with the mesh size of 0.05 mm. Eroded sands and discharged water are collected and weighed every 1 minute until the test ends.
3. Experiment Results and Analysis
3.1. Nonlinear Evolution Characteristics of Seepage-Erosion Process
As the progress of water–sand inrush process, soil particles continue to erode away, which not only changes the soil skeleton, but also the flow pattern along with seepage-erosion process. The eroding ability of seepage flow is represented by sands erosion rate, namely the mass of eroded soil particles within a certain amount of time. The sands mass concentration of eroded sands in discharged fluid is also regarded as a crucial symptom herein, which can be obtained through equation below
where mi is the weight of collected sands, qi is the volume of discharged fluid, ρf is water density, i is the serial number of time per minute.
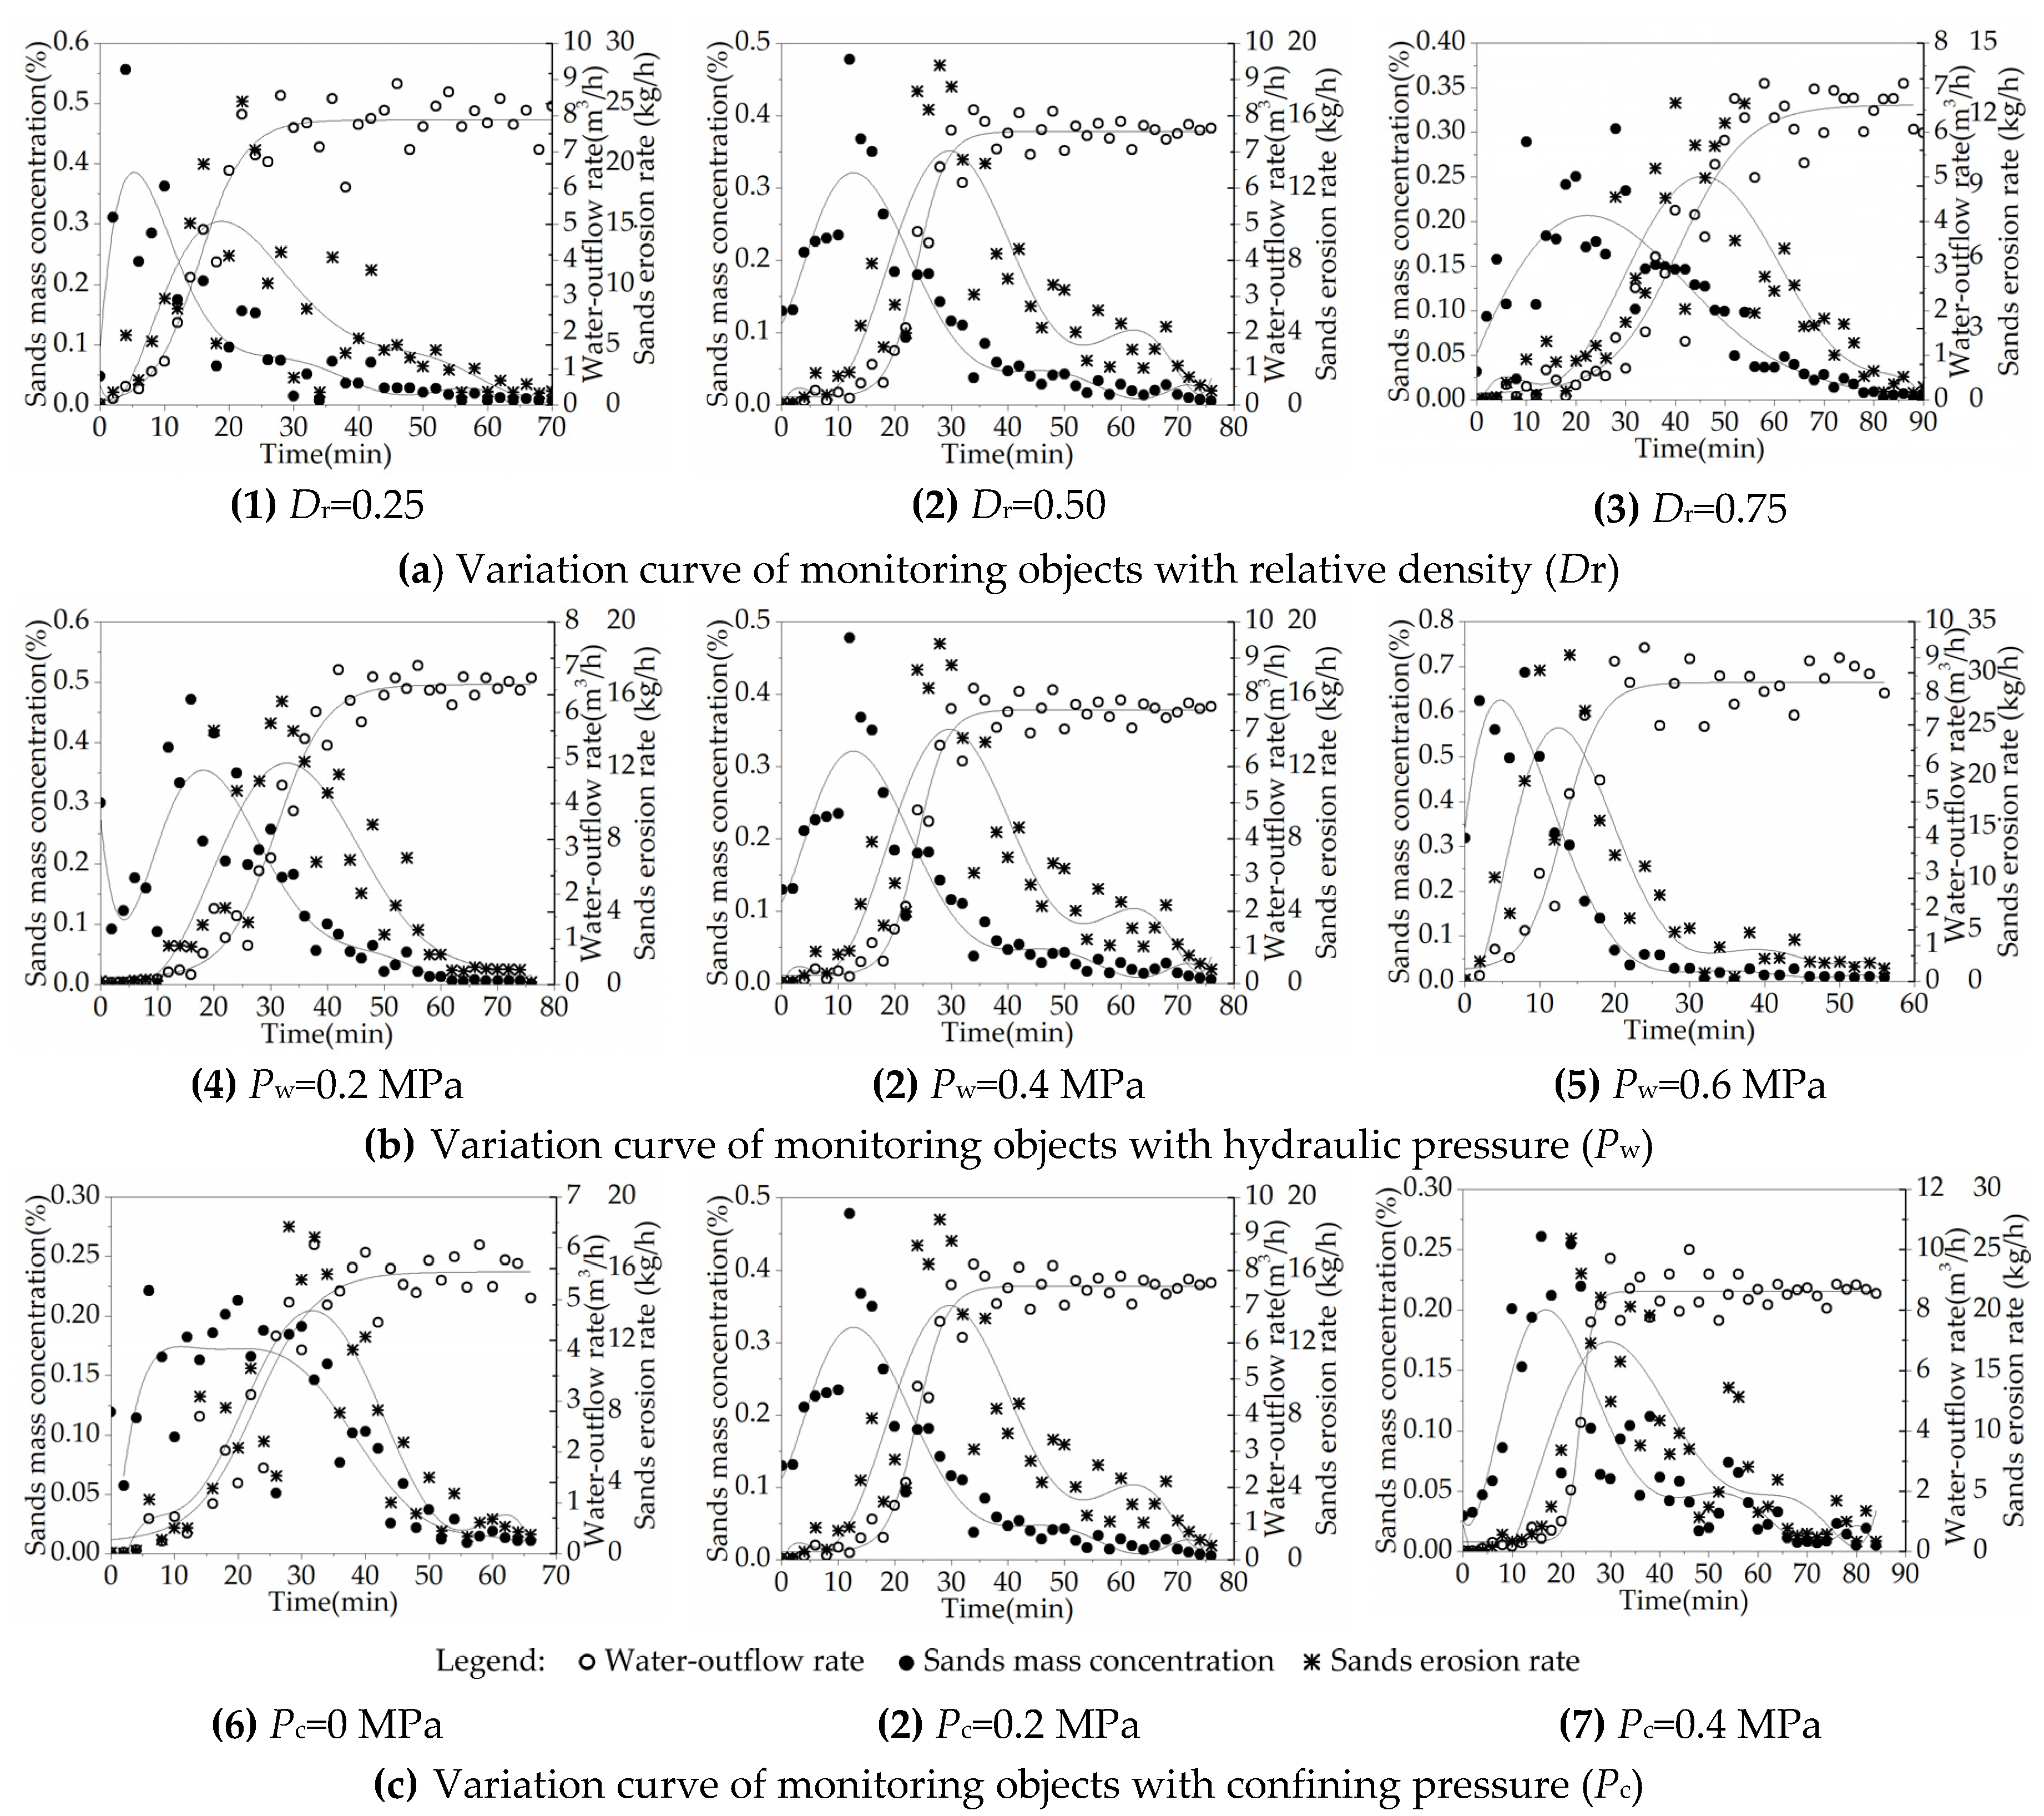
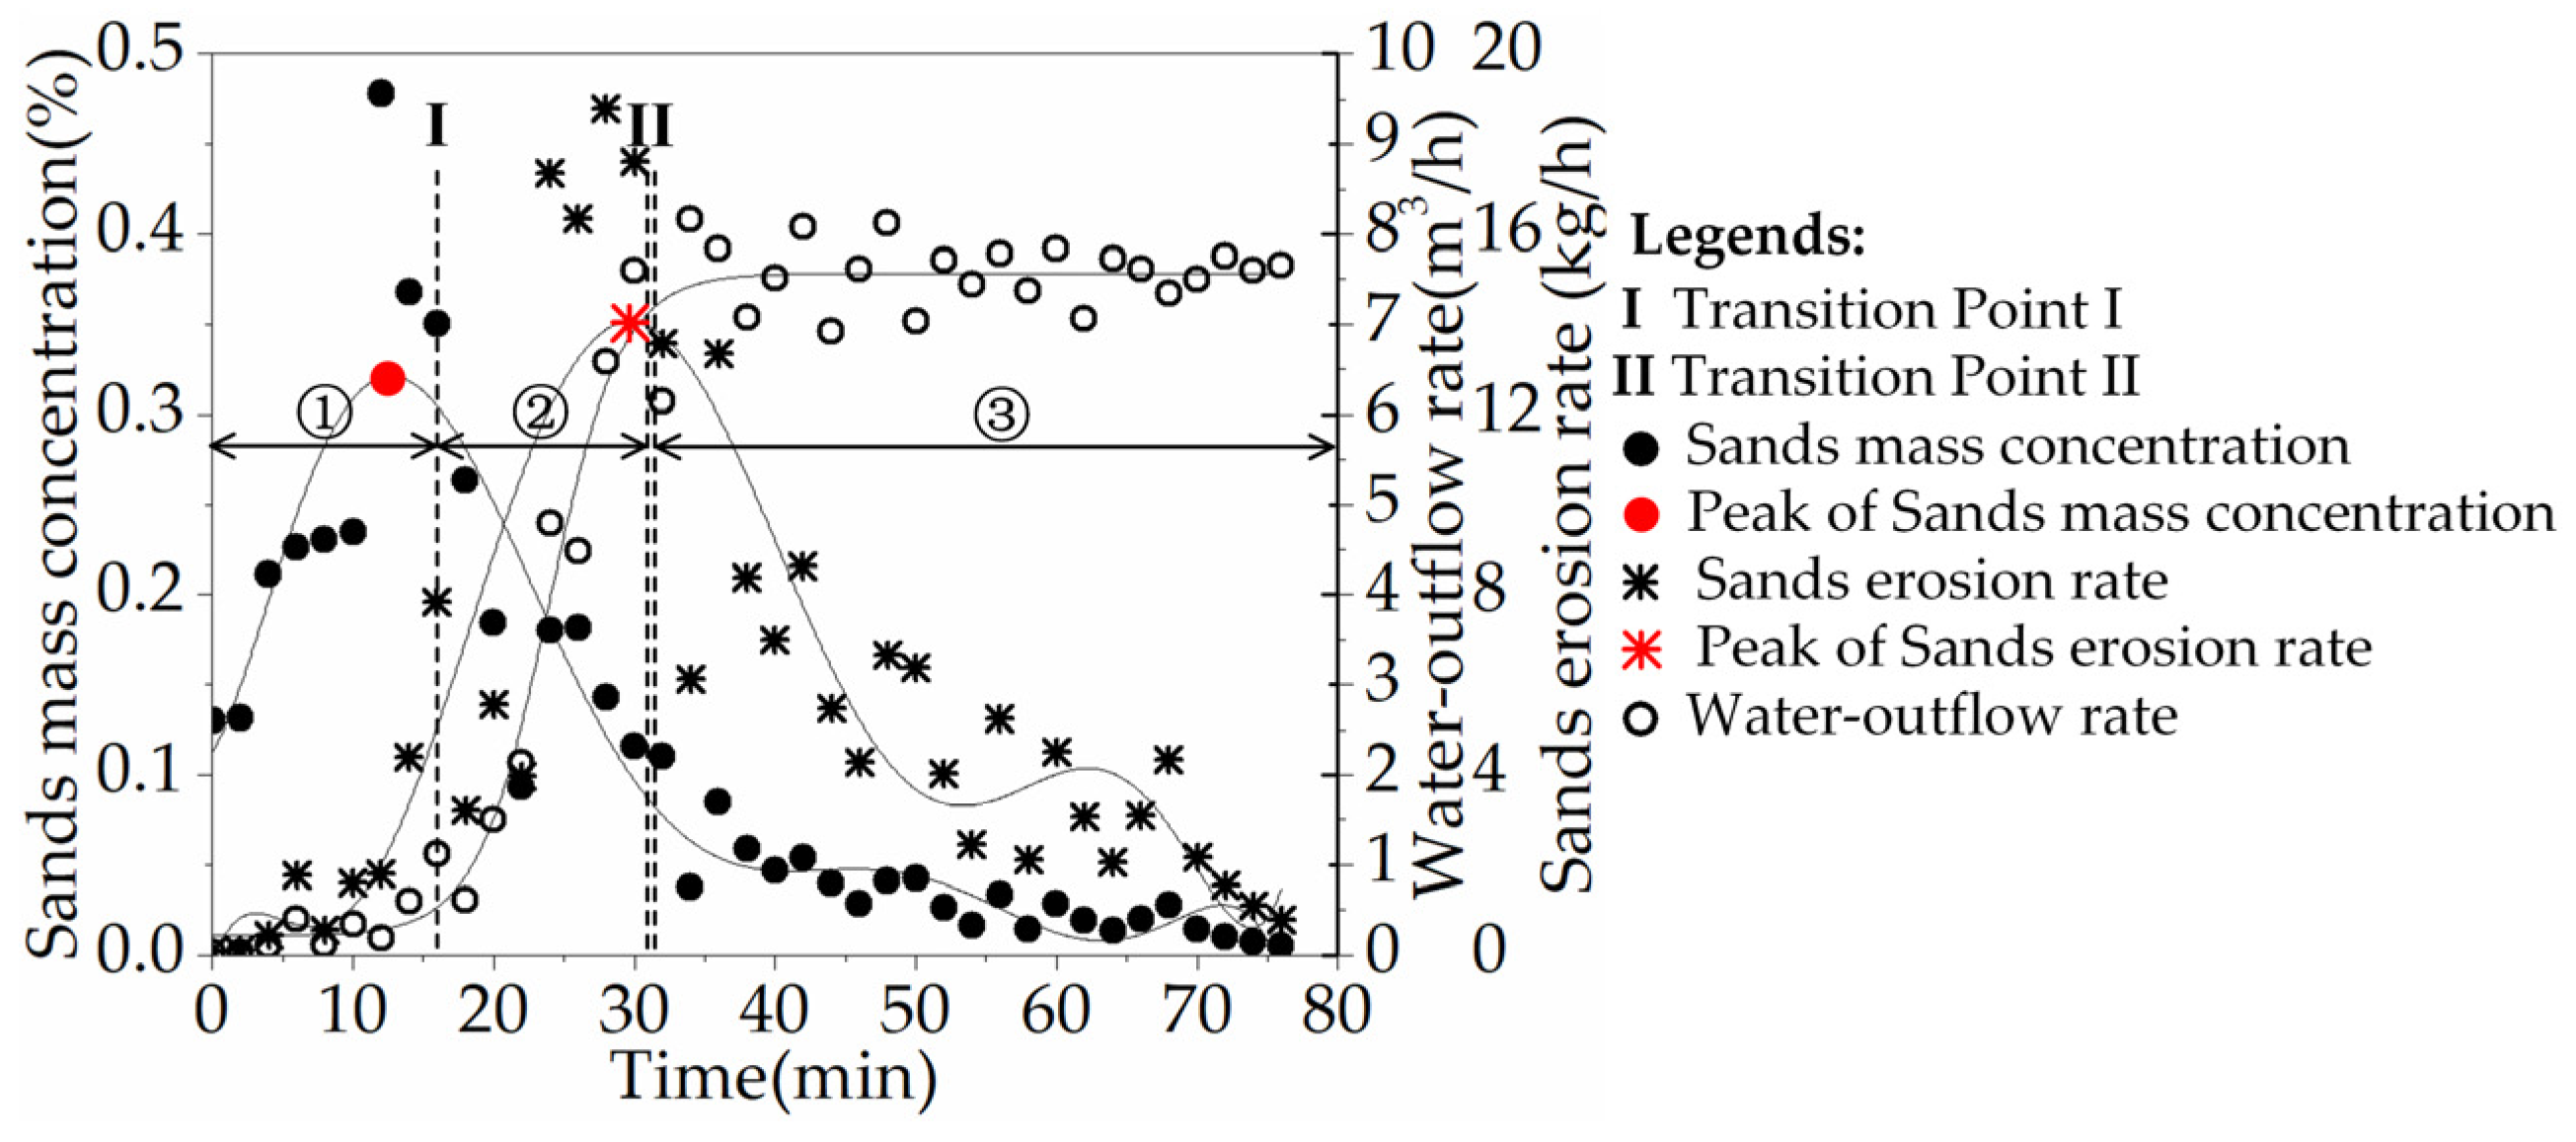
The test results of each group is calculated and shown in Table 3, Table 4 and Table 5 and Figure 6. The variation of water-outflow rate is well fitted through Boltzmann equation, the variation of sands erosion rate and sands mass concentration with time are depicted by the 7th order polynomial equation. It can be observed that the test results exhibit obvious similarities among each group, the variation of water-outflow rate are all characterized with distinct non-linear feature, the variation of sands mass concentration and sands erosion rate are both in shape of wave with the existence of summit. In order to deeply analyze the experimental phenomena, the test result of group 2 is illustrated in detail in Figure 7 and Figure 8.
First, according to the variation curve of water-outflow rate, the water–sand inrush process is visually divided into three stages by Transition Point I, II, which are determined through the extremum analysis of water-outflow rate’s fitted curve. The property description of each seepage stage is detailed as following:
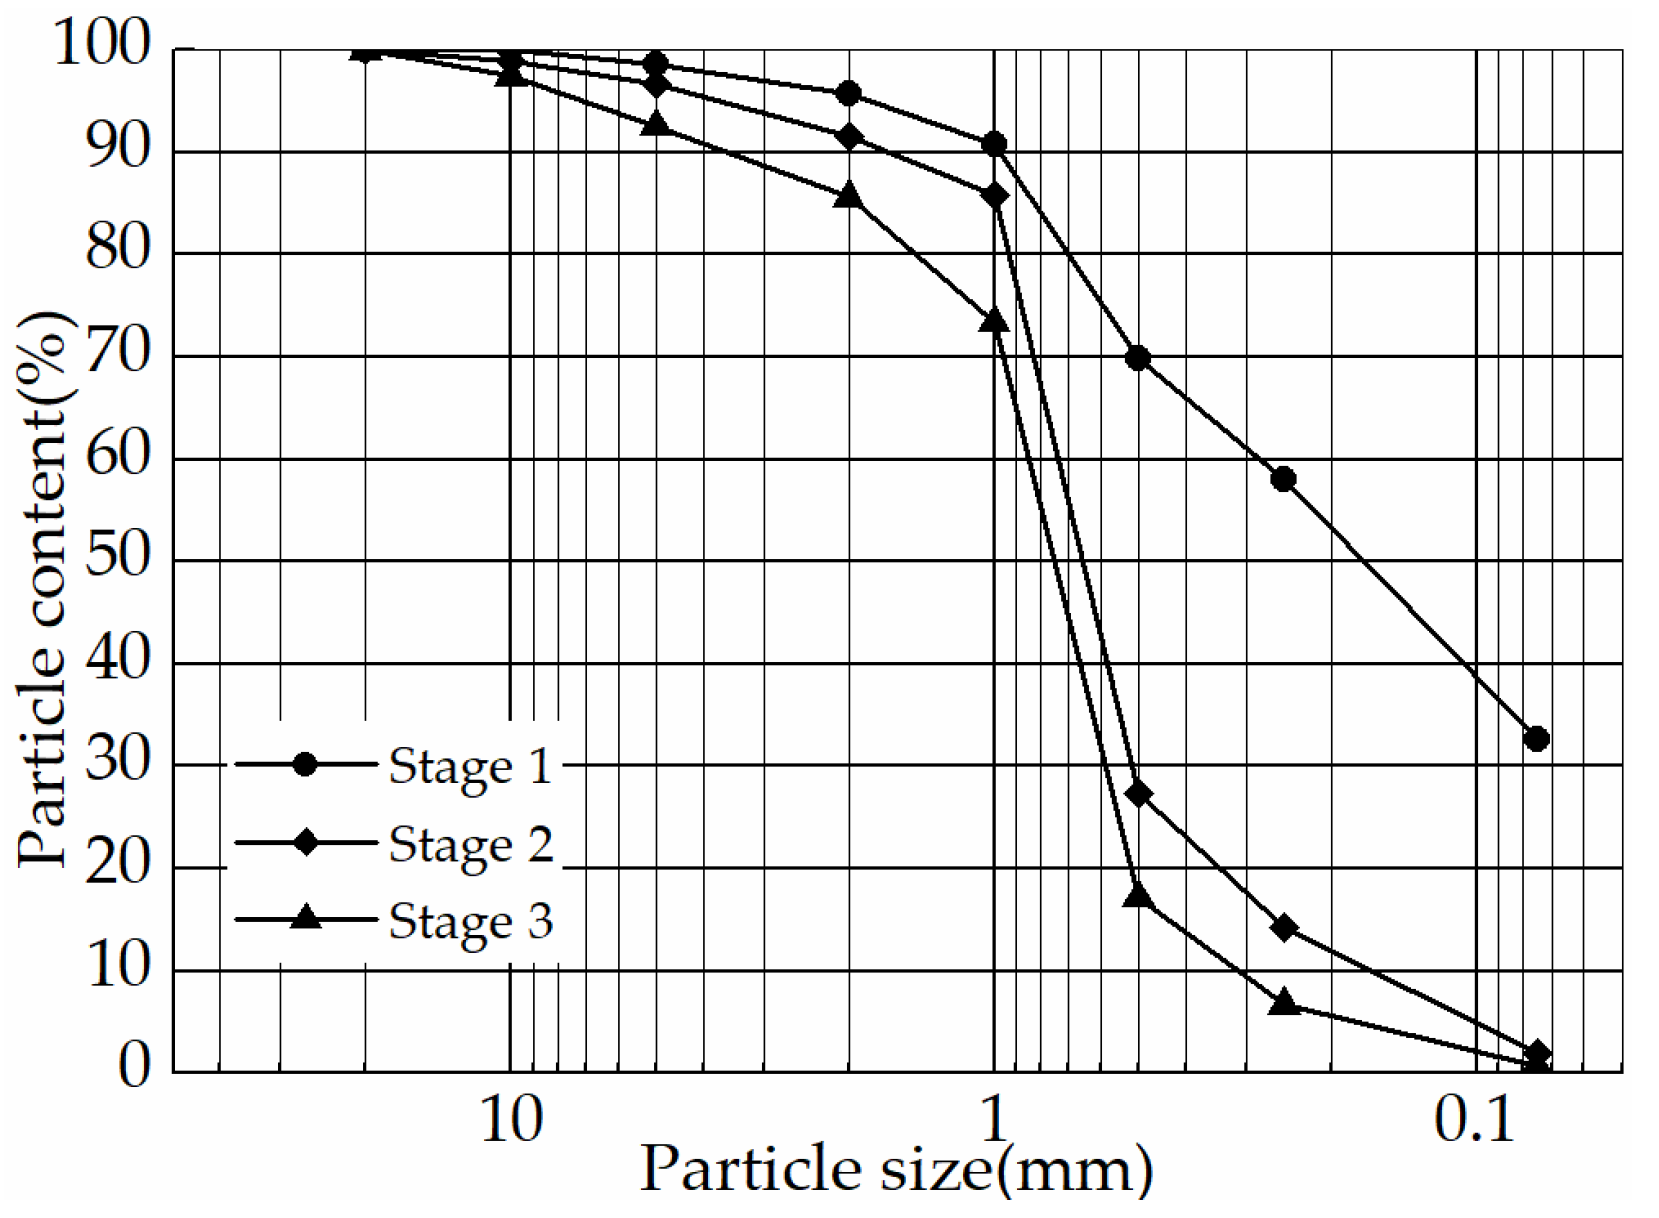
Stage ①: Up until the 16.8th min since beginning, water-outflow rate maintains less than 0.5 m3/h; sands erosion rate starts rising after being below 2.0 kg/h within the first 12 mins, and then up to nearly 5.5 kg/h until the end of this stage; sands mass concentration increases instantly from the very beginning, and reaches the peak after 12.6 mins; as seen from the grain-size distribution of the eroded soil particles collected in this stage, shown in Figure 8, the content of soil particles over 1 mm is only about 10%, while the particles smaller than 0.5 mm and 0.075 mm occupy about 70% and 32% of the total eroded mass, respectively, significantly less than the contents of the same grain-size particles of being about 26% and 5% in the original soil sample. At the initiation stage of the seepage-erosion process, soil particles compact densely with the soil skeleton maintaining stable, resulting in fairly small porosity and permeability, which ensures a small seepage rate through the soil sample. Subsequently, with the advancing of penetration process, the fine and unbounded soil particles start being activated and migrated into the seepage flow even under relatively small dragging force exerted by slow seepage flow. In this stage, with the existence of fine and unbounded particles, the migration rate of fluidized soil particles into the flow is greater than the conveyance rate, which manifests as the increase of sands mass concentration, resulting in a greater erosion ability of seepage flow because of the existence of more free particles and their surfaces. Based on the seepage characteristics obtained, this period can be named as “slow flow” stage.
Stage ②: After Transition Point I, water-outflow rate starts abruptly increasing, reaching Transition Point II of being about 8.0 m3/h after 32.0 mins totally; sands erosion rate also quickly rises to the peak right before Transition Point II, and sands mass concentration starts going down sharply; through observation of the grain-size distribution of soil particles collected in this stage, there are more coarser particles showing up than that in stage ①. The content of particles between 0.5 mm and 1 mm significantly rises to 57% from 20%, and the particles smaller than 0.075 mm are barely seen in this stage. As the fine particles kept losing, the microstructure of soil sample is changed accordingly. Due to the loss of significant fine particles, not only the interspaces and voids grows bigger, but also the lateral supports for soil skeleton reduce too, causing the coarser soil particles becoming less stable and easier being eroded away. This process will increase the porosity and permeability of soil sample, which in return accelerates the flowing rate, increases the eroding ability of the fluid, and further facilitates the formation of seepage channels. In this stage, the eroding ability of seepage flow increases with the rising of flowing rate, inducing a growing number of sands being eroded away. The water-outflow rate also climbs dramatically, resulting in a greater transfer rate than the generation rate of fluidized soil particles, so the variation of sands mass concentration in this stage declines rapidly all along. Considering the seepage characteristics and experimental phenomenon, this stage can be characterized as “transition flow” stage.
Stage ③: By the end of stage ②, water-outflow rate fluctuates around 7.6 m3/h, and the acceleration of water-outflow rate suddenly drops to nearly zero; sands erosion rate starts declining soon after the summit of being 18.79 kg/h, at the meantime, sands mass concentration continues to drop consistently with a smaller gradient after Transition Point II. Through observation of the grain-size distribution of eroded soil particles, the content of particles between 0.5 mm and 1 mm remains approximately the same as the content of the same grain-size particles in stage ②, but for the coarse particles over 1 mm, its content occupies 27%, almost the twice of the content of those in stage ②. By the end of “transition flow” stage, around 56% soil particles have been eroded away, resulting in nearly penetrating-through of seepage channels, which promotes the flow pattern transforming into pipe flow from porous media flow [26], hence the water-outflow rate maintains a relatively stable rate under specific hydraulic pressure. In this stage, the formation of penetration-through seepage channels partially decreases the lateral erosion ability of seepage flow, which not only results in a greater transferring rate than migration rate of soil particles, but also a slowly declining of sands mass concentration all along. It should be noted that, in real geo-conditions, karst cavity may be filled with abundant karst water, or even connected to underground river or surface water, the outflow discharge could suddenly and dramatically increase after the penetration through of seepage channels, resulting in the occurrence of water–sand inrush accidents. In consequence, this period can be named as “pipe flow” stage.
After introducing the nonlinear evolution characteristics of seepage-erosion process, the reason behind the existence of outliers in Figure 7 should be discussed here. As we mentioned above, the mesh size of perforated plate II is set as 10.0 mm, ensuring at least 90% sand particles to pass through. While, the particle clogging will appear when the particles over 10.0 mm approaching perforated plate II. Moreover, with the existence of medium size particles, the clogging will still theoretically appear when 2, 4, or many of those particles approaching the open hole together, which would retard the erosion of soil particles. However, due to the dynamic evolution characteristics of seepage-erosion progress, the particle clogging has a possibility to collapse under the disturbance of dynamic flow, which abruptly increases the mass of eroded particles, resulting in a sharp growth of sands erosion rate, as well as the fluctuations of water-outflow rate and sands mass concentration.
3.2. Effects of Controlling Factors on Seepage-Erosion Process
Previously, the progress of water–sand inrush was introduced in detail, as well as the nonlinear features along with the whole seepage-erosion process. In this section, the variation characteristics of water-outflow rate, sands erosion rate and sands mass concentration of each test is monitored and further analyzed to quantitatively demonstrate the impacts of controlling factors, soil compactness, hydraulic pressure and confining pressure on the instability process of sandy soil under karst water. The occurrence time variation of monitor objects’ characteristic value with relative density, hydraulic pressure and confining pressure is listed in Table 6.
3.2.1. Effects of Soil Compactness on Seepage-Erosion Process
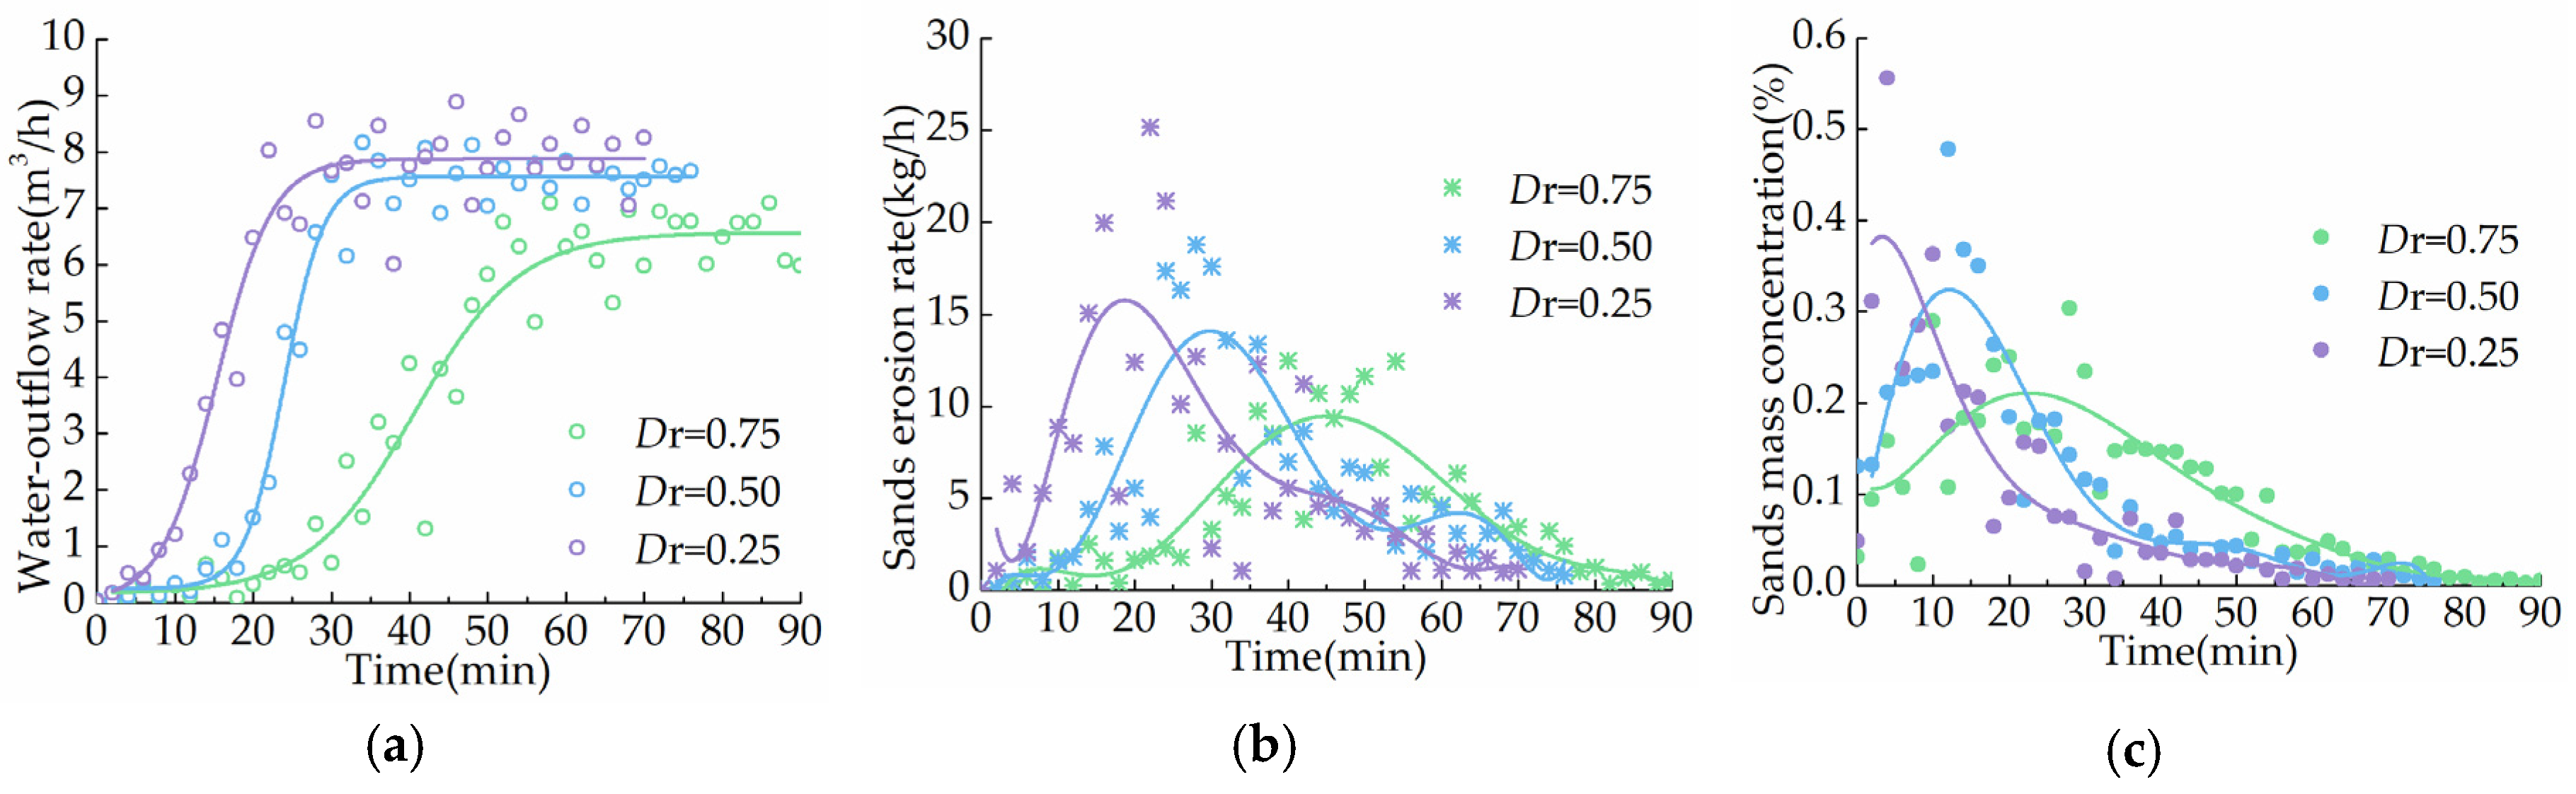
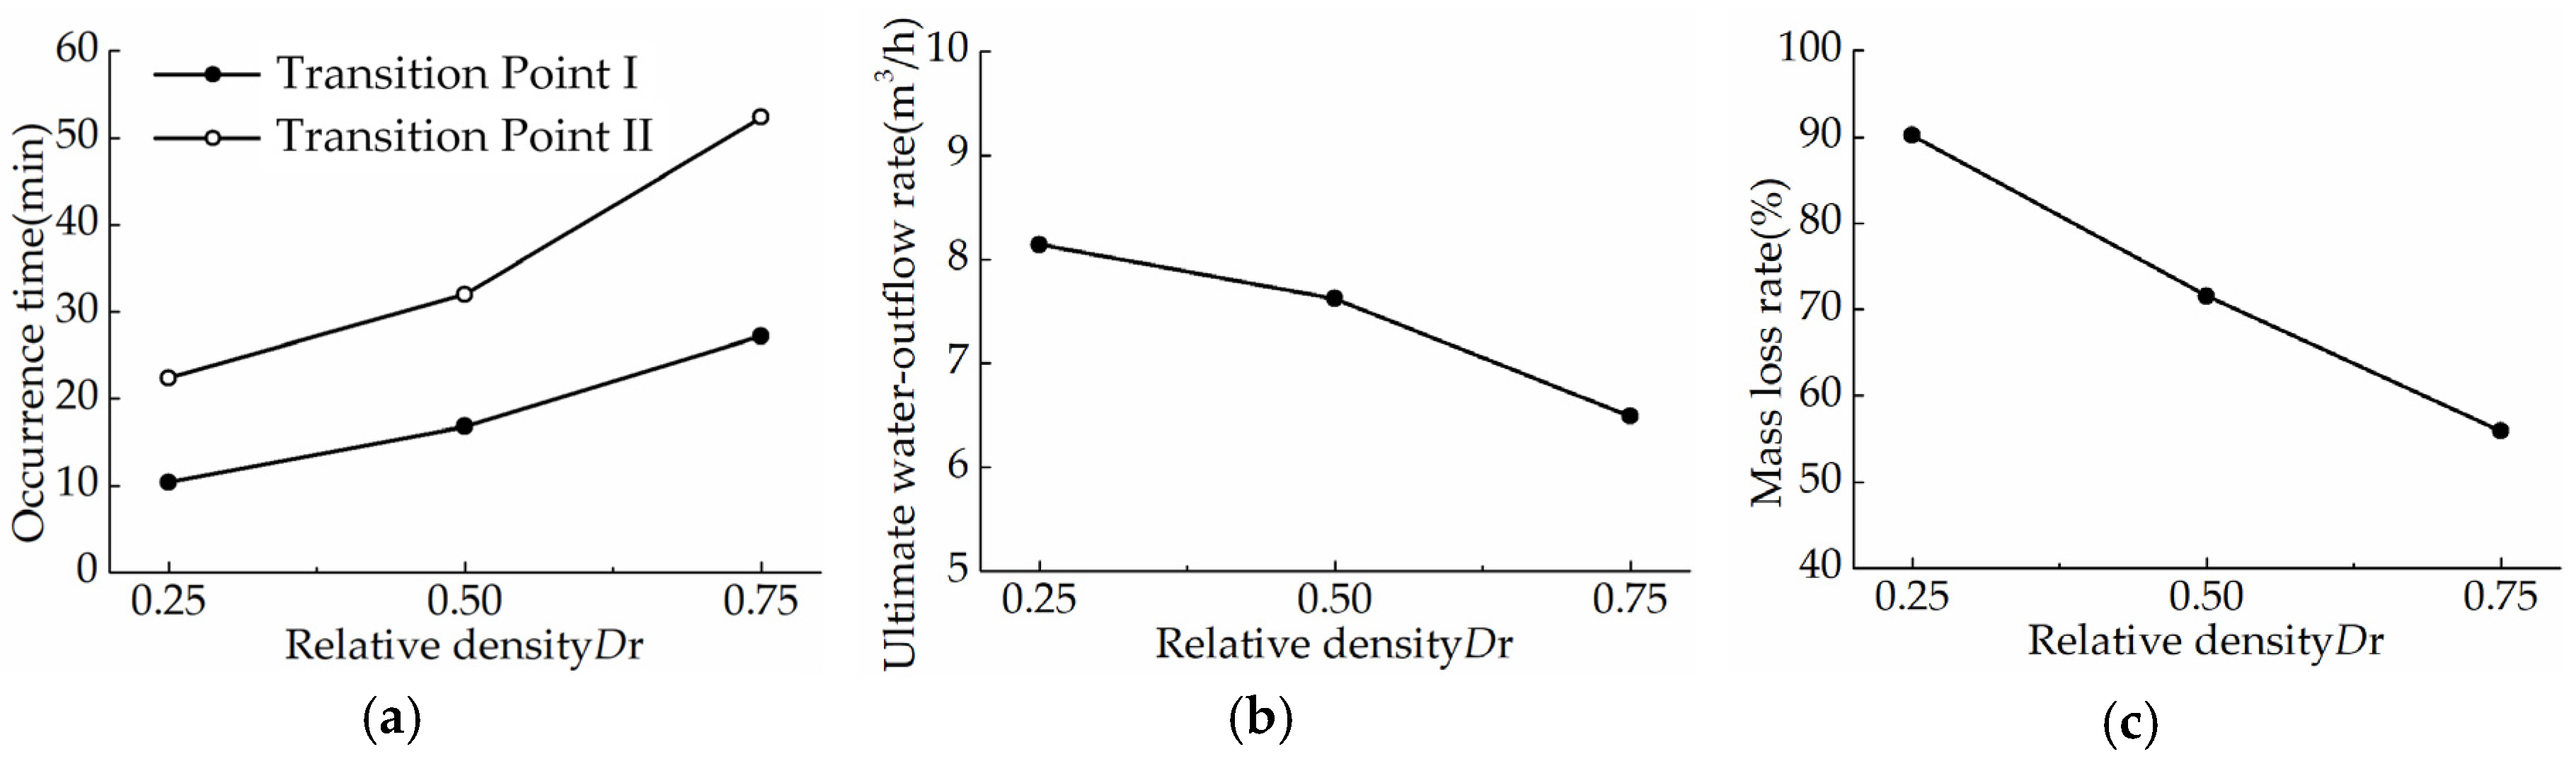
First, the water-outflow rate exhibits distinct changes along with the variation of soil sample’s relative density, as shown in Figure 9a. The occurrence of Transition Point I, II are both delayed with the increase of relative density, as illustrated in Figure 10a and Table 7. Specifically, Transition Point I appears at 10.4th min for the soil sample with relative density as 0.25, and it is delayed to 16.8th min and 27.2th min as relative density rising to 0.50 and 0.75, which indicates the “slow flow” stage is 61.54% and 165.54% delayed, respectively; as for Transition Point II, it appears at 22.4th min for the soil sample with relative density as 0.25, and it is delayed to the 32.0th min and 52.4th min as the relative density up to 0.50 and 0.75, it can be calculated the duration of “transition flow” stage is 26.67% and 210.00% delayed, respectively. This phenomenon shows the “slow flow” and “transition flow” seepage stage are both significantly extended as the rising of soil sample’s relative density, and the extension amplitudes both exponentially increases with the relative density
Secondly, through observation of Figure 9b,c, the occurrence of sands mass concentration’s peak and sands erosion rate’s peak are both delayed with the increase of relative density, consistently matching the variation of Transition Point I, II, respectively; the peak of sands erosion rate and sands mass concentration keep declining with the increase of relative density. The reason behind this is the higher soil compactness generally represents the existence of less voids, more lateral restraints and less free particles, causing more stable soil skeleton and stronger erosion-resistance ability [27]. Therefore, for the soil with higher density under the same hydraulic pressure and confining pressure, sands erosion rate and sands mass concentration remain smaller, which further reduces the particle loss, retards the growth of porosity and permeability, and ends up with lower ultimate water-outflow rate and smaller mass loss rate, as illustrated in Figure 10b,c. The ultimate water-outflow rate decreases to 6.49 m3/h from 8.14 m3/h as the relative density up to 0.75 from 0.25, and meanwhile, the mass loss rate significantly drops to 55.90% from 90.16%. This phenomenon reflects the growth of erosion-resistance ability of soil sample along with an increasing relative density.
3.2.2. Effects of Hydraulic Pressure on Seepage-Erosion Process
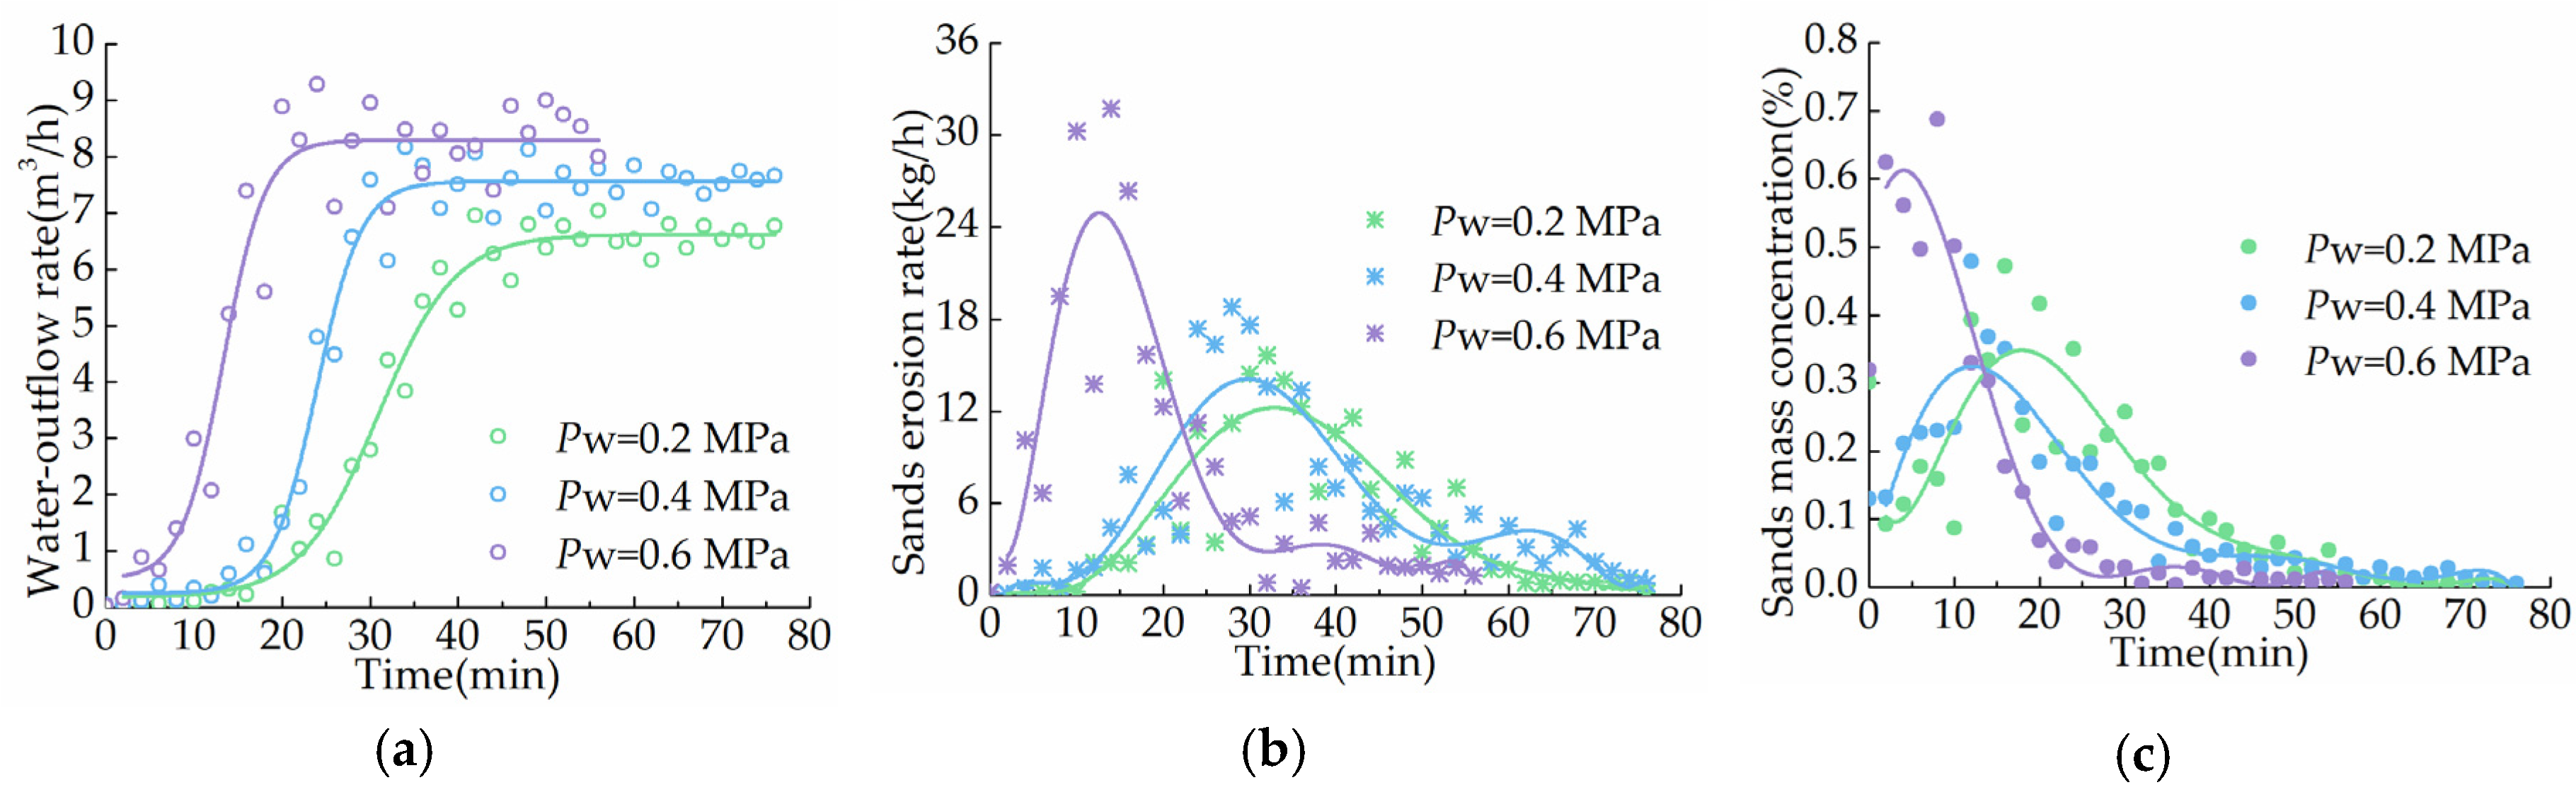
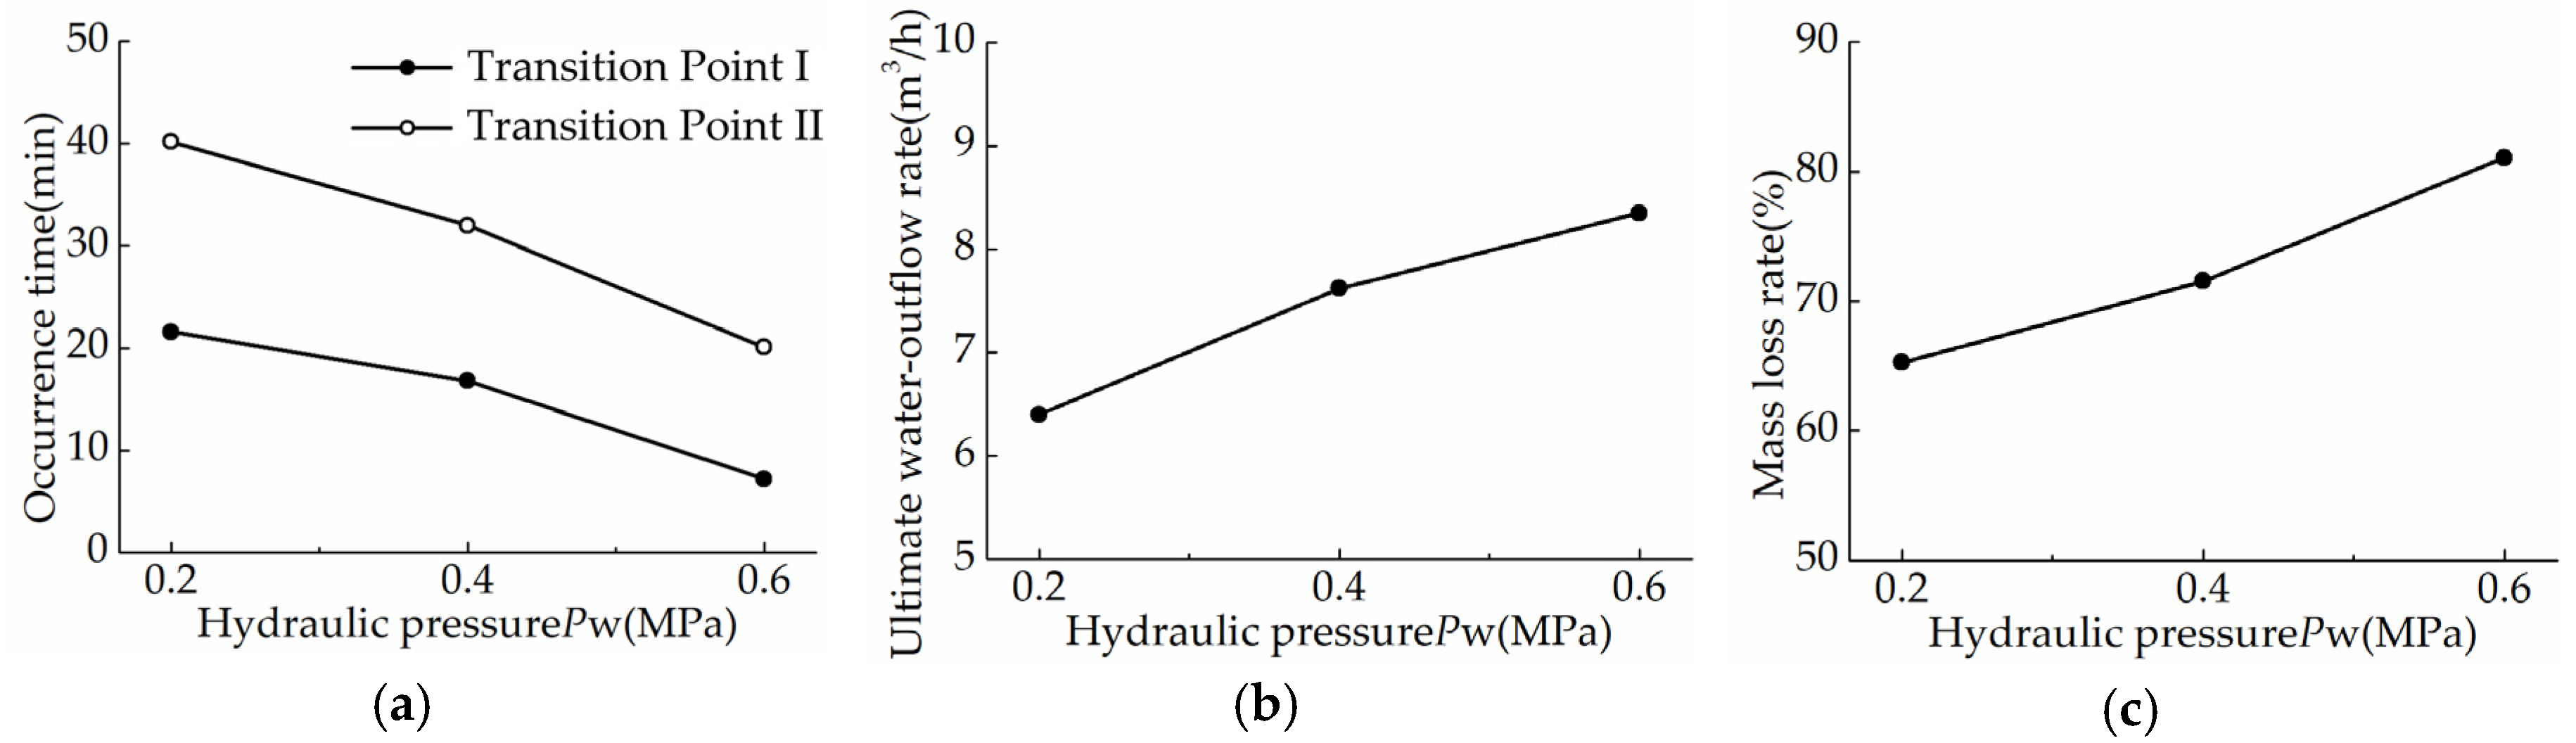
As shown in Figure 11a and Figure 12a, the water-outflow rate is also distinctly affected by hydraulic pressure. Firstly, the occurrence of Transition Point I, II are both advanced with the increase of hydraulic pressure. More specifically, Transition Point I appears at the 21.6th min for the soil sample under hydraulic pressure of 0.2 MPa, and it is delayed to the 16.8th min and 7.2th min as the hydraulic pressure rising to 0.4 MPa and 0.6 MPa, which signifies the “slow flow” stage is 21.22% and 66.67% delayed, respectively. As for Transition Point II, it appears at the 40.2th min for the soil sample with hydraulic pressure of 0.2 MPa, and it is delayed to the 32.0th min and the 20.1th min as the hydraulic pressure up to 0.4 MPa and 0.6 MPa, which denotes the “transition flow” stage is 18.28% and 69.35% delayed, respectively. This phenomenon indicates the “slow flow” and “transition flow” seepage stage are both distinctly shortened as the rising of hydraulic pressure, and the shortening amplitudes both exponentially increases with the hydraulic pressure.
Through observation of Table 8 and Figure 11b,c, the occurrence of sands mass concentration’s peak and sands erosion rate’s peak are both advanced with the increase of hydraulic pressure, highly consistent with the variation of Transition Point I, II, respectively. The peak value of sands erosion rate and sands mass concentration both increase with the rising of hydraulic pressure. It should be noted that, the peak of sands erosion rate appears at 34.2th min for the soil sample with hydraulic pressure of 0.2 MPa, and it is delayed to the 30.1th min and 13.1th min as the hydraulic pressure up to 0.4 MPa and 0.6 MPa, which is 11.99% and 61.70% delayed, respectively. As seen, compared with the hydraulic pressure increasing from 0.2 MPa to 0.4 MPa, the advancing amplitude of sands erosion rate peak’s occurrence is significantly greater as hydraulic pressure up to 0.6 MPa from 0.4 MPa, which indicates the existence of critical hydraulic pressure between 0.4 MPa and 0.6 MPa, and the seepage-erosion process is supposed to be significantly accelerated once the hydraulic pressure over the critical value.
As demonstrated in Figure 12b,c, the ultimate water-outflow rate increases from 6.40 m3/h to 8.35 m3/h as the hydraulic pressure up to 0.6 MPa from 0.2 MPa, in the meantime, the mass loss rate significantly increases to 81.13% from 65.30%. This phenomenon shows that, with the same compactness and confining pressure, higher hydraulic pressure results in greater seepage rate and dragging force, which manifests as stronger erosion ability. Therefore, at the initiation stage of seepage-erosion process, more fine and free particles are migrated into the fluid, resulting in higher sands erosion rate and sands mass concentration, which further accelerates the seepage channels’ formation, as well as the occurrence of “pipe flow” stage.
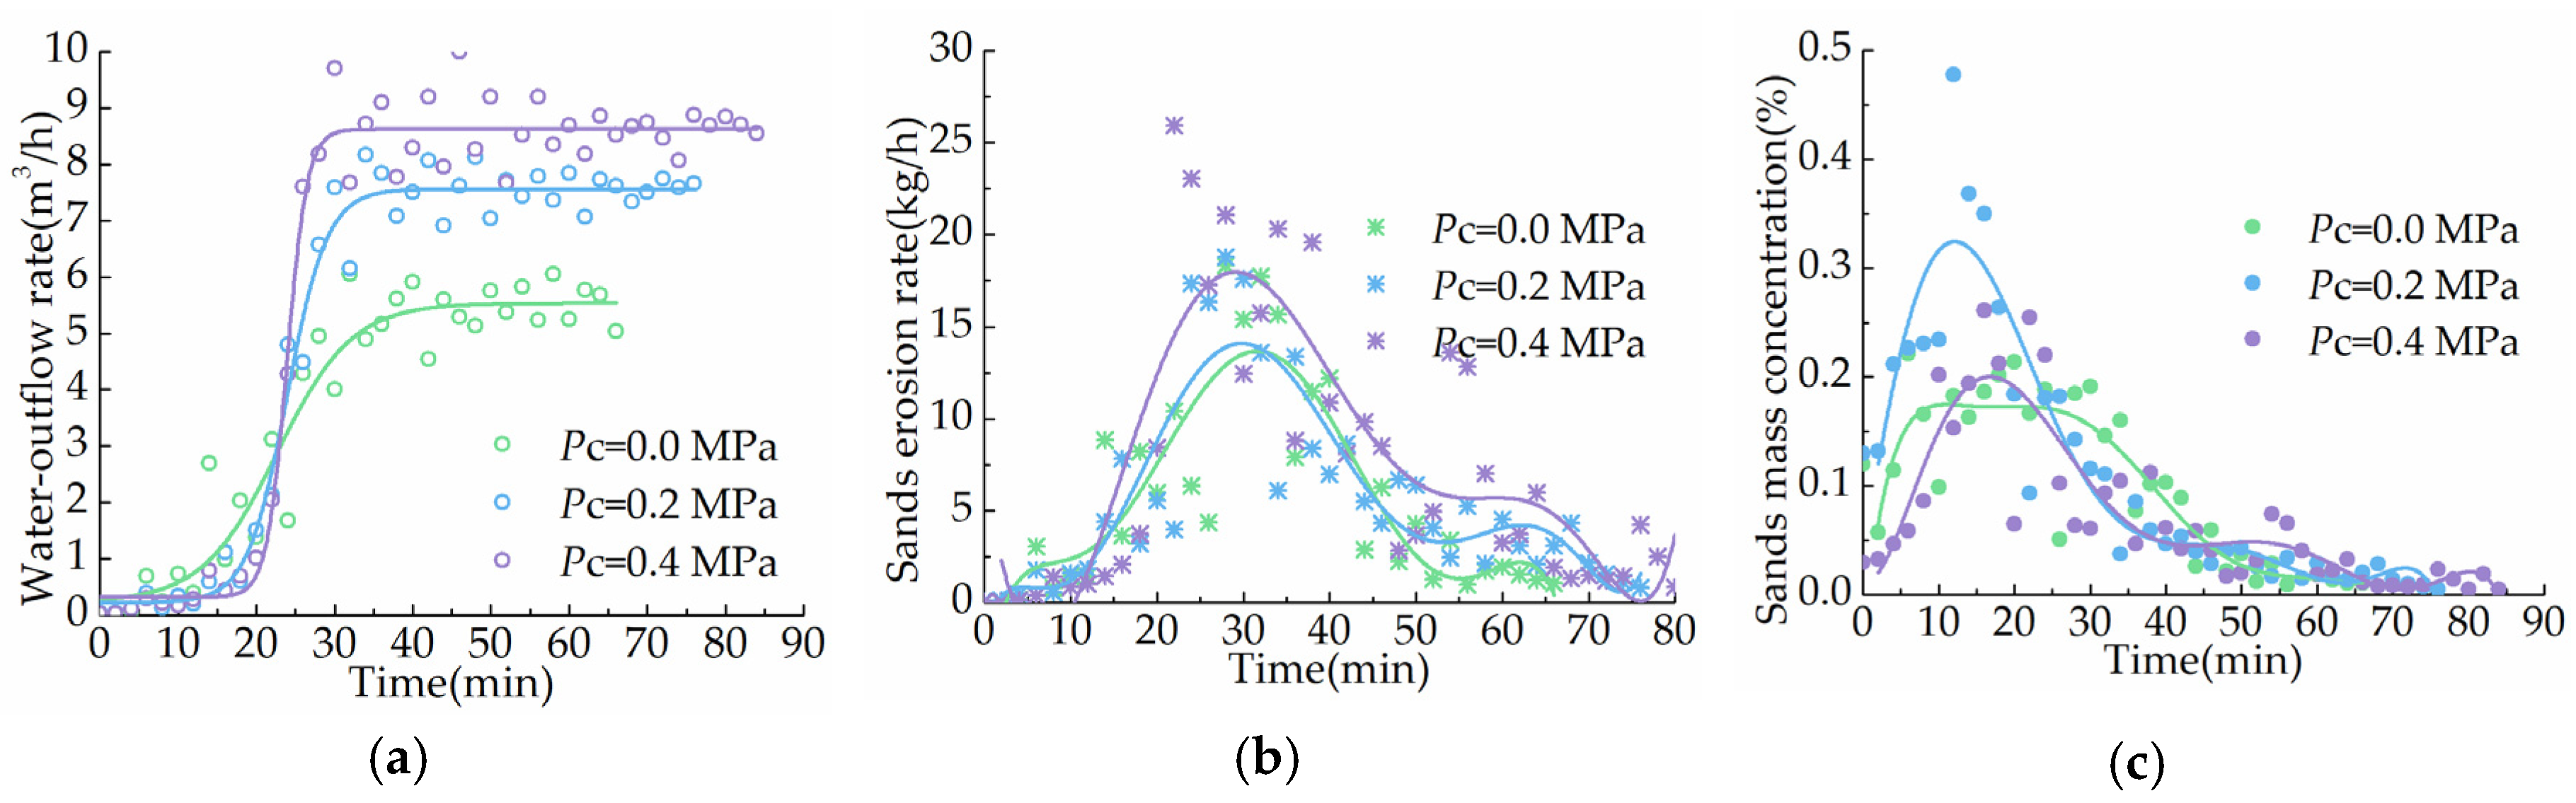
3.2.3. Effects of Confining Pressure on Seepage-Erosion Process
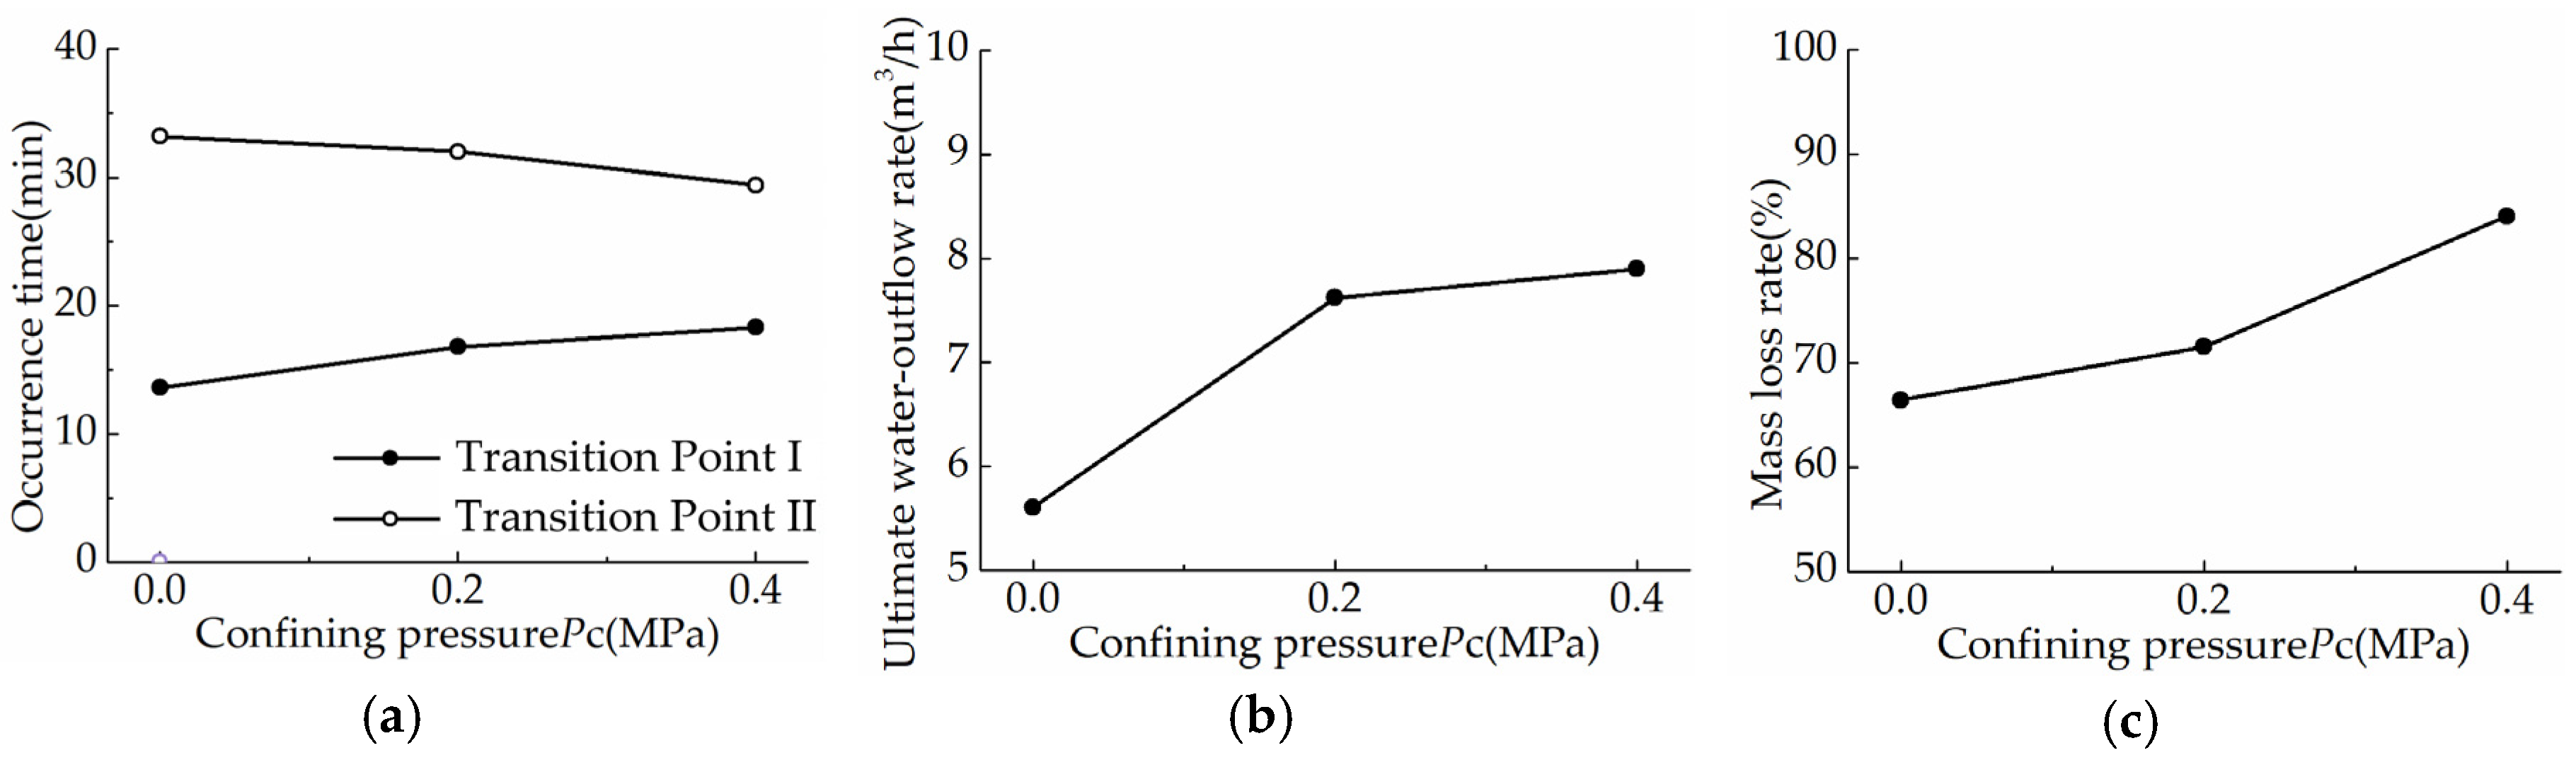
First, the water-outflow rate displays distinct changes with confining pressure, as shown in Figure 13a and Figure 14b. The ultimate water-outflow rate changes to 8.02 m3/h from 6.34 m3/h as the confining pressure up to 0.4 MPa from zero. In addition, through the observation of Table 9 and Figure 14a, the occurrence of Transition Point I delays with the increase of confining pressure, while the occurrence of Transition Point II is slightly advanced. More specifically, Transition Point I appears at the 13.6th min for the soil sample without confining pressure, and it is delayed to the 16.8th min and 18.3th min as the confining pressure rising to 0.2 MPa and 0.4 MPa, respectively. As for Transition Point II, it appears at the 33.2th min for the soil sample without confining pressure, and it is advanced to 32.0th min and 29.4th min as the confining pressure up to 0.2 MPa and 0.4 MPa, respectively. It can be determined that the duration of “slow flow” stage is 23.53% and 34.56% extended as the confining pressure up to 0.2 MPa and 0.4 MPa; while the “transition flow” stage is 22.45% and 56.63% shortened correspondingly. This phenomenon indicates the increasing confining pressure extend the “slow flow” seepage stage, but shortens the “transition flow” stage at the same time, and the variation amplitude increases with the growth of confining pressure.
Secondly, through observation of Figure 13b,c the occurrence of sands mass concentration’s peak and sands erosion rate’s peak are both consistently matching the variation of Transition Point I, II, respectively. The peak value of sands erosion rate increases with the confining pressure, which denotes higher confining pressure brings stronger erosion ability, as demonstrated in Figure 14c, the mass loss rate significantly increases to 84.07% from 66.46% as confining pressure up to 0.4 MPa from zero. Meanwhile, the peak value of sands mass concentration shows slight fluctuations as the confining pressure rises.
The impacting mechanism behind is that, higher confining pressure exerts greater compression on soil particles, which increases the compactness, strength and the erosion-resistance ability [28], thus the “slow flow” stage will be extended under higher confining pressure; after entering the “transition flow” stage, considerable soil particles eroded away, causing more voids and less lateral supports for soil particles, which transforms the compressing force into shear force, further destabilizes soil particles and ultimately accelerates the “transition flow” stage with greater erosion ability.
3.3. Identification and Forecast of Seepage-Erosion’s Evolutionary Process
Based on the elaboration in last two sections, it’s reasonable to conclude that particle loss caused by seepage-erosion is the internal mechanism of water–sand inrush; the variation of water-outflow characteristics are external manifestations correspondingly. In other words, with the acquaintance of external manifestations’ variation features, the specific seepage stage where the water–sand inrush is located can be accurately identified, which could theoretically offer possibilities to forecast the occurrence of water–sand inrush.
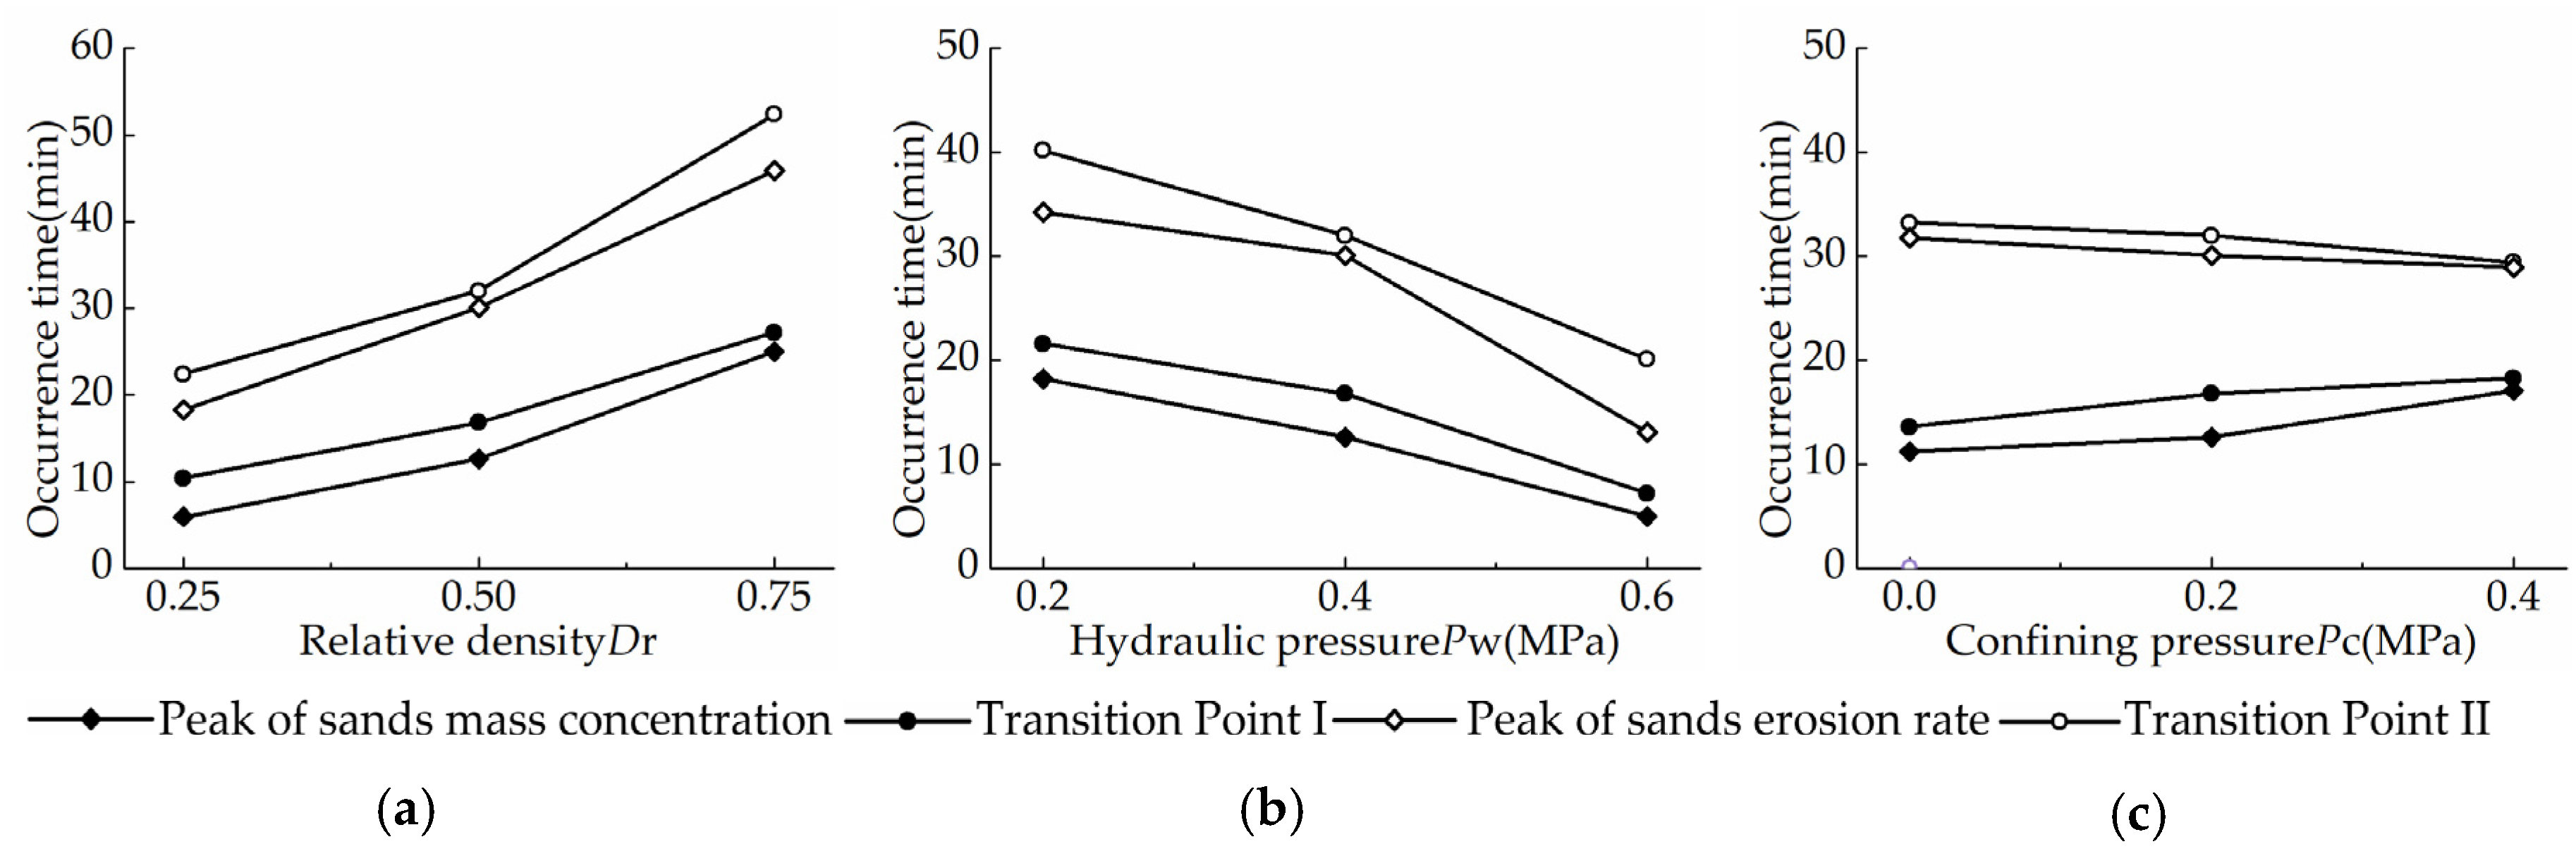
As introduced in Section 3.1, the whole seepage-erosion process is visually spit by Transition Point I, II, characterized with distinct non-linear features, thus the identification of seepage-erosion stage can be determined through the location of Transition Point I, II, which can be accessed through the extremum analysis of water-outflow rate. While considering the complexity of the geo-environment in practical geo-conditions, solely relying on the variation of water-outflow rate seems not adequate and reliable. Through further observation of the seepage test results in Table 6 and Figure 15, one crucial phenomenon should be noted, the occurrence of Transition Point I is closely behind the peak of sands mass concentration. For instance, as shown in Figure 15a, the appearance time of Transition Point I is the 10.4th min, 16.8th min and 27.2th min, as the relative density increasing to 0.75 from 0.25, the peak of sands mass concentration appears at the 5.9th min, 12.6th min and 25.0th min correspondingly, with only 4.5 mins, 4.2 mins and 2.2 mins ahead; as for Transition Point II, it appears at the 22.4th min, 32.0th min and 52.4th min, and the peak of sands mass concentration shows up at the 18.2th min, 30.1th min and 45.9th min correspondingly when the relative density up to 0.75 from 0.25, respectively with only 4.2 mins, 1.9 mins and 6.5 mins in advance. This manifestation that the peak of sands mass concentration occurs slightly ahead of Transition Point I, the peak of sands erosion rate occurs slightly ahead of Transition Point II, which also applies to other groups under varying hydraulic pressure and confining pressure as shown in Figure 15b,c.
It can be briefly summarized that the sequence between sands mass concentration’s peak, sands erosion rate’s peak, and transition points is confirmed. To be precise, the seepage stage can be theoretically determined through the identification of Transition Point I, II, and further verified by locating the peak of sands mass concentration and sands erosion rate, respectively. Therefore, with the monitoring data of flow characteristics in practical situation, the critical status of water–sand inrush can be near-real-time identified, which offers an early warning to respond in a timely manner and the basis for ultimately forecasting the occurrence of water–sand inrush. It should be emphasized that the employ of polynomial of 7th order is to precisely fit the variation of sands erosion rate and sands mass concentration, which cannot be employed to quantitatively predict their variation tendency even with extremely high correlation. The strict regression equation needs to be developed and validated through more experiment datasets.
4. Discussion and Conclusions
This experiment study focuses on the water–sand inrush disaster caused by the instability of filling medium in karst cavity. In response to this purpose, a stress-controlled seepage test apparatus in consideration of particle erosion phenomenon was designed, and a series of seepage tests were carried out correspondingly. The water-outflow rate, sands erosion rate and sands mass concentration were adopted as main indicators to analyze the variation characteristics of seepage-erosion process, as well as the impacts of soil compactness, hydraulic pressure and confining pressure. It should be noted that the stability status of filling medium in karst cavities is also affected by the excavation disturbance and soil compaction history [3], which are currently difficult to be considered in model tests. Moreover, besides the impact factors investigated in this paper, the progress characteristics of water–sand inrush is also tightly related to the soil constituents, karst cavity geometry and others. Nevertheless, the main findings concluded in this study still have typical representatives for the evolution characteristics of seepage-erosion process, and offer significant comprehension of water–sand inrush’s progress. More critically, it provides important experiment foundations for the early warning and forecast of water–sand inrush in practice. The main conclusions can be briefly summarized as follows.
(1): According to the non-linear characteristics of water-outflow pattern, the whole seepage-erosion process can be split into three seepage stages, “slow flow” stage, “transition flow” stage and “pipe flow” stage. It can be concluded that the particle erosion is the internal mechanism of water–sand inrush, and the variation characteristics of water-outflow pattern are the external manifestation of seepage-erosion progress.
(2): The seepage-erosion phenomenon is obviously affected by soil compactness, hydraulic pressure and confining pressure. The “slow flow” and “transition flow” seepage stages are both extended as the higher relative density brings stronger erosion-resistance ability, and the extension amplitudes exponentially increase with the relative density. In contrast, the higher hydraulic pressure causes greater particles erosion ability, which shortens the seepage-erosion process, and the shortening amplitude also increases exponentially with the hydraulic pressure; the increasing confining pressure extends the “slow flow” seepage stage by providing more compression, but shortens the duration of “transition flow” stage as the compression transforms into shear force. In addition, the existence of critical hydraulic pressure for the seepage-erosion progress is confirmed, and the occurrence of “pipe flow” stage is significantly advanced once the hydraulic pressure over the critical value. For practical purposes, the value of critical hydraulic pressure under specific geo-conditions needs to be further systematically explored in the future.
(3): The specific seepage stage where the seepage-erosion process is located can be identified by Transition Point I, II, which are obtained through the extremum analysis of water-outflow rate’s fitted curve, and confirmed by the occurrence of sands mass concentration’s peak and sands erosion rate’s peak, respectively. In other words, with the monitoring data of inrush fluid’s flow pattern as precursors in practical situation, the critical status of water–sand inrush can be theoretically identified, which offers an early warning to respond in a timely manner and theoretical possibilities to ultimately forecast the occurrence of this type of disaster.
Author Contributions
Methodology, Q.L. and B.L.; formal analysis, Q.L.; writing—original draft preparation, Q.L.; writing—review and editing, Q.L. and B.L.; supervision, Q.L. All authors have read and agreed to the published version of the manuscript.
Funding
This research was funded by the National Natural Science Foundation of China, grant number 41672311 and 51991392.
Conflicts of Interest
The authors declare no conflict of interest.
References
- Goldscheider, N. Karst groundwater vulnerability mapping: Application of a new method in the Swabian Alb, Germany. Hydrogeol. J. 2005, 13, 555–564. [Google Scholar] [CrossRef]
- Gutiérrez, F.; Parise, M.; De, W.J.; Jourde, H. A review on natural and human-induced geohazards and impacts in karst. Earth-Sci. Rev. 2014, 138, 61–88. [Google Scholar] [CrossRef]
- Waltham, T.; Waltham, A.C.; Bell, F.G.; Culshaw, M.G. Sinkholes and Subsidence: Karst and Cavernous Rocks in Engineering and Construction; Springer Science & Business Media: Berlin, Germany, 2005. [Google Scholar] [CrossRef]
- Kajzar, V. Geodetic and seismological observations applied for investigation of subsidence formation in the CSM mine (Czech Republic). Min. Miner. Depos. 2018, 12, 34. Available online: http://ir.nmu.org.ua/handle/123456789/152716 (accessed on 5 May 2020). [CrossRef]
- Morrissey, P.J.; Mccormack, T.; Naughton, O. Modelling groundwater flooding in a lowland karst catchment. J. Hydrol. 2019, 580, 124361. [Google Scholar] [CrossRef]
- Cao, J.H.; Jiang, Z.C.; Yuan, D.X.; Xia, R.Y.; Zhang, C. The progress in the study of the karst dynamic system and global changes in the past 30 years. Geol. China 2017, 44, 874–900. (In Chinese) [Google Scholar]
- Sciencenet: The Announcement of 1:1 Million Global Karst Geology Series’ Map Compilation Plan. Available online: http://www.cgs.gov.cn/xwl/ddyw/201811/t20181118_471624.html (accessed on 12 April 2020).
- Wang, J.A.; Park, H.D. Coal mining above a confined aquifer. Int. J. Rock Mech. Min. 2003, 40, 537–551. [Google Scholar] [CrossRef]
- Bieniawski, Z.T. Improved design of coal pillars for us mining conditions: Proc 1st conference on ground control in mining. Int. J. Rock Mech. Min. 1983, 20, 13. [Google Scholar] [CrossRef]
- Yang, T.H.; Liu, J.; Zhu, W.C.; Elsworth, D.; Tham, L.G.; Tang, C.A. A coupled flow-stress-damage model for groundwater outbursts from an underlying aquifer into mining excavations. Int. J. Rock Mech. Min. 2007, 44, 87–97. [Google Scholar] [CrossRef]
- Xu, Z.H.; Huang, X.; Li, S.C.; Lin, P.; Shi, X.S.; Wu, J. A new slice-based method for calculating the minimum safe thickness for a filled-type karst cave. B Eng. Geol. Environ. 2020, 79, 1097–1111. [Google Scholar] [CrossRef]
- Liu, S.L.; Liu, W.T.; Yin, D.W. Numerical simulation of the lagging water inrush process from insidious fault in coal seam floor. Geotech. Geol. Eng. 2017, 35, 1013–1021. [Google Scholar] [CrossRef]
- Yao, B.H.; Wei, J.P.; Wang, D.K.; Ma, D.; Chen, Z.Q. Numerical study on seepage property of karst collapse columns under particle migration. CMES-Comp. Model. Eng. Sci. 2013, 91, 81–100. [Google Scholar] [CrossRef]
- Zhou, Z.Q. Evolutionary Mechanism of Water Inrush through Filling Structures in Tunnels and Engineering Applications. Ph.D. Thesis, Shandong University, Jinan, Shandong, China, 2016. [Google Scholar]
- Kaufmann, G.; Romanov, D. Modelling long-term and short-term evolution of karst in vicinity of tunnels. J. Hydrol. 2020, 581, 124282. [Google Scholar] [CrossRef]
- Ma, D.; Bai, H.B.; Chen, Z.Q. Effect of particle mixture on seepage properties of crushed mudstones. Transp. Porous Med. 2015, 108, 257–277. [Google Scholar] [CrossRef]
- Liu, J.Q.; Chen, W.Z.; Liu, T.G. Effects of initial porosity and water pressure on seepage-erosion properties of water inrush in completely weathered granite. Geofluids 2018, 1–11. [Google Scholar] [CrossRef] [Green Version]
- Liu, J.Q.; Chen, W.Z.; Deng, Z.P. Impacts of confining pressure and safety thickness on water and mud inrush in weathered granite. Mar. Georesour. Geotechnol. 2020, 38, 144–153. [Google Scholar] [CrossRef]
- Watson, P.D.J.; John, N.W.M. Geotextile filter design and simulated bridge formation at the soil–geotextile interface. Geotext. Geomembr. 1999, 17, 265–280. [Google Scholar] [CrossRef]
- Shi, S.S. Study on Seepage Failure Mechanism and Risk Control of Water Inrush Induced by Filled Disaster Structure in Deep-Long Tunnel and Engineering Applications. Ph.D. Thesis, Shandong University, Jinan, Shandong, China, 2014. (In Chinese). [Google Scholar]
- Zhou, G.; Huang, J.; Tao, X.; Luo, Q.; Zhang, R.; Liu, Z. Overview of 30 years of research on solubility trapping in Chinese karst. Earth-Sci. Rev. 2015, 146, 183–194. [Google Scholar] [CrossRef] [Green Version]
- Walsh, J.B. Effect of pore pressure and confining pressure on fracture permeability. Int. J. Rock Mech. Min. 1981, 18, 429–435. [Google Scholar] [CrossRef]
- Jamiolahmady, M.; Danesh, A.; Sohrabi, M.; Duncan, D.B. Flow around a rock perforation surrounded by crushed zone: Experiments vs. theory. J. Petrol. Sci. Eng. 2006, 50, 102–114. [Google Scholar] [CrossRef]
- Charles, J.A.; Watts, K.S. The influence of confining pressure on the shear strength of compacted rockfill. Geotechnique 1980, 30, 353–367. [Google Scholar] [CrossRef]
- Hatanaka, M.; Lei, F. Estimating relative density of sandy soils. Soils Found. 2006, 46, 299–313. [Google Scholar] [CrossRef] [Green Version]
- Bear, J. Dynamics of Fluids in Porous Media; Courier Corporation: North Chelmsford, MA, USA, 1988. [Google Scholar]
- Fell, R.; Wan, C.F.; Cyganiewicz, J.; Foster, M. Time for development of internal erosion and piping in embankment dams. J. Geotech. Geoenviron. Eng. 2003, 129, 307–314. [Google Scholar] [CrossRef]
- Tomlinson, S.S.; Vaid, Y.P. Seepage forces and confining pressure effects on piping erosion. Can. Geotech. J. 2000, 37, 1–13. [Google Scholar] [CrossRef]
Figure 1.
Schematic diagram of water–sand inrush during underground construction.
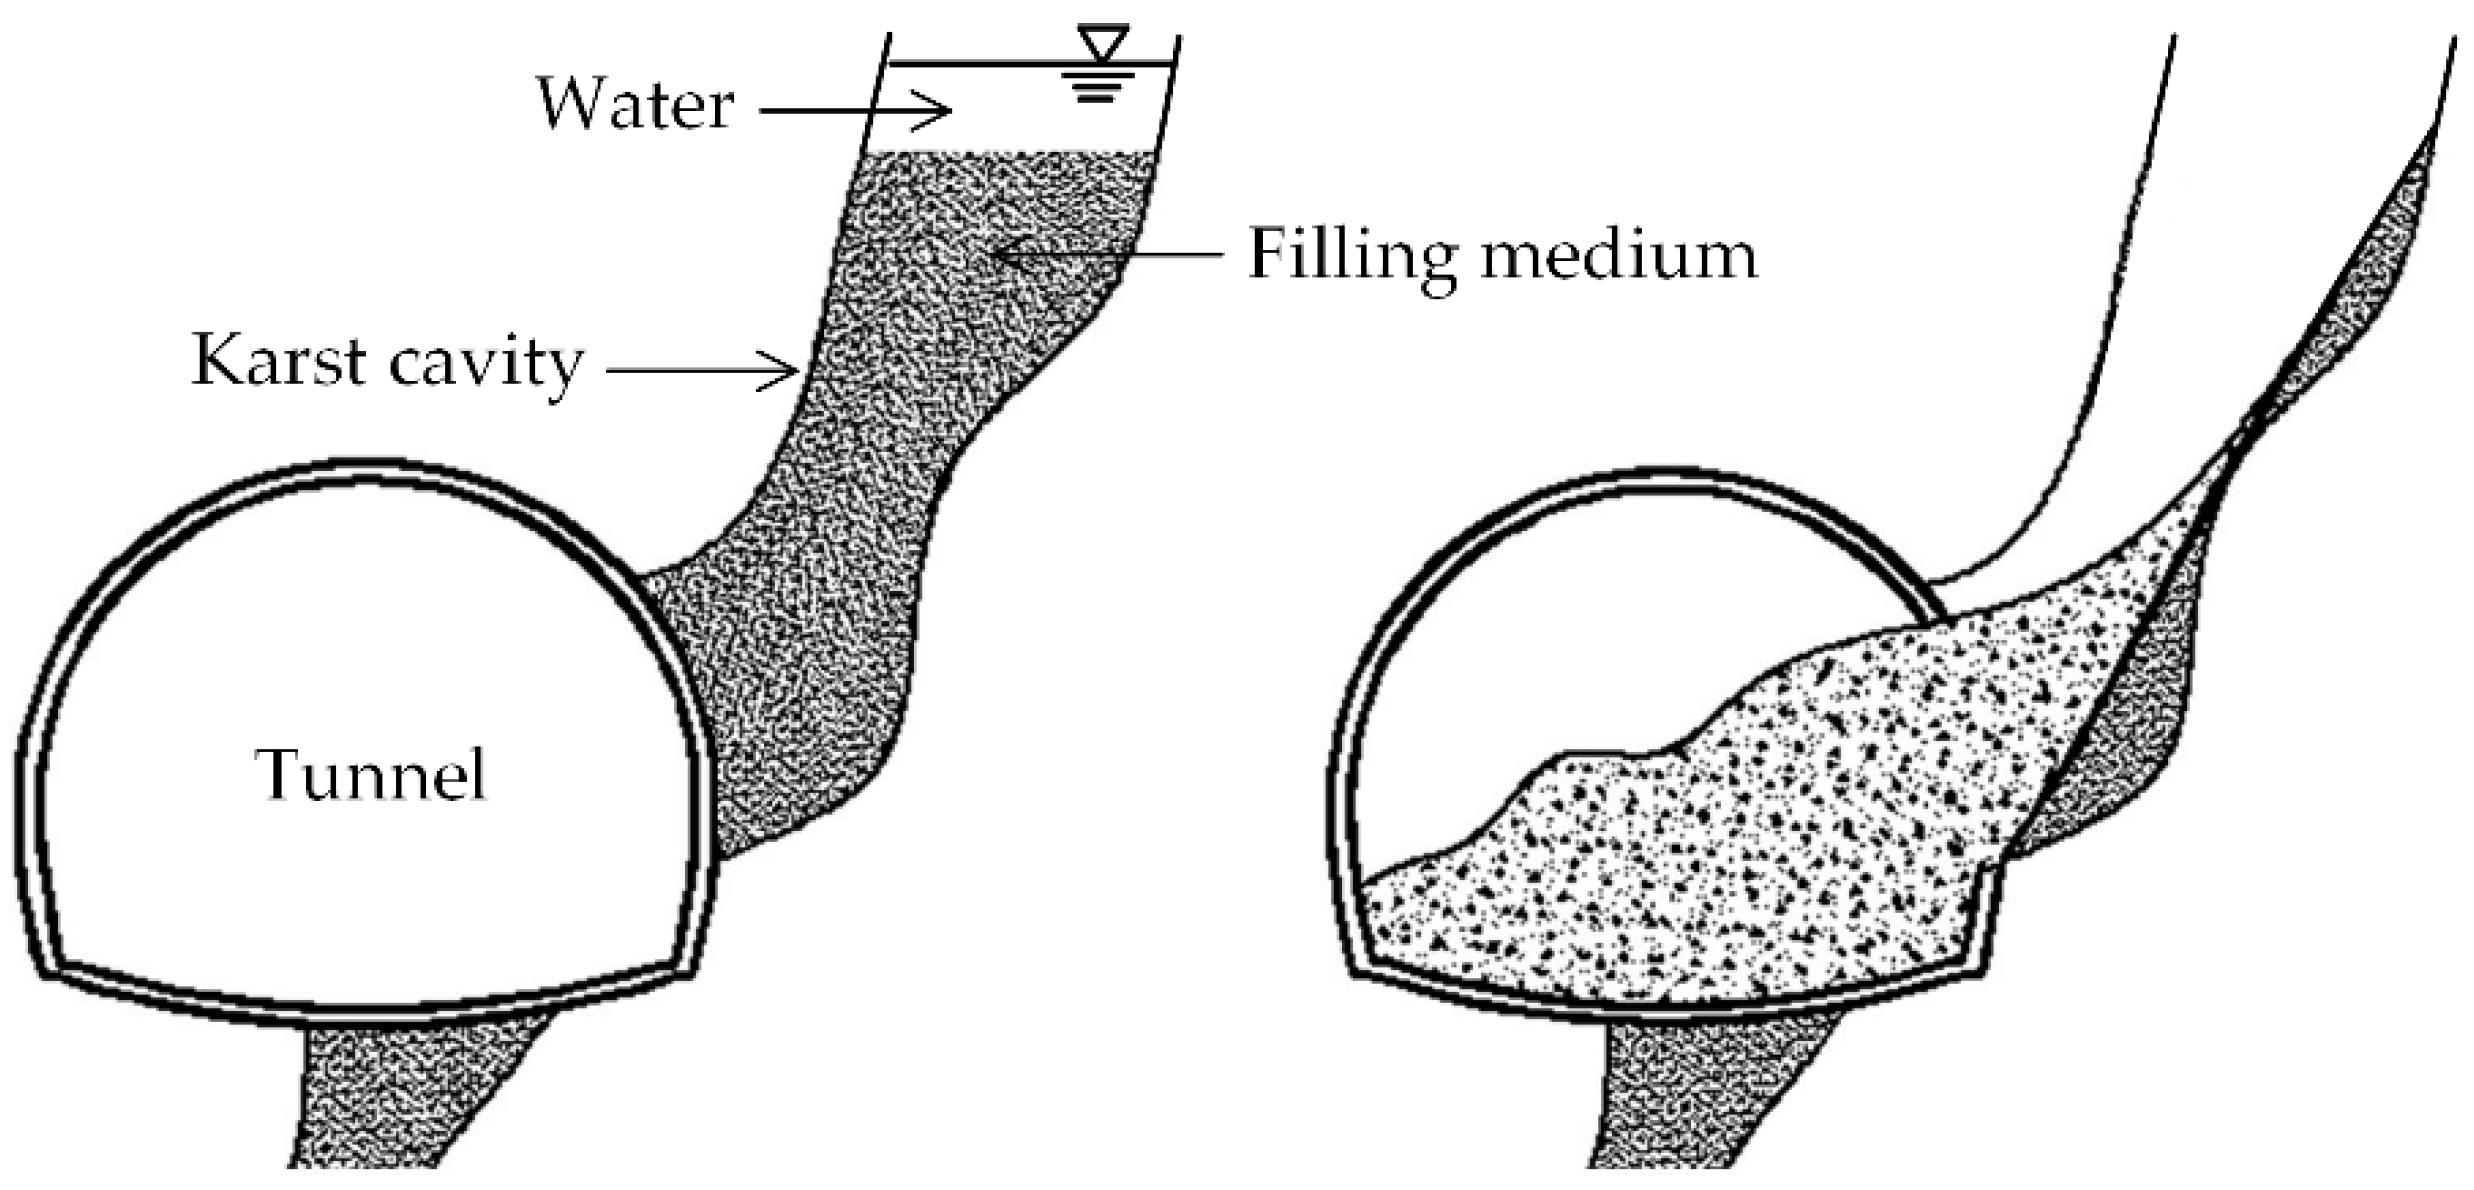
Figure 2.
Schematic diagram of the seepage test apparatus.
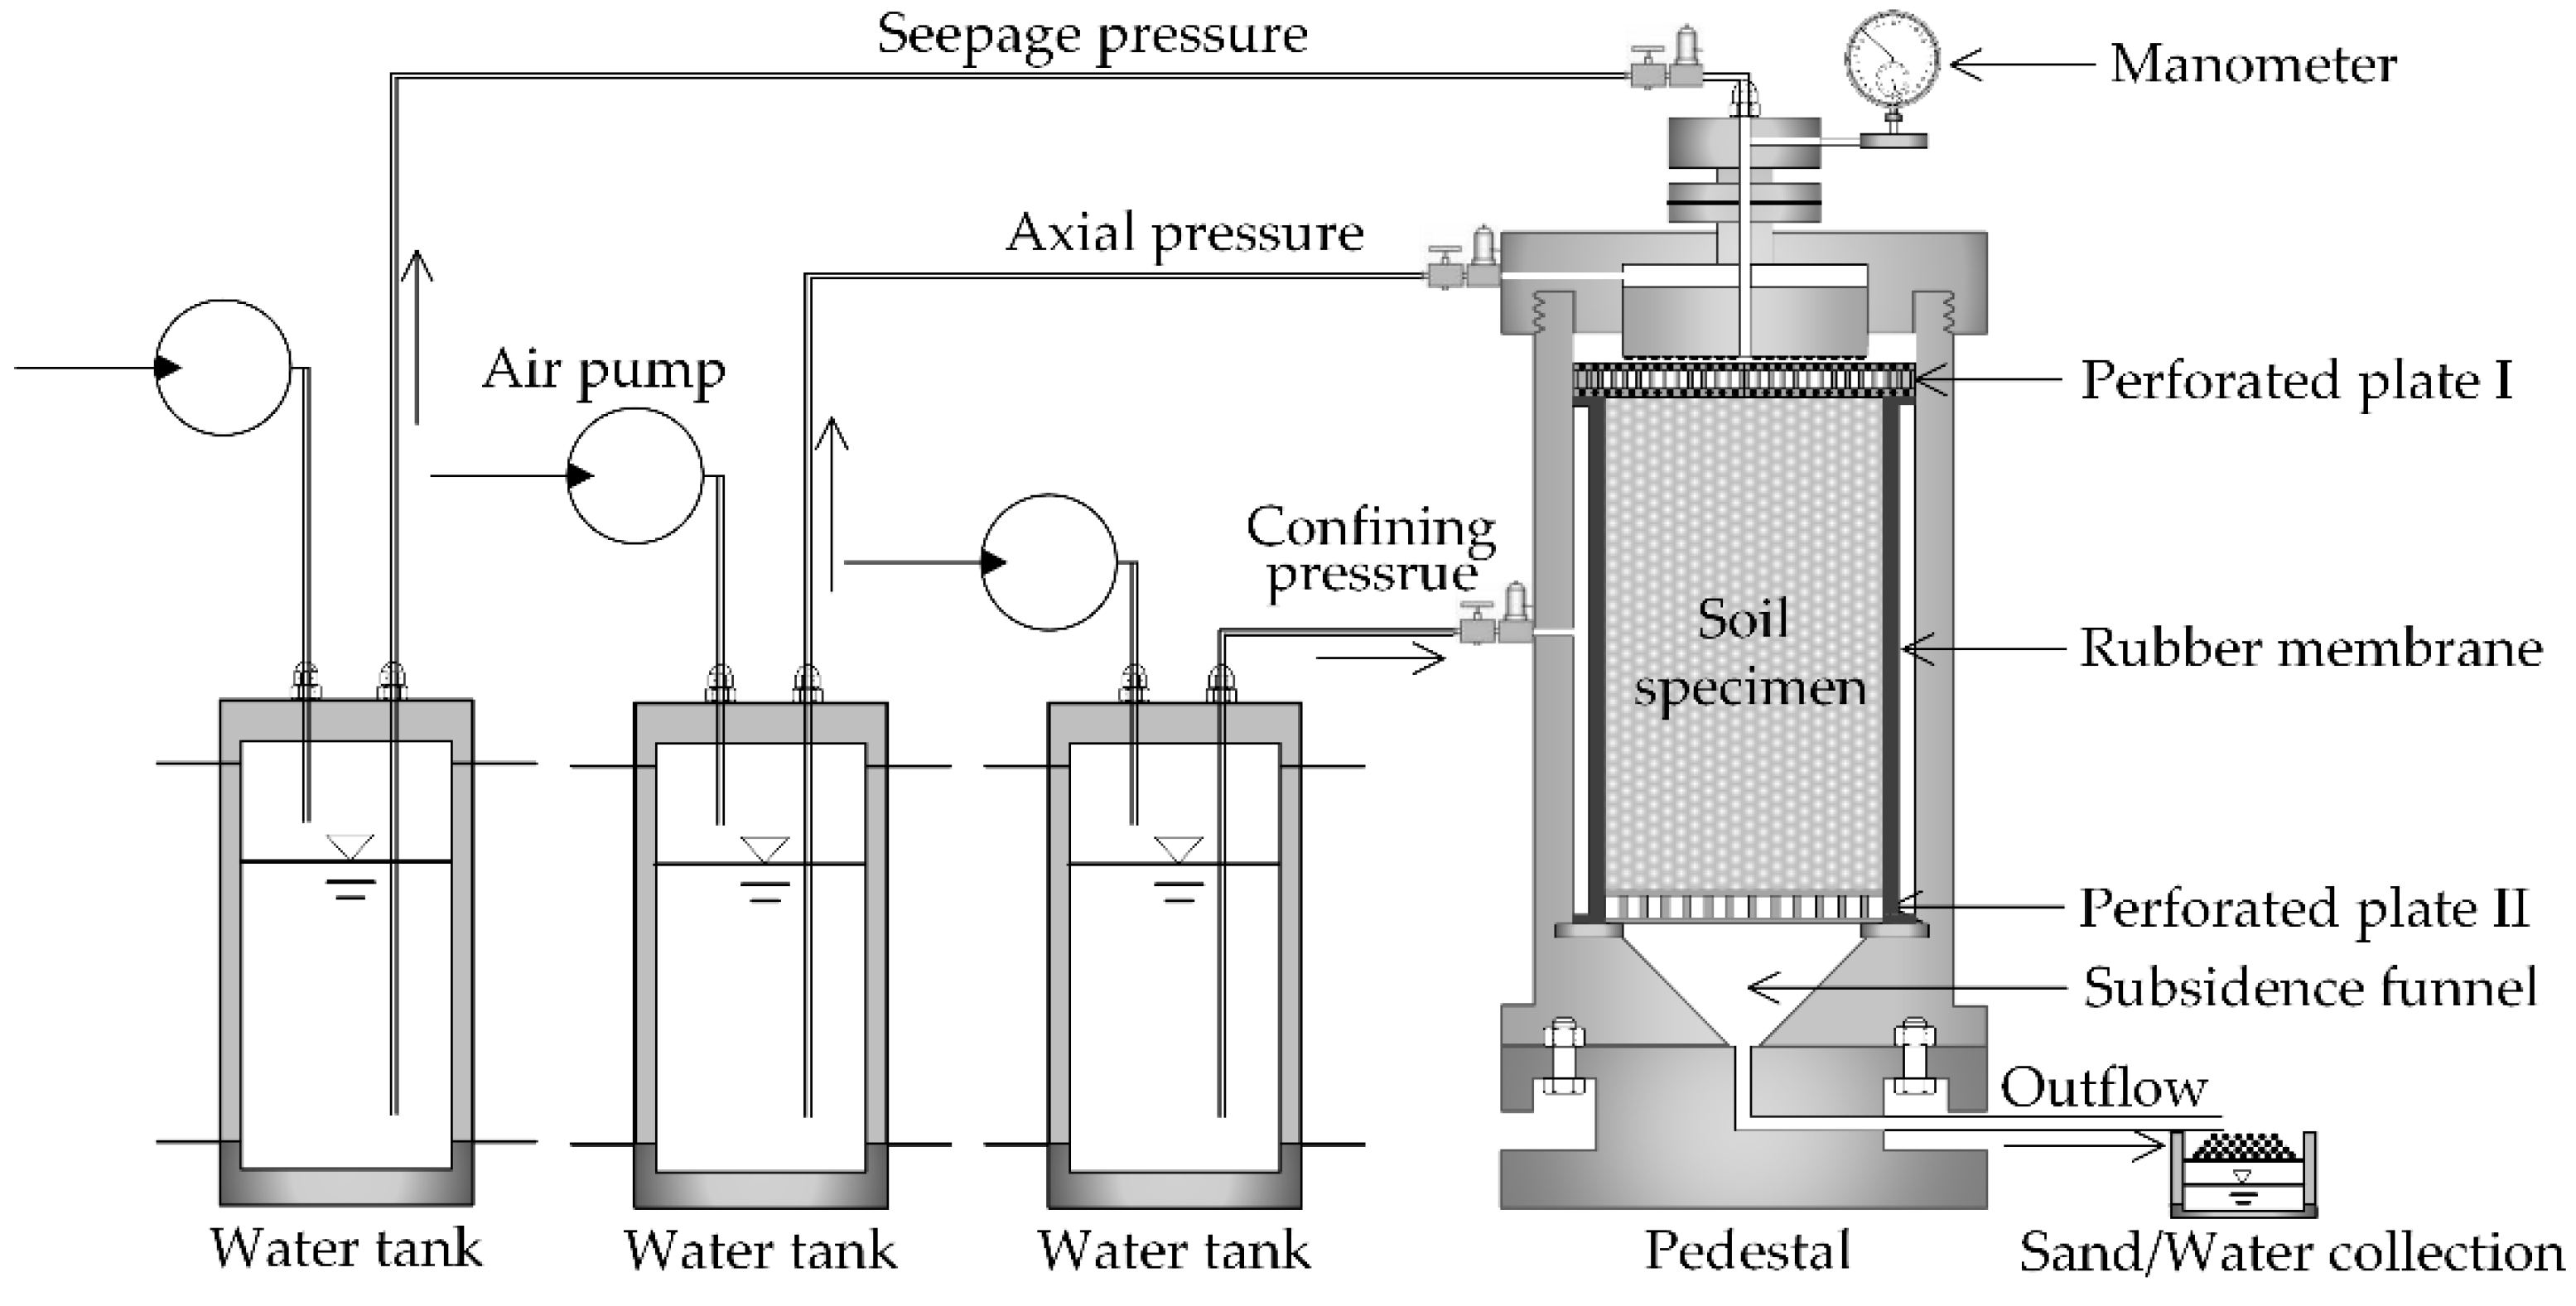
Figure 3.
Principal part of the seepage test apparatus.

Figure 4.
Event introduction of Pingkan tunnel. (a) Location of Pingkan tunnel [21]; (b) Water–sand inrush disasters in Pingkan tunnel.
Figure 4.
Event introduction of Pingkan tunnel. (a) Location of Pingkan tunnel [21]; (b) Water–sand inrush disasters in Pingkan tunnel.

Figure 5.
Grading curve of the soil sample

Figure 6.
The variation tendency of monitoring objects with influence factors.

Figure 7.
Seepage test results of group 2.

Figure 8.
Grain-size curve of eroded soil particles.

Figure 9.
Variation curve of monitoring objects with relative density (Dr). (a) Variation of water-outflow rate with relative density; (b) Variation of sands erosion rate with relative density; (c) Variation of sands mass concentration with relative density.
Figure 9.
Variation curve of monitoring objects with relative density (Dr). (a) Variation of water-outflow rate with relative density; (b) Variation of sands erosion rate with relative density; (c) Variation of sands mass concentration with relative density.

Figure 10.
Variation tendency of monitoring objects’ characteristic value with relative density (Dr). (a) Occurrence time of Transition Point I, II along with relative density; (b) Ultimate water-outflow rate along with relative density; (c) Mass loss rate along with relative density.
Figure 10.
Variation tendency of monitoring objects’ characteristic value with relative density (Dr). (a) Occurrence time of Transition Point I, II along with relative density; (b) Ultimate water-outflow rate along with relative density; (c) Mass loss rate along with relative density.

Figure 11.
Variation curve of monitoring objects with hydraulic pressure (Pw). (a) Variation of water-outflow rate with hydraulic pressure; (b) Variation of sands erosion rate with hydraulic pressure; (c) Variation of sands mass concentration with hydraulic pressure.
Figure 11.
Variation curve of monitoring objects with hydraulic pressure (Pw). (a) Variation of water-outflow rate with hydraulic pressure; (b) Variation of sands erosion rate with hydraulic pressure; (c) Variation of sands mass concentration with hydraulic pressure.

Figure 12.
Variation tendency of monitoring objects’ characteristic value with hydraulic pressure (Pw). (a) Occurrence time of Transition Point I, II along with hydraulic pressure; (b) Ultimate water-outflow rate along with hydraulic pressure; (c) Mass loss rate along with hydraulic pressure.
Figure 12.
Variation tendency of monitoring objects’ characteristic value with hydraulic pressure (Pw). (a) Occurrence time of Transition Point I, II along with hydraulic pressure; (b) Ultimate water-outflow rate along with hydraulic pressure; (c) Mass loss rate along with hydraulic pressure.

Figure 13.
Variation curve of monitoring objects with confining pressure (Pc). (a) Variation of water-outflow rate with confining pressure; (b) Variation of sands erosion rate with confining pressure; (c) Variation of sands mass concentration with confining pressure.
Figure 13.
Variation curve of monitoring objects with confining pressure (Pc). (a) Variation of water-outflow rate with confining pressure; (b) Variation of sands erosion rate with confining pressure; (c) Variation of sands mass concentration with confining pressure.

Figure 14.
Variation tendency of monitoring objects’ characteristic value with confining pressure (Pc). (a) Occurrence time of Transition Point I, II along with confining pressure; (b) Ultimate water-outflow rate along with confining pressure; (c) Mass loss rate along with confining pressure.
Figure 14.
Variation tendency of monitoring objects’ characteristic value with confining pressure (Pc). (a) Occurrence time of Transition Point I, II along with confining pressure; (b) Ultimate water-outflow rate along with confining pressure; (c) Mass loss rate along with confining pressure.

Figure 15.
Occurrence time of transition points and peak value of monitor objects along with influence factors. (a) Occurrence time of transition points and peak value of monitor objects along with relative density; (b) Occurrence time of transition points and peak value of monitor objects along with hydraulic pressure; (c) Occurrence time of transition points and peak value of monitor objects along with confining pressure.


Table 1.
Physical parameters of the soil sample.
| Sand Grains Density ρs(kg/m3) | Maximum Void Ratio emax | Minimum Void Ratio emin | Moisture Content w(%) | Uniformity Coefficient Cu |
|---|---|---|---|---|
| 2670.0 | 1.15 | 0.40 | 16.5 | 6.02 |
Table 2.
Experiment schemes.
| Test Number | Relative Density Dr | Hydraulic Pressure Pw (MPa) | Confining Pressure Pc (MPa) |
|---|---|---|---|
| 1 | 0.25 | 0.4 | 0.2 |
| 2 | 0.50 | ||
| 3 | 0.75 | ||
| 4 | 0.50 | 0.2 | 0.2 |
| 2 | 0.4 | ||
| 5 | 0.6 | ||
| 6 | 0.50 | 0.4 | 0.0 |
| 2 | 0.2 | ||
| 7 | 0.4 |
Table 3.
Variation of water-outflow rate with time (m3/h).
| Test Number | Time (min) | |||||||||||
|---|---|---|---|---|---|---|---|---|---|---|---|---|
| 5th | 10th | 15th | 20th | 25th | 30th | 40th | 50th | 60th | 70th | 80th | 90th | |
| 1 | 0.47 | 1.21 | 4.16 | 6.48 | 6.81 | 7.66 | 7.76 | 7.70 | 7.80 | 8.26 | ||
| 2 | 0.20 | 0.34 | 0.86 | 1.50 | 4.64 | 7.59 | 7.51 | 7.43 | 7.84 | 7.62 | ||
| 3 | 0.03 | 0.29 | 0.56 | 0.33 | 0.59 | 0.70 | 4.25 | 5.82 | 6.32 | 5.98 | 6.49 | 5.98 |
| 4 | 0.06 | 0.12 | 0.25 | 1.67 | 1.19 | 2.79 | 5.28 | 6.38 | 6.53 | 6.53 | ||
| 2 | 0.20 | 0.34 | 0.86 | 1.50 | 4.64 | 7.59 | 7.51 | 7.43 | 7.84 | 7.62 | ||
| 5 | 0.76 | 2.99 | 6.28 | 8.89 | 8.20 | 8.97 | 8.05 | 9.00 | ||||
| 6 | 0.60 | 0.72 | 1.21 | 1.39 | 2.98 | 4.00 | 5.91 | 5.76 | 5.25 | |||
| 2 | 0.20 | 0.34 | 0.86 | 1.50 | 4.64 | 7.59 | 7.51 | 7.43 | 7.84 | 7.62 | ||
| 7 | 0.19 | 0.72 | 0.53 | 0.55 | 1.75 | 3.40 | 8.18 | 7.77 | 8.26 | 8.35 | 8.67 | |
Table 4.
Variation of sands erosion rate with time (kg/h).
| Test Number | Time (min) | |||||||||||
|---|---|---|---|---|---|---|---|---|---|---|---|---|
| 5th | 10th | 15th | 20th | 25th | 30th | 40th | 50th | 60th | 70th | 80th | 90th | |
| 1 | 3.94 | 8.84 | 17.52 | 12.41 | 15.62 | 2.26 | 5.54 | 3.20 | 1.07 | 1.13 | ||
| 2 | 1.12 | 1.61 | 6.12 | 5.55 | 16.84 | 17.61 | 6.99 | 6.36 | 4.50 | 2.16 | ||
| 3 | 0.43 | 1.71 | 2.03 | 1.64 | 2.02 | 3.28 | 12.48 | 11.63 | 6.36 | 3.42 | 1.22 | 0.54 |
| 4 | 0.18 | 0.20 | 2.11 | 14.03 | 7.06 | 14.41 | 10.59 | 2.75 | 1.66 | 0.83 | ||
| 2 | 1.12 | 1.61 | 6.12 | 5.55 | 16.84 | 17.61 | 6.99 | 6.36 | 4.50 | 2.16 | ||
| 5 | 8.36 | 30.26 | 29.05 | 12.29 | 9.80 | 5.13 | 2.23 | 1.93 | ||||
| 6 | 1.60 | 1.43 | 6.24 | 5.95 | 5.34 | 15.38 | 12.20 | 4.29 | 1.95 | |||
| 2 | 1.12 | 1.61 | 6.12 | 5.55 | 16.84 | 17.61 | 6.99 | 6.36 | 4.50 | 2.16 | ||
| 7 | 0.23 | 0.83 | 3.45 | 1.40 | 20.68 | 12.44 | 10.85 | 3.68 | 3.26 | 1.47 | 0.84 | |
Table 5.
Variation of sands mass concentration with time (%).
| Test Number | Time (min) | |||||||||||
|---|---|---|---|---|---|---|---|---|---|---|---|---|
| 5th | 10th | 15th | 20th | 25th | 30th | 40th | 50th | 60th | 70th | 80th | 90th | |
| 1 | 0.397 | 0.363 | 0.209 | 0.096 | 0.114 | 0.033 | 0.053 | 0.024 | 0.009 | 0.003 | ||
| 2 | 0.219 | 0.234 | 0.359 | 0.184 | 0.181 | 0.116 | 0.047 | 0.043 | 0.029 | 0.014 | ||
| 3 | 0.132 | 0.290 | 0.184 | 0.500 | 0.178 | 0.469 | 0.293 | 0.200 | 0.073 | 0.057 | 0.019 | 0.009 |
| 4 | 0.149 | 0.087 | 0.403 | 0.416 | 0.274 | 0.217 | 0.092 | 0.022 | 0.013 | 0.006 | ||
| 2 | 0.219 | 0.234 | 0.359 | 0.184 | 0.181 | 0.116 | 0.047 | 0.043 | 0.029 | 0.014 | ||
| 5 | 0.529 | 0.501 | 0.24 | 0.069 | 0.060 | 0.029 | 0.014 | 0.011 | ||||
| 6 | 0.168 | 0.099 | 0.175 | 0.214 | 0.119 | 0.191 | 0.103 | 0.037 | 0.019 | |||
| 2 | 0.219 | 0.234 | 0.359 | 0.184 | 0.181 | 0.116 | 0.047 | 0.043 | 0.029 | 0.014 | ||
| 7 | 0.052 | 0.201 | 0.228 | 0.065 | 0.161 | 0.060 | 0.061 | 0.020 | 0.018 | 0.008 | 0.005 | |
Table 6.
Occurrence time of transition points and peak value of monitor objects.
| Test Number | Occurrence Time of Monitoring Object (min) | |||
|---|---|---|---|---|
| Transition Point I | Transition Point II | Peak of Sands Mass Concentration | Peak of Sands Erosion Rate | |
| 1 | 10.4 | 22.4 | 5.9 | 18.2 |
| 2 | 16.8 | 32.0 | 12.6 | 30.1 |
| 3 | 27.2 | 52.4 | 25.0 | 45.9 |
| 4 | 21.6 | 40.2 | 18.2 | 34.2 |
| 2 | 16.8 | 32.0 | 12.6 | 30.1 |
| 5 | 7.2 | 20.1 | 4.9 | 13.1 |
| 6 | 13.6 | 33.2 | 11.2 | 31.8 |
| 2 | 16.8 | 32.0 | 12.6 | 30.1 |
| 7 | 18.3 | 29.4 | 17.1 | 28.9 |
Table 7.
Variation of monitoring objects’ characteristic value with relative density (Dr).
| Relative Density | Ultimate Water-Outflow Rate (m3/h) | Soil Sample Mass (kg) | Total Mass Loss (kg) | Mass Loss Rate (%) |
|---|---|---|---|---|
| 0.25 | 8.14 | 8.64 | 7.79 | 90.16 |
| 0.50 | 7.62 | 9.54 | 6.83 | 71.59 |
| 0.75 | 6.49 | 10.68 | 5.97 | 55.90 |
Table 8.
Variation of monitoring objects’ characteristic value with hydraulic pressure (Pw).
| Hydraulic Pressure (MPa) | Ultimate Water-Outflow Rate (m3/h) | Soil Sample Mass (kg) | Total Mass Loss (kg) | Mass Loss Rate (%) |
|---|---|---|---|---|
| 0.2 | 6.40 | 9.54 | 6.23 | 65.30 |
| 0.4 | 7.62 | 9.54 | 6.83 | 71.59 |
| 0.6 | 8.35 | 9.54 | 7.74 | 81.13 |
Table 9.
Variation of monitoring objects’ characteristic value with confining pressure (Pc).
| Confining Pressure (MPa) | Ultimate Water-Outflow Rate (m3/h) | Soil Sample Mass (kg) | Total Mass Loss (kg) | Mass Loss Rate (%) |
|---|---|---|---|---|
| 0.0 | 5.61 | 9.54 | 6.34 | 66.46 |
| 0.2 | 7.62 | 9.54 | 6.83 | 71.59 |
| 0.4 | 7.90 | 9.54 | 8.02 | 84.07 |
© 2020 by the authors. Licensee MDPI, Basel, Switzerland. This article is an open access article distributed under the terms and conditions of the Creative Commons Attribution (CC BY) license (http://creativecommons.org/licenses/by/4.0/).
Share and Cite
MDPI and ACS Style
Liu, Q.; Liu, B. Experiment Study of the Failure Mechanism and Evolution Characteristics of Water–Sand Inrush Geo-Hazards. Appl. Sci. 2020, 10, 3374. https://doi.org/10.3390/app10103374
AMA Style
Liu Q, Liu B. Experiment Study of the Failure Mechanism and Evolution Characteristics of Water–Sand Inrush Geo-Hazards. Applied Sciences. 2020; 10(10):3374. https://doi.org/10.3390/app10103374
Chicago/Turabian StyleLiu, Qi, and Bo Liu. 2020. "Experiment Study of the Failure Mechanism and Evolution Characteristics of Water–Sand Inrush Geo-Hazards" Applied Sciences 10, no. 10: 3374. https://doi.org/10.3390/app10103374
Note that from the first issue of 2016, this journal uses article numbers instead of page numbers. See further details here.