Three Approaches to Low-Duty Turbo Compressor Efficiency Exploitation Evaluation


Abstract
:1. Introduction
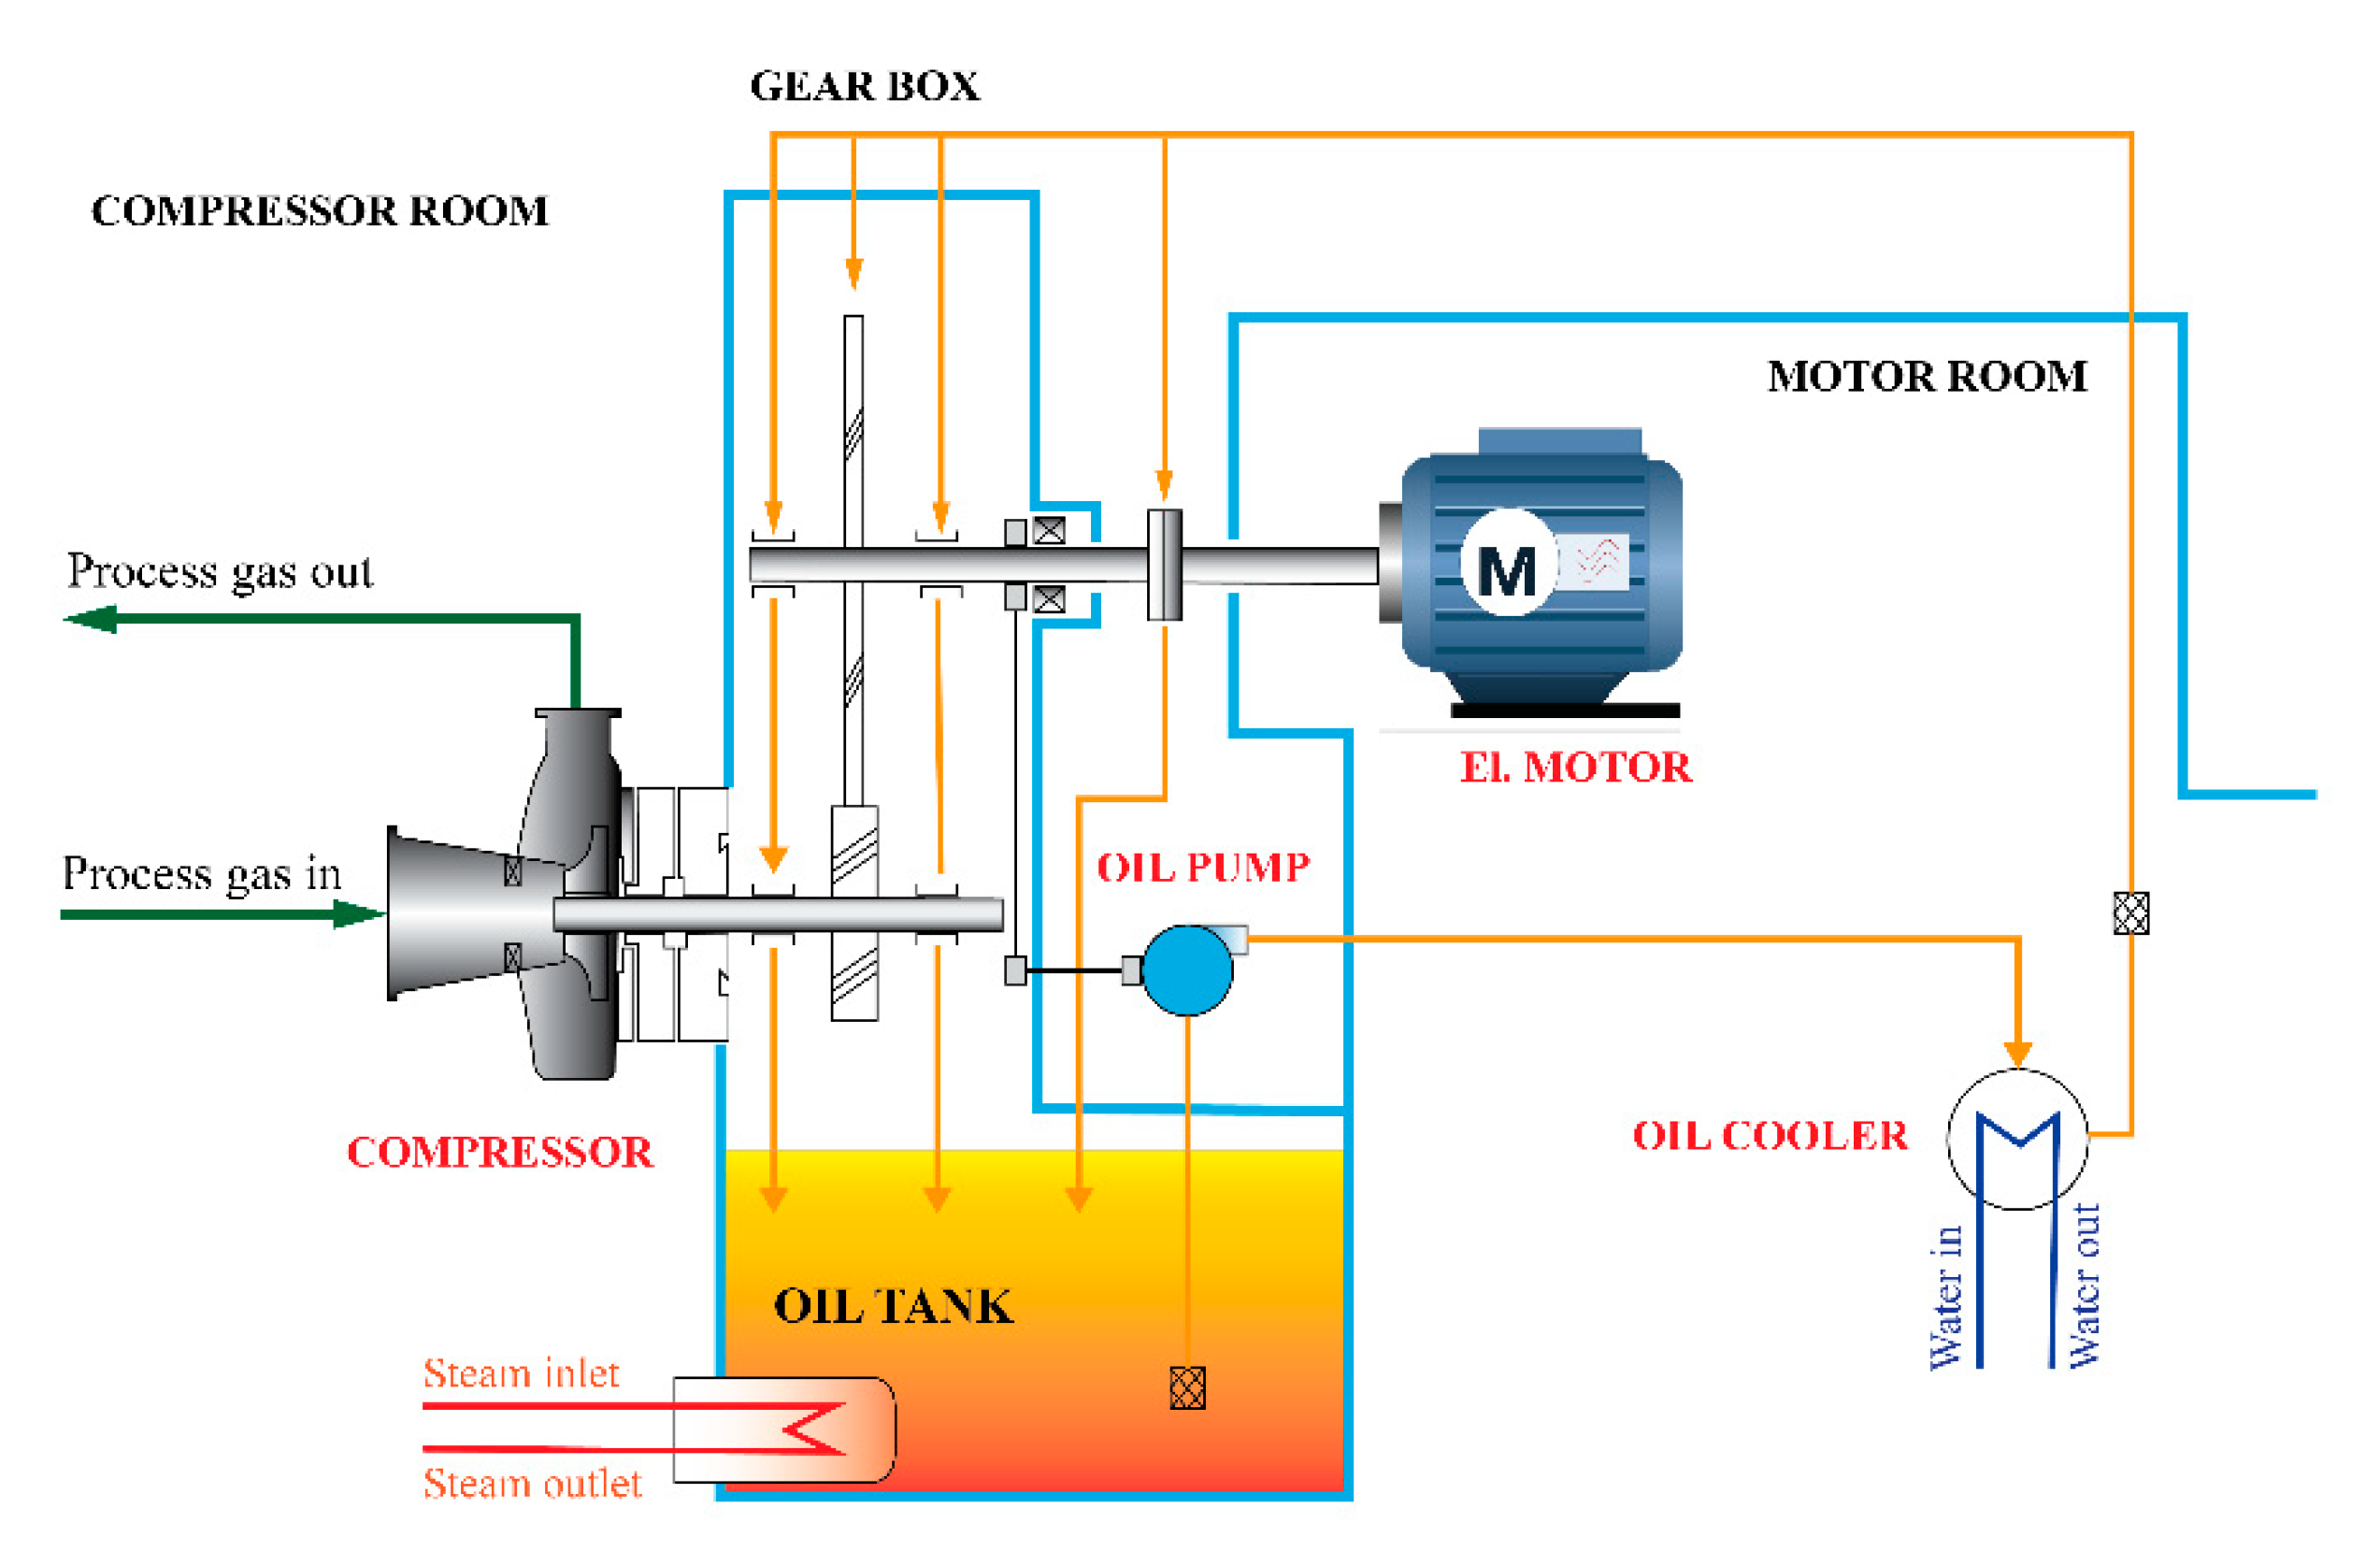
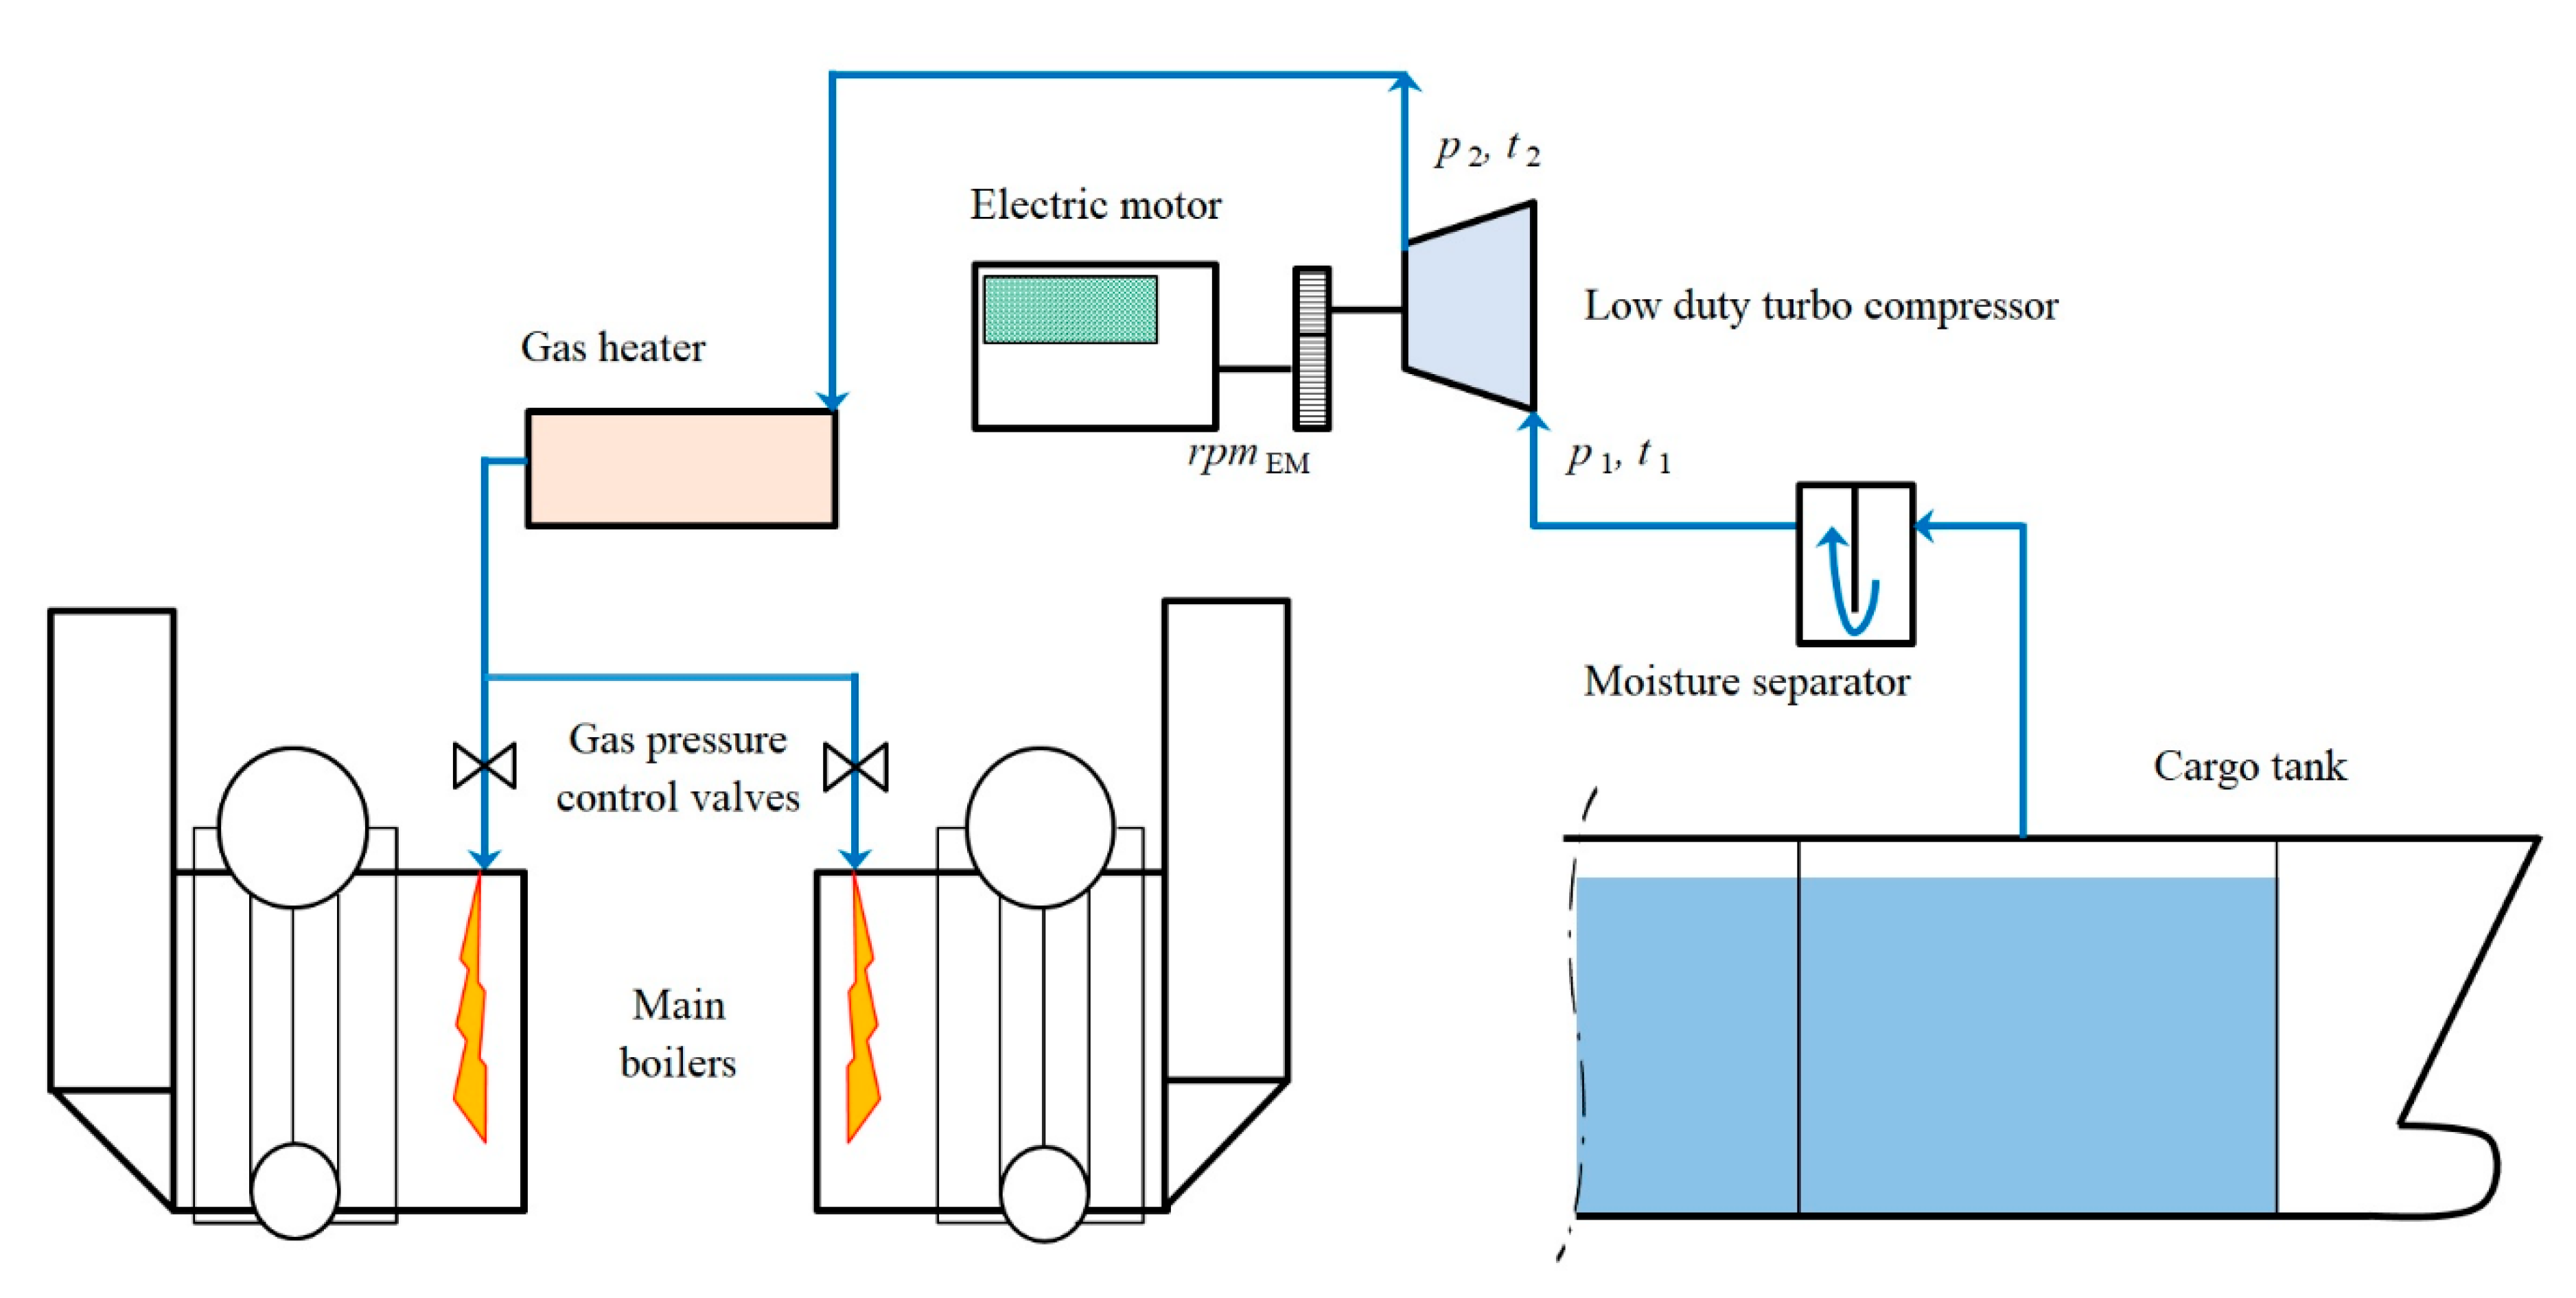
2. Process Flow and Low-Duty Turbo Compressor Description
3. Measuring Equipment and Measured Results
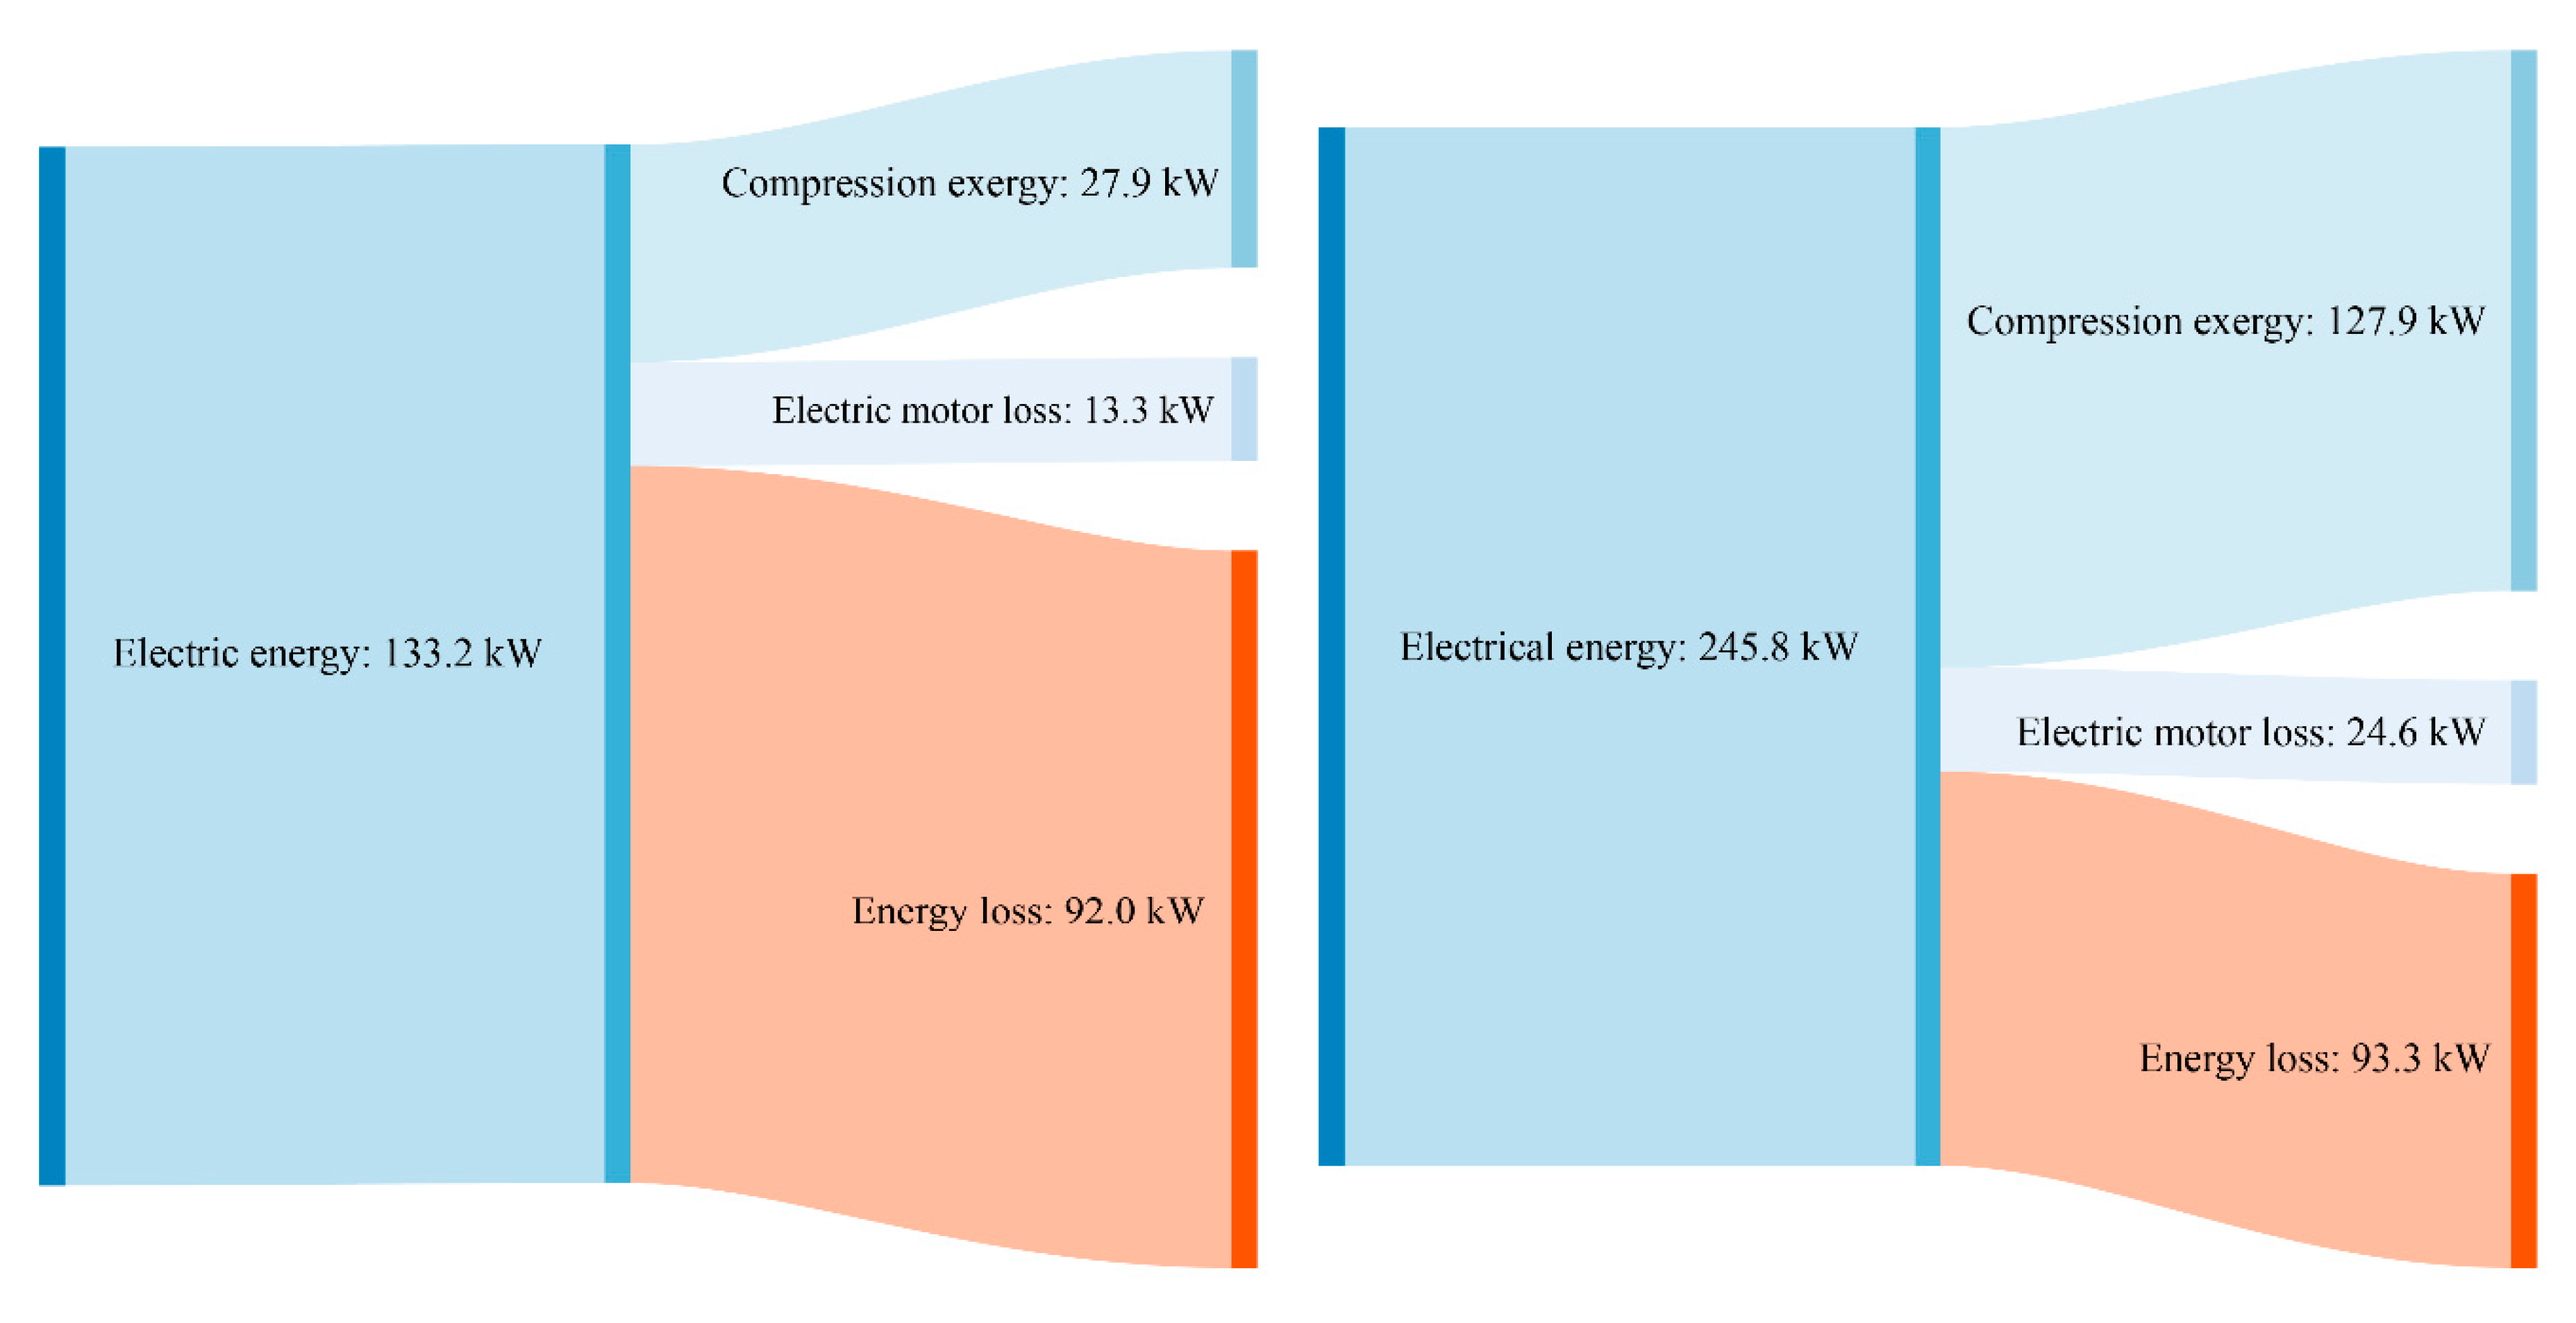
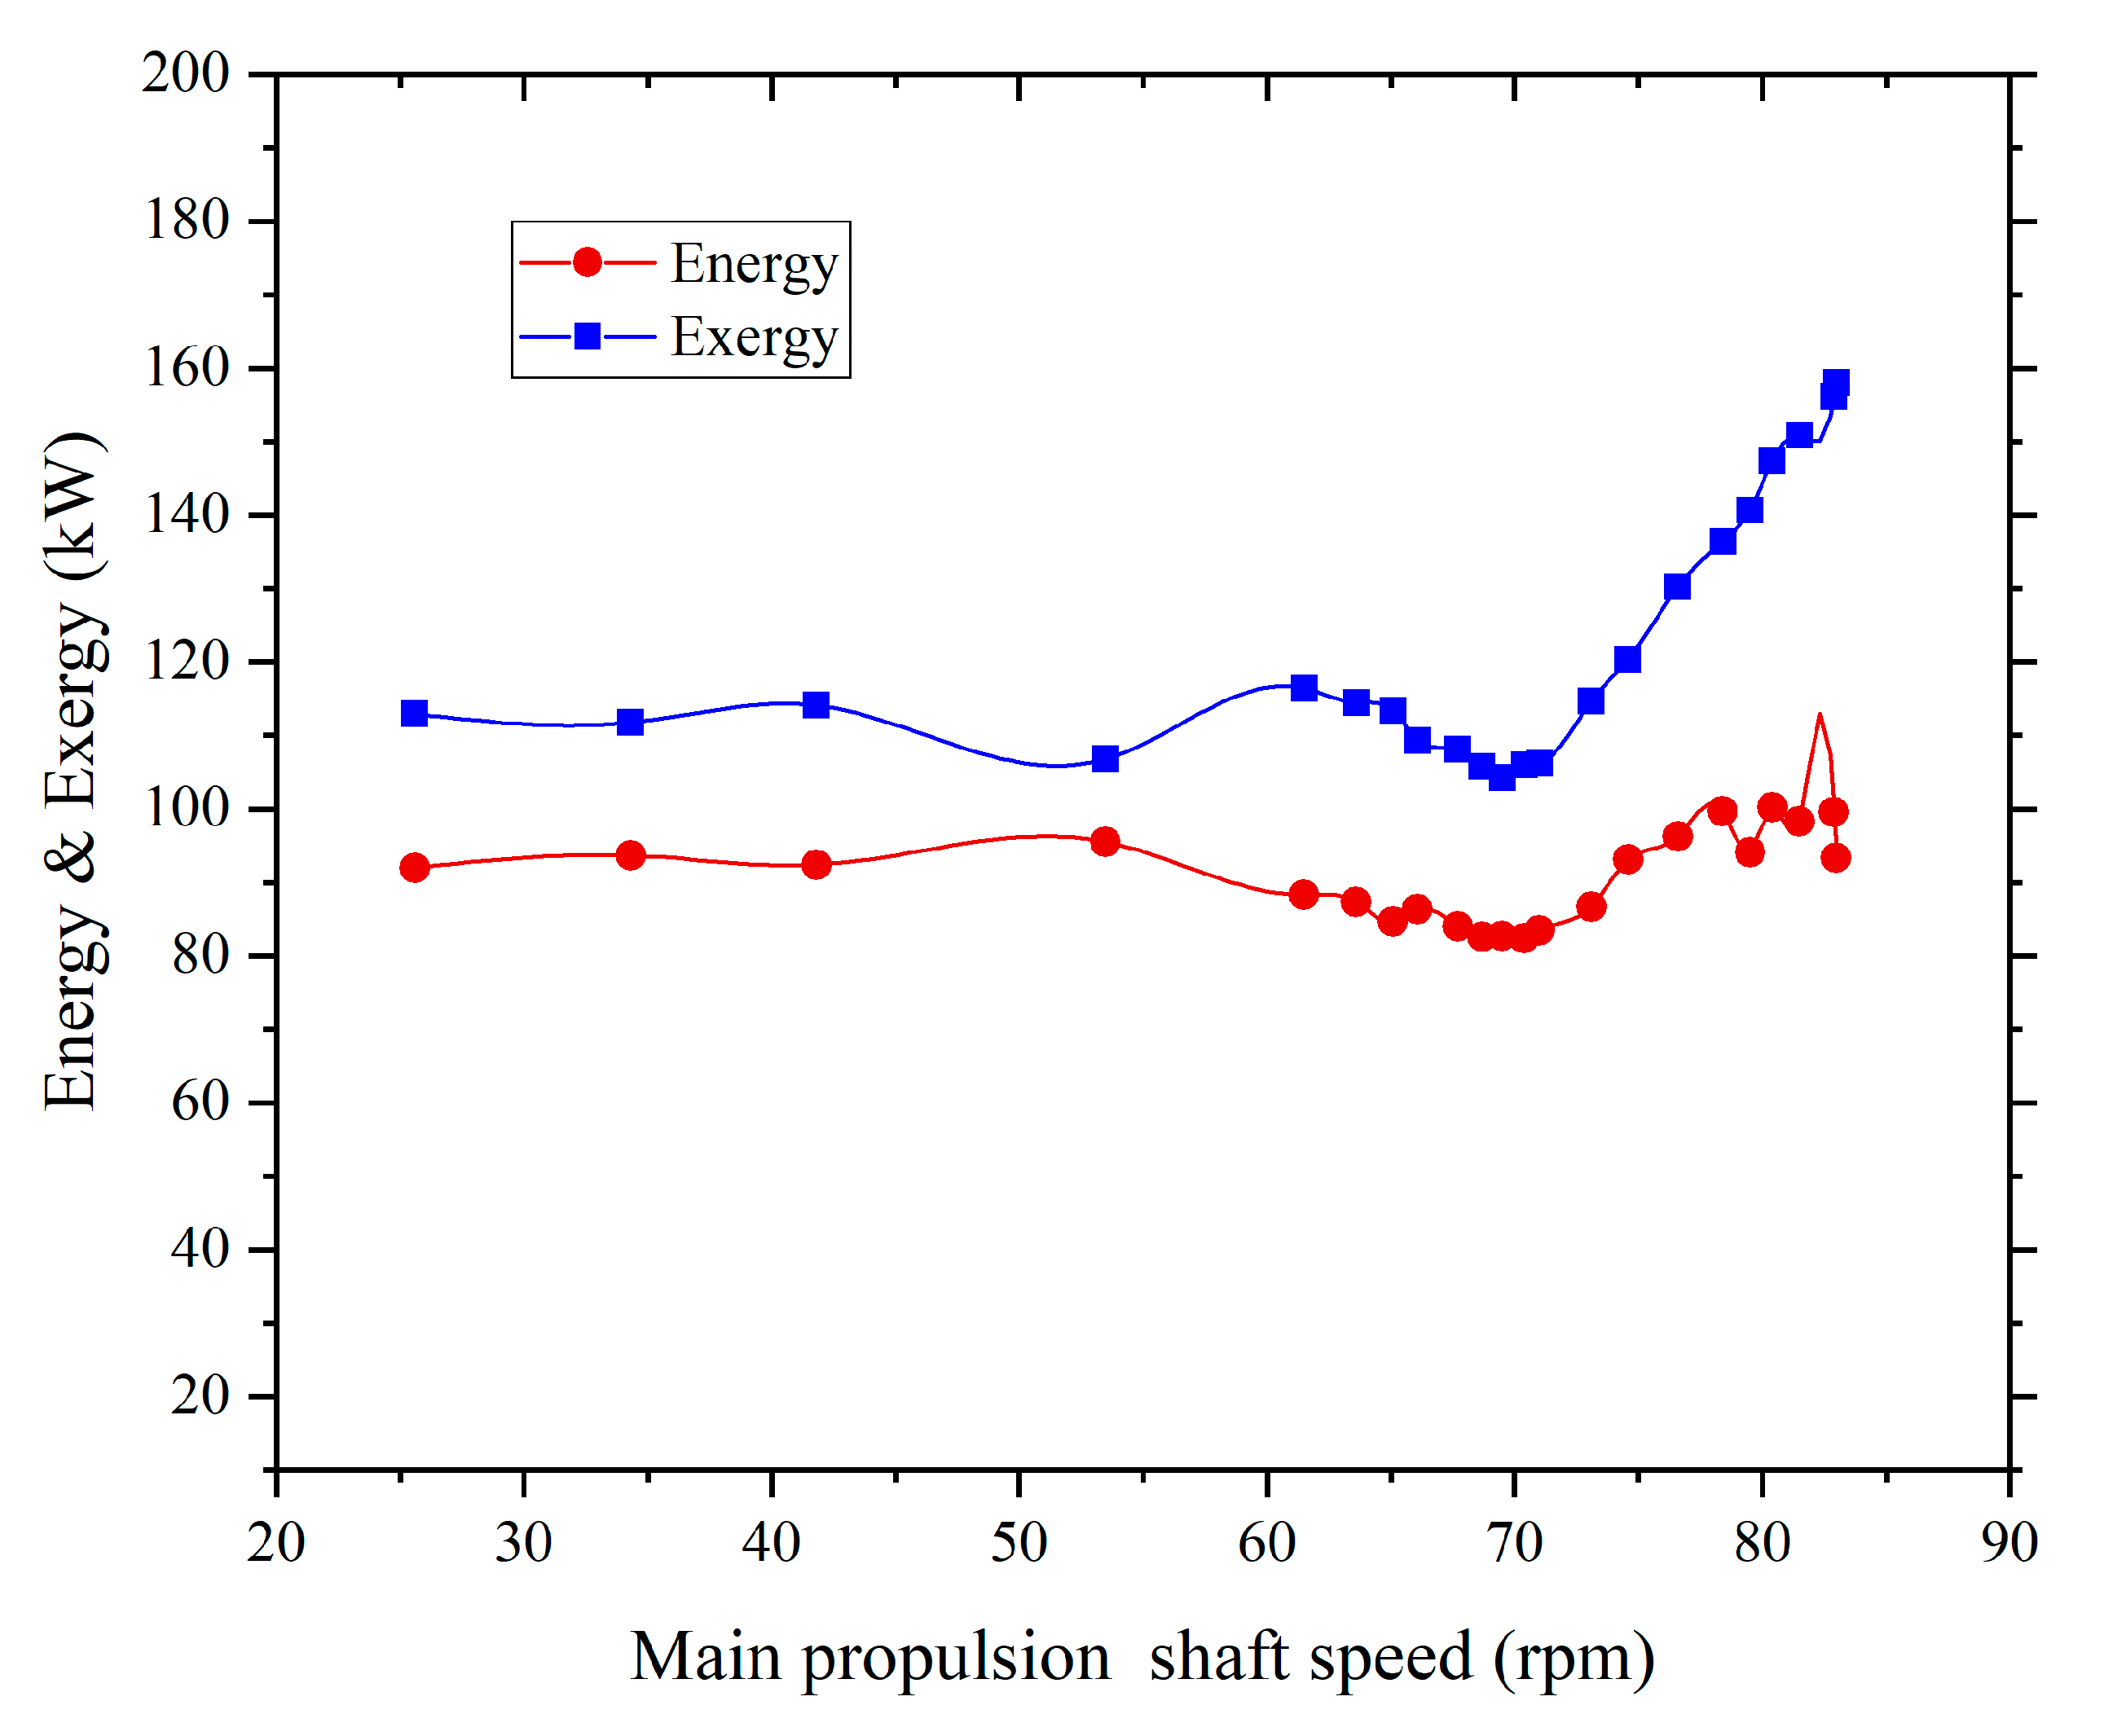
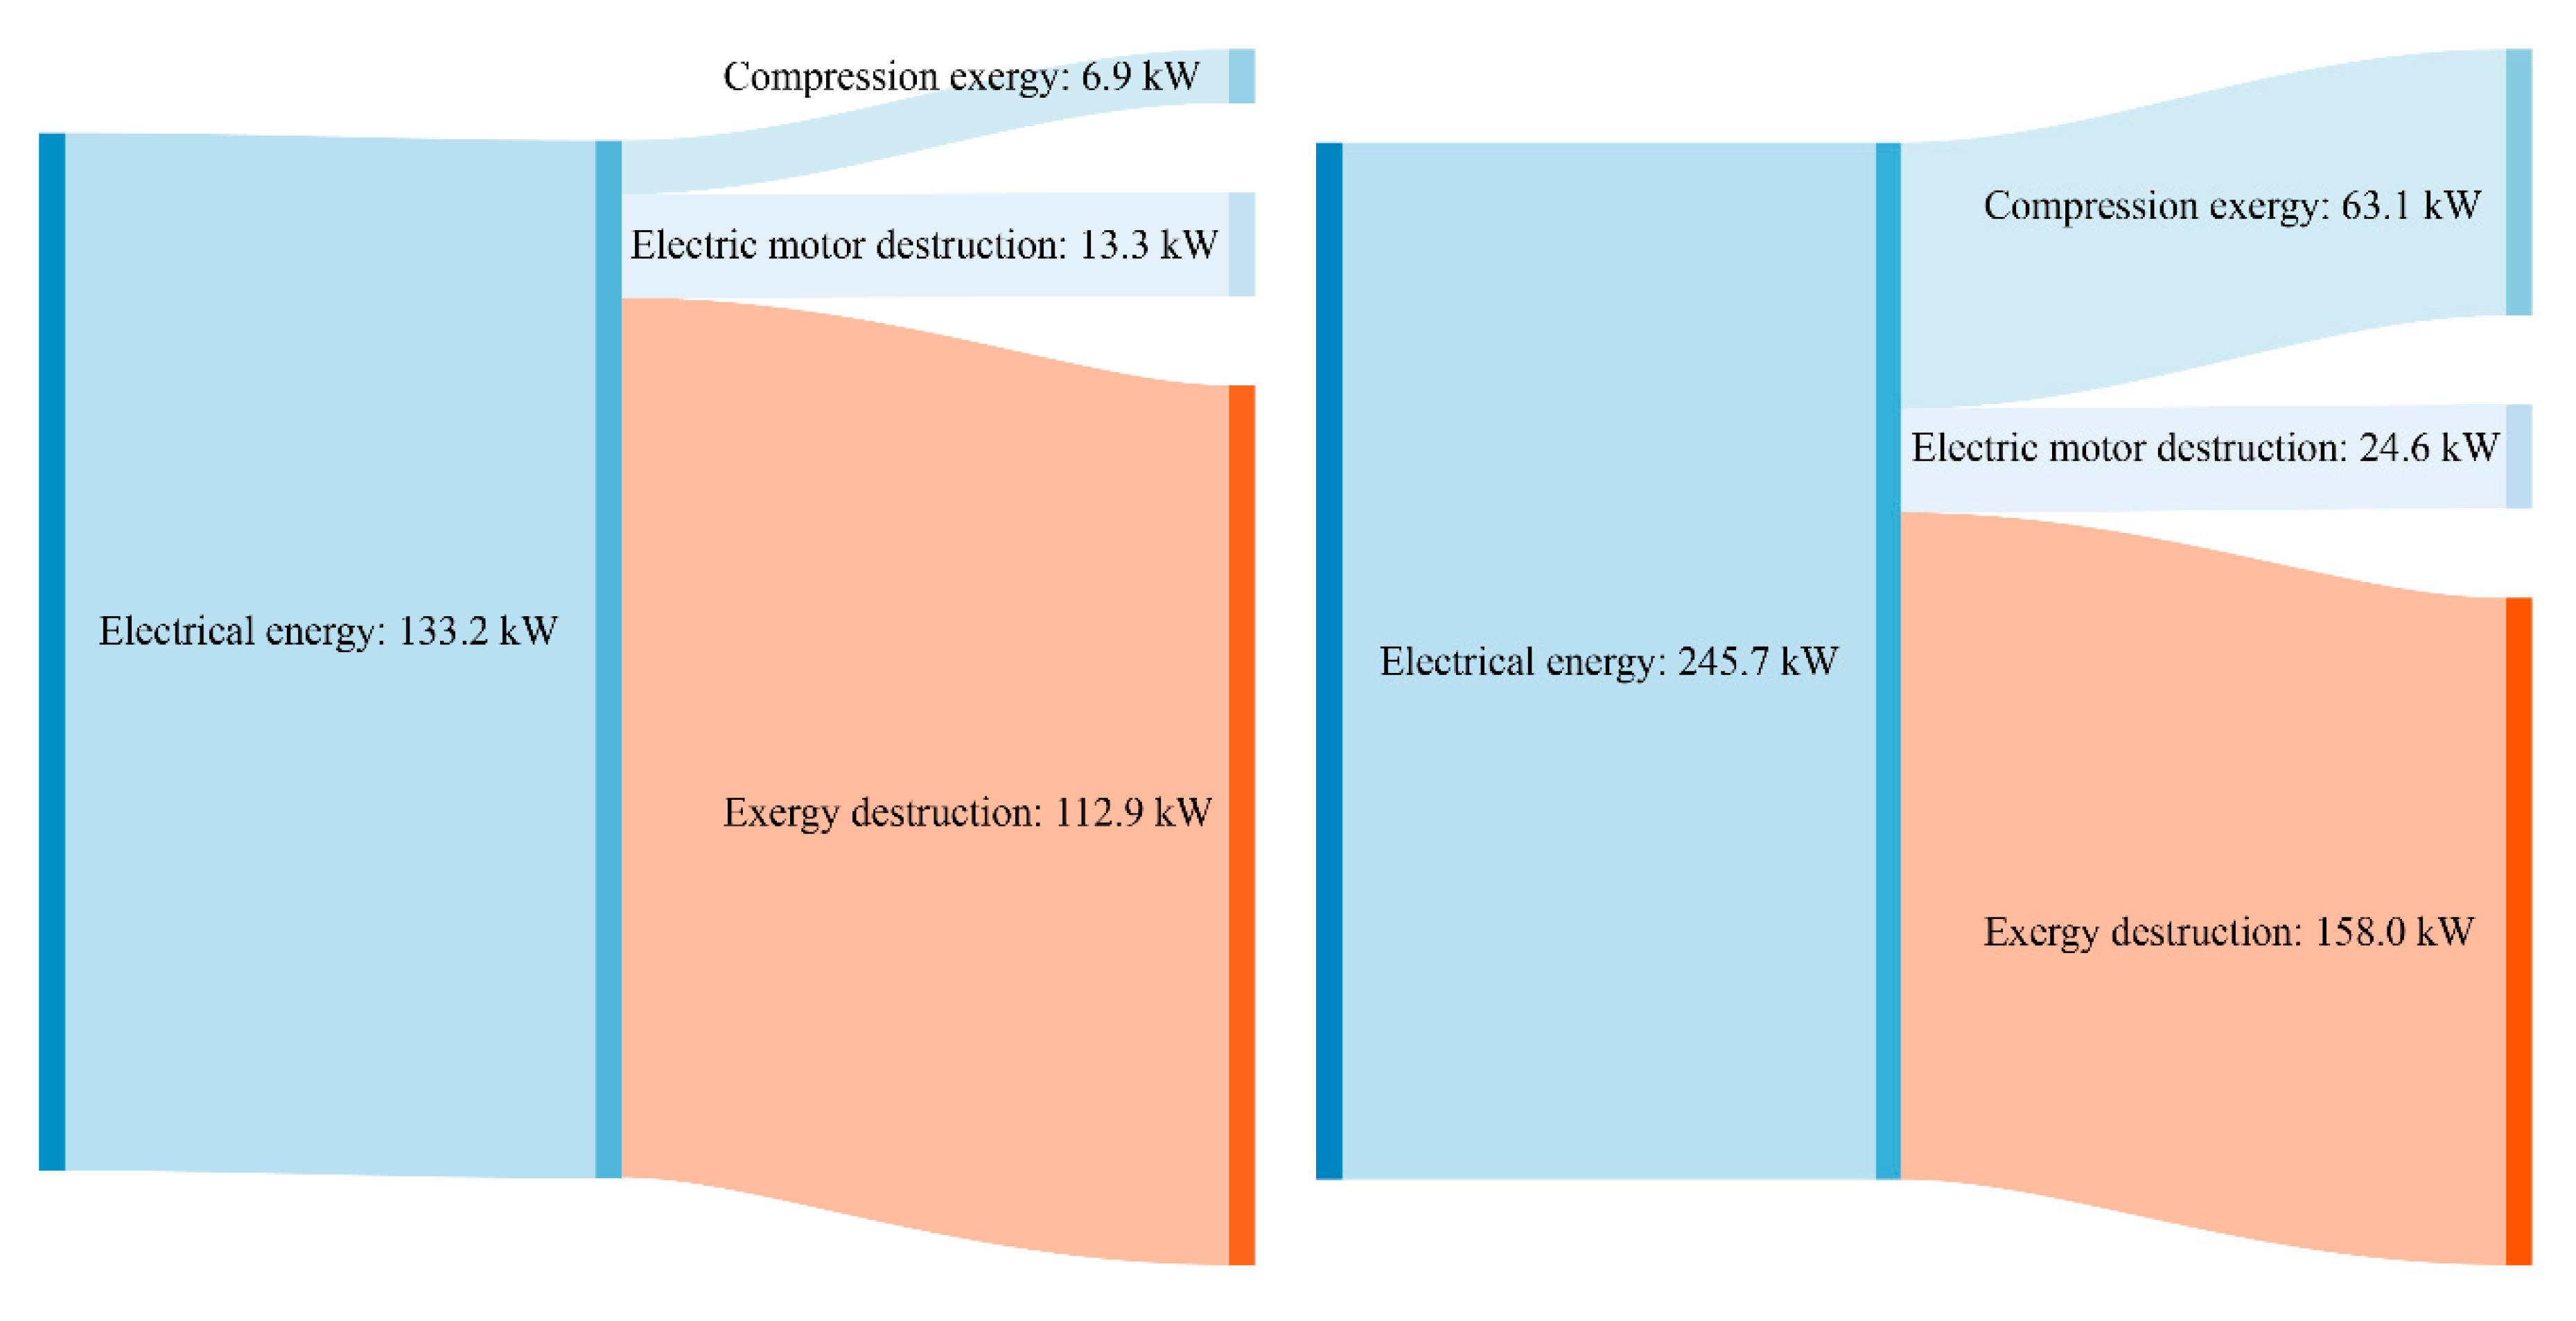
4. Energy and Exergy Analysis of the Low-Duty Turbo Compressor
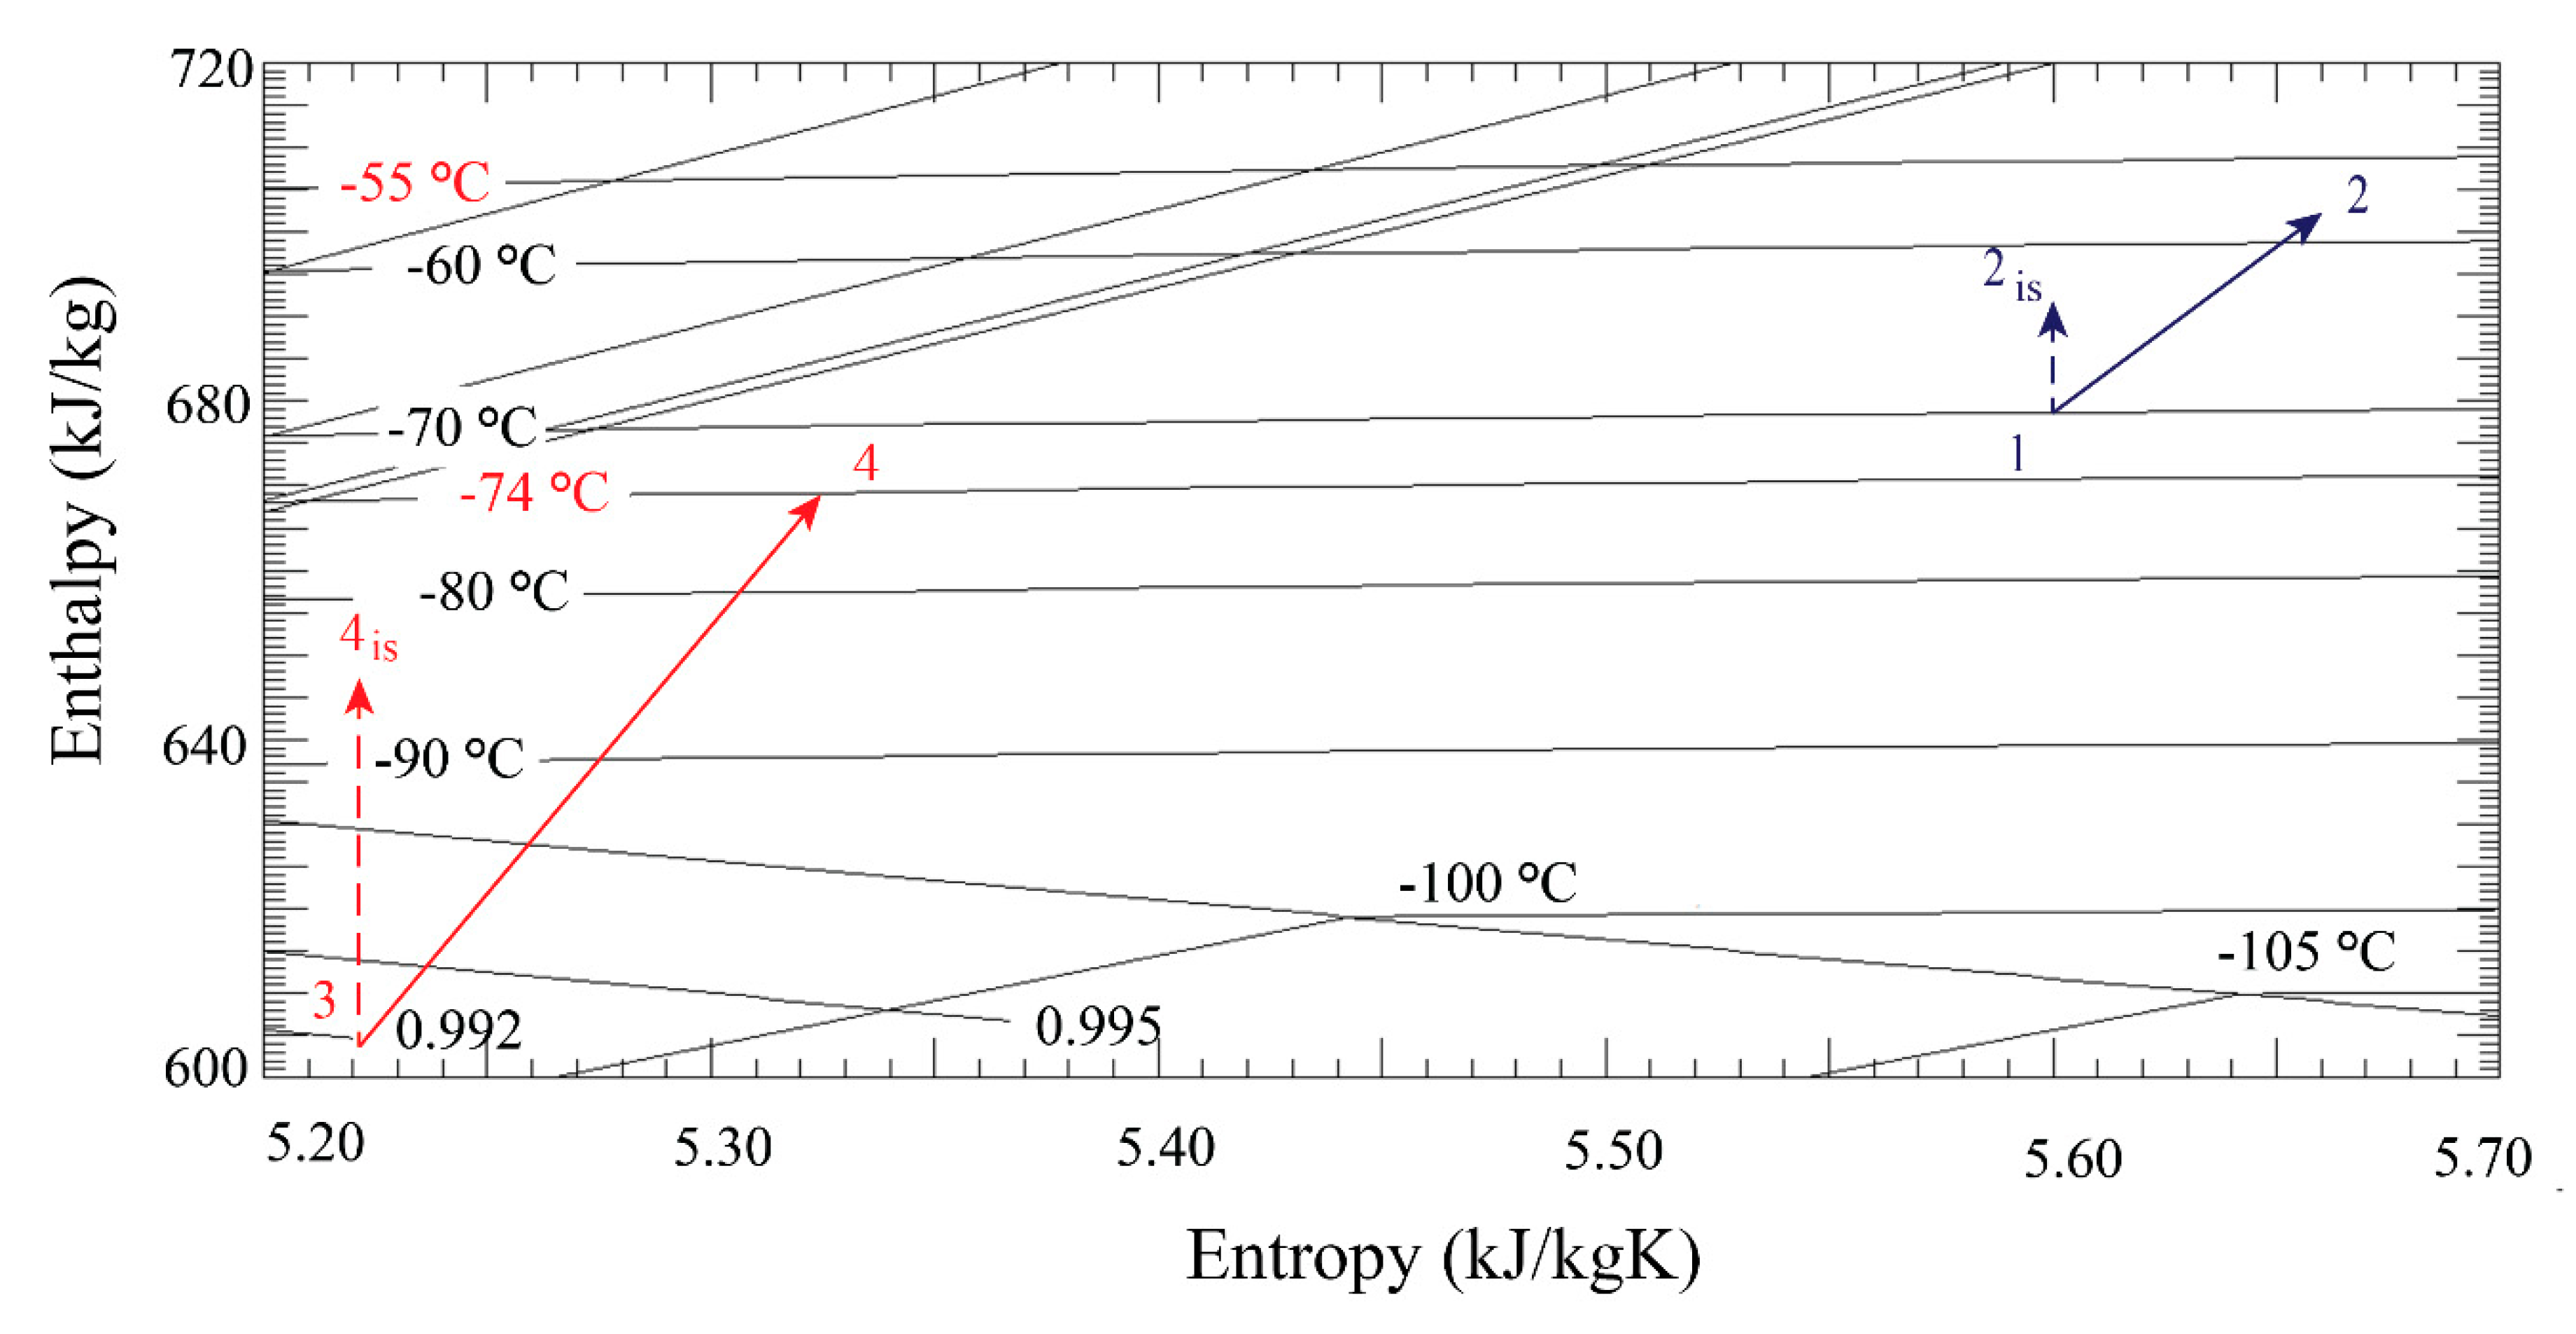
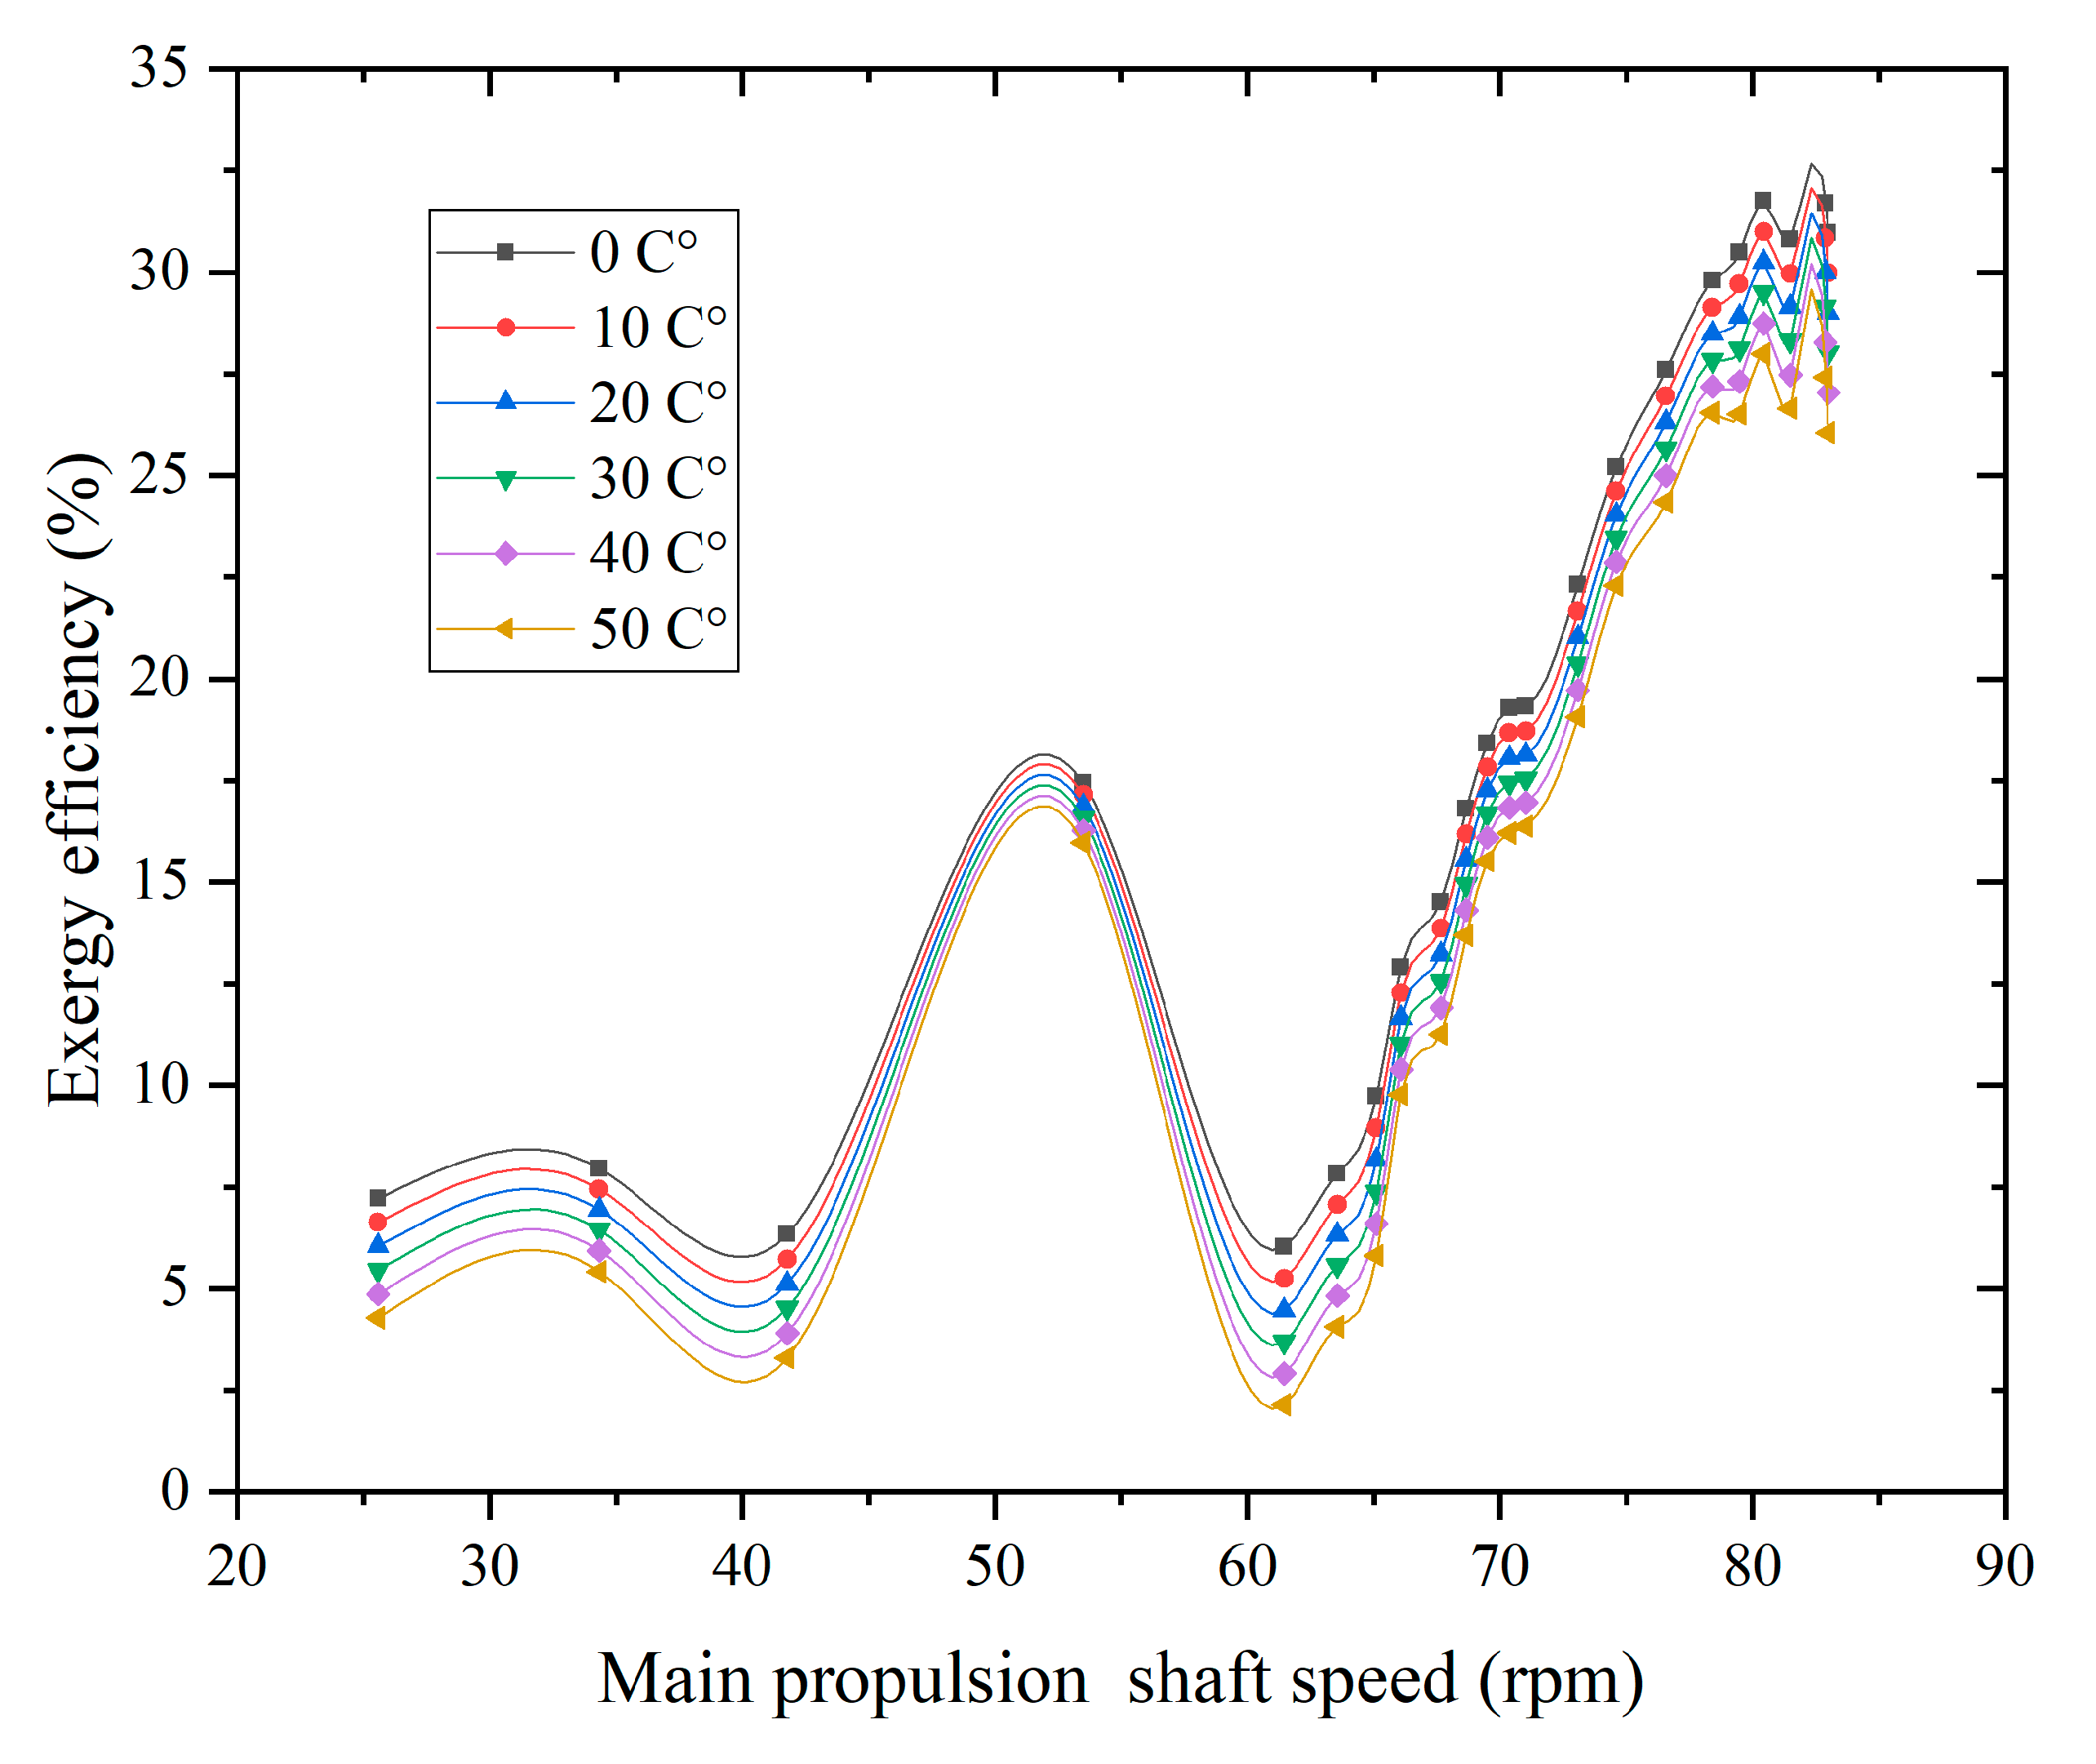
5. Low-Duty Turbo Compressor Isentropic, Energy, and Exergy Analysis
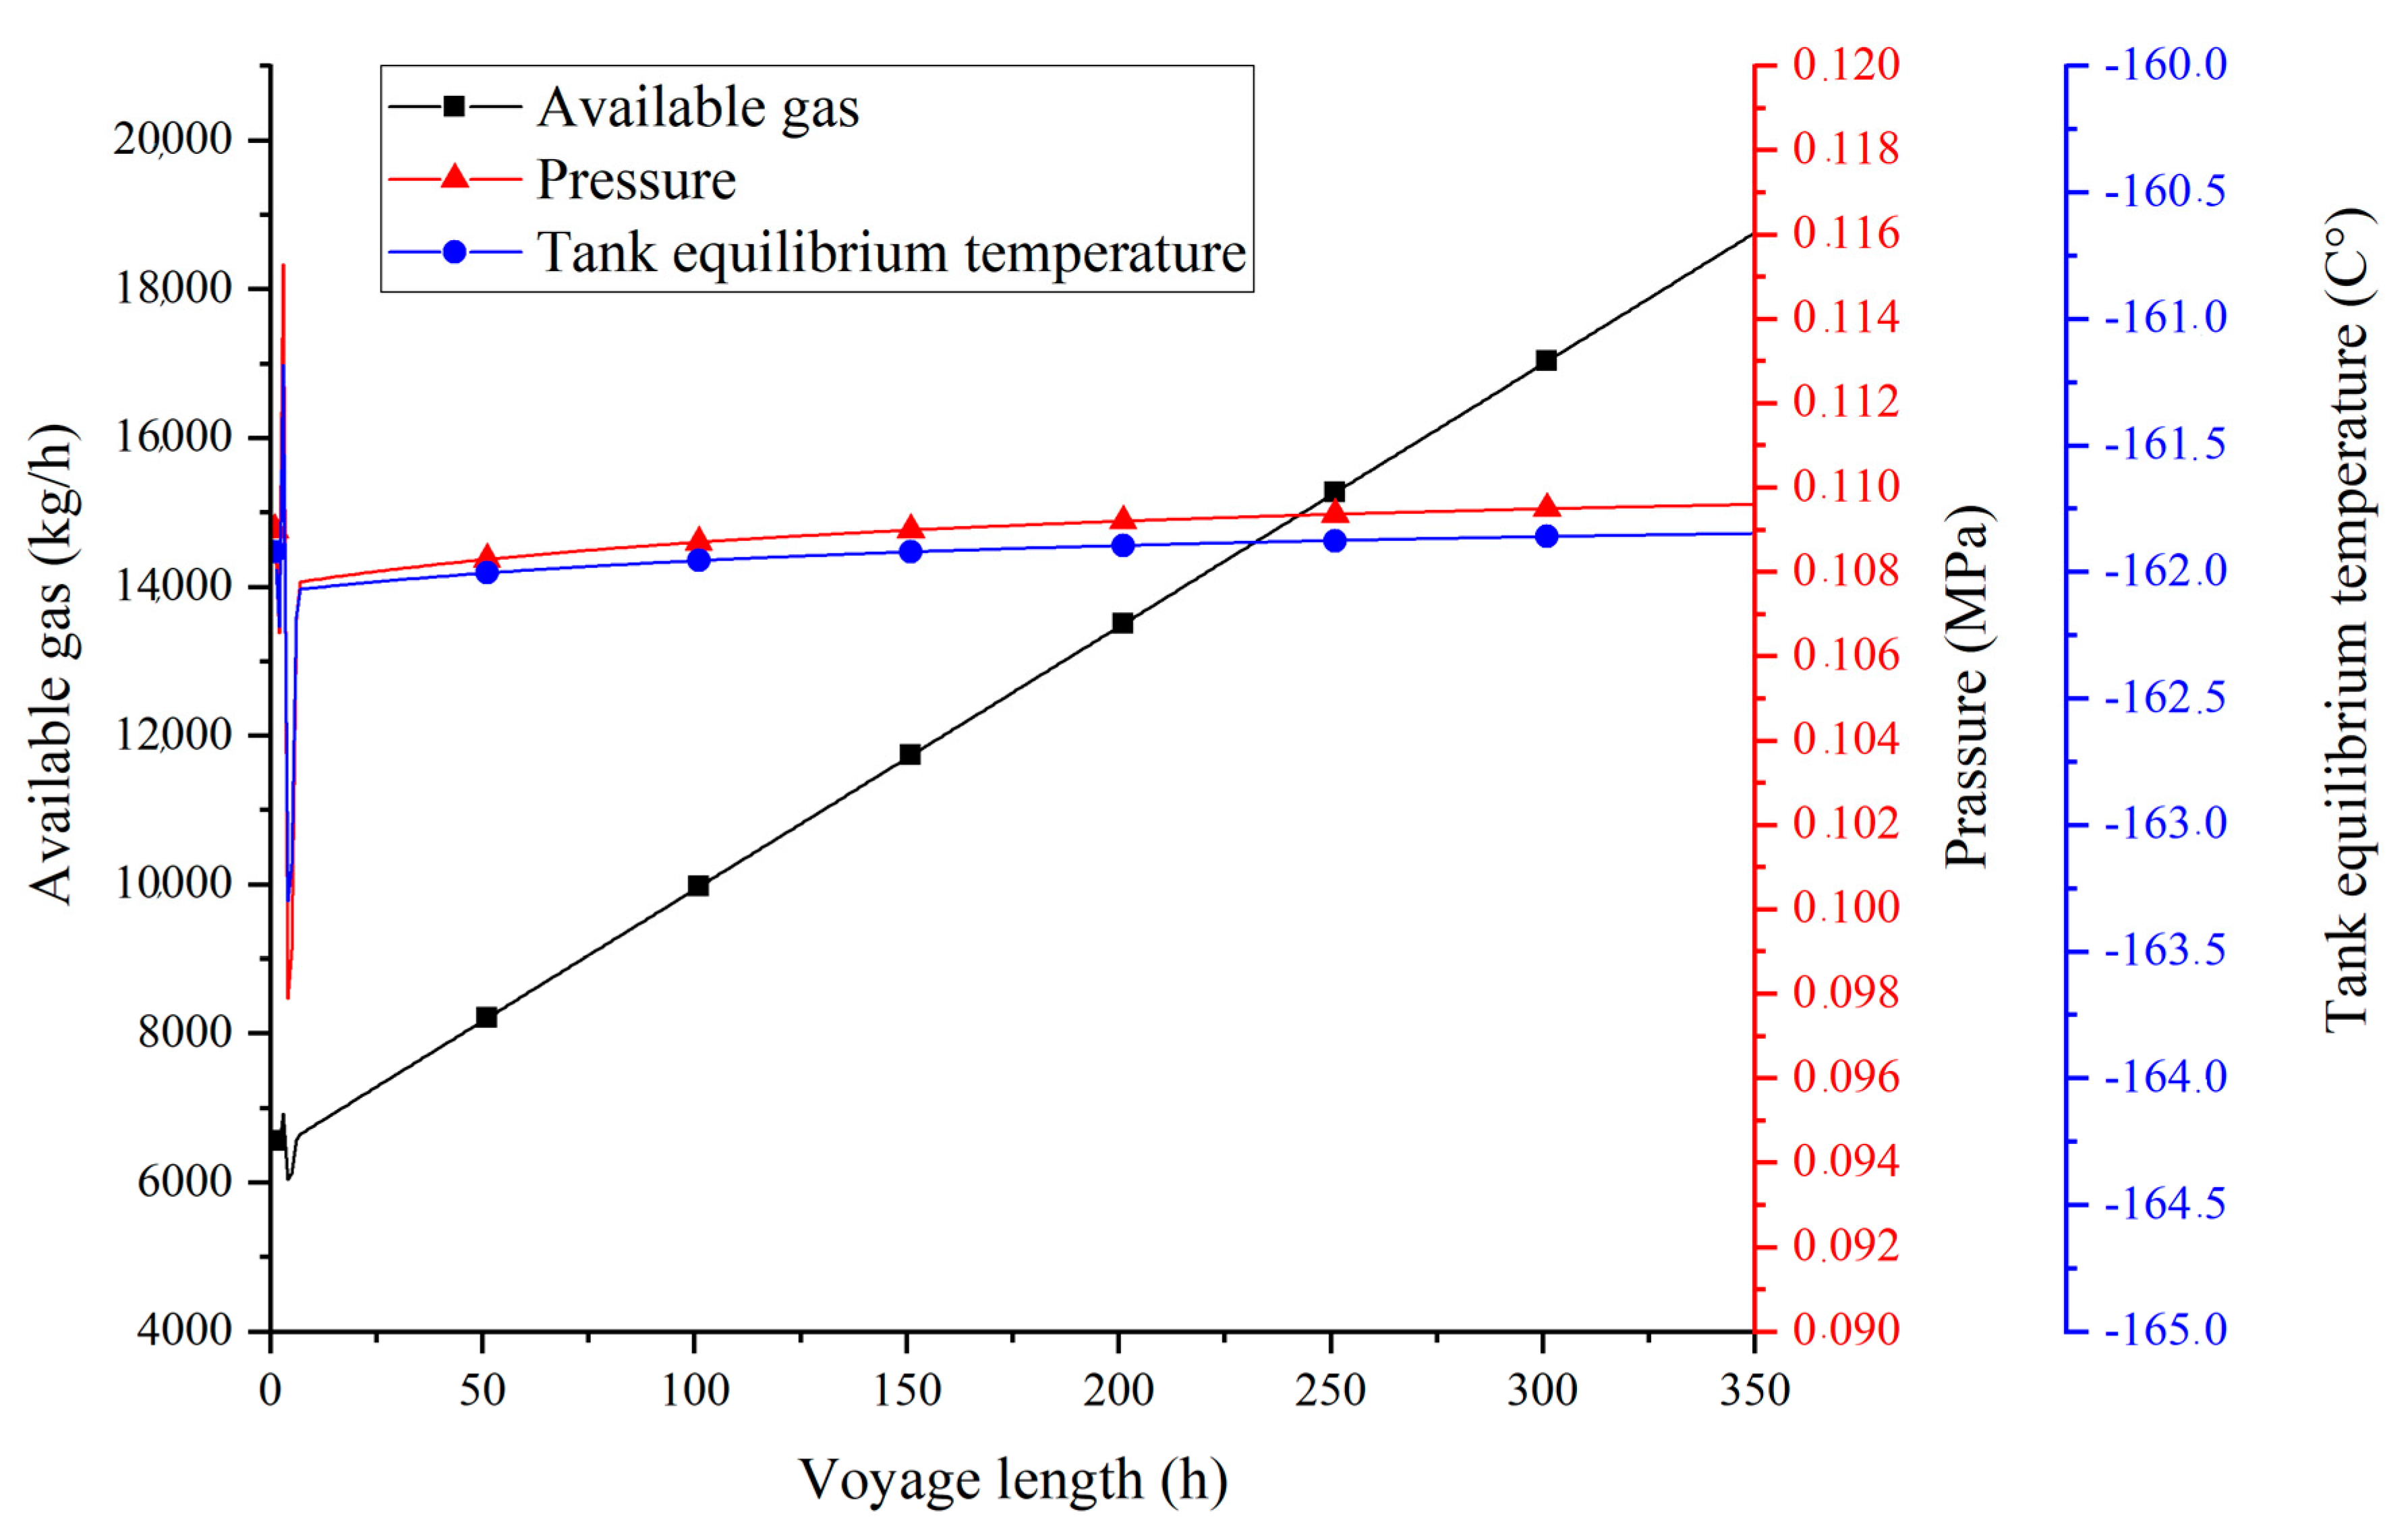
6. Low-Duty Turbo Compressor Mass Flow and Tank Equilibrium Pressure Maintained during a Voyage
7. Conclusions
Author Contributions
Funding
Conflicts of Interest
Abbreviations
| Latin symbols | |
| e | induced EMF, V |
| Ėl | energy rate loss, kW |
| EMFmax | maximum induced electro motor force, V |
| ex | specific exergy, kJ/kg |
| Ėxd | exergy destruction rate, kW |
| f | frequency, Hz |
| g | gravitational acceleration, m/s2 |
| h | specific enthalpy, kJ/kg |
| I | amperage, A |
| ṁ | mass flow rate, kg/h |
| p | pressure, MPa |
| P | power, kW |
| R | specific gas constant, kJ/kgK |
| Q˙ | heat flow rate, kW |
| Ṡ | entropy rate, kW/K |
| t | time, s |
| T | temperature, K |
| U | voltage, V |
| ṽ | speed, m/s |
| v | specific volume, m3/kg |
| V | volume, m3 |
| z | height, m |
| Z | compressibility factor |
| Greek symbols | |
| η | efficiency, % |
| ηIS | isentropic efficiency, % |
| ηI | energy efficiency, % |
| ηII | exergy efficiency, % |
| φ | power factor |
| ω | angular velocity, rad/s |
| θ | angle from reference, radians |
| Abbreviations | |
| AC | Alternating current |
| C | Compressor |
| EMF | electro motor force |
| HFO | heavy fuel oil |
| LNG | liquefied natural gas |
| rpm | revolutions per minute |
| Subscripts | |
| BOG | boil off gas |
| CA | compressor actual compressing process |
| EM | electric motor |
| IS | isentropic |
| IN | input |
| ME | mechanic |
| OUT | output |
| m | mixture |
| i | mixture component |
References
- Marques, C.H.; Pereira Belchior, C.R.; Caprace, J.D. An early-stage approach to optimise a marine energy system for liquefied natural gas carriers: Part A—Developed approach. Ocean Eng. 2019, 181, 161–172. [Google Scholar] [CrossRef]
- Marques, C.H.; Pereira Belchior, C.R.; Caprace, J.D. An early-stage approach to optimise a marine energy system for liquefied natural gas carriers: Part B—Application. Ocean Eng. 2019, 174, 96–107. [Google Scholar] [CrossRef]
- Feng, Y.; Wang, H.; Gao, R.; Zhu, Y. A Zero-Dimensional Mixing Controlled Combustion Model for Real Time Performance Simulation of Marine Two-Stroke Diesel Engines. Energies 2019, 12, 2000. [Google Scholar] [CrossRef] [Green Version]
- Raptotasios, S.I.; Sakellaridis, N.F.; Papagiannakis, R.G.; Hountalas, D.T. Application of a multi-zone combustion model to investigate the NOx reduction potential of two-stroke marine diesel engines using EGR. Appl. Energ. 2015, 157, 814–823. [Google Scholar] [CrossRef]
- Mrzljak, V.; Medica, V.; Bukovac, O. Volume agglomeration process in quasi-dimensional direct injection diesel engine numerical model. Energy 2016, 115, 658–667. [Google Scholar] [CrossRef]
- Ryu, Y.; Lee, Y.; Nam, J. Performance and emission characteristics of additives-enhanced heavy fuel oil in large two-stroke marine diesel engine. Fuel 2016, 182, 850–856. [Google Scholar] [CrossRef]
- Senčić, T.; Mrzljak, V.; Blecich, P.; Bonefačić, I. 2D CFD Simulation of Water Injection Strategies in a Large Marine Engine. J. Mar. Sci. Eng. 2019, 7, 296. [Google Scholar] [CrossRef] [Green Version]
- Ahn, J.; Noh, Y.; Park, S.H.; Choi, B.I.; Chang, D. Fuzzy-based failure mode and effect analysis (FMEA) of a hybrid molten carbonate fuel cell (MCFC) and gas turbine system for marine propulsion. J. Power Sources 2017, 364, 226–233. [Google Scholar] [CrossRef]
- Lorencin, I.; Anđelić, N.; Mrzljak, V.; Car, Z. Multilayer perceptron approach to condition-based maintenance of marine CODLAG propulsion system components. J. Mar. Res. 2019, 33, 181–190. [Google Scholar] [CrossRef]
- Ammar, N.R. Environmental and cost-effectiveness comparison of dual fuel propulsion options for emissions reduction onboard LNG carriers. Shipbuilding 2019, 70, 61–77. [Google Scholar] [CrossRef]
- Fernández, I.A.; Gómez, M.R.; Gómez, J.R.; Insua, A.A.B. Review of propulsion systems on LNG carriers. Renew. Sust. Energ. Rev. 2017, 67, 1395–1411. [Google Scholar] [CrossRef]
- Budiyanto, M.A.; Nasruddin; Nawara, R. The optimization of exergoenvironmental factors in the combined gas turbine cycle and carbon dioxide cascade to generate power in LNG tanker ship. Energy Convers. Manag. 2020, 205, 112468. [Google Scholar] [CrossRef]
- Koroglu, T.; Sogut, O.S. Conventional and advanced exergy analyses of a marine steam power plant. Energy 2018, 163, 392–403. [Google Scholar] [CrossRef]
- Mrzljak, V.; Poljak, I.; Mrakovčić, T. Energy and exergy analysis of the turbo-generators and steam turbine for the main feed water pump drive on LNG carrier. Energy Convers. Manag. 2017, 140, 307–323. [Google Scholar] [CrossRef]
- Marques, C.H.; Caprace, J.D.; Belchior, C.R.P.; Martini, A. An Approach for Predicting the Specific Fuel Consumption of Dual-Fuel Two-Stroke Marine Engines. J. Mar. Sci. Eng. 2019, 7, 20. [Google Scholar] [CrossRef] [Green Version]
- Jeong, B.; Oguz, E.; Wang, H.; Zhou, P. Multi-criteria decision-making for marine propulsion: Hybrid, diesel electric and diesel mechanical systems from cost-environment-risk perspectives. Appl. Energ. 2018, 230, 1065–1081. [Google Scholar] [CrossRef] [Green Version]
- Marty, P.; Hétet, J.-F.; Chalet, D.; Corrignan, P. Exergy Analysis of Complex Ship Energy Systems. Entropy 2016, 18, 127. [Google Scholar] [CrossRef] [Green Version]
- Jeong, B.; Wang, H.; Oguz, E.; Zhou, P. An effective framework for life cycle and cost assessment for marine vessels aiming to select optimal propulsion systems. J. Clean. Prod. 2018, 187, 111–130. [Google Scholar] [CrossRef] [Green Version]
- Behrendt, C.; Stoyanov, R. Operational characteristic of selected marine turbounits powered by steam from auxiliary oil-fired boilers. New Trend. Prod. Eng. 2018, 1, 495–501. [Google Scholar] [CrossRef] [Green Version]
- Baldi, F.; Ahlgren, F.; Van Nguyen, T.; Thern, M.; Andersson, K. Energy and Exergy Analysis of a Cruise Ship. Energies 2018, 11, 2508. [Google Scholar] [CrossRef] [Green Version]
- Ibrahim, T.K.; Basrawi, F.; Awad, O.I.; Abdullah, A.N.; Najafi, G.; Mamat, R.; Hagos, F.Y. Thermal performance of gas turbine power plant based on exergy analysis. Appl. Therm. Eng. 2017, 115, 977–985. [Google Scholar] [CrossRef]
- Wang, Z.; Li, J.; Fan, K.; Li, S. The Off-Design Performance Simulation of Marine Gas Turbine Based on Optimum Scheduling of Variable Stator Vanes. Math. Probl. Eng. 2017, 2671251. [Google Scholar] [CrossRef] [Green Version]
- Sohret, Y.; Açıkkalp, E.; Hepbasli, A.; Karakoc, T.H. Advanced exergy analysis of an aircraft gas turbine engine: Splitting exergy destructions into parts. Energy 2015, 90, 1219–1228. [Google Scholar] [CrossRef]
- Ibrahim, T.K.; Mohammed, M.K.; Awad, O.I.; Abdalla, A.N.; Basrawi, F.; Mohammed, M.N.; Najafi, G.; Mamat, R. A comprehensive review on the exergy analysis of combined cycle power plants. Renew. Sust. Energ. Rev. 2018, 90, 835–850. [Google Scholar] [CrossRef]
- Lorencin, I.; Anđelić, N.; Mrzljak, V.; Car, Z. Genetic algorithm approach to design of multi-layer perceptron for combined cycle power plant electrical power output estimation. Energies 2019, 12, 4352. [Google Scholar] [CrossRef] [Green Version]
- Calise, F.; d’Accadia, M.D.; Libertini, L.; Vicidomini, M. Thermoeconomic analysis of an integrated solar combined cycle power plant. Energy Convers. Manag. 2018, 171, 1038–1051. [Google Scholar] [CrossRef]
- Hou, S.; Wu, Y.; Zhou, Y.; Yu, L. Performance analysis of the combined supercritical CO2 recompression and regenerative cycle used in waste heat recovery of marine gas turbine. Energy Convers. Manag. 2017, 151, 73–85. [Google Scholar] [CrossRef]
- Altosole, M.; Benvenuto, G.; Campora, U.; Laviola, M.; Trucco, A. Waste Heat Recovery from Marine Gas Turbines and Diesel Engines. Energies 2017, 10, 718. [Google Scholar] [CrossRef] [Green Version]
- Boyce, M.P. Gas Turbine Engineering Handbook, 4th ed.; Butterworth-Heinemann: Oxford, UK, 2012; pp. 253–355. [Google Scholar]
- El-Sayed, A.F. Aircraft Propulsion and Gas Turbine Engines, 2nd ed.; CRC Press: Boca Raton, FL, USA, 2017; pp. 839–1034. [Google Scholar]
- Giampaolo, T. Gas Turbine Handbook: Principles and Practice, 5th ed.; Taylor & Francis: London, UK, 2014; pp. 231–277. [Google Scholar]
- Saravanamuttoo, H.I.H.; Rogers, G.F.C.; Cohen, H.; Straznicky, P.V.; Nix, A.C. Gas Turbine Theory, 7th ed.; Pearson Education Limited: Harlow, UK, 2017; pp. 154–262. [Google Scholar]
- Schobeiri, M.T. Gas Turbine Design, Components and System Design Integration; Springer International Publishing: Cham, Switzerland, 2018; pp. 129–211, 369–422. [Google Scholar] [CrossRef]
- Yin, L.; Ju, Y.L. Comparison and analysis of two nitrogen expansion cycles for BOG Re-liquefaction systems for small LNG ships. Energy 2019, 172, 769–776. [Google Scholar] [CrossRef]
- Tan, H.; Shan, S.; Nie, Y.; Zhao, Q. A new boil-off gas re-liquefaction system for LNG carriers based on dual mixed refrigerant cycle. Cryogenics 2018, 92, 84–92. [Google Scholar] [CrossRef]
- Poljak, I.; Orović, J.; Mrzljak, V.; Bernečić, D. Energy and Exergy Evaluation of a Two-Stage Axial Vapour Compressor on the LNG Carrier. Entropy 2020, 22, 115. [Google Scholar] [CrossRef] [Green Version]
- Krikkis, R.N. A thermodynamic and heat transfer model for LNG ageing during ship transportation. Towards an efficient boil-off gas management. Cryogenics 2018, 92, 76–83. [Google Scholar] [CrossRef]
- Koo, J.; Oh, S.-R.; Choi, Y.-U.; Jung, J.-H.; Park, K. Optimization of an Organic Rankine Cycle System for an LNG-Powered Ship. Energies 2019, 12, 1933. [Google Scholar] [CrossRef] [Green Version]
- Mrzljak, V.; Poljak, I.; Medica-Viola, V. Dual fuel consumption and efficiency of marine steam generators for the propulsion of LNG carrier. Appl. Therm. Eng. 2017, 119, 331–346. [Google Scholar] [CrossRef]
- Poljak, I.; Orović, J.; Knežević, V.; Vulić, J. The Low Duty Centrifugal Compressor Control System and its Impact on the Surge Pressure. J. Mari. Transp. Sci. 2019, 57, 47–55. [Google Scholar] [CrossRef]
- Hermann, M.; Allheily, L. Installation, Operation and Maintenance Manual; Cryostar SAS; Singapore PTE LTD: Singapore, 2004; p. 31. [Google Scholar]
- Rosemount™ 2088, 2090P, and 2090F Pressure Transmitters, with HART® and 1-5Vdc Low Power Protocol, Reference Manual 00809-0100-4108, Rev CB November 2017, Emerson. Available online: https://www.emerson.com/documents/automation/manual-rosemount-2088-2090p-2090f-pressure-transmitters-hart-1-5vdc-low-power-protocol-en-76794.pdf (accessed on 9 February 2020).
- Pretrans 5111, Universal Transmitter, Prelectronics. Available online: http://www.proseskontrol.com/Resimler/Pdf/Raya/5111uk.pdf (accessed on 9 February 2020).
- ST3000 ACE Smart Transmitter, JTD Series of Differential Pressure Transmitter, No SS2-DST100-0100 (Rev.6) Yamatake. Available online: http://www.krtproduct.com/krt_Picture/sample/1_spare%20part/yamatake/Fi_ss01/SS2-DST100-0100.pdf (accessed on 9 February 2020).
- Ship Performance Monitoring/Shaft Power Meter (KYMA). Available online: https://www.igiantech.com/new-equipment/ship-performance-monitoring/ (accessed on 9 February 2020).
- Calculation of BTU Quantity for Delivered LNG; Loading Port Documentation: Arzew, Algeria, 2014.
- HIMAP & HICAM, Motor Protection Relay HIMAP-M, Hyundai Heavy Industries. Available online: http://www.tekhar.com/Programma/HYUNDAI/pdf_pict/Ships_pruduction/Himap/HIMAP+HICAM.pdf (accessed on 11 April 2020).
- Moran, M.J.; Shapiro, H.N.; Boettner, D.D.; Bailey, M.B. Fundamentals of Engineering Thermodynamics, 9th ed.; John Wiley & Sons: Hoboken, NJ, USA, 2018; pp. 106–143. [Google Scholar]
- Cengel, Y.A.; Boles, M.A.; Kangolu, M. Thermodynamics an Engineering Approach, 9th ed.; McGraw-Hill Education: New York, NY, USA, 2019; pp. 211–248. [Google Scholar]
- Poljak, I.; Orović, J.; Mrzljak, V. Energy and exergy analysis of the condensate pump during internal leakage from the marine steam propulsion system. Sci. J. Marit. Res. 2018, 32, 268–280. [Google Scholar] [CrossRef]
- Mrzljak, V.; Blecich, P.; Anđelić, N.; Lorencin, I. Energy and exergy analyses of forced draft fan for marine steam propulsion system during load change. J. Mar. Sci. Eng. 2019, 7, 381. [Google Scholar] [CrossRef] [Green Version]
- Mohtaram, S.; Chen, W.; Zargar, T.; Lin, J. Energy-exergy analysis of compressor pressure ratio effects on thermodynamic performance of ammonia water combined cycle. Energy Convers. Manag. 2017, 34, 77–87. [Google Scholar] [CrossRef]
- Kanoglu, M.; Cengel, Y.A.; Dincer, I. Efficiency Evaluation of Energy Systems; Springer: Berlin, Germany, 2012; pp. 9–40. [Google Scholar] [CrossRef] [Green Version]
- Kaushik, S.C.; Reddy, V.S.; Tyagi, S.K. Energy and exergy analyses of thermal power plants: A review. Renew. Sust. Energ. Rev. 2011, 15, 1857–1872. [Google Scholar] [CrossRef]
- Integrated Publishing’s Educational Archive, AC Generation Analysis, Basic AC Theory. Available online: http://nuclearpowertraining.tpub.com/h1011v3/css/Voltage-Calculations-29.html (accessed on 7 April 2020).
- Chen, W.K. The Electrical Engineering Handbook; Academic Press: Oxford, UK, 2005; p. 810. [Google Scholar]
- Gussov, M. Basic Electricity, 2nd ed.; Schaum’s Outline Series; The McGraw-Hill Companies: New York, NY, USA, 2007; pp. 477–482. [Google Scholar]
- Mateu-Royoa, C.; Navarro-Esbría, J.; Mota-Babilonia, A.; Molésa, F.; Amat-Albuixech, M. Experimental exergy and energy analysis of a novel high-temperature heat pump with scroll compressor for waste heat recovery. Appl. Energy 2019, 253, 113504. [Google Scholar] [CrossRef]
- Orović, J.; Mrzljak, V.; Poljak, I. Efficiency and Losses Analysis of Steam Air Heater from Marine Steam Propulsion Plant. Energies 2018, 11, 3019. [Google Scholar] [CrossRef] [Green Version]
- Ranjbar, F.; Chitsaz, A.; Mahmoudi, S.M.S.; Khalilarya, S.; Rosen, M.A. Energy and exergy assessments of a novel trigeneration system based on a solid oxide fuel cell. Energy Convers. Manag. 2014, 87, 318–327. [Google Scholar] [CrossRef]
- Lorencin, I.; Anđelić, N.; Mrzljak, V.; Car, Z. Exergy analysis of marine steam turbine labyrinth (gland) seals. J. Mar. Res. 2019, 33, 76–83. [Google Scholar] [CrossRef]
- Zare, V.; Hasanzadeh, M. Energy and exergy analysis of a closed Brayton cycle-based combined cycle for solar power tower plants. Energy Convers. Manag. 2016, 128, 227–237. [Google Scholar] [CrossRef]
- Uysal, C.; Kurt, H.; Kwak, H.Y. Exergetic and thermoeconomic analyses of a coal-fired power plant. Int. J. Therm. Sci. 2017, 117, 106–120. [Google Scholar] [CrossRef]
- Adibhatla, S.; Kaushik, S.C. Energy and exergy analysis of a super critical thermal power plant at various load conditions under constant and pure sliding pressure operation. Appl. Ther. Eng. 2014, 73, 49–63. [Google Scholar] [CrossRef]
- Mrzljak, V.; Poljak, I.; Prpić-Oršić, J. Exergy analysis of the main propulsion steam turbine from marine propulsion plant. Shipbuilding 2019, 70, 59–77. [Google Scholar] [CrossRef]
- Brasz, J.J. Oil-free centrifugal refrigeration compressors: From HFC134a to HFO1234ze(E). In Proceedings of the 8th International Conference on Compressors and Their Systems, London, UK, 9–10 September 2013; Woodhead Publishing: Sawston, Cambridge, UK, 2013; p. 472. [Google Scholar]
- Gresh, M.T. Compressor Performance Aerodynamics for the User, 2nd ed.; Elsevier Science & Technology Books; Elsevier Inc.: Cambridge, MA, USA, 2001; pp. 55–58. [Google Scholar]
- SankeyMATIC. Available online: http://sankeymatic.com/build (accessed on 9 February 2020).
- Lemmon, E.W.; Huber, M.L.; McLinden, M.O. NIST Reference Fluid Thermodynamic and Transport Properties—REFPROP; Version 9.0; User’s Guide; The National Institute of Standards and Technology: Boulder, CO, USA, 2010. [Google Scholar]
- Cao, J.; Zhang, X.; Yang, G.; Zou, X. Robust Control of Pressure for LNG Carrier Cargo Handling System via Mirror-Mapping Approach. Hindawi Complex. 2018, 7465391. [Google Scholar] [CrossRef] [Green Version]
- Gaganis, V.; Homouz, D.; Maalouf, M.; Khoury, N.; Polychronopoulou, K. An Efficient Method to Predict Compressibility Factor of Natural Gas Streams. Energies 2019, 12, 2577. [Google Scholar] [CrossRef] [Green Version]
- Rogers, W.S.; Cox, D.J. Increased Cargo Tank Filling Limits on LNG Carriers—The LR Approach. Available online: http://www.ivt.ntnu.no/ept/fag/tep4215/innhold/LNG%20Conferences/1998/Papers/6-3-Rogers.PDF (accessed on 11 April 2020).
- Liquified Gas Carrier, Safety and Operational Limit. Available online: http://www.liquefiedgascarrier.com/sloshing.html (accessed on 11 April 2020).
- Ahmed, T. Natural Gas Properties, Equations of State and PVT Analysis; Gulf Publishing Company: Houston, TX, USA, 2007; pp. 136–158. [Google Scholar]
- Modern LNG Carrier Technology—Technology Report#05—Autumn 2019, Bureau Veritas Marine & Offshore 8 Cours du Triangle 92937 Paris-La Défense, France. Available online: https://www.bureauveritas.jp/news/pdf/BV_Technology%20Report_Modern%20LNG_Web_Planche.pdf (accessed on 11 April 2020).


| Parameter. | Unit | Natural Gas Type 1 | Natural Gas Type 2 |
|---|---|---|---|
| Molecular weight | kg/kmol | 18.64 | 18.44 |
| Flow | Nm3/h | 8500 | 4000 |
| Inlet pressure | kPa | 103 | 103 |
| Inlet temperature | °C | −40 | −140 |
| Outlet pressure | kPa | 200 | 200 |
| Shaft speed | rpm | 24,000 | 17,000 |
| Isentropic efficiency | % | 77% | - |
| Main Propulsion Shaft Speed (rpm) | Gas Temperature (°C) | Gas Pressure in (MPa) | Gas Temperature Out (°C) | Gas Pressure Out (MPa) | Mass Flow (kg/h) |
|---|---|---|---|---|---|
| 25.6 | −70 | 0.1097 | −55 | 0.1260 | 3332 |
| 34.3 | −69 | 0.1096 | −55 | 0.1261 | 3346 |
| 41.8 | −72 | 0.1098 | −57 | 0.1255 | 3285 |
| 53.5 | −72 | 0.1094 | −57 | 0.1370 | 3942 |
| 61.5 | −89 | 0.1110 | −75 | 0.1274 | 4270 |
| 63.6 | −89 | 0.1111 | −75 | 0.1290 | 4453 |
| 65.1 | −90 | 0.1108 | −75 | 0.1312 | 4619 |
| 66.1 | −90 | 0.1106 | −76 | 0.1328 | 4792 |
| 67.7 | −91 | 0.1104 | −76 | 0.1350 | 4849 |
| 68.7 | −92 | 0.1102 | −77 | 0.1364 | 5120 |
| 69.5 | −92 | 0.1099 | −77 | 0.1373 | 5207 |
| 70.4 | −93 | 0.1098 | −77 | 0.1392 | 5295 |
| 71.0 | −93 | 0.1099 | −77 | 0.1397 | 5210 |
| 73.1 | −95 | 0.1094 | −76 | 0.1461 | 5559 |
| 74.6 | −96 | 0.1089 | −76 | 0.1503 | 5922 |
| 76.6 | −97 | 0.1084 | −74 | 0.1657 | 6324 |
| 78.4 | −98 | 0.1079 | −73 | 0.1628 | 6526 |
| 79.5 | −100 | 0.1078 | −73 | 0.1670 | 6773 |
| 80.4 | −101 | 0.1075 | −73 | 0.1718 | 6941 |
| 81.5 | −102 | 0.1074 | −73 | 0.1730 | 6868 |
| 82.9 | −104 | 0.1071 | −74 | 0.1777 | 7057 |
| 83.0 | −105 | 0.1071 | −74 | 0.1783 | 7103 |
| Main Propulsion Shaft Speed (rpm) | Amperage (A) | Frequency (Hz) | Electric Motor Speed (rpm) | Low-Duty Turbo Compressor Speed (rpm) |
|---|---|---|---|---|
| 25.6 | 311 | 29.8 | 1790 | 11,983 |
| 34.3 | 311 | 29.8 | 1789 | 11,977 |
| 41.8 | 311 | 29.8 | 1791 | 11,990 |
| 53.5 | 323 | 30.7 | 1843 | 12,338 |
| 61.5 | 315 | 29.8 | 1790 | 11,983 |
| 63.6 | 316 | 29.8 | 1790 | 11,983 |
| 65.1 | 319 | 29.8 | 1790 | 11,983 |
| 66.1 | 320 | 29.8 | 1790 | 11,983 |
| 67.7 | 322 | 29.8 | 1790 | 11,983 |
| 68.7 | 324 | 29.8 | 1790 | 11,983 |
| 69.5 | 326 | 29.8 | 1791 | 11,990 |
| 70.4 | 329 | 30.3 | 1816 | 12,157 |
| 71.0 | 330 | 30.3 | 1817 | 12,164 |
| 73.1 | 340 | 32.9 | 1976 | 13,229 |
| 74.6 | 349 | 35.0 | 2099 | 14,052 |
| 76.6 | 363 | 37.5 | 2249 | 15,056 |
| 78.4 | 371 | 39.6 | 2373 | 15,886 |
| 79.5 | 375 | 40.6 | 2435 | 16,301 |
| 80.4 | 386 | 42.1 | 2523 | 16,890 |
| 81.5 | 388 | 42.2 | 2532 | 16,951 |
| 82.9 | 395 | 43.4 | 2602 | 17,419 |
| 83.0 | 396 | 43.2 | 2594 | 17,366 |
© 2020 by the authors. Licensee MDPI, Basel, Switzerland. This article is an open access article distributed under the terms and conditions of the Creative Commons Attribution (CC BY) license (http://creativecommons.org/licenses/by/4.0/).
Share and Cite
Poljak, I.; Glavan, I.; Orović, J.; Mrzljak, V. Three Approaches to Low-Duty Turbo Compressor Efficiency Exploitation Evaluation. Appl. Sci. 2020, 10, 3373. https://doi.org/10.3390/app10103373
Poljak I, Glavan I, Orović J, Mrzljak V. Three Approaches to Low-Duty Turbo Compressor Efficiency Exploitation Evaluation. Applied Sciences. 2020; 10(10):3373. https://doi.org/10.3390/app10103373
Chicago/Turabian StylePoljak, Igor, Ivica Glavan, Josip Orović, and Vedran Mrzljak. 2020. "Three Approaches to Low-Duty Turbo Compressor Efficiency Exploitation Evaluation" Applied Sciences 10, no. 10: 3373. https://doi.org/10.3390/app10103373
APA StylePoljak, I., Glavan, I., Orović, J., & Mrzljak, V. (2020). Three Approaches to Low-Duty Turbo Compressor Efficiency Exploitation Evaluation. Applied Sciences, 10(10), 3373. https://doi.org/10.3390/app10103373