Article

Dynamic Characteristics of Sandstone under Coupled Static-Dynamic Loads after Freeze-Thaw Cycles

1
Key Laboratory of Mineral Resources Processing and Environment of Hubei Province, Wuhan University of Technology, Wuhan 430070, China
2
School of Urban Construction, Wuchang University of Technology, Wuhan 430223, China
3
School of Resources and Safety Engineering, Central South University, Changsha 410083, China
*
Author to whom correspondence should be addressed.
Appl. Sci. 2020, 10(10), 3351; https://doi.org/10.3390/app10103351
Submission received: 4 April 2020 / Revised: 30 April 2020 / Accepted: 8 May 2020 / Published: 12 May 2020

Abstract

:
The effect of temperature fluctuation on rocks needs to be considered in many civil engineering applications. Up to date the dynamic characteristics of rock under freeze-thaw cycles are still not quite clearly understood. In this study, the dynamic mechanical properties of sandstone under pre-compression stress and freeze-thaw cycles were investigated. At the same number of freeze-thaw cycles, with increasing axial pre-compression stress, the dynamic Young’s modulus and peak stress first increase and then decrease, whereas the dynamic peak strain first decreases and then increases. At the same pre-compression stress, with increasing number of freeze-thaw cycles, the peak stress decreases while the peak strain increases, and the peak strain and peak stress show an inverse correlation before or after the pre-compression stress reaches the densification load of the static stress–strain curve. The peak stress and strain both increase under the static load near the yielding stage threshold of the static stress–strain curve. The failure mode is mainly shear failure, and with increasing axial pre-compression stress, the degree of shear failure increases, the energy absorption rate of the specimen increases first and then decreases. With increasing number of freeze-thaw cycles, the number of fragments increases and the size diminishes, and the energy absorption rates of the sandstone increase.

1. Introduction

When rocks are subjected to freeze-thaw weather, in the freezing process, the water undergoes an ice phase volume expansion which produces a freezing force acting on the rock matrix [1]. The freezing force has an important impact on the stability of rock deformation engineering, and because of the influence of the freezing force, crack development results in internal rock damage. In the absence of an engineering disturbance, the rock mass is in an equilibrium state. When human engineering activities are carried out, such as excavation blasting, disturbing the balance, rock deformation movement results in small-scale cracks that propagate through each other causing macro-scale cracks and failure. In 2013, the China Tibet Jiama mine slope landslide was caused by the collapse of more than 2 million cubes due to freeze-thaw and dynamic loading, resulting in serious casualties and property losses [2]. In addition, Chinese western development, infrastructure construction, and cold geotechnical engineering will encounter an increasing number of problems. Therefore, it is very important to study the dynamic characteristics of rock masses under the action of the freeze-thaw cycle, which is significant in the study of rock mechanics theory and practical application of rock mass engineering.
With the accelerated development of the economy, construction has rocketed in high altitude and cold regions. In this area, rock behavior under freeze-thaw cycles is a puzzling problem for engineers in many fields, such as road, railroad, open pit, and civil engineering [3,4]. Current studies show that the mechanical properties of rock are severely affected by freeze-thaw cycles, unlike conventional rock [5,6]. Therefore, scholars have conducted many studies on the mechanical properties of rock after multiple freeze-thaw cycles. For example, through contrast tests on dry and saturated granite and andesite after freeze-thaw cycles (−16 to +20 °C), Inada and Yokota studied the relationship between the elastic modulus and temperature [7]. Matsuoka designed experiments in which the rock samples were partially immersed in water, and found that the internal microstructure of frost action is the decisive factor causing damage after freeze-thaw cycles for a variety of rocks (including igneous, sedimentary, and metamorphic rocks) [8]. In order to observe the damage in the microstructure of the rock, some advanced technology techniques such as X-ray computed tomography (X-ray CT), scanning electron microscope (SEM), nuclear magnetic resonance (NMR) are commonly used to analyze the evolution of the microstructure under freeze-thaw cycles [9,10,11,12,13,14,15,16,17]. Nicholson and Nicholson determined the relationship between pre-existing rock flaws and freeze- thaw destruction in different types of sedimentary rock after freeze-thaw cycles and identified four types of freeze-thaw damage [18]. Chen et al. found that when the degree of saturation exceeded 70%, the rock was damaged significantly, and failure can start at the area with a higher degree of saturation through welded tuff with a degree of saturation from 0% to 95% [1]. Tan et al. conducted an experiment studying the static mechanical properties of degradation of granite under freeze-thaw cycles [19].
However, rock mechanics engineering has to account for not only complex and freeze-thaw cycling environments but also for various types of static load and dynamic disturbances in cold areas, such as in situ stress, blasting in the rock mass of the slope, and earthquakes. Therefore, studying the dynamic mechanical properties of the rock under the dual effects of freeze-thaw cycles and static load has important theoretical and practical value for guiding construction in cold regions and preventing freeze-thaw disasters. In previous analyses of the results of research on the mechanical properties of rock after freeze-thaw cycles, scholars mainly focused on the static mechanic properties, physical properties, and X-ray, CT (Computed Tomography), SEM (Scanning Electron Microscope), NMR (Nuclear Magnetic Resonance) technique results, while few were found to focus on the dynamic mechanical behavior of rocks after freeze-thaw weathering. The microscopic damage characteristics and dynamic mechanical parameters of sandstone subjected to freeze-thaw cycles were investigated from NMR tests and impact loading tests [2,12]. Considering the strain-rate effect, some empirical expressions for the dynamic mechanical degradation of sandstone were proposed after long-term freeze-thaw weathering [20,21]. However, these studies only explain the effect of freeze-thaw processes without considering the combined effect of the freeze-thaw process coupled with static (pre-compression) and dynamic loads.
The natural rock mass is under three dimensional stresses, however, the stress state of a rock unit in a pillar. coupled with static-dynamic compression is often encountered, such as in underground mines and deep tunnels. The static pre-stress is geo-stress. The sources of dynamic loads may come from impact, explosion, blasting, drilling, earthquake, etc. Therefore, in this paper, the sandstone specimens were tested under different numbers of freeze-thaw cycles and different axial pre-compression stresses using the split Hopkinson Pressure Bar testing system. Stress–strain curves were obtained, and the peak stress, peak strain, failure characteristics and energy absorption rate of the specimens were studied in detail. The results indicate that the pre-compression stress and the number of freeze-thaw cycles together have a very significant effect on the rock mechanical properties and failure characteristics.

2. Experimental and Rock Specimens

2.1. Rock Specimens and Preparation

The rock used in this study is a uniform, fine to medium-grained sandstone with a light yellow color. All specimens were extracted from a sandstone block with high geometric integrity and uniformity, which were prepared in accordance with the ISRM (International Society for Rock Mechanics) suggested specification [22]. The specimens were used in SHPB (split Hopkinson pressure bar made by the School of Resources and Safety Engineering, Central South University, Changsha, Hunan, China) tests, which have a length/diameter (L/D) ratio of 1.0.
In order to determine suitable axial pre-compression stresses, static load tests were first carried out using an Instron 1346 hydraulic servo-controlled machine (made by the Instron Limited Company, Boston, MA, USA). The specimens used in static uniaxial compression tests correspond to a length/diameter (L/D) ratio of 2.0, and the average material properties from five specimens tested are summarized in Table 1.
A typical stress–strain curve (SSC) of sandstone can be divided into four stages, as shown in Figure 1. The threshold stress separating the densification stage (OA) from the elasticity stage (AB) is approximately 21 MPa and that separating the elasticity stage (AB) from the yielding stage (BC) is approximately 56 MPa. Therefore, four different axial pre-compression stresses of 0 MPa, 15 MPa, 35 MPa and 55 MPa were used to study the effect of the pre-compression stress on the dynamic mechanical characteristics. One hundred rock samples divided into 4 groups are shown in Figure 2.

2.2. Freeze-Thaw Treatment

The sandstone specimens were water-saturated before the freeze-thaw weathering treatment. Specimens were saturated by a vacuum saturation device for 12 h and then placed in a TDS-300 automatic freeze-thaw cycle testing machine (made by the Shanghai Shenrui Test Equipment Manufacturing Limited Company, Shanghai, China). In the freeze-thaw weathering treatment, saturated specimens were placed into the freeze-thaw machine and conditioned at −20 °C for 4 h. Then, they were allowed to thaw for 4 h at 20 °C. In this work, five experimental groups were carried out with the number of freeze-thaw cycles at 0 (no treatment), 20, 60, 100, and 140 respectively.
The five groups of samples, B21–B25, C21–C25, D21–D25 and E21–E25, underwent 140 freeze-thaw cycles. In order to obtain the influence of freeze-thaw cycle on the mass of the samples, the mass of each saturated sample was measured after every 20 freeze-thaw cycles, shown in Table 2.
It can be seen from Table 2 that after 140 freeze-thaw cycles, the mass of saturated sandstone samples increases as the number of freeze-thaw cycles increases. The mean mass of the samples in group E increases the most, reaching 0.96%. The variation of the average mass for the saturated samples in groups B, C, D, and E as shown in Figure 3 present non-linearly with the freeze-thaw cycles. This is due to the anisotropy of the rock and the degree of grain spalling on the rock surface during the freeze-thaw process.

2.3. NMR Test

The direct observation of the evolution of microstructures within rocks is very useful in the establishment of the damage evolution due to freeze-thaw weathering. In our study, the technique of NMR was used for this observation and to obtain the porosity and pore-size distribution of the rock [23,24].
The porosity of the rock has an important influence on the physical and mechanical properties of the rock. It is of great significance to study the damage characteristics of rock under freeze-thaw cycles by investigating the characteristics of the pore structure of the rocks quantitatively. Table 3 lists the variation in the porosity of sandstone after treatment of a different number of freeze-thaw cycles, and Figure 4 shows the corresponding relationships. The porosity of sandstone samples increases with the increase of freeze-thaw cycles, and has a total average increase of 51.71%. It can be seen that, compared with the original average porosity of the sandstone at 7.787%, the average porosity increases to 8.741%, 9.032%, 9.681%, 9.948%, 10.801%, 10.680%, and 11.803% after 20, 40, 60, 80, 100, 120 and 140 freeze-thaw cycles with an increase of 12.26%, 16.00%, 24.32%, 27.76%, 38.72%, 37.16% and 51.58% respectively. This increasing trend shows that the freeze-thaw weathering increases the pore sizes and causes micro-cracks to appear, hence the damage to the rock matrix.

2.4. Testing Technique Simulating Coupling Static and Dynamic Loads

2.4.1. Theoretical Background

More details about the theory of coupled static and dynamic loads can be found in the study presented by Li et al. [20]. When the compressive longitudinal wave propagates along an elastic bar and a specimen in the presence of axial compressive stresses at both ends, the corresponding deformation may be illustrated as shown in Figure 5a. It is assumed that there is no deflection in the elastic bar and the specimen during the test. Considering an infinitesimal segment of the force acting on the segment as shown in Figure 5b, the equation of motion may be written as:
( P s + P d ) x Δ x = ρ A Δ x 2 u t 2
where A is the area of the cross-section, ρ is the density of the material, u is the axial translational displacement, Ps is the axial pre-compression stress and Pd is the impact loading.
From mechanics and wave theory,
σ = P s + P d A
ε = u x
C = 1 ρ d σ d ε
and assuming the axial pre-compression stress is constant, i.e.,
P s x = P s t = 0
Then,
2 u t 2 = C 2 2 u x 2
where C is the wave velocity in the pre-compression material.
Equation (6) is the wave equation governing the wave propagation characteristics of the pre-compression bar and the specimen.

2.4.2. Test System and Equipment

More details of the modified Hopkinson bar testing system are shown in Figure 6 [25]. The system consists of an incident and transmitted bar subsystem, striker launcher subsystem, axial pre-compression stress inducer, and data-processing subsystem. The incident and transmitted bar subsystem is composed of two long elastic bars, i.e., an input and an output bar. The elastic bars are 2 m in length and 50 mm in diameter, with an elastic modulus of 250 GPa, Poisson’s ratio between 0.25 and 0.3, and longitudinal wave velocity of 5547 m/s. Strain gauges are mounted on the middle of the elastic bars to measure the strains induced by the stress waves propagating along the elastic bars. The striker launcher subsystem is comprised of a striker bar, a gas tank, a pressure vessel, gas switches, and outlet valves [25]. The striker bar is of double tapered shape and possesses parameters to produce a half-sine waveform, which can eliminate wave oscillation and reduce wave-dispersion effects [26,27]. The speed of the striker bar is controlled manually by adjusting the gas pressure in the gas tank. With this system, rock can be loaded with 0–200 MPa axial static pressure, 0–200 MPa confining pressure, and 0–500 MPa impact loading respectively or simultaneously. The stress and strain can be indirectly calculated using the measured strains attached in the incident and transmitted bars [28,29].

3. Strength Characteristics of Sandstone under Freeze-Thaw Cycles and Axial Pre-Compression Stresses

Rock is a non-homogeneous and brittle geo-material consisting of mineral grains, cementation bonds, and various defects. These defects mainly include joints, micro-cracks, pores, and faults. The characteristics of the inherent structure of rock make its physical and mechanical properties susceptible to changes due to external load or environmental actions. Changes in the microstructure under the coupled effects of freeze-thaw processes and pre-compression stress will eventually be expressed by the changes in the rock’s macroscopic mechanical properties.
When it is subjected to the freeze-thaw process, rock undergoes extension, expansion, and connection of micro-cracks. The freeze-thaw process causes damage in the rock in three ways. First, the pore water freezes and expands by 9–10%, exerting stress on the pore wall. Second, the ice lenses act like wedges which promote crack initiation and propagation. Third, the effect of hydrostatic pressure, in the process of freezing, part of the water is dispersed by the ice, resulting in additional hydrostatic pressure on the rock. From the discussion on pore structure characteristics using NMR technology [2], it was demonstrated that with the increasing number of freeze-thaw cycles, the rock porosity gradually increases, and the bond across the grain boundaries between the individual minerals in the rock matrix gradually decreases, with the introduction of minor flaws and cracks, leading to lower rock strength. With more freeze-thaw cycles applied the strength loss is more obvious.
In the dynamic impact tests, the dynamic load stress wave generated a tensile wave on the surface of a crack in the rock, which may cause crack propagation. However, when axial static stress is applied to a low degree, the internal micro-cracks may be forced to close and there is no stress wave reflection or transmission across the crack surface, which restrains the damage function and increases the strength of the rock. However, when the axial static pressure reaches crack initiation, internal damage occurs, leading to the generation of a large number of micro-cracks. The new generated micro-cracks form the stress wave reflection interface for dynamic loading again, resulting in a decrease in strength. It clearly demonstrated that both freeze-thaw cycles and pre-compression stress can affect the physical and mechanical properties.

3.1. Strength Characteristics of Sandstone at Different Pre-Compression Stresses

When the pre-compression stress is 0 MPa, 15 MPa, 35 MPa and 55 MPa, the corresponding dynamic stress–strain curves of typical sandstone specimens after treatment of 0, 20, 60, 100 and 140 number of freeze-thaw cycles are presented in Figure 7. The average peak stress and average peak strain under different pre-compression stress and different freeze-thaw cycles are summarized in Table 4.
From these graphs, the stress–strain curves at no axial load are observed to go through four stages, namely densification, elasticity, yielding. and failure. When the pre-compression stress is applied, the stress–strain curves show similar characteristics but without the densification stage, indicating that internal micro-cracks mainly responsible for the densification stage are closed by the pre-compression load. In this case, there is only three stages of stress–strain curves. The first is the elastic stage where the dynamic stress–strain relationship is nonlinear. This stage shows that with the increase in the pre-compression stress, more micro-cracks in the specimen are generated under dynamic impacts and therefore the slope of the elastic stage decreases gradually. The second is the yielding stage. The compression modulus at this stage is significantly reduced, suggesting that the microcracks in the rock under the action of a stress wave expand rapidly, both in numbers and in sizes, until the peak point is reached. The third is the failure stage or the post-peak behavior where the formation of the macroscopic fractures in the specimen leads to a significant decrease in its bearing capacity. In this stage, when the stress is unloaded to a certain value, the total strain of the specimen will be reduced corresponding to the tail part of the stress–strain curve. With the increase of pre-compression stress and number of freeze-thaw cycles, the rebound trend is increasingly obvious.
It can be seen from Figure 7 and Table 4 that when the number of freeze-thaw cycles is the same, the strength of the specimen under dynamic loading is greater than that under static loading, which is mainly due to the strain rate effect. Meanwhile, when the pre-compression stress is consistent, the maximum strain gradually increases.
The peak strength and peak strain of the sandstone under different axial pre-compression stresses and different number of freeze-thaw cycles are presented in Figure 8 and Figure 9, respectively.
It can be seen from Figure 8 that, under coupling loads, the strength of sandstone is higher than the static strength and its dynamic strength with no pre-compression stress. When the rock deformed under the axial pre-compression stress of 15 MPa, the strength under coupling loads can be 30.27–33.37 MPa higher than its dynamic strength. When the axial pre-compression stress is 35 MPa, the strength under coupling loads can be 14.09–28.78 MPa higher than its dynamic strength. Once the axial pre-compression stress reaches 55 MPa, the rock is at impending yielding or near to yield point, and the rock strength with the coupling loads decreases rapidly.
This is due to the complex interaction between dynamic stress waves and the internal crack surfaces. When small axial pre-compression stress is applied, internal micro-cracks and micro-holes close, which results in the reflection energy of stress wave on the crack surfaces decreasing and leading to less internal damage and higher strength. The maximum dynamic strength is 129.58 MPa at the axial pre-compression stress of 15 MPa. However, when the axial pre-compression stress is greater than a certain threshold, such as 35 MPa or 55 MPa, the rock matrix is already under substantial stress before the impact of the dynamic load, internal damage occurs and a large number of micro-cracks are generated, resulting in decreasing rock strength.
Figure 9 indicates that the dynamic peak strain first decreases and then increases with increasing axial pre-compression stress. When the axial pre-compression stress changes from 0 MPa to 15 MPa, the peak strain exhibits a significant decrease. The peak strain carries on decreasing from an axial pre-compression stress of 15 MPa to 35 MPa with a lower rate. When the axial pre-compression stress reaches 55 MPa, the peak strain increases significantly compared with that at 35 MPa.
In summary, the stress–strain curves of sandstone can be divided into three stages under axial pre-compression stresses and do not exhibit a stage of densification. With increasing axial pre- compression stress, the slope of the elastic stage and the peak stress first increase and then decrease. The dynamic peak strain first decreases and then increases at the same number of freeze- thaw cycles.

3.2. Strength Degradation of Sandstone under Freeze-Thaw Cycles

The relationships between the average dynamic peak strength and the number of freeze-thaw cycles are shown in Figure 10.
As clearly shown in Figure 10, the dynamic peak strength of the sandstone in general decreases with an increase in freeze-thaw cycles. This is mainly due to the damage caused by the freeze-thaw processes as discussed above. A linear and nonlinear correlation was found between peak stress and freeze-thaw cycles when the axial pre-compression stress was 0 MPa and 15 MPa respectively. There were two exceptions for the pre-compression stresses of 35 MPa and 55 MPa, where the peak strength increased when the freeze-thaw cycles increased to 140.
Figure 11 presents the relationships between the dynamic peak strain of sandstone and freeze-thaw cycles under different pre-compression stresses.
As can be seen in Figure 11, the peak strains have a general increasing trend with the number of freeze-thaw cycles. The highest increment rate is found to be 0 MPa of the pre-compression stress. This was explained above. The increment rate for the 55 MPa axial pre-compression stress is also found to be higher than 15 MPa and 35 MPa. In this case, the rock can be easily damaged by the additional dynamic load, as discussed above.
In summary, the dynamic peak strength of the rock decreases linearly with the increased number of freeze-thaw cycles, while the dynamic peak strain increases almost linearly. The decreasing rate of peak strength for different pre-compression stresses is almost constant while the increasing rate of peak strain is the highest at 0 MPa pre-compression stress, followed by 15, 35, and 55 MPa, which is related to the densification issue caused by the pre-compression of the specimen. Based on the analysis, 15 MPa can be regarded as the pre-compression threshold stress, where the microstructures are fully compacted and thus no densification stage under dynamic impact can be observed, for the sandstone in this study. In other words, the densification stage is completed already by the pre-compression stress at this threshold value.

4. Dynamic Failure Characteristics
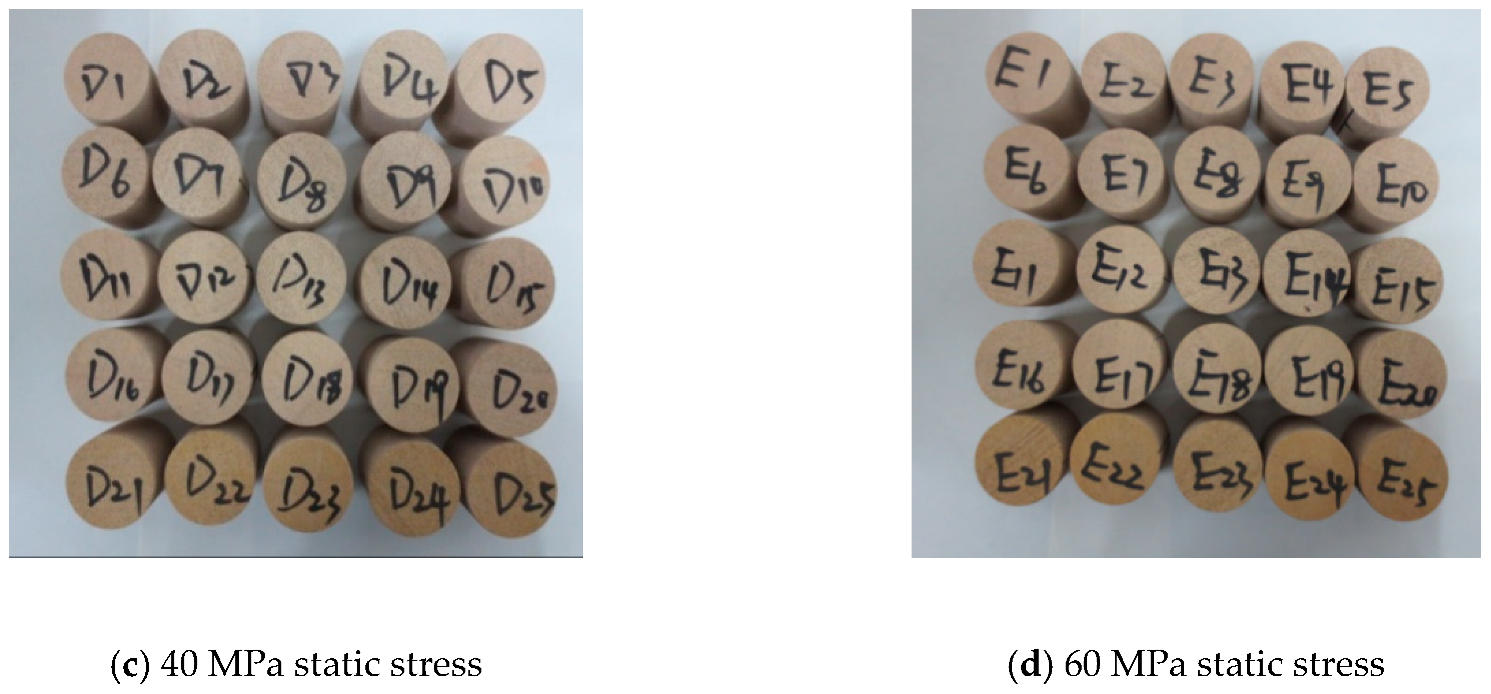
4.1. Failure Mode

The failure modes of specimens are significant indicators of the failure mechanism of rocks. To further clarify the mechanical characteristics of rock specimens under coupled static, dynamic, and freeze-thaw process, the fragmented specimens after failure were collected and the typical modes are shown in Table 5. The results indicate that specimens experiencing different freeze-thaw cycles and pre-compression stress show different failure modes.
Table 5 clearly indicates two general trends. With increasing axial pre-compression stress, more severe fragmentation is observed. This is expected as the coupled static and dynamic stress acting on the rock increases and therefore more fractures are generated. One interesting observation is that when the axial pre-compression stress is 0 MPa, the failure mode is almost all splitting for different numbers of freeze-thaw cycles. Once a pre-compression axial stress is applied, the failure mode changes to the typical corn shear failure mode of brittle material under compression. The second general trend shown in Table 5 is that as the number of freeze-thaw cycle increases, more fragmentation is observed under the same axial pre-compression load. This is consistent with the damage analysis discussed above. When more freeze-thaw is applied, internal damage mainly as an increased frequency of micro- and meso-cracks and higher internal damage is expected and therefore more severe fragmentation is likely. It is also interesting to notice that the fragments become more and more uniform as the number of freeze-thaw cycles increases. This is again consistent with the damage analysis based on NMR images [14] as the damage caused by freeze-thaw processes becomes more and more uniformly distributed as the number of freeze-thaw cycles increases.

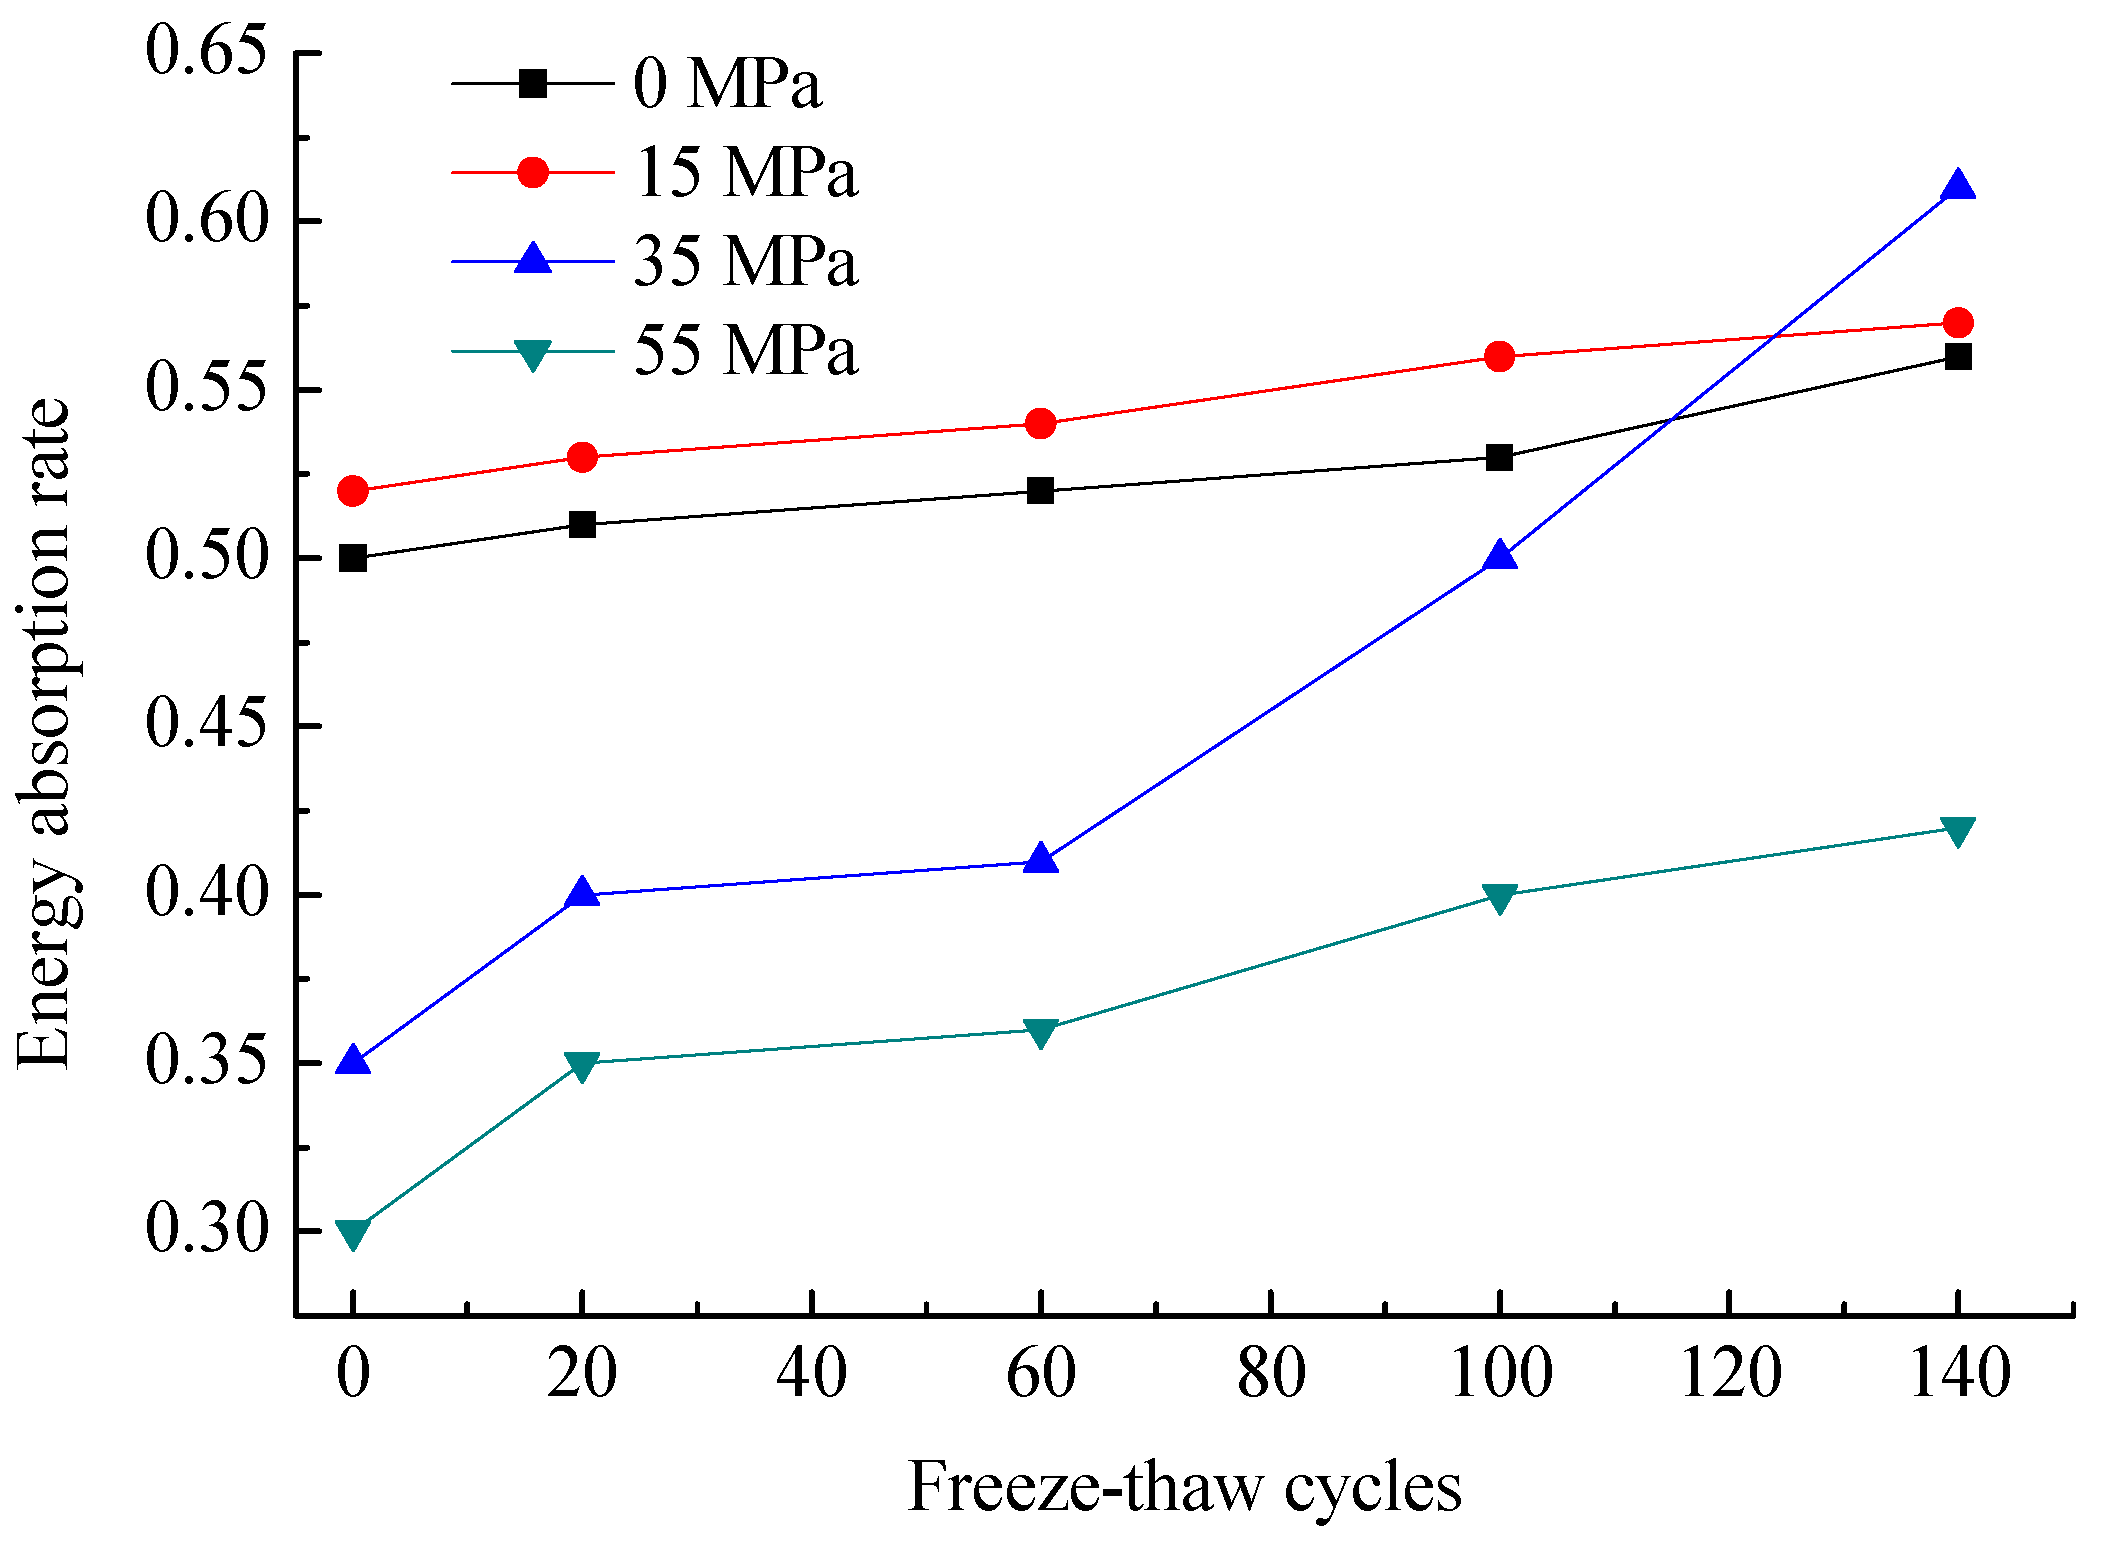
4.2. Energy Absorption Characteristics

According to the strain signals recorded in the SHPB system, the incident energy, the reflection energy, the transmitted energy and their respective ratios under different axial pre-compression stresses and different number of freeze-thaw cycles are obtained using the stress wave energy calculation principle [30] detailed in Figure 12 and Figure 13 which show the variation of the energy absorption rates [30] at different axial pre-compression stresses and different freeze-thaw cycles.
It demonstrated that with increasing axial pre-compression stresses, the energy absorption rates in general decrease, apart from when the stress increases from 0 to 15 MPa. At higher pre-compression stress, the absorbed dynamic energy needed for the rock fracture becomes smaller and therefore the rate is reduced. With increasing number of freeze-thaw cycles, more severe internal damage occurred in the specimen and thus more dynamic energy was absorbed under impact load due to the lower stiffness.

5. Conclusions

This study performed dynamic experiments on sandstone to investigate the effects of freeze-thaw cycles and pre-compression stress by using the SHPB system. The conclusions are as follows:
(1)
The stress–strain curves of the sandstone can be divided into three stages under axial pre-compression stresses and do not exhibit a densification stage. With increasing axial pre-compression stress, the slope of the elastic stage and the peak strength first increase and then decrease. The dynamic peak strain, on the other hand, first decreases and then increases for the same number of freeze-thaw cycles. When the axial pre-compression stress is 15 MPa, with increasing number of freeze-thaw cycles, the peak stress decreases and the peak strain increases almost linearly. When the axial pre-compression stress is 30 MPa, the peak stress decreases and then increases while the peak strain decreases. The peak stress and strain both increase under a pre-compression stress of 55 MPa.
(2)
The rock failure characteristics under different freeze-thaw processes and pre-compression stresses indicate that the number of fragments increases with both the increasing axial pre- compression stress and the increasing number of freeze-thaw cycles. The fragments become more uniform when more freeze-thaw cycles are applied due to the increasing internal damage within the rock. The failure modes change from splitting at 0 MPa axial pre-compression stress to shear failure at higher pre-compression stresses. The energy absorption rate of the sandstone specimen increases first and then decreases with increasing axial pre-compression stresses. With increasing number of freeze-thaw cycles, the energy absorption rates of the sandstone increase.
However, these test results and the proposed model were obtained for one particular set of conditions. The specimens were frozen and thawed in a temperature-controlled container with the temperature varying from +20 to −20 °C, and the stress state of the sample was coupled with the static– dynamic compression. In the future, other test conditions should be investigated such as the stress state in triaxial compression and how the freeze-thaw and dynamic loads affect spalling in rock slopes and rock tunnels.

Author Contributions

Methodology: B.K.; formal analysis: B.K. and H.D.; resources: H.D.; data curation: B.K., J.Z. and X.Y.; writing—original draft preparation: B.K.; writing—review and editing: B.K. and J.Z.; supervision: H.D. All authors have read and agreed to the published version of the manuscript.

Funding

The research was funded by the National Natural Science Foundation of China (Grant No. 51474252 and No. 51874352), the China Postdoctoral Science Foundation (Grant No. 2018M632936) and the Fundamental Research Funds for the Central Universities (WUT: 2019IVA092).

Acknowledgments

The first author would like to thank the Chinese Scholarship Council for financial support for the joint Ph. D at the University of Adelaide. Feng Bin is also acknowledged for his support in conducting the experiments.

Conflicts of Interest

The authors declare no conflict of interest.

References

  1. Chen, T.C.; Yeung, M.R.; Mori, N. Effect of water saturation on deterioration of welded tuff due to freeze-thaw action. Cold Reg. Sci. Technol. 2004, 38, 127–136. [Google Scholar] [CrossRef]
  2. Ke, B.; Zhou, K.P.; Deng, H.W.; Bin, F. NMR Pore Structure and Dynamic Characteristics of Sandstone Caused by Ambient Freeze-Thaw Action. Shock Vib. 2017, 2017, 10. [Google Scholar] [CrossRef] [Green Version]
  3. Grossi, C.M.; Brimblecombe, P.; Harris, I. Predicting long term freeze-thaw risks on Europe built heritage and archaeological sites in a changing climate. Sci. Total Environ. 2007, 377, 273–281. [Google Scholar] [CrossRef] [PubMed]
  4. Zhang, S.J.; Lai, Y.M.; Zhang, X.F.; Pu, Y.B.; Yu, Y.B. Study on the damage propagation of surrounding rock from a cold-region tunnel under freeze-thaw cycle condition. Tunn. Undergr. Space Technol. 2004, 19, 295–302. [Google Scholar] [CrossRef]
  5. Beier, N.A.; Sego, D.C. Cyclic freeze-thaw to enhance the stability of coal tailings. Cold Reg. Sci. Technol. 2009, 55, 278–285. [Google Scholar] [CrossRef]
  6. Proskin, S.; Sego, D.; Alostaz, M. Freeze-thaw and consolidation tests on Suncor mature fine tailings (MET). Cold Reg. Sci. Technol. 2010, 63, 110–120. [Google Scholar] [CrossRef]
  7. Inada, Y.; Yokota, K. Some studies of low temperature rock strength. Int. J. Rock Mech. Min. Sci. Geomech. Abstr. 1984, 21, 145–153. [Google Scholar] [CrossRef]
  8. Matsuoka, N. Mechanisms of rock breakdown by frost action: An experimental approach. Cold Reg. Sci. Technol. 1990, 17, 253–270. [Google Scholar] [CrossRef]
  9. Park, J.; Hyun, C.-U.; Park, H.-D. Changes in microstructure and physical properties of rocks caused by artificial freeze–thaw action. Bull. Eng. Geol. Environ. 2015, 74, 555–565. [Google Scholar] [CrossRef]
  10. De Argandona, V.G.R.; Rey, A.R.; Celorio, C.; del Rio, L.M.S.; Calleja, L.; Llavona, J. Characterization by computed X-ray tomography of the evolution of the pore structure of a dolomite rock during freeze-thaw cyclic tests. Phys. Chem. Earth Part a-Solid Earth Geod. 1999, 24, 633–637. [Google Scholar] [CrossRef]
  11. De Kock, T.; Boone, M.A.; De Schryver, T.; Van Stappen, J.; Derluyn, H.; Masschaele, B.; De Schutter, G.; Cnudde, V. A pore-scale study of fracture dynamics in rock using X-ray micro-CT under ambient freeze-thaw cycling. Environ. Sci. Technol. 2015, 49, 2867–2874. [Google Scholar] [CrossRef] [PubMed]
  12. Zhou, K.P.; Li, B.; Li, J.L.; Deng, H.W.; Bin, F. Microscopic damage and dynamic mechanical properties of rock under freeze–thaw environment. Trans. Nonferrous Metals Soc. China 2015, 25, 1254–1261. [Google Scholar] [CrossRef]
  13. Gao, F.; Wang, Q.L.; Deng, H.W.; Zhang, J.; Tian, W.G.; Ke, B. Coupled effects of chemical environments and freeze–thaw cycles on damage characteristics of red sandstone. Bull. Eng. Geol. Environ. 2017, 76, 1481–1490. [Google Scholar] [CrossRef]
  14. Li, J.L.; Zhou, K.P.; Liu, W.J.; Deng, H.W. NMR research on deterioration characteristics of microscopic structure of sandstones in freeze–thaw cycles. Trans. Nonferrous Metals Soc. China 2016, 26, 2997–3003. [Google Scholar] [CrossRef]
  15. Liu, C.; Deng, H.W.; Zhao, H.T.; Zhang, J. Effects of freeze-thaw treatment on the dynamic tensile strength of granite using the Brazilian test. Cold Reg. Sci. Technol. 2018, 155, 327–332. [Google Scholar] [CrossRef]
  16. Zhang, J.; Deng, H.W.; Taheri, A.; Ke, B.; Liu, C.J.; Yang, X.R. Degradation of physical and mechanical properties of sandstone subjected to freeze-thaw cycles and chemical erosion. Cold Reg. Sci. Technol. 2018, 155, 37–46. [Google Scholar] [CrossRef]
  17. Zhang, J.; Deng, H.W.; Taheri, A.; Ke, B.; Liu, C.J. Deterioration and strain energy development of sandstones under quasi-static and dynamic loading after freeze-thaw cycles. Cold Reg. Sci. Technol. 2019, 160, 252–264. [Google Scholar] [CrossRef]
  18. Nicholson, D.T.; Nicholson, F.H. Physical deterioration of sedimentary rocks subjected to experimental freeze–thaw weathering. Earth Surf. Process. Landf. 2000, 25, 1295–1307. [Google Scholar] [CrossRef]
  19. Tan, X.; Chen, W.Z.; Yang, J.P.; Cao, J.J. Laboratory investigations on the mechanical properties degradation of granite under freeze–thaw cycles. Cold Reg. Sci. Technol. 2011, 68, 130–138. [Google Scholar] [CrossRef]
  20. Wang, P.; Xu, J.Y.; Liu, S.; Liu, S.H.; Wang, H.Y. A prediction model for the dynamic mechanical degradation of sedimentary rock after a long-term freeze-thaw weathering: Considering the strain-rate effect. Cold Reg. Sci. Technol. 2016, 131, 16–23. [Google Scholar] [CrossRef] [Green Version]
  21. Ke, B.; Zhou, K.P.; Xu, C.S.; Deng, H.W.; Li, J.L.; Bin, F. Dynamic mechanical property deterioration model of sandstone caused by freeze–thaw weathering. Rock Mech. Rock Eng. 2018, 51, 2791–2804. [Google Scholar] [CrossRef]
  22. Zhou, Y.X.; Xia, K.; Li, X.B.; Li, H.B.; Ma, G.W.; Zhao, J.; Zhou, Z.L.; Dai, F. Suggested Methods for Determining the Dynamic Strength Parameters and Mode-I Fracture Toughness of Rock Materials. In The ISRM Suggested Methods for Rock Characterization, Testing and Monitoring: 2007–2014; Ulusay, R., Ed.; Springer International Publishing: Cham, Switzerland, 2015; pp. 35–44. [Google Scholar]
  23. Mohnke, O.; Hughes, B. Jointly deriving NMR surface relaxivity and pore size distributions by NMR relaxation experiments on partially desaturated rocks. Water Resour. Res. 2014, 50, 5309–5321. [Google Scholar] [CrossRef]
  24. Shang, J.; Hu, J.H.; Zhou, K.P.; Luo, X.W.; Aliyu, M.M. Porosity increment and strength degradation of low-porosity sedimentary rocks under different loading conditions. Int. J. Rock Mech. Min. Sci. 2015, 75, 216–223. [Google Scholar] [CrossRef]
  25. Li, X.; Zhou, Z.L.; Lok, T.S.; Hong, L.; Yin, T.B. Innovative testing technique of rock subjected to coupled static and dynamic loads. Int. J. Rock Mech. Min. Sci. 2008, 45, 739–748. [Google Scholar] [CrossRef]
  26. Li, X.B.; Lok, T.S.; Zhao, J.; Zhao, P.J. Oscillation elimination in the Hopkinson bar apparatus and resultant complete dynamic stress–strain curves for rocks. Int. J. Rock Mech. Min. Sci. 2000, 37, 1055–1060. [Google Scholar] [CrossRef]
  27. Lok, T.S.; Li, X.B.; Liu, D.; Zhao, P.J. Testing and response of large diameter brittle materials subjected to high strain rate. J. Mater. Civil Eng. 2002, 14, 262–269. [Google Scholar] [CrossRef]
  28. Gray, G.T., III. Classic split-Hopkinson pressure bar testing, in ASM Handbook, 8. In Mechanical Testing and Evaluation; Committee, A.H., Ed.; ASM International: Novelty, OH, USA, 2000; pp. 1027–1068. [Google Scholar]
  29. Lifshitz, J.M.; Leber, H. Data processing in the split Hopkinson pressure bar tests. Int. J. Impact Eng. 1994, 15, 723–733. [Google Scholar] [CrossRef]
  30. Li, X.B.; Lok, T.S.; Zhao, J. Dynamic characteristics of granite subjected to intermediate loading rate. Rock Mech. Rock Eng. 2005, 38, 21–39. [Google Scholar] [CrossRef]
Figure 1. Static stress–strain curves of sandstone used in this study.
Applsci 10 03351 g001
Figure 2. Rock samples.
Applsci 10 03351 g002aApplsci 10 03351 g002b
Figure 3. The mass changes of saturated samples after different freeze-thaw cycles.
Applsci 10 03351 g003
Figure 4. The relationship of porosity and freeze-thaw cycles.
Applsci 10 03351 g004
Figure 5. Effect of longitudinal wave on pre-stressed elastic bar: (a) deformation of elastic bar and (b) force acting on an infinitesimal segment.
Applsci 10 03351 g005
Figure 6. Configuration of coupled loads experiment.
Applsci 10 03351 g006
Figure 7. Dynamic stress–strain curves of sandstone under different freeze-thaw cycles and pre-compression stress.
Applsci 10 03351 g007aApplsci 10 03351 g007b
Figure 8. Relationship between peak stress and axial pre-compression stress under different freeze-thaw cycles.
Applsci 10 03351 g008
Figure 9. Relationship between peak strain and pre-compression stress under different freeze-thaw cycles.
Applsci 10 03351 g009
Figure 10. Relationship between the average peak strength and number of freeze-thaw cycles.
Applsci 10 03351 g010
Figure 11. Relationships between the peak strain and freeze-thaw cycles under different pre-compression stresses.
Applsci 10 03351 g011
Figure 12. The variation of energy absorption rates at different axial pre-compression stresses.
Applsci 10 03351 g012
Figure 13. The variation of energy absorption rates at different freeze-thaw cycles.
Applsci 10 03351 g013
Table 1. Static mechanical properties of sandstone.
Density (kg/m3)P-Wave Velocity (m/s)UCS (Uniaxial Compressive Strength) (MPa)Elastic Modulus (GPa)Poisson’s Ratio
2360375075.015.70.2
Table 2. Changes of saturation mass of sandstone samples after freeze-thaw cycle.
Group NumberMass of Saturated Samples after Different Freeze-Thaw Times in gChange %
020406080100120140
Group BB21230.27231.08231.71231.56231.19231.55231.79232.120.80
B22229.80230.60230.69231.07230.63230.84231.26231.430.71
B23229.08229.93230.06230.38229.80229.76230.32230.520.63
B24228.40229.31229.38229.40229.15228.95229.56229.870.64
B25231.26232.19232.35232.26232.11232.17232.44232.900.71
Average229.76230.62230.84230.93230.58230.65231.07231.370.70
Group CC21230.94232.32232.57232.64232.89233.05233.03233.251.00
C22231.04232.16231.15232.44231.64232.39232.53232.760.74
C23229.56230.72231.13231.00230.59231.27231.36230.870.57
C24227.40228.48228.48228.53228.15228.63228.73229.951.12
C25229.69230.83230.98231.15230.64231.34231.51230.800.48
Average229.73230.90230.86231.15230.78231.34231.43231.530.78
Group DD21229.68230.49230.84231.48231.65231.78231.78231.370.74
D22228.83230.02230.37230.85230.77230.89231.83230.820.87
D23229.51230.09230.46231.07231.15231.29231.09230.980.64
D24228.02228.95229.40229.80229.70229.83229.70229.160.50
D25229.57230.20230.76231.29231.25231.27230.83230.180.27
Average229.12229.95230.37230.90230.90231.01231.05231.500.60
Group EE21224.30225.10225.37226.31226.36226.17226.40226.370.92
E22229.41230.60250.52230.87231.26230.99231.02231.480.90
E23228.95229.84230.18230.60230.86230.14230.39231.220.99
E24231.42232.89232.68233.23232.90232.67232.43233.540.92
E25230.13230.60231.18231.81232.25232.26231.79232.621.08
Average228.84229.81229.99230.56230.73230.45230.41231.050.96
Table 3. Porosity variation of sandstone after different freeze-thaw cycles.
SpecimenSaturated Rock Porosity After Different Freeze-Thaw Cycles %Change Rate %
020406080100120140
E217.2078.0188.3599.3629.53210.06010.27811.40058.18
E228.1569.3179.3829.84210.35211.14011.67412.51853.48
E237.5198.3838.8249.3269.69810.5649.71311.22749.32
E248.1429.5729.49310.1469.88111.09711.16611.66843.31
E257.9108.4179.1049.72810.27811.14510.57012.20254.26
Average Value7.7878.7419.0329.6819.94810.80110.68011.80351.71
Table 4. Average peak stress and peak strain at different axial pre-compression load and freeze-thaw cycles.
Axial Pre-Compression Stress (MPa)Average Peak Stress at Different Numbers of Freeze-Thaw Cycles (MPa)Average Peak Strain at Different Numbers of Freeze-Thaw Cycles
0206010014002060100140
096.2192.3188.5482.8176.370.01030.01060.0110.01160.0121
15129.58124.8119.67113.08109.240.00690.00720.00810.00830.0084
35119.48116.64112.96110.35105.150.00620.00630.00640.00670.0065
55100.1195.9591.2983.8089.410.00890.00950.01000.01040.0110
Table 5. Dynamic failure modes under different numbers of freeze-thaw cycles and pre-compression stress.
Axial StressNumbers of Freeze-Thaw Cycles
02060100140
0 MPa Applsci 10 03351 i001 Applsci 10 03351 i002 Applsci 10 03351 i003 Applsci 10 03351 i004 Applsci 10 03351 i005
15 MPa Applsci 10 03351 i006 Applsci 10 03351 i007 Applsci 10 03351 i008 Applsci 10 03351 i009 Applsci 10 03351 i010
35 MPa Applsci 10 03351 i011 Applsci 10 03351 i012 Applsci 10 03351 i013 Applsci 10 03351 i014 Applsci 10 03351 i015
55 MPa Applsci 10 03351 i016 Applsci 10 03351 i017 Applsci 10 03351 i018 Applsci 10 03351 i019 Applsci 10 03351 i020

