1. Introduction
Some old structures, such as the Egyptian pyramids or Roman constructions have lasted more than 2000 years and are still in good condition, showing a remarkable durability. Glukhovsky argued that many of them were made of aluminosilicate calcium hydrates similar to those of Portland cement and also of crystalline phases of analcite, a natural rock. These constructions have been shown to have outstanding behavior, not only concerning the mechanical performance, but also in terms of durability and resistance to weathering [
1,
2,
3].
The (re)discovery of these materials could be very important for the construction industry. In fact, in addition to the higher strength properties shown, these materials might solve some important limitations of ordinary Portland cement (OPC): environmental problems with the release of carbon dioxide (CO
2) during the production process, and also performance due to aggressive environmental conditions [
4,
5,
6,
7]. Some authors claim that the technology reduces CO
2 emissions caused by the cement and aggregates by 80% to 90% when compared to OPC [
8,
9,
10]. Other authors found that the difference in CO
2 emissions is not so high, but they confirm that the technology has clear advantages in such aspect [
11]. Therefore, the need to promote research for materials alternative to OPC seems clear, and such material must be also competitive in its mechanical behavior. A possible solution seems to be the use of a binder obtained by alkaline activation. In general, when compared to OPC, these materials have shown acceptable mechanical strength (sometimes the strength is higher than that of normal concrete structures, made from OPC). The development of the strength can be very quick, which might speed up the construction rate. Durability and stability are also acceptable. Understandably, these characteristics depend on the mix proportions of the components of the concrete mass.
In general, the alkali activation is a hydration reaction of aluminum silicate with alkali or alkaline-earth type materials, such as: hydroxides (ROH, R(OH)
2), weak acid salts (R
2CO
3, R
2S, RF), strong acid salts (Na
2SO
4, CaSO
4.2H
2O) or silicate salts such as R
2(n) SiO
2, where R is an alkaline ion of Na, K or Li type, or alkali earth such as Ca [
12,
13]. Basically, the process consists of mixing an alkaline activator with a binder rich in alumino-silicates. First, the alumino-silicates undergo a heat treatment, involving loss of water, and modification of the coordination of the aluminum ion with oxygen. This helps to enhance the results since the material shows a great susceptibility to combine chemically [
13,
14]. Slags from blast furnaces, fly ash from coal burning in thermoelectric power plants, volcanic ash with natural heat treatment, tile or brick powder, and metakaolin obtained from kaolin (natural alumino-silicates), are examples of potential materials for the alkali activation.
Alkali activators are obtained by the use of alkali metals such as sodium and potassium. Within a relatively large group of alkaline activators, two can be distinguished: a simple activation and a combination of activators. A simple activation is obtained by a single activator, i.e., just one chemical compound, for example sodium hydroxide (NaOH) or potassium hydroxide (KOH). Combination of activators is also possible and might involve hydroxide and silicate of the alkali metal in appropriate proportions.
According to A. Pinto [
13], geopolymer mass activated with a simple activator is very plastic and shows low workability due to the high viscosity of the activator. This viscosity increases considerably when the concentration of hydroxide increases. The composite activators are slightly less viscous and, therefore, they would lead to higher workability. Using an activator based on sodium or potassium eventually leads to similar results [
15]. Simply use of sodium silicate might be sufficient depending on the curing temperature.
According to Granizo [
16], the molar concentration 12 M sodium hydroxide is the lowest concentration able to promote the alkaline reaction. Davidovits [
17] suggested that the maximum concentration would be 20 M from which the identification of the alkaline reaction would no longer be possible.
In his study of the alkaline activation of metakaolin by using an alkaline solution with sodium silicate, Pinto [
13,
18] reported an increase in mechanical strength both for compression, with values from 30 to 60 MPa, and for tensile bending, with values between 5 and 7 MPa. Fernandez-Gimenez and Palomo [
19] reported that the use of a solution consisting of sodium hydroxide (NaOH) and sodium silicate (Na
2SiO
3) as the alkali activator, rather than only NaOH caused an increase of 40 to 90 MPa after curing for one day.
Altan and Erdogan [
15] studied the effect of temperature (at room temperature and at 80 °C), and the strength development of slag mortars alkali-activated with Na + and K + hydroxide and with sodium silicate. To obtain a high strength, these authors found that both activators are required for curing at room temperature. At 80 °C sodium silicate is essential and sufficient as the NaOH solution is not needed to the gain in strength. This is because at this temperature the dissolution of the slag is sufficiently high. At room temperature, NaOH concentration affects directly the rate of increase of the strength, as it affects the rate and amount of dissolution of the slag. At 80 °C, the amount of KOH was shown to be more effective than NaOH.
The behavior of each component of the activator is not yet fully understood. In the alkaline activation process, the sodium silicate acts as a binder while sodium hydroxide acts more in the dissolution process of the raw materials [
20]. However, this proposal does not pose the possibility of Na
2SiO
3 playing both roles: providing at first the dissolution of aluminum silicate (breakdown of siloxane bonds) and afterwards acting as a binder, rearranging the structure [
7].
Also interesting are recent studies on some mechanical properties of geopolymer composites reinforced by ultra-high-molecular-weight polyethylene fibers and on the strength of powder-based three dimensional (3D) printed geopolymer samples [
21,
22].
Past research was concentrated on material studies. However, if the geopolymers are to replace to a certain extent the cement-based materials, the mechanical behavior of such types of material needs to be fully understood. Structural members made from geopolymers need to be constructed and tested. For instance, the deformability of members is of great importance in the structural design of continuous beams and prestressing systems are often used to overcome structural concrete difficulties [
23,
24]. In normal concrete, the modulus of elasticity does not vary too much with the strength. Moduli of elasticity of geopolymers can be very different from those of normal concrete and this will pose new structural problems that need to be studied. Cracking behavior of members is of great importance too, because of its influence on the corrosion of the steel bars of the reinforced elements and also because of its influence on the deformability of the members [
25].
The combination of geopolymers with other materials, such as steel and timber for structural applications also need to be studied. These studies might follow similar laboratorial or computational steps as those applied to combinations of concrete with steel or with timber [
26,
27].
There are already some few studies on the structural behavior of members made with geopolymers. Some reports of tests on columns and beams were presented in Chapter 26 of the book
Concrete Construction Engineering Handbook [
10]. Tests on columns were also performed by Maranan et al. [
28]. More structural examples are reported by Mo et al. [
29]. The bond between steel bars and geopolymers was studied by Dahou et al. [
30]. The aspects that were studied in the above works need to be further developed and many other aspects of the structural behavior need to be studied. For instance, it is expected that the geopolymers can have a positive performance regarding the protection of the reinforcing bars and regarding the bond between bars and concrete. The relatively high tensile strength can be of great importance to limit the cracking extension of the reinforced members.
The authors of this article have already performed some tests on geopolymer-reinforced beams and they found it very important to study the basic mechanical characteristics of the material and to study the influence of the composition of the activator on such characteristics. This article presents some of the findings that would be very useful for the structural design of structural members.
2. Materials and Testing Procedures
The material under study, a geopolymer mortar, is a mixture of metakaolin with an activator and sand. After a period of curing of 20 d, bending tests were performed to study the mechanical behavior of specimens. At the beginning, the load was not very high before the elastic behavior could be observed and, in a second stage, the load was increased up to failure. Compression tests were also carried out. Bending tests give the information on the modulus of elasticity and indirectly on the tensile strength. The compression tests are the most common tests for concrete. However, the tensile strength and the modulus of elasticity are also very important because they determine the way the structure behaves under service loading. The durability of the structure itself or the risk of malfunction (cracking) of partition walls, for instance, derives mostly from such characteristics.
2.1. Materials
The metakaolin used in this work is identified as HRM MetaMAx® [
31] and was supplied by Engelhard, an American company from Iselin, New Jersey. This is a high-reactivity metakaolin and the grain particles are of smaller size than the usual metakaolin. In order to evaluate the chemical composition of this material, an elemental analysis was made (see
Table 1) and this analysis indicated that the main components were silica (SiO
2) and alumina (Al
2O
3).
The sand was collected in Coimbra, Centre Region, Portugal. From the particle size analysis, the sand can be classified as a poorly graded sand according to the Unified Soil Classification System, ASTM D 2487-06 [
32]. The density of the sand particles is G = 2.64 g/cm³.
During this work an activator has been used resulting from the combination in suitable proportions of sodium hydroxide (NaOH) (10 M) with sodium silicate (Na
2SiO
3).
Table 2 shows the composition of the Base Mix of the studied mixtures. Six specimens (4 × 4 × 16 cm) were made for each batch.
Table 3 presents the 8 compositions used with the correspondent relative concentration of the activator (sodium hydroxide and sodium silicate). The results of these mixtures are, thereafter, compared to the ordinary Portland cement (OPC) mortar with no additives (see
Table 4).
The analysis of the influence of the activator composition is based on experimental results, namely the modulus of elasticity E, tensile strain ε
t, tensile strength σ
t and compressive strength σ
c. EN 196-1 [
33] was followed. This European standard presents the procedure for the determination of both the tensile bending tests and compression tests for cement mortars and establishes the use of prismatic 4 × 4 × 16 cm specimens. EN 12390-parts 1, 3 and 5 [
34,
35,
36] was also followed for the strength tests on mortar specimens.
Mixing was carried out mechanically, using a mixer for this purpose with the dimensions and characteristics specified in EN 196-1 [
33].
2.2. Tensile Bending Tests Under Elastic Behaviour
The initial modulus of the specimens, E0, was determined by the tensile bending tests under elastic behaviour and Hooke´s law (σ = ɛ.E). The σt is related to the load applied, F, while εt is measured using an extensometer stuck in the center of the lower face of test specimens.
The determination of the modulus of elasticity is not described in EN 196-1 [
33]. However, the general procedure suggested by the standard was adapted. The load model presented in EN 12390-5 [
36], where the specimens are subjected to two F/2 loads placed at thirds spans, was adopted. During the test, the vertical load was applied with increments of 20 N, by using standard weights. The strain for each load level was recorded.
Four charge/discharge cycles were applied with the maximum load of 80 N (less than 1/20 of the failure load). The tensile strength σ
t (MPa) is given by the following equation:
where M (N mm) is the moment applied to the specimen; b (mm) and h (mm) are geometrical properties of the specimen (width and height respectively), F (N) is the applied load; L (mm) is the horizontal distance between the load F/2 and the nearest support.
2.3. Tensile Bending Tests
The tensile bending tests described herein were performed by using the same load model described in EN 12390-5 and used for the initial modulus of elasticity. However, for this test, the load increments were applied up to failure by hydraulic means. At first, a vertical deflection was applied with a maximum preload of about 0.2 kN (about 1/10 of the failure load) and after that the load was increased progressively to achieve a deformation speed of 0.003 mm/sec until failure.
2.4. Compressive Strength Tests
The pair of specimens obtained from each tensile bending test were subject to compression loading, in two stages. In the first stage of the test, a small preload of 5 kN was applied and afterwards the load was increased until failure, at a deformation rate of 0.01 mm/sec. The load at failure (F) was recorded for the computation of the compression strength σ
c (MPa) of the mix through the following Equation (2):
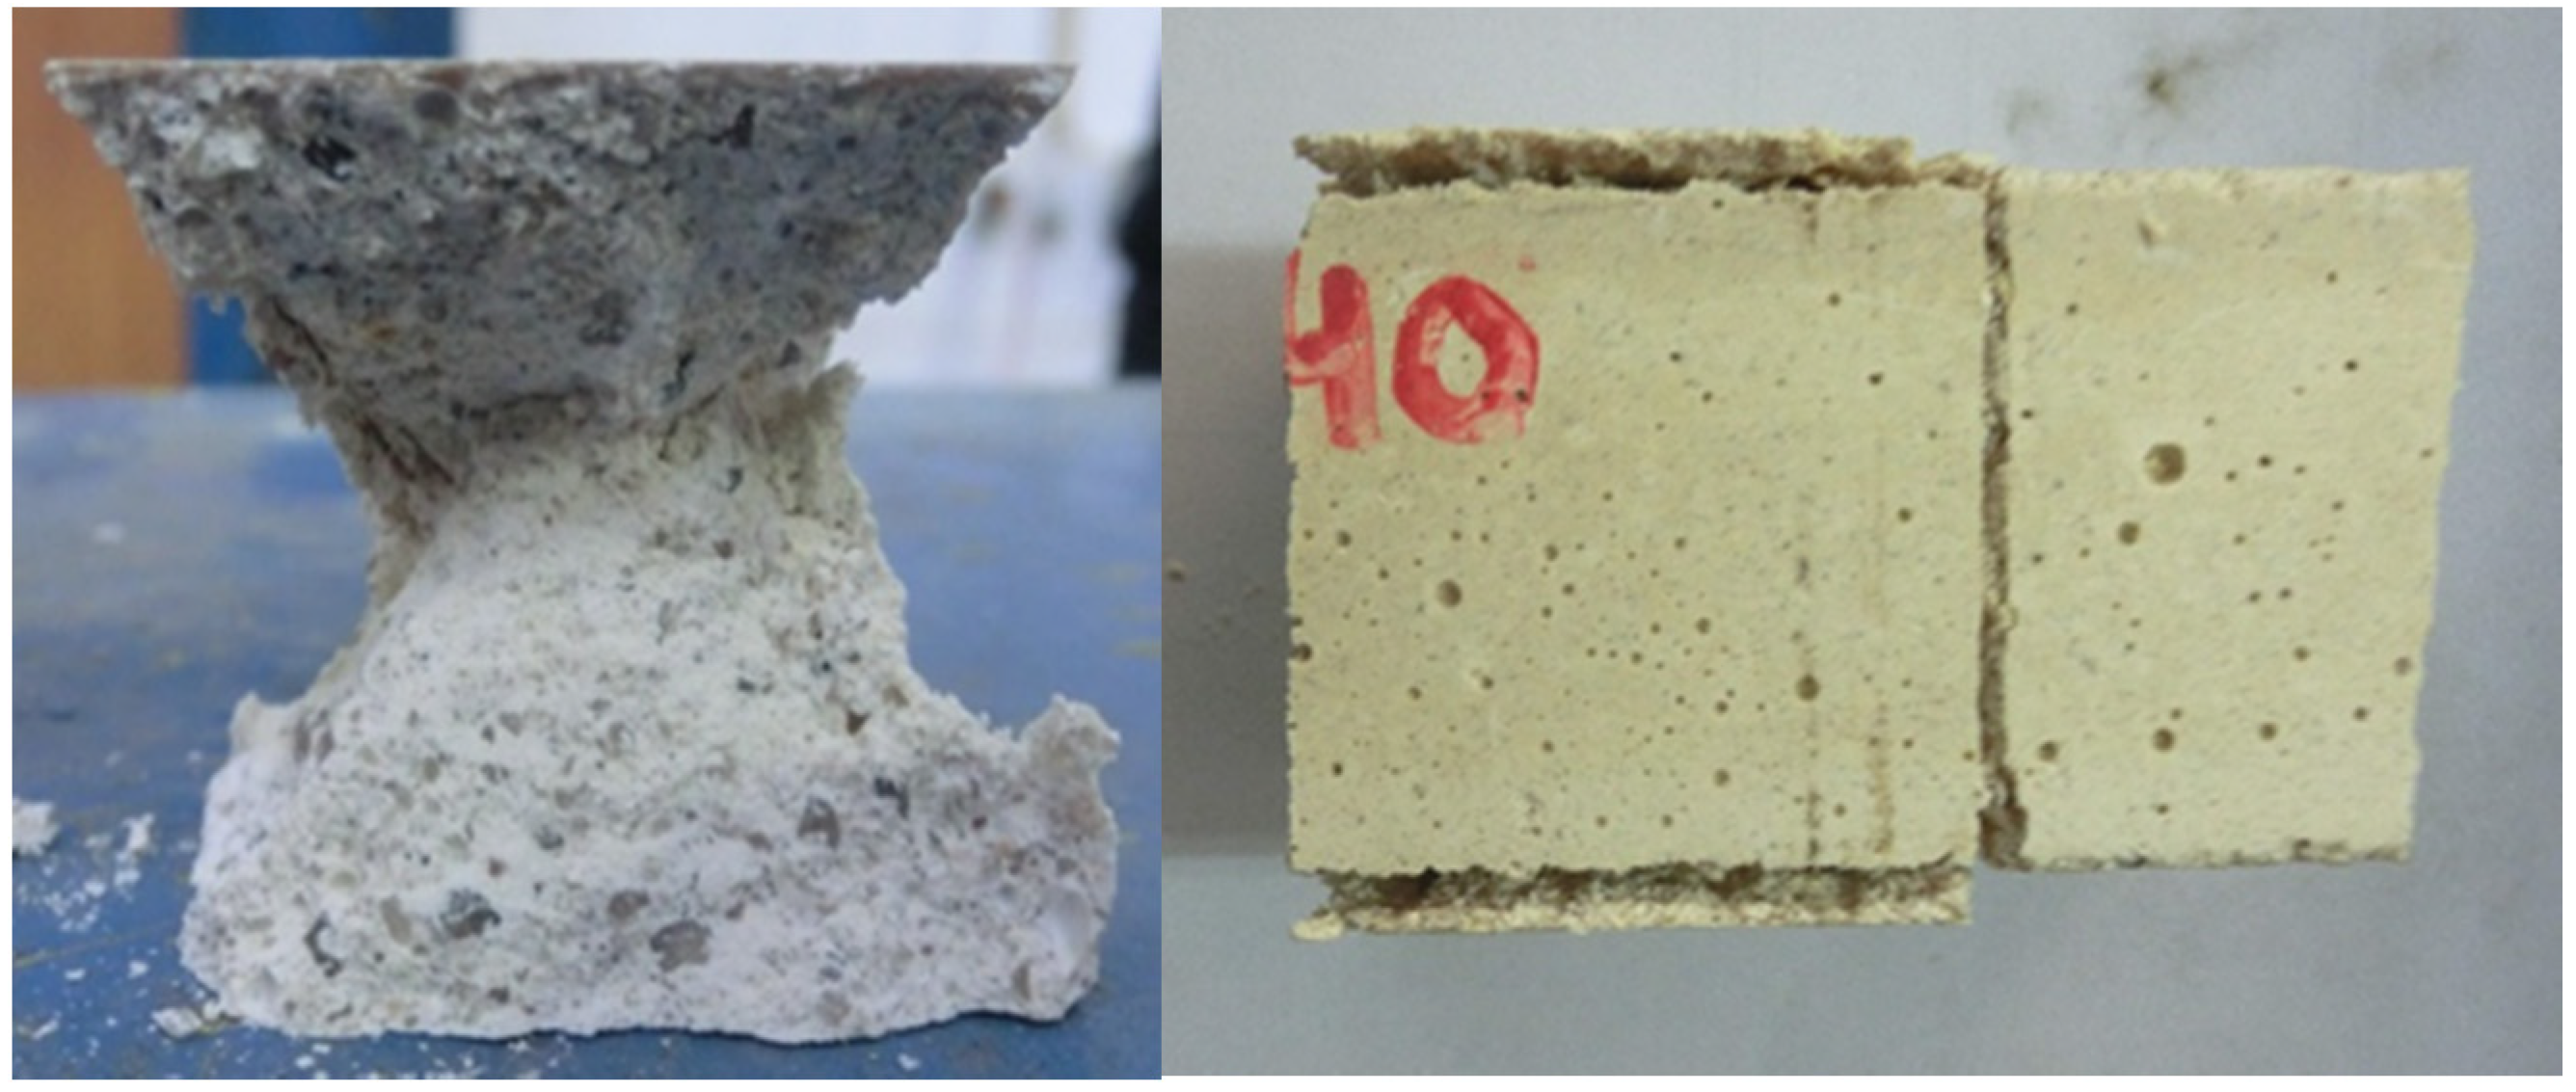
Figure 1 shows the specimens after the compressive tests. It is clear that the specimens present the double pyramid shape after failure and therefore, according to EN 12390-3 [
36], this type of failure can be classified as satisfactory.
3. Test Results
After the tests, the results were analyzed. The tensile bending tests under elastic behavior were the first tests carried out in order to evaluate the static modulus of elasticity. After these, two other types of tests were performed up to failure to evaluate the strength characteristics: the bending tensile testing, and the compressive tests. For each composition of the activator, a total of 6 specimens were tested for the bending tensile test and 12 specimens for the compressive tests. All these tests were performed after 20 d of curing.
3.1. Tensile Strength
For the tensile bending test, the increment of the applied load was measured while the strain was controlled. The maximum load before failure was recorded. As should be expected, failure occurred mostly in the central area of the specimens, except for a few cases where there was a rupture slightly shifted from this central zone. After bending tests each specimen was thus divided into two prisms.
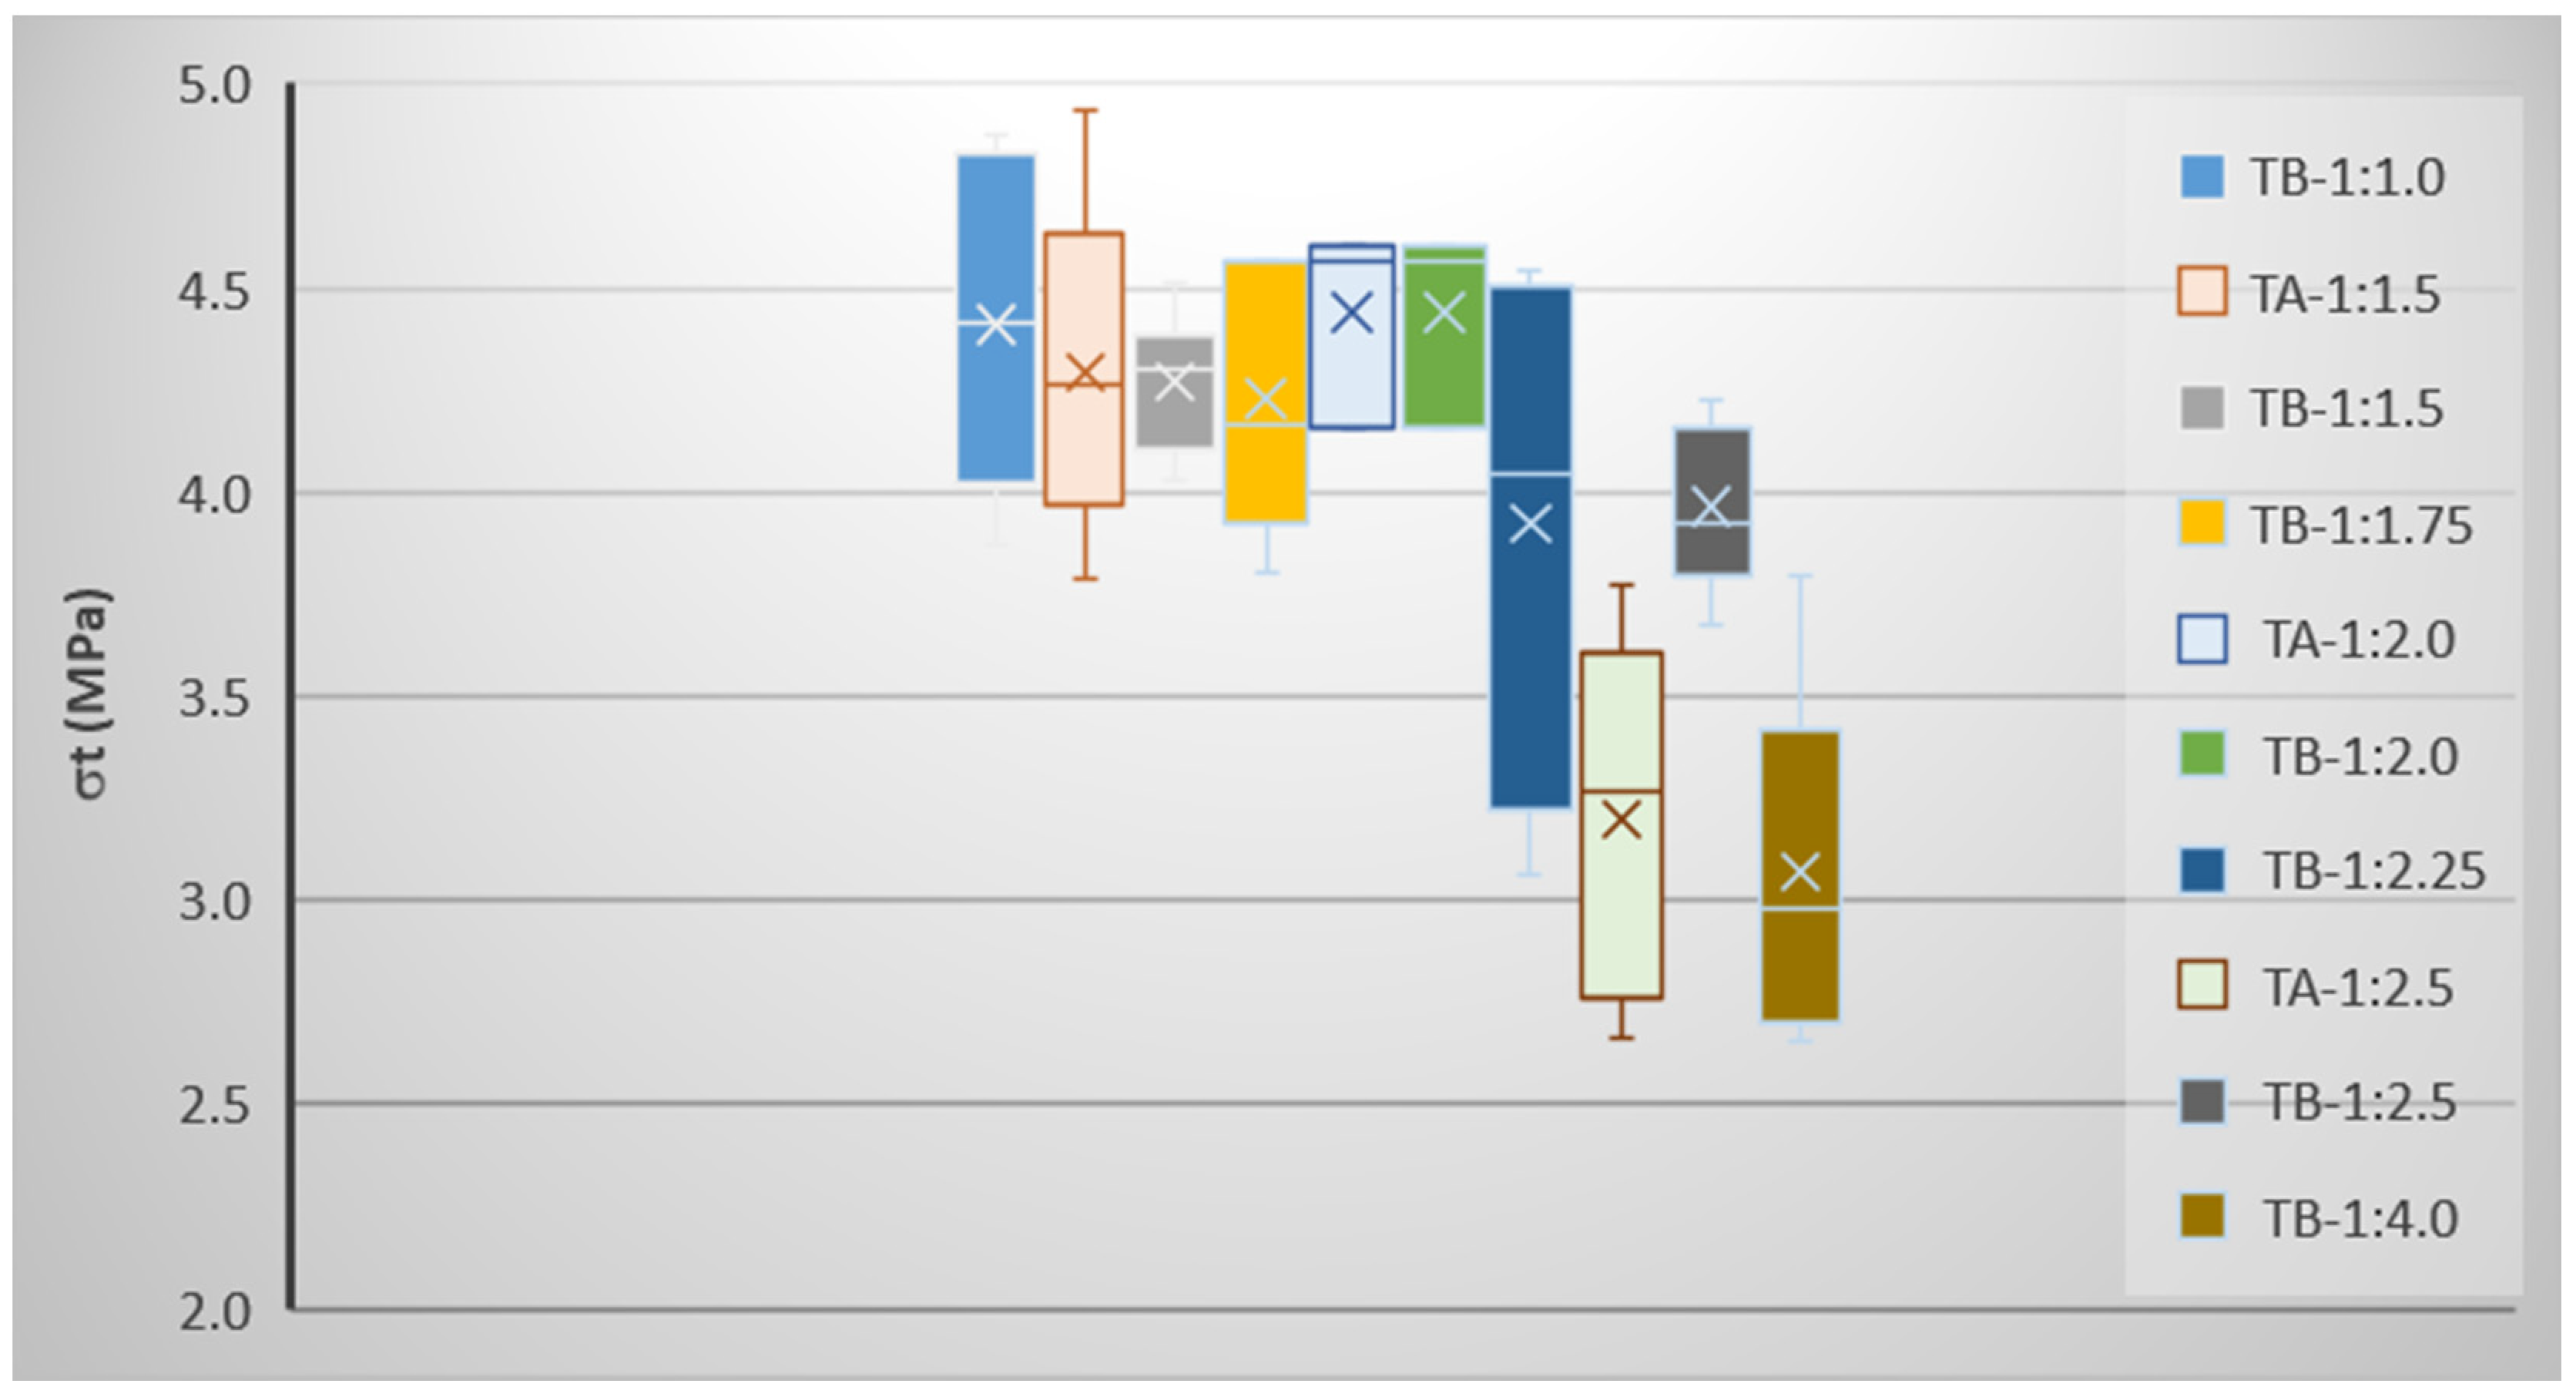
Figure 2 shows the statistical tensile strength σ
t for the 9 different compositions of the activator. For example, TB-1:2.25 means Type B mixes (see
Table 3) with 1:2.25 ratio of activator composition.
As can be seen, for Type A mixes (see
Table 3) the average value of tensile strength values is maximum for the Base Mix (1:2). In fact, these mixes have been shown to have some excess of liquid or imperfections, which might have influenced the strength. As the amount of the activator varies relative to the Base Mix, the workability also changes. It was found that 1:1.5 ratio is less workable and 1:2.5 is more fluid. In fact, for the former mix it was necessary to add an extra 50 mL of water at the time of preparation of the batches. The results suggest that the more liquid the material has, the less strength it has.
As far as Type B mixes are concerned, it is found that the composition with the highest tensile strength corresponds to 1:1 (4.5 MPa) and that of the lowest value corresponds to 1:4 (3.1 MPa), i.e., only about 2/3 of the highest value. Excepting this latter mix (1:4), the tensile strength values range between about 4.0 and 4.5 MPa, and it seems it is not possible to see a direct relationship between σt and activator composition. The mixes of various compositions exhibit strengths not higher than the Base Mix. For Type B mixes and for the OPC mortar specimens, the computed standard deviation was found to be always lower than 0.7 MPa, which indicates some variability of results that should not be neglected. Failure surfaces always occurred in the central area of the specimens.
The OPC mortar show a tensile strength of 3.64 MPa after 28 d of cure and 3.66 MPa after 60 d. Taking into consideration the usual gain of compressive strength with time, it would be expected that the tensile strength would accompany this evolution as expressed in EC2 [
37]. However, the strength values for 28 and 60 d are very similar. Phenomena such as the shrinkage of mortar may be the reason for the non-increase of this strength, but no macroscopic shrinkage was detected in the specimens. The OPC mortar strength is generally about 15% lower than that obtained for most of the geopolymer mixes, which is not a dramatic difference in practical terms.
The results seem to show that the tensile strength of geopolymers is not significantly influenced by the composition of the mixes. The biggest variation is at 1:2.5 for Type A mixes and at 1:4 for Type B mixes, although the variation from the Base Mix is never too sharp. It was also found that the tensile strength of geopolymers is not significantly higher than that of the cement mortar, but it still generally shows a moderate gain. This aspect can significantly modify the behavior of structural members as far as phenomena such as cracking or bond properties of the steel reinforcement are concerned.
3.2. Tensile Strain
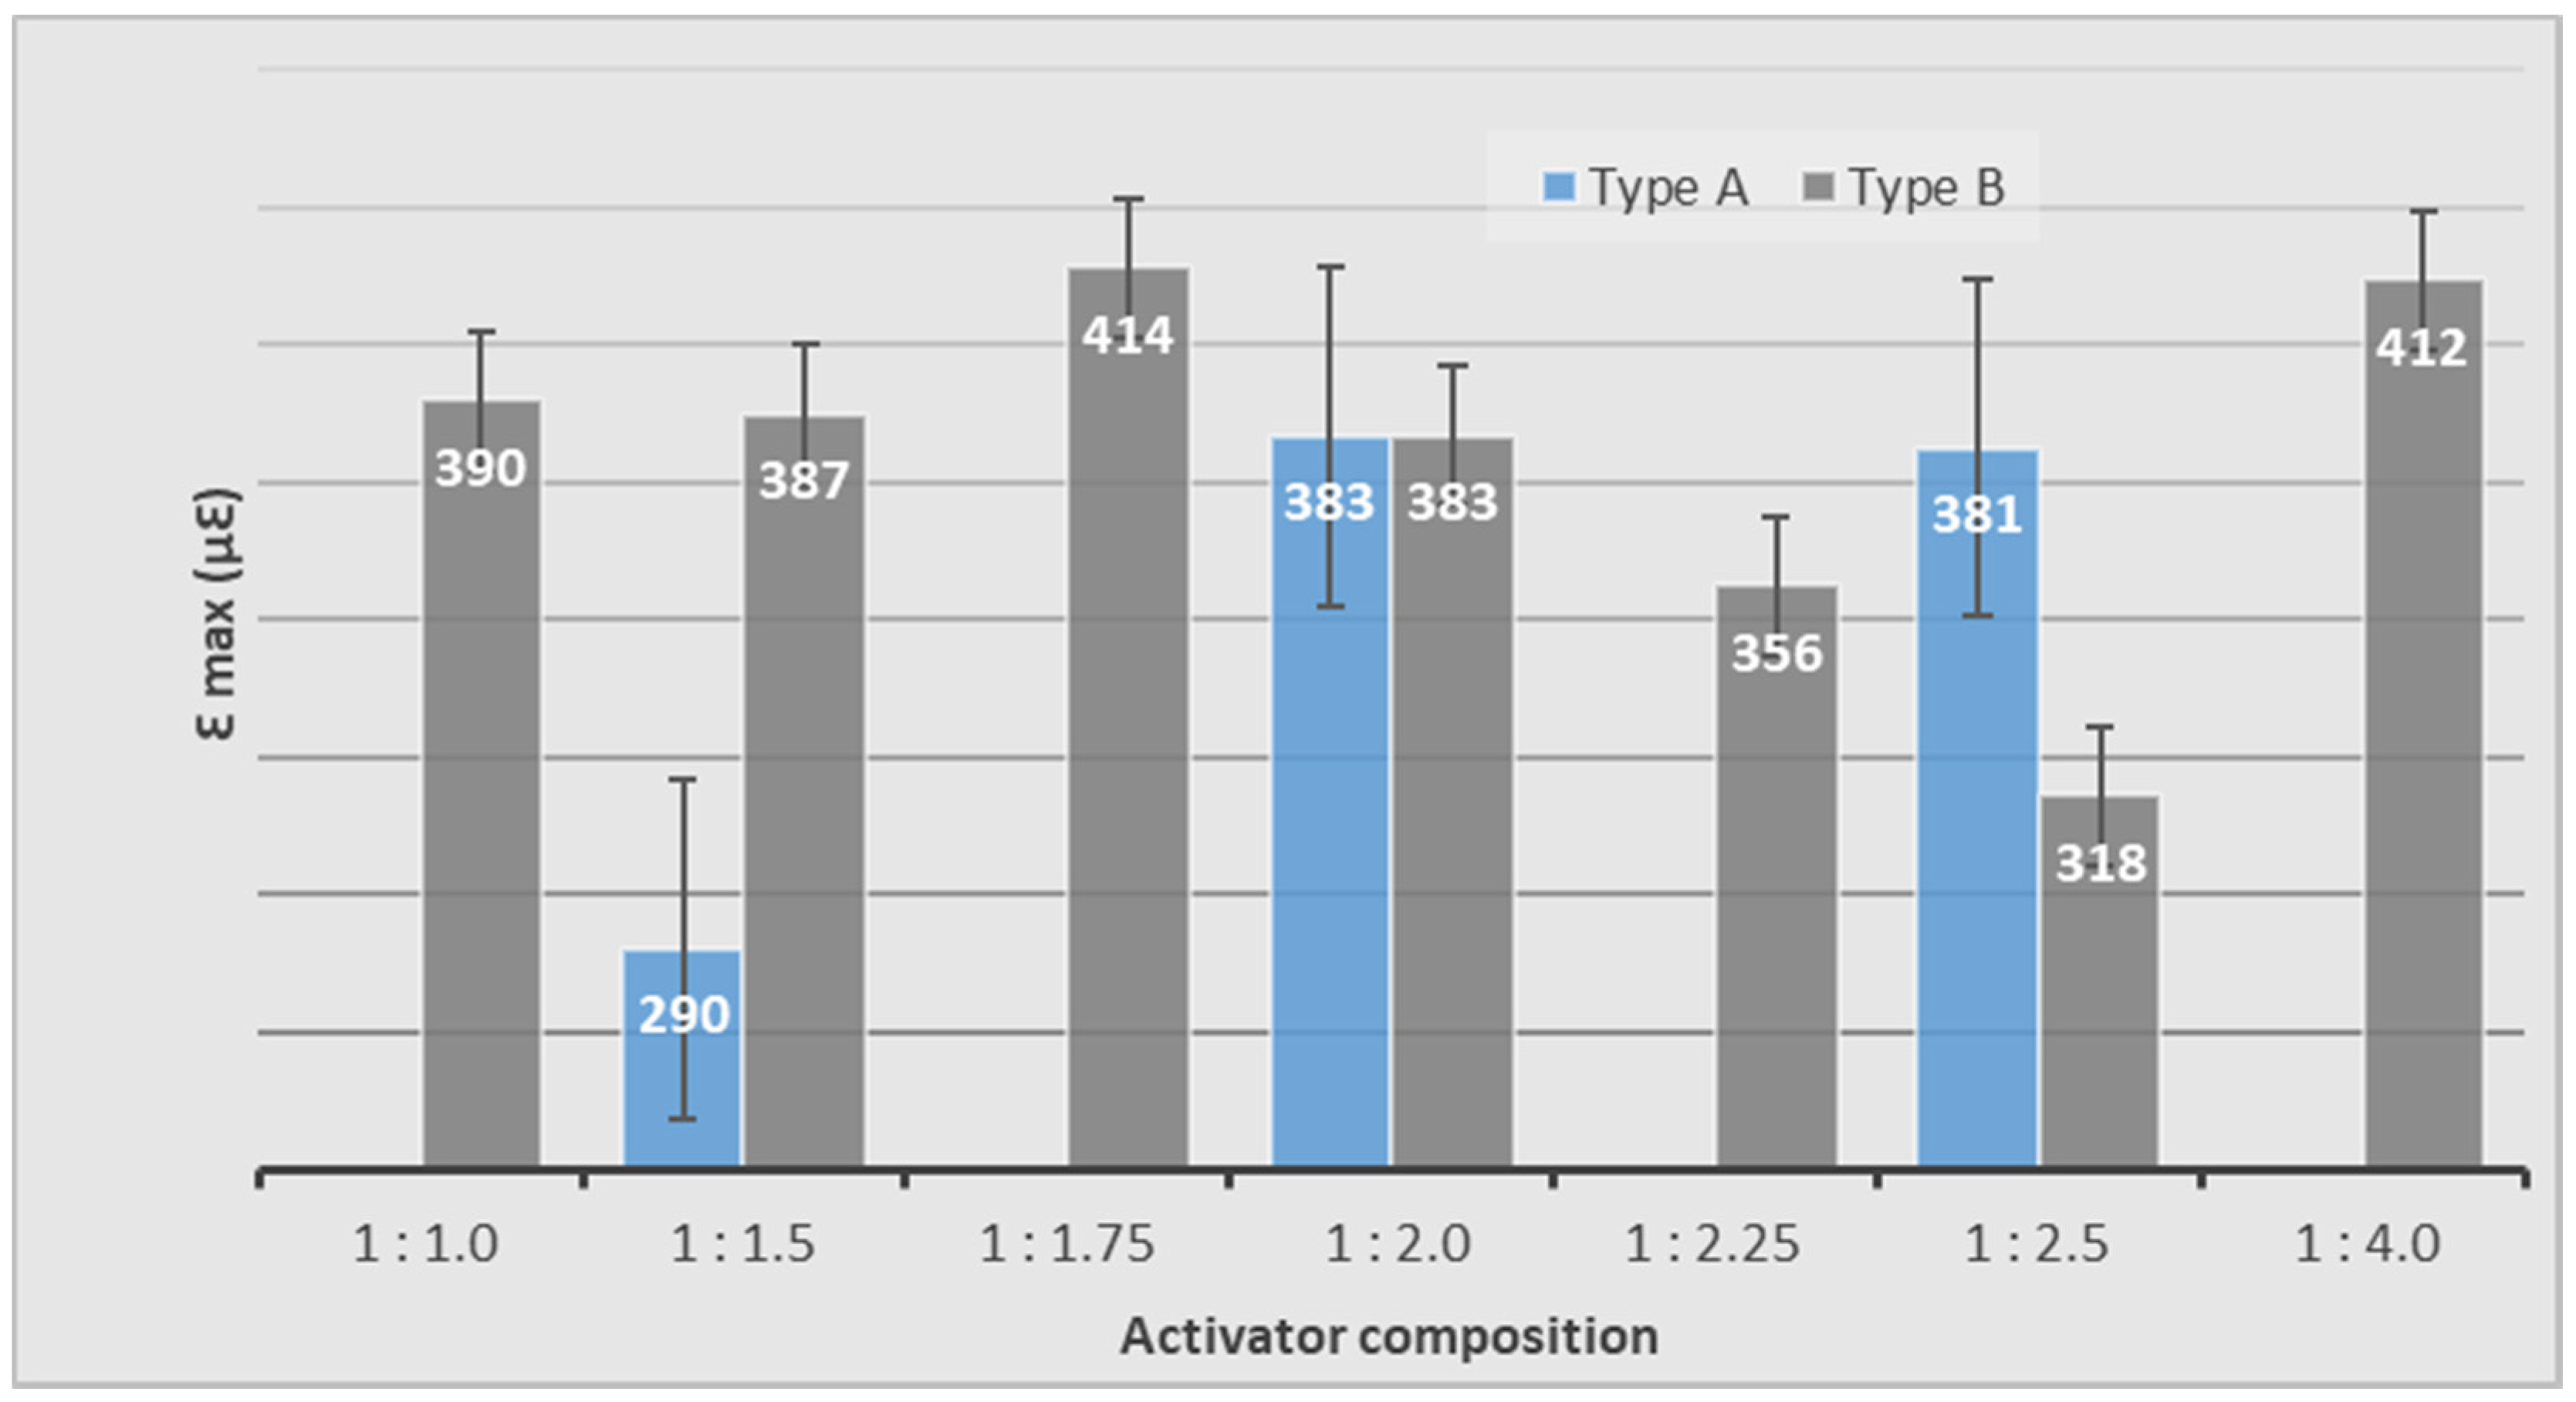
Some specimens were instrumented with strain gauges to evaluate the strains up to failure, during the bending tensile tests. It is assumed that failure would correspond to the point of maximum load applied to the specimen. The results are shown in
Figure 3. The presented margin of error of the data is computed from the standard error of the mean (or alternatively from the product of the standard deviation of the data and the inverse of the square root of the sample size, which is the same) and it is typically approximately twice the standard deviation—the half-width of a 95% confidence interval.
As can be seen, Type A mixes have, on average, slightly lower values than those of Type B, except for 1:1.5, for which the strain value is far below the others (290 μɛ). The possible reason given before for the explanation of low tensile strength values, i.e., some excess of liquid, does not seem to fully explain the difference in this case. The variability of the results would help to explain some relatively high variations.
For Type B mixes, the composition with the highest strain corresponds to 1:1.75 (414 μɛ) and the lowest to 1:2.5 (318 μɛ). It also appears that most of the mixes have strains higher than that of the Base Mix, except for 1:2.25 and 1:2.5. However, the values did not show any direct relationship to the activator composition. For Type B mixes, the standard deviation shows a maximum value of 108 μɛ, revealing the significant variability of the results.
For OPC mortars, the tensile strain measured at failure was 118 μɛ, which is clearly lower than those obtained for the different compositions of geopolymer specimens (the maximum standard deviation was found to be 21 μɛ). On average, OPC mortars have values approximately one third of those of geopolymers. This means that the geopolymers seem significantly more deformable at tensile failure. These results are very important and have great impact on the structural behaviour of the members. The structures could be more adaptable to the imposed deformations (for instance differential soil settlements), but the deformations of the slabs could be a critical aspect in the structural design (as known, the deformation of the slabs must not exceed some values specified in standards to prevent cracking of non-structural components of the construction, such as partition walls, for instance).
3.3. Modulus of Elasticity
The modulus of elasticity (MOE) can be obtained from the tensile bending tests on specimens with bonded strain gauges. Two test methods can be used: the static and the quasi-static. The modulus of elasticity calculated from the tensile bending test up to failure is named the quasi-static modulus of elasticity (QSMOE) and the modulus obtained from the elastic tests is named the static modulus (SMOE).
During the first type of tests, the strain values were recorded after stabilization of the readings for each load. The maximum strain has never exceeded 100 μɛ and readings in the loading part of the curve should coincide with the readings in the unloading part down to the initial zero. This is an essential condition for the behavior to be considered elastic. Typically, the readings stabilized 2 to 4 s after loading/unloading. For the QSMOE tests, the strain rate was defined in such a way that failure should never occur in less than 120 s. This was considered an essential condition for the test to be considered quasi-static, that is, with negligible dynamic effects. Comparison of the results was carried out considering always the same maturity for the test specimens (20 d).
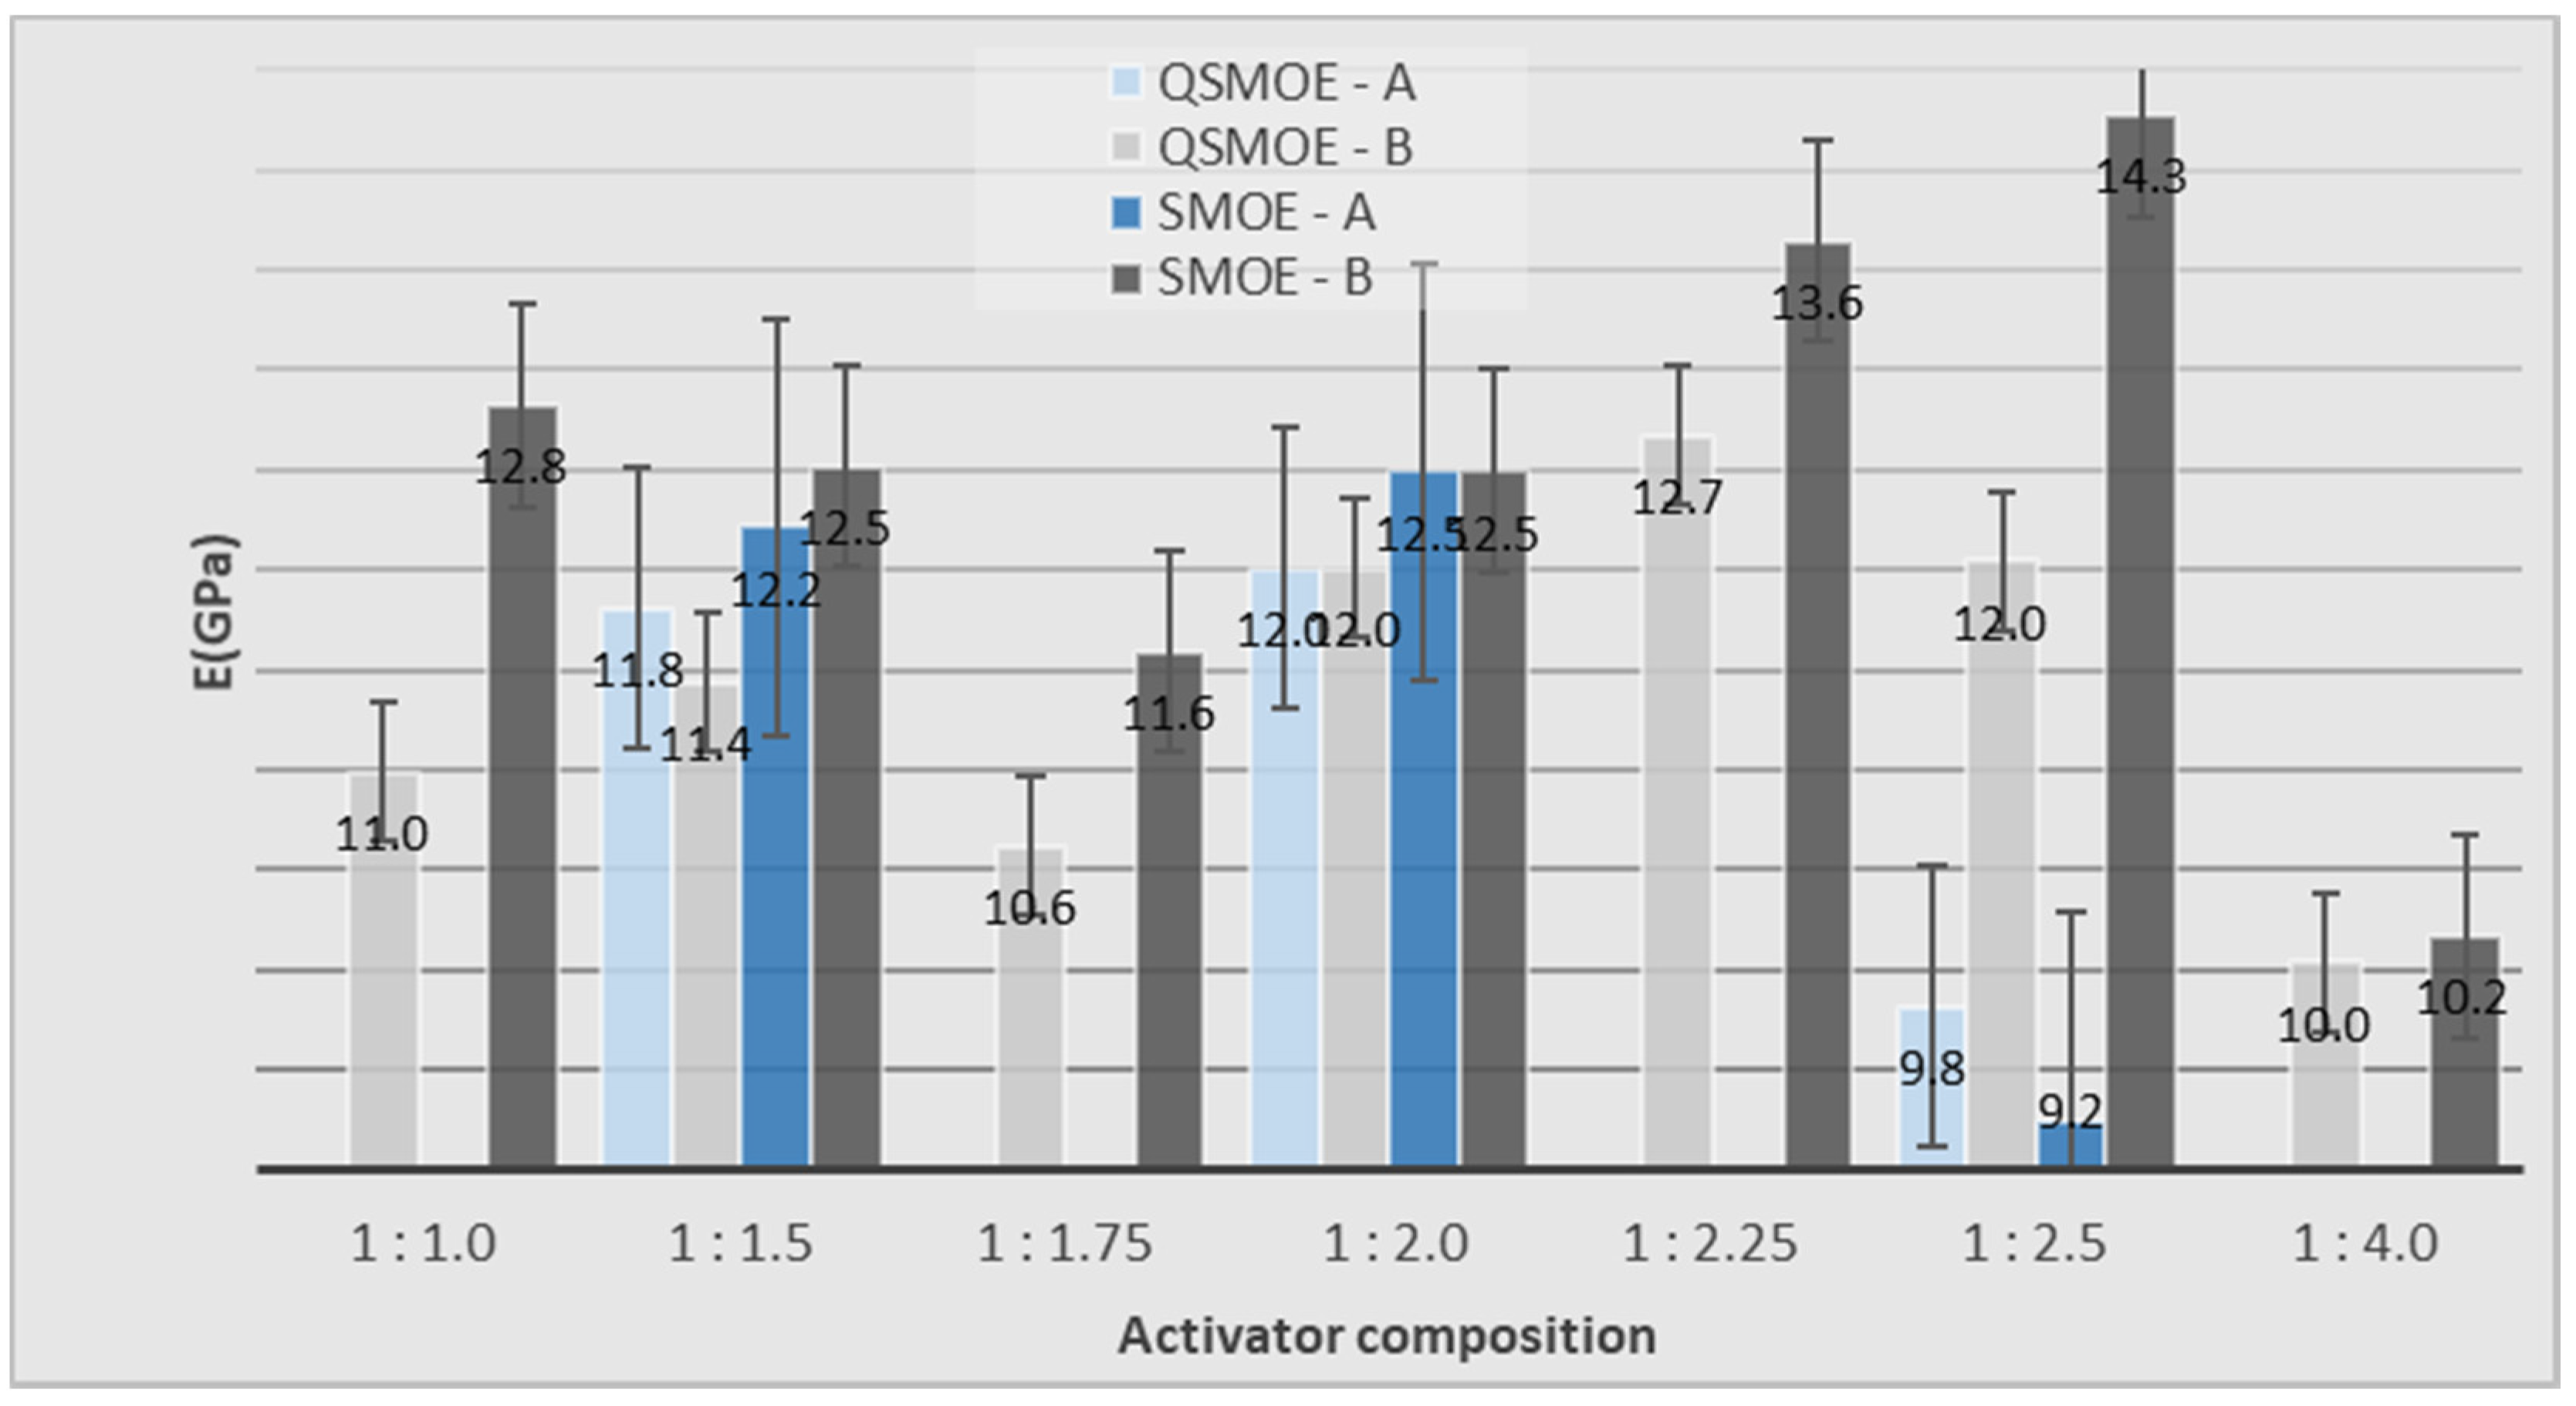
Figure 4 shows the results for Type A and Type B mixes. The bars for QSMOE and SMOE are light- and dark-colored respectively.
The results show that QSMOE values for Type A mixes are in general equivalent to those of Type B. As mentioned before, excess of liquid in Type B mixes or perhaps lack of liquid in Type A mixes might help to explain some variability of the values.
The standard deviation for each composition for Type B mixes was always less than 4.0 GPa which, in percentage, is of the same order of variability as that for the maximum strain. Curiously, the maximum standard deviation for the OPC mortar was less than 2.3 GPa for values of moduli of elasticity much higher than those of geopolymers (at least the double). The highest value of QSMOE for Type B mixes was for 1:2.25 (12.7 GPa) whereas the lowest value was for 1:1.4 (10 GPa). This latter value is significantly low when compared with other values of Type B mixes, which shows the low rigidity of this ratio. With the exception of 1:1.75 and 1:4, it can be seen that for Type B mixes the proportion of the components of the activator does not influence significantly the results, as these are very close, between 11 and 13 GPa.
Comparing the values for the QSMOE and SMOE, it appears that the former are slightly higher than the latter, with the exception of one case: Type A Mix 1:2.5.
For the QSMOE of OPC mortars, a value of 28.3 GPa was obtained. This value was 19% lower than that of SMOE. In general, the modulus of elasticity of OPC mortars was about 2.3 times higher than that of geopolymers of different compositions. This confirms the higher deformability of geopolymers when compared with OPC mortars, which is an important conclusion, very much in line with the outcome of tensile strain results presented above.
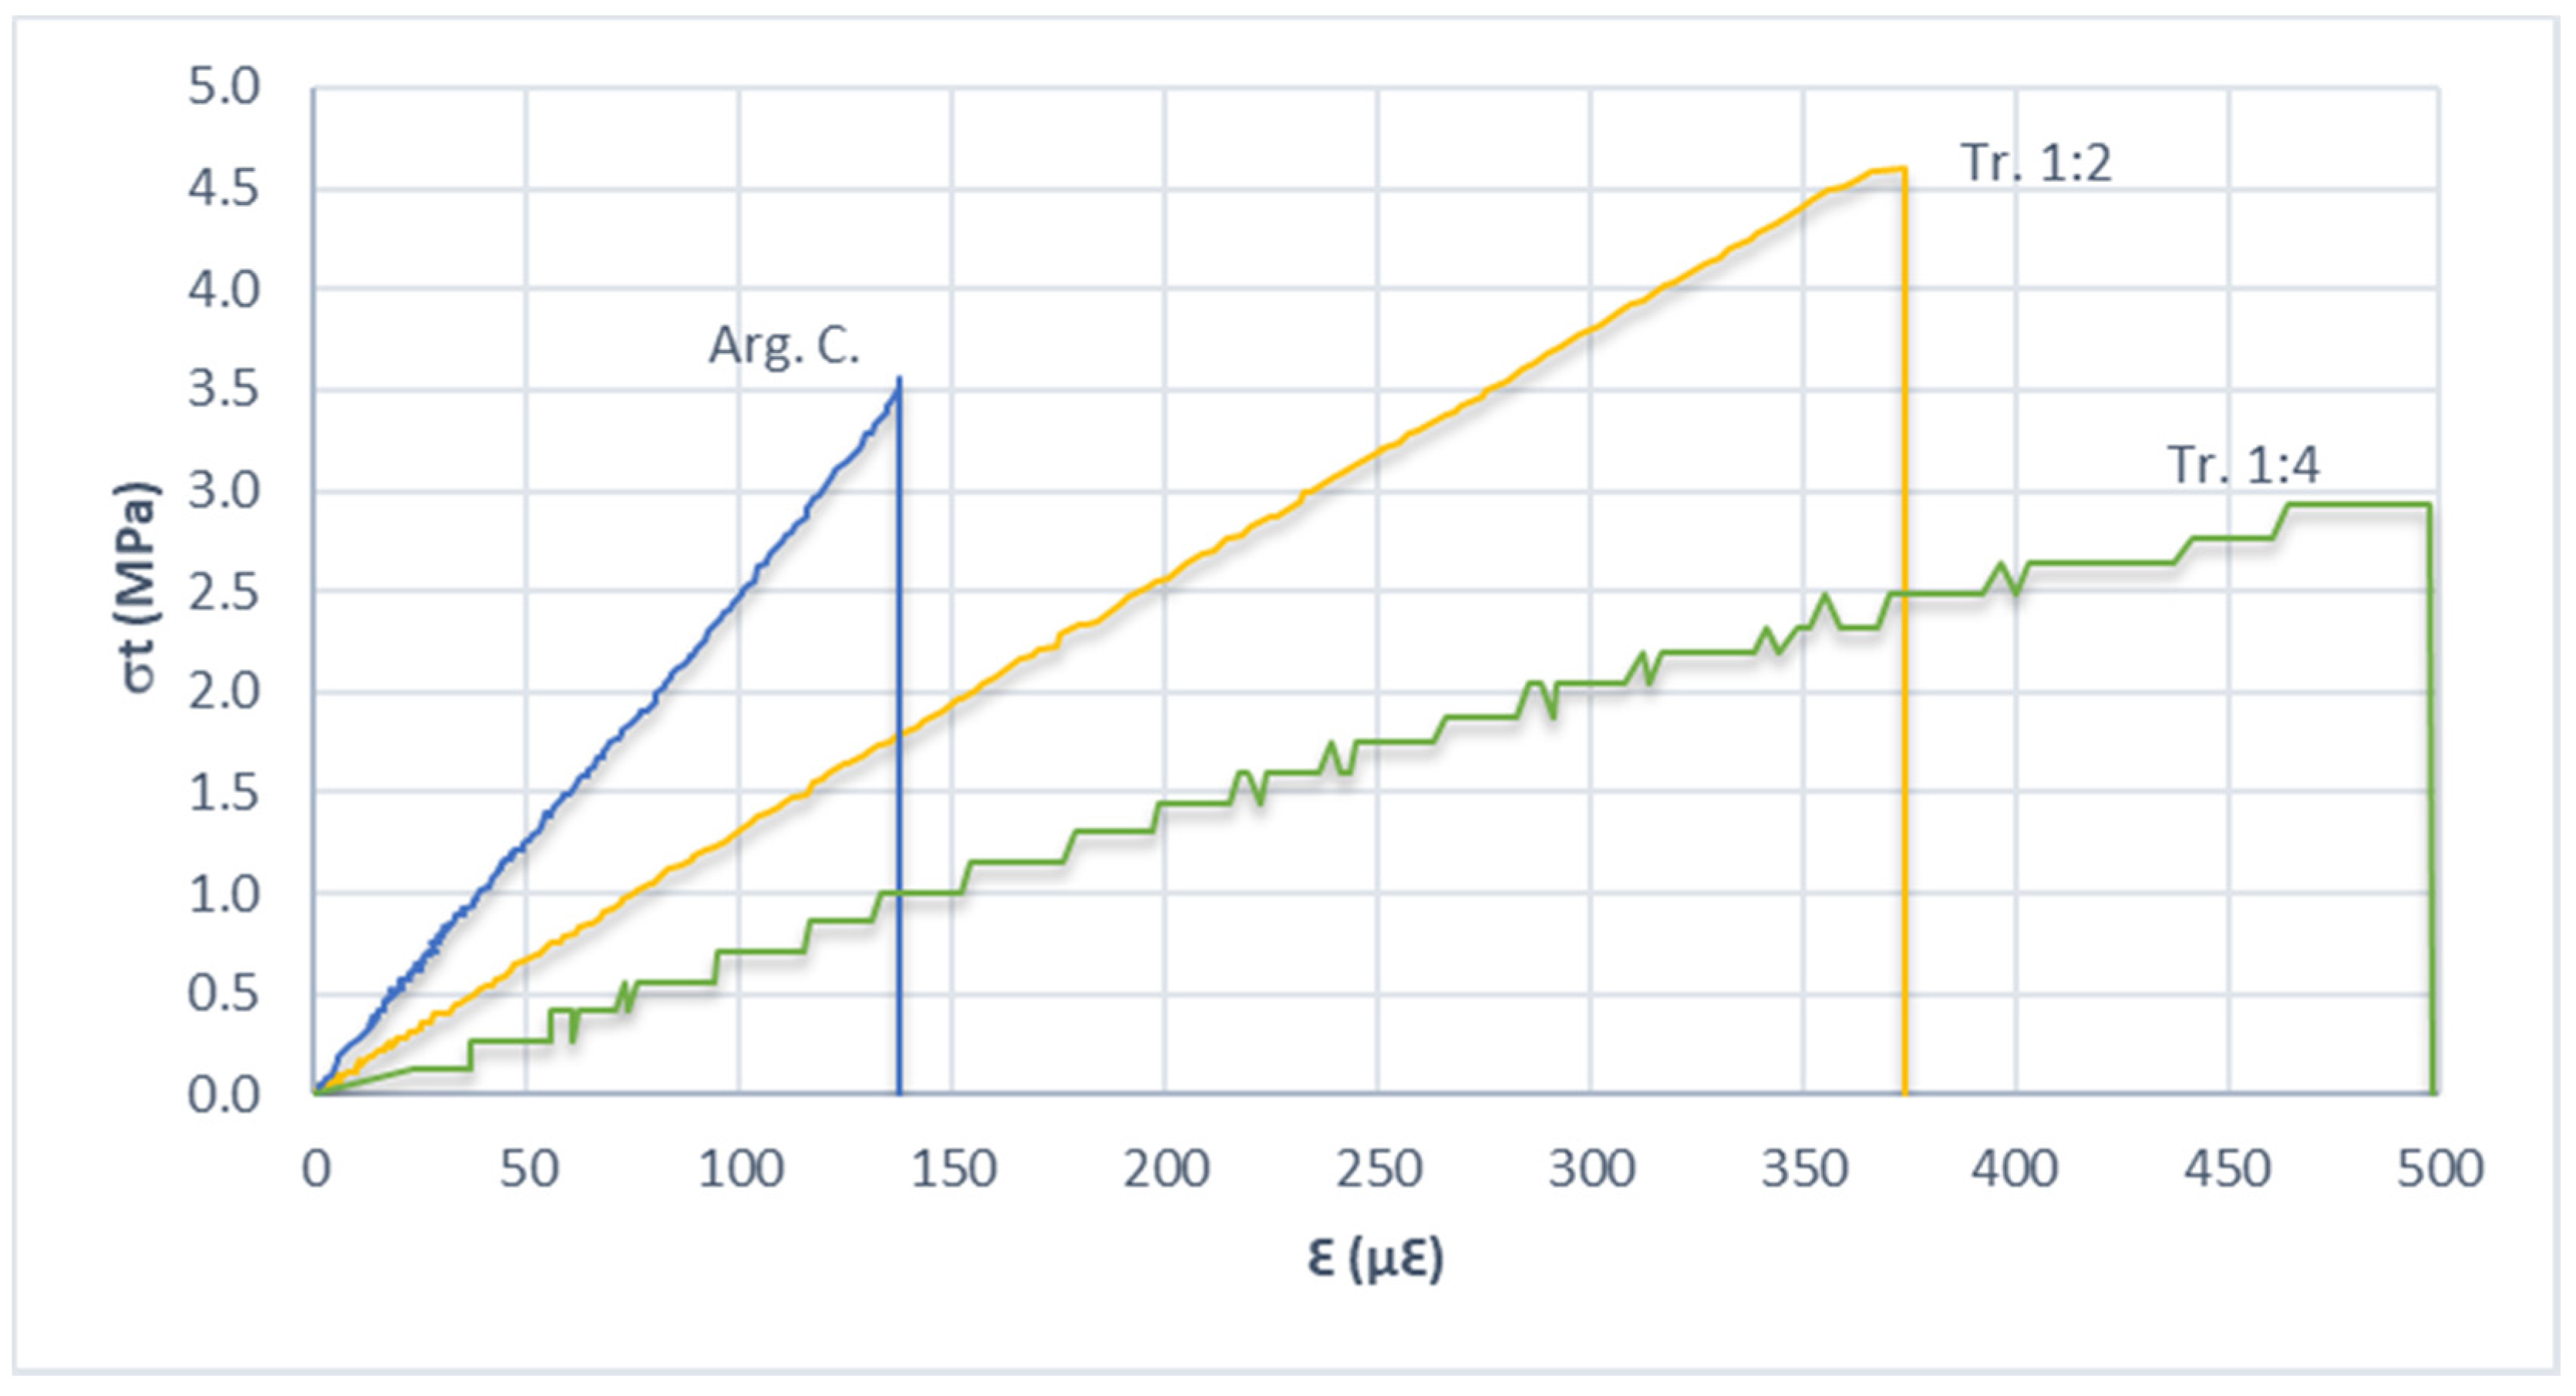
As mentioned before, some specimens were instrumented with strain gauges, leading to readings of, not just the load at failure but also the overall evolution of the tensile strain with loading. Therefore, it is possible to plot diagrams with strain (ε) versus tensile bending stress (σ) for each instrumented specimen. In this situation, the QSMOE corresponds to the tangent of the ε-σ curve.
Figure 5 shows three stress–strain diagrams corresponding to 2 Type B mixes and to the OPC mortar. It can be seen that the behavior is essentially linear up to the maximum load, which was taken as the failure load. Failure can be classified as a brittle failure.
3.4. Compressive Strength
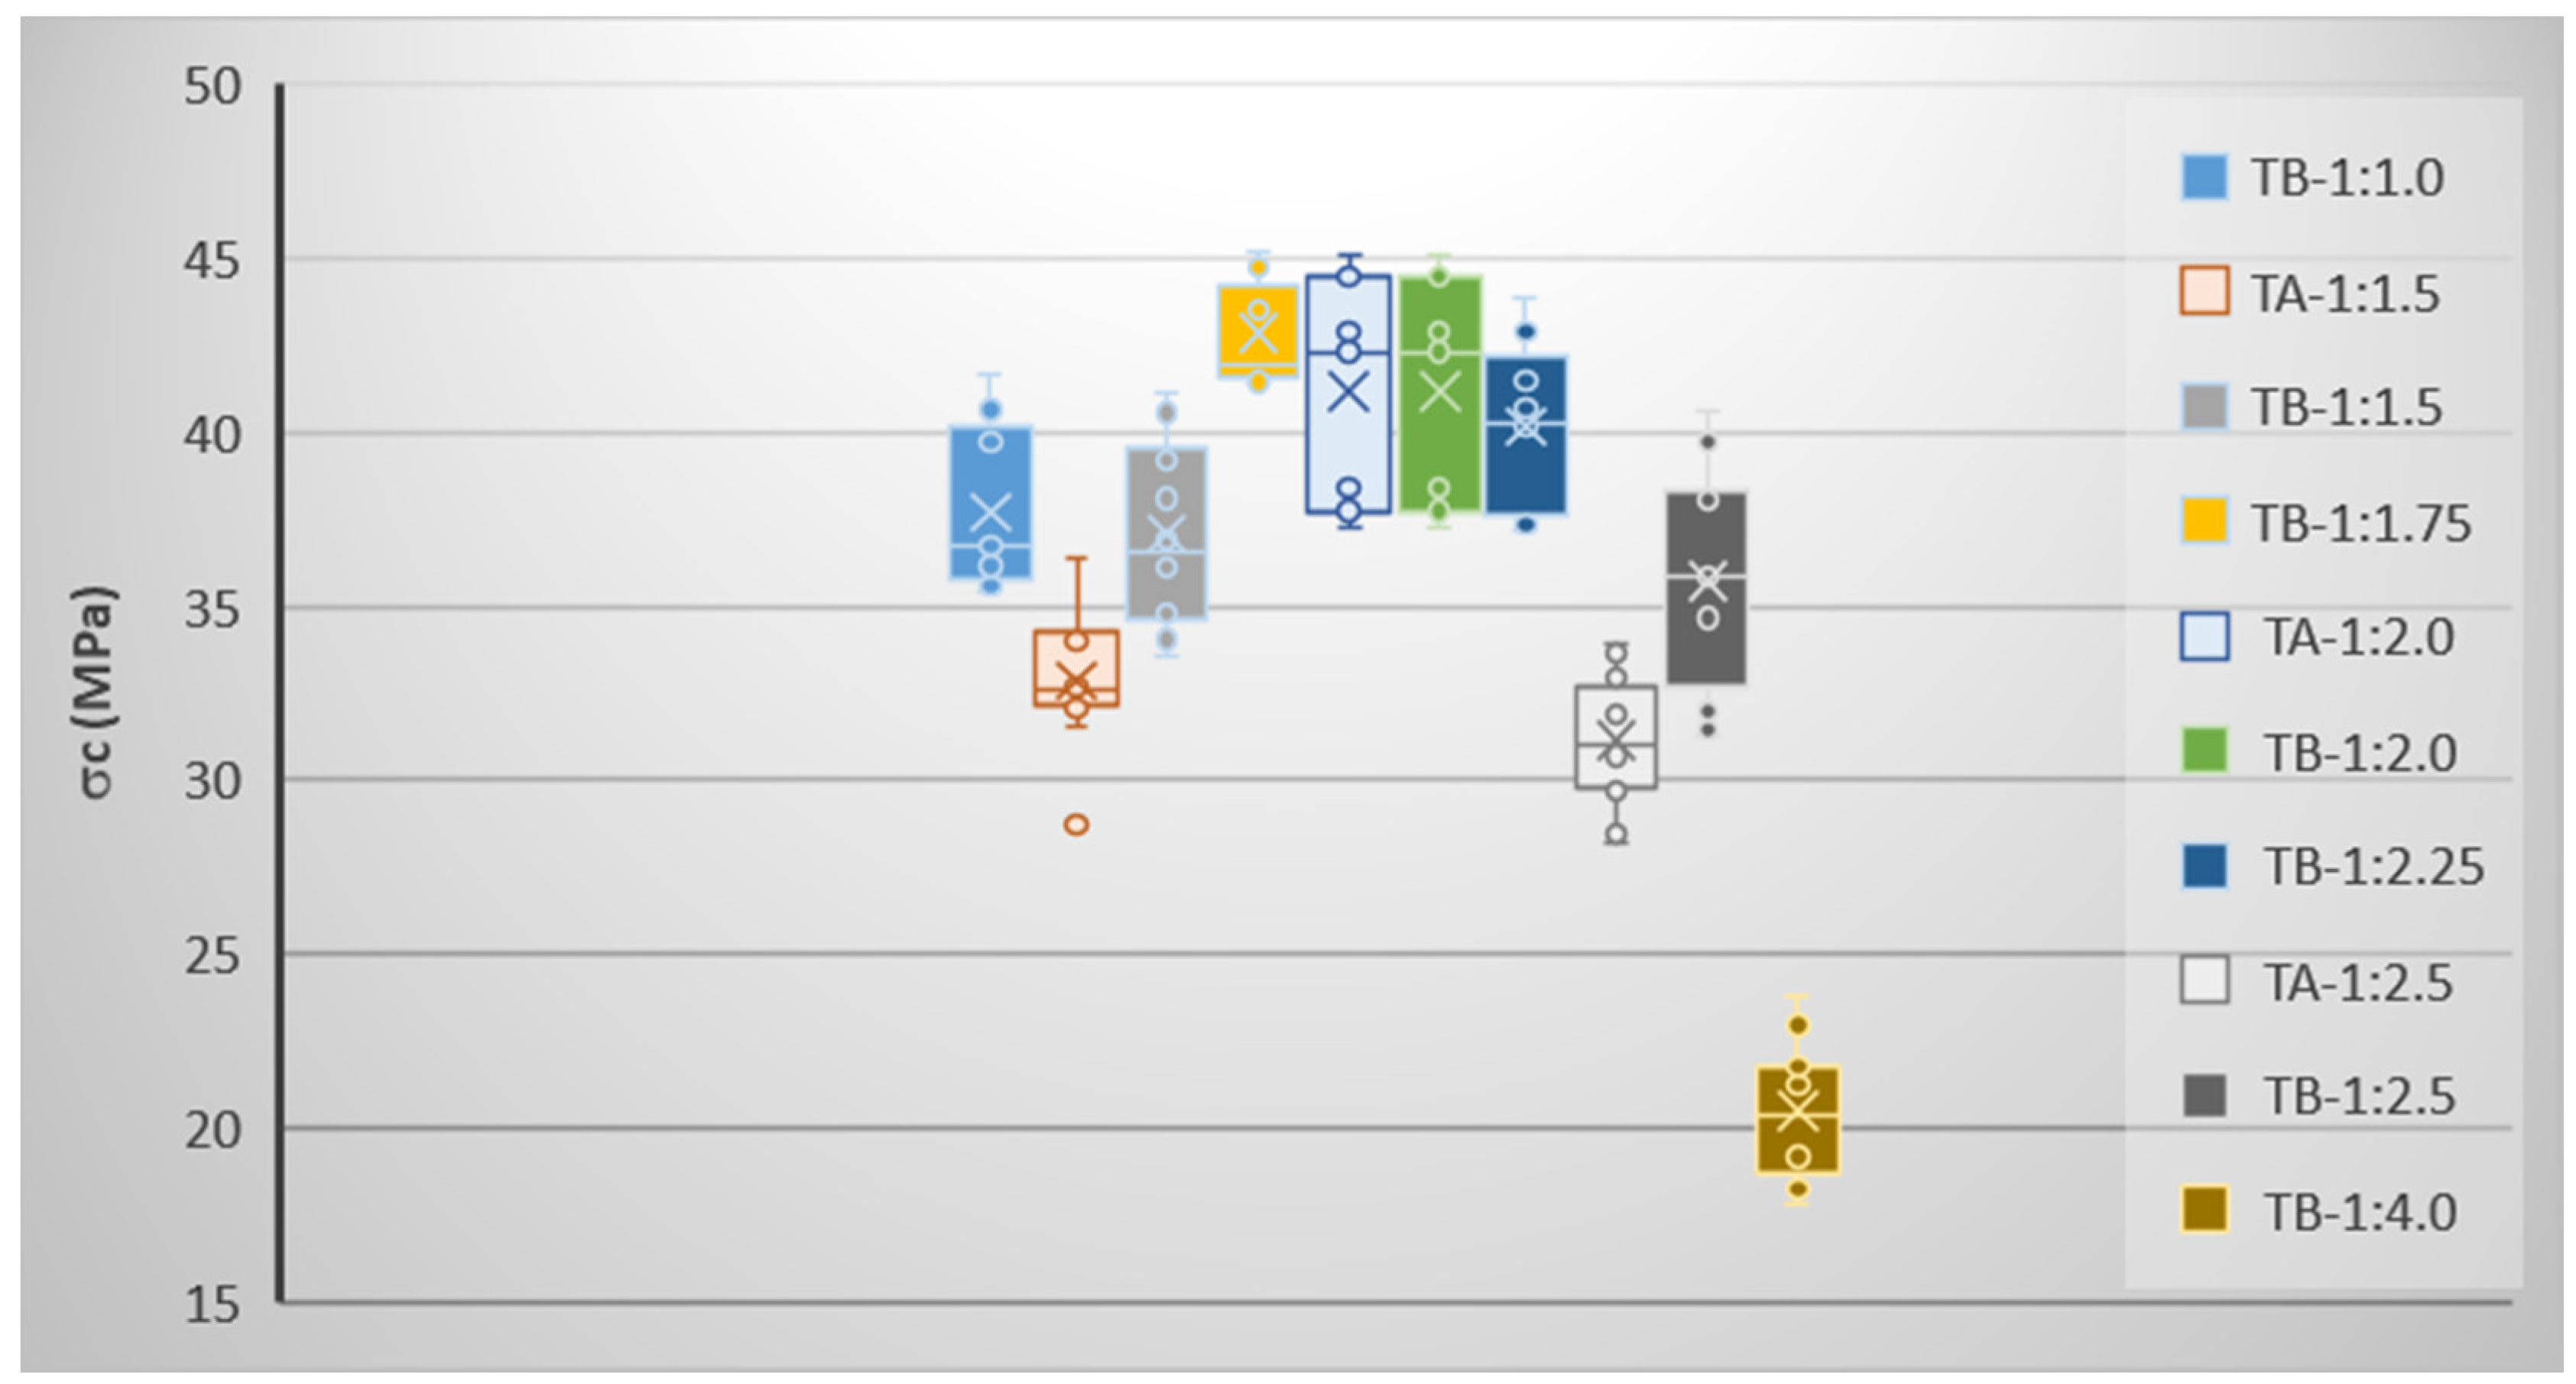
Figure 6 shows the statistical compressive strength, σc, for the 9 different activator compositions. As can be seen, for Type A mixes the highest compressive strength is that of the Base Mix (1:2). As for the other mechanical characteristics, the excess of liquid might be the reason for the reduction of the compressive strength for 1:1.5 and 1:2.5. This was an important reason that leads to the change of composition of the following mixes, Type B mixes, which were obtained by maintaining constant the activator weight.
For Type B mixes, the highest strength corresponds to 1:1.75 (42.8 MPa) and the lowest to 1:4 (20.5 MPa). Because the composition had small amounts of sodium hydroxide, and therefore low ability to dissolve the constituent materials, the compressive strength would be low. The standard deviation for Type B mixes was always less than 3.1 MPa, which can be considered a good value.
For OPC mortars the compressive strength measured for 28 days of curing was 21.7 MPa and for 60 days was 23.5 MPa, which corresponds to an 8% increase in strength, as would be expected. From the results, OPC mortar presents lower compression strength when compared to the geopolymers. For the OPC mortars, the maximum standard deviation was 2.6 MPa.
In order to validate the methodology described in EN 196-1 [
33] for the calculation of the tensile bending strength and of the compression strength through 4 × 4 × 16 cm OPC mortar specimens, some compressive tests were also performed on 15 cm-wide cube specimens. Such cubes were loaded up to failure, following EN 12390-3 [
35]. An average value of 24.1 MPa was obtained for the strength of 28 d old cubes (this value was 11.1% higher than that of small specimens), and therefore was not very different.
4. Comparisons of Results
One of the objectives of this study was to find the most efficient composition for the activator, but the results does not give any clear conclusion on this. Nevertheless, it seems that the Base Mix, 1:2 is a good solution, and compositions between 1:1.5 and 1:2.5 are equally acceptable in practical terms. When compared to Type A mixes, the great majority of the specimens of Type B mixes present better results for all the mechanical properties that were studied. For both compression and tensile strength the worst results correspond to 1:4, and the best performance appears to be between the ratios 1:1.75 and 1:2.
It is known that sodium hydroxide (NaOH) is responsible for breaking down the internal connections of the binder at the beginning of the process. Afterwards, sodium silicate (Na
2SiO
3) activates the necessary connections between the binder and the aggregates. Therefore, for a certain amount of metakaolin, an optimal balance between the quantities of NaOH and of Na
2SiO
3 would be expected for the best performance of the geopolymer. To find out this optimal balance, each of the activators were separated and some graphs for the individual influence of each one of the activators were plotted for the tensile and the compressive strength. As a consequence, 4 graphs were produced (
Figure 7,
Figure 8,
Figure 9 and
Figure 10).
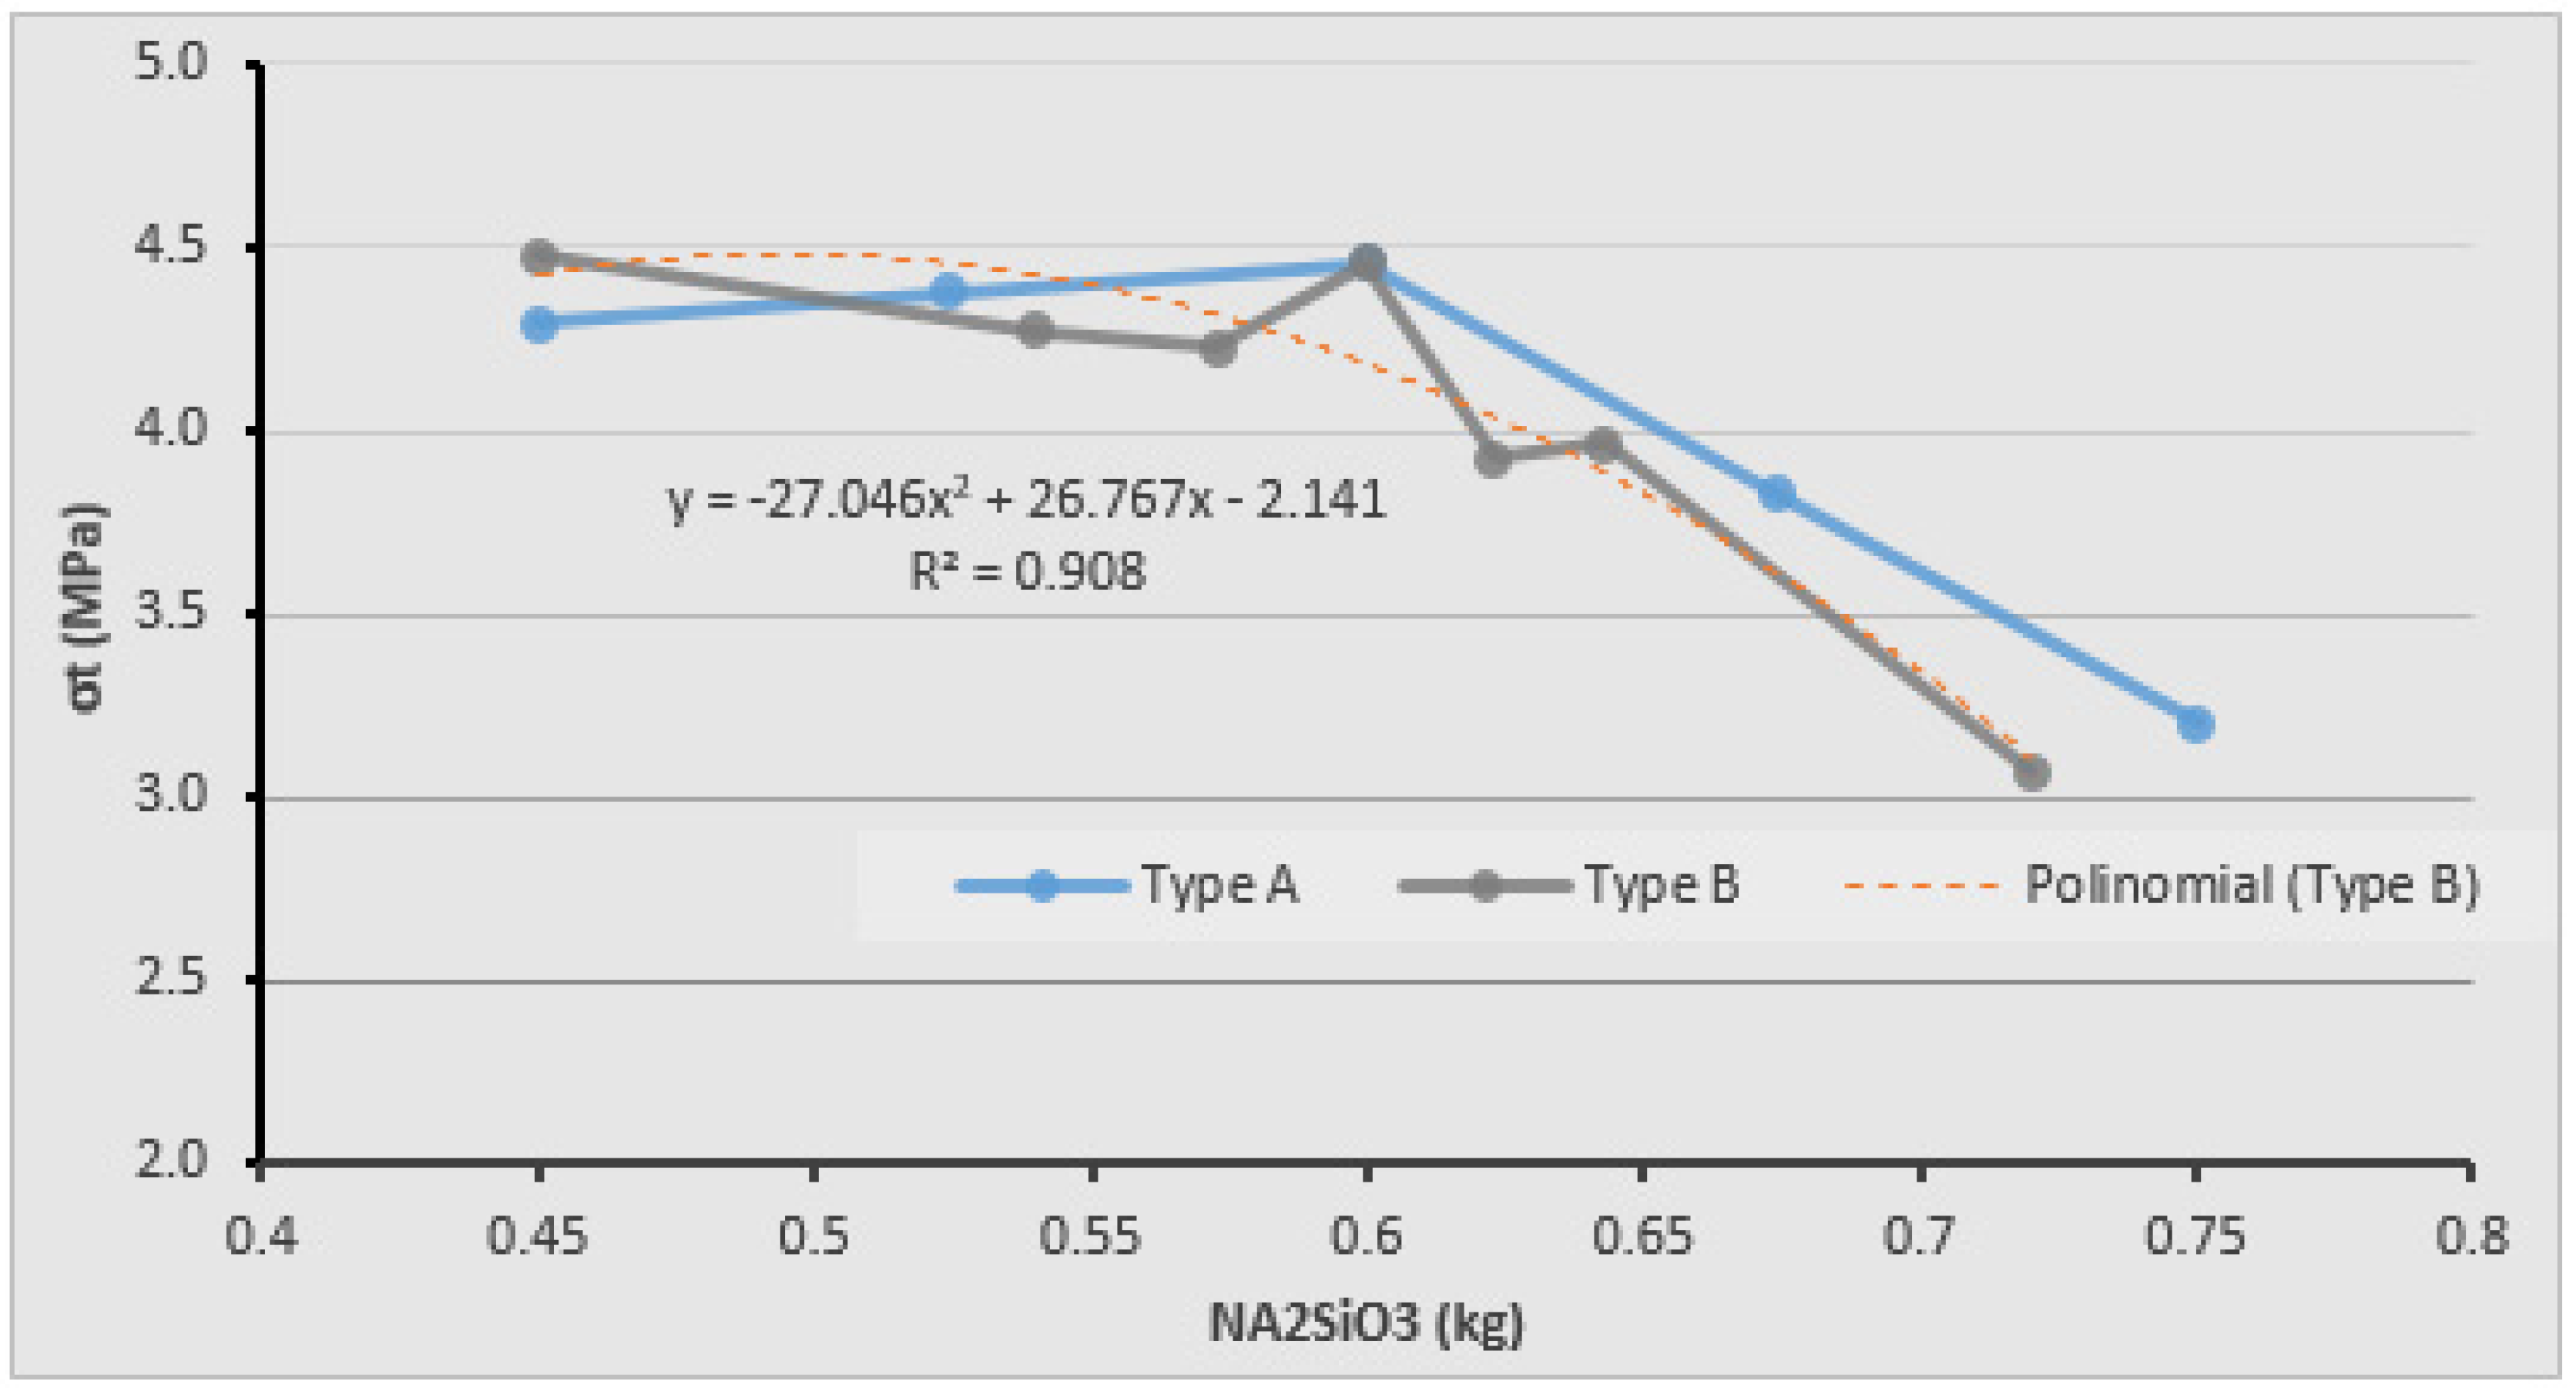
Figure 7 and
Figure 8 show the evolution of the tensile strength σ
t, with the amount of NaOH and Na
2SiO
3, respectively.
For
Figure 7, the first value corresponds to composition 1:4, whereas the last one corresponds to 1:1. In this analysis, Type B mixes were the only ones considered for the trend line, since Type A mixes had different amounts of activator and, therefore, comparisons should be too complex. This figure might suggest two different possible trends: the linear increase of σ
t with the amount of NaOH (the black trend line correspond to this possibility); or an increase of σ
t up to 300 g of NaOH (corresponding to 1:2) and a constant value thereafter (this trend line is not presented in the figure). This latter possibility is not as simple as the first, but seems to fit better the points of the graph.
In
Figure 8 the influence of this activator seems to have a different trend when compared with
Figure 7. This is understandable because the sum of correspondent values of both figures gives the same constant value, the amount of activator (900 g). However, in Fig. 8 the values for Type A mixes are reasonably close to those of Type B mixes. Quantities of sodium silicate between 450 and 600 g seem to lead to values of σ
t that are approximately the same.
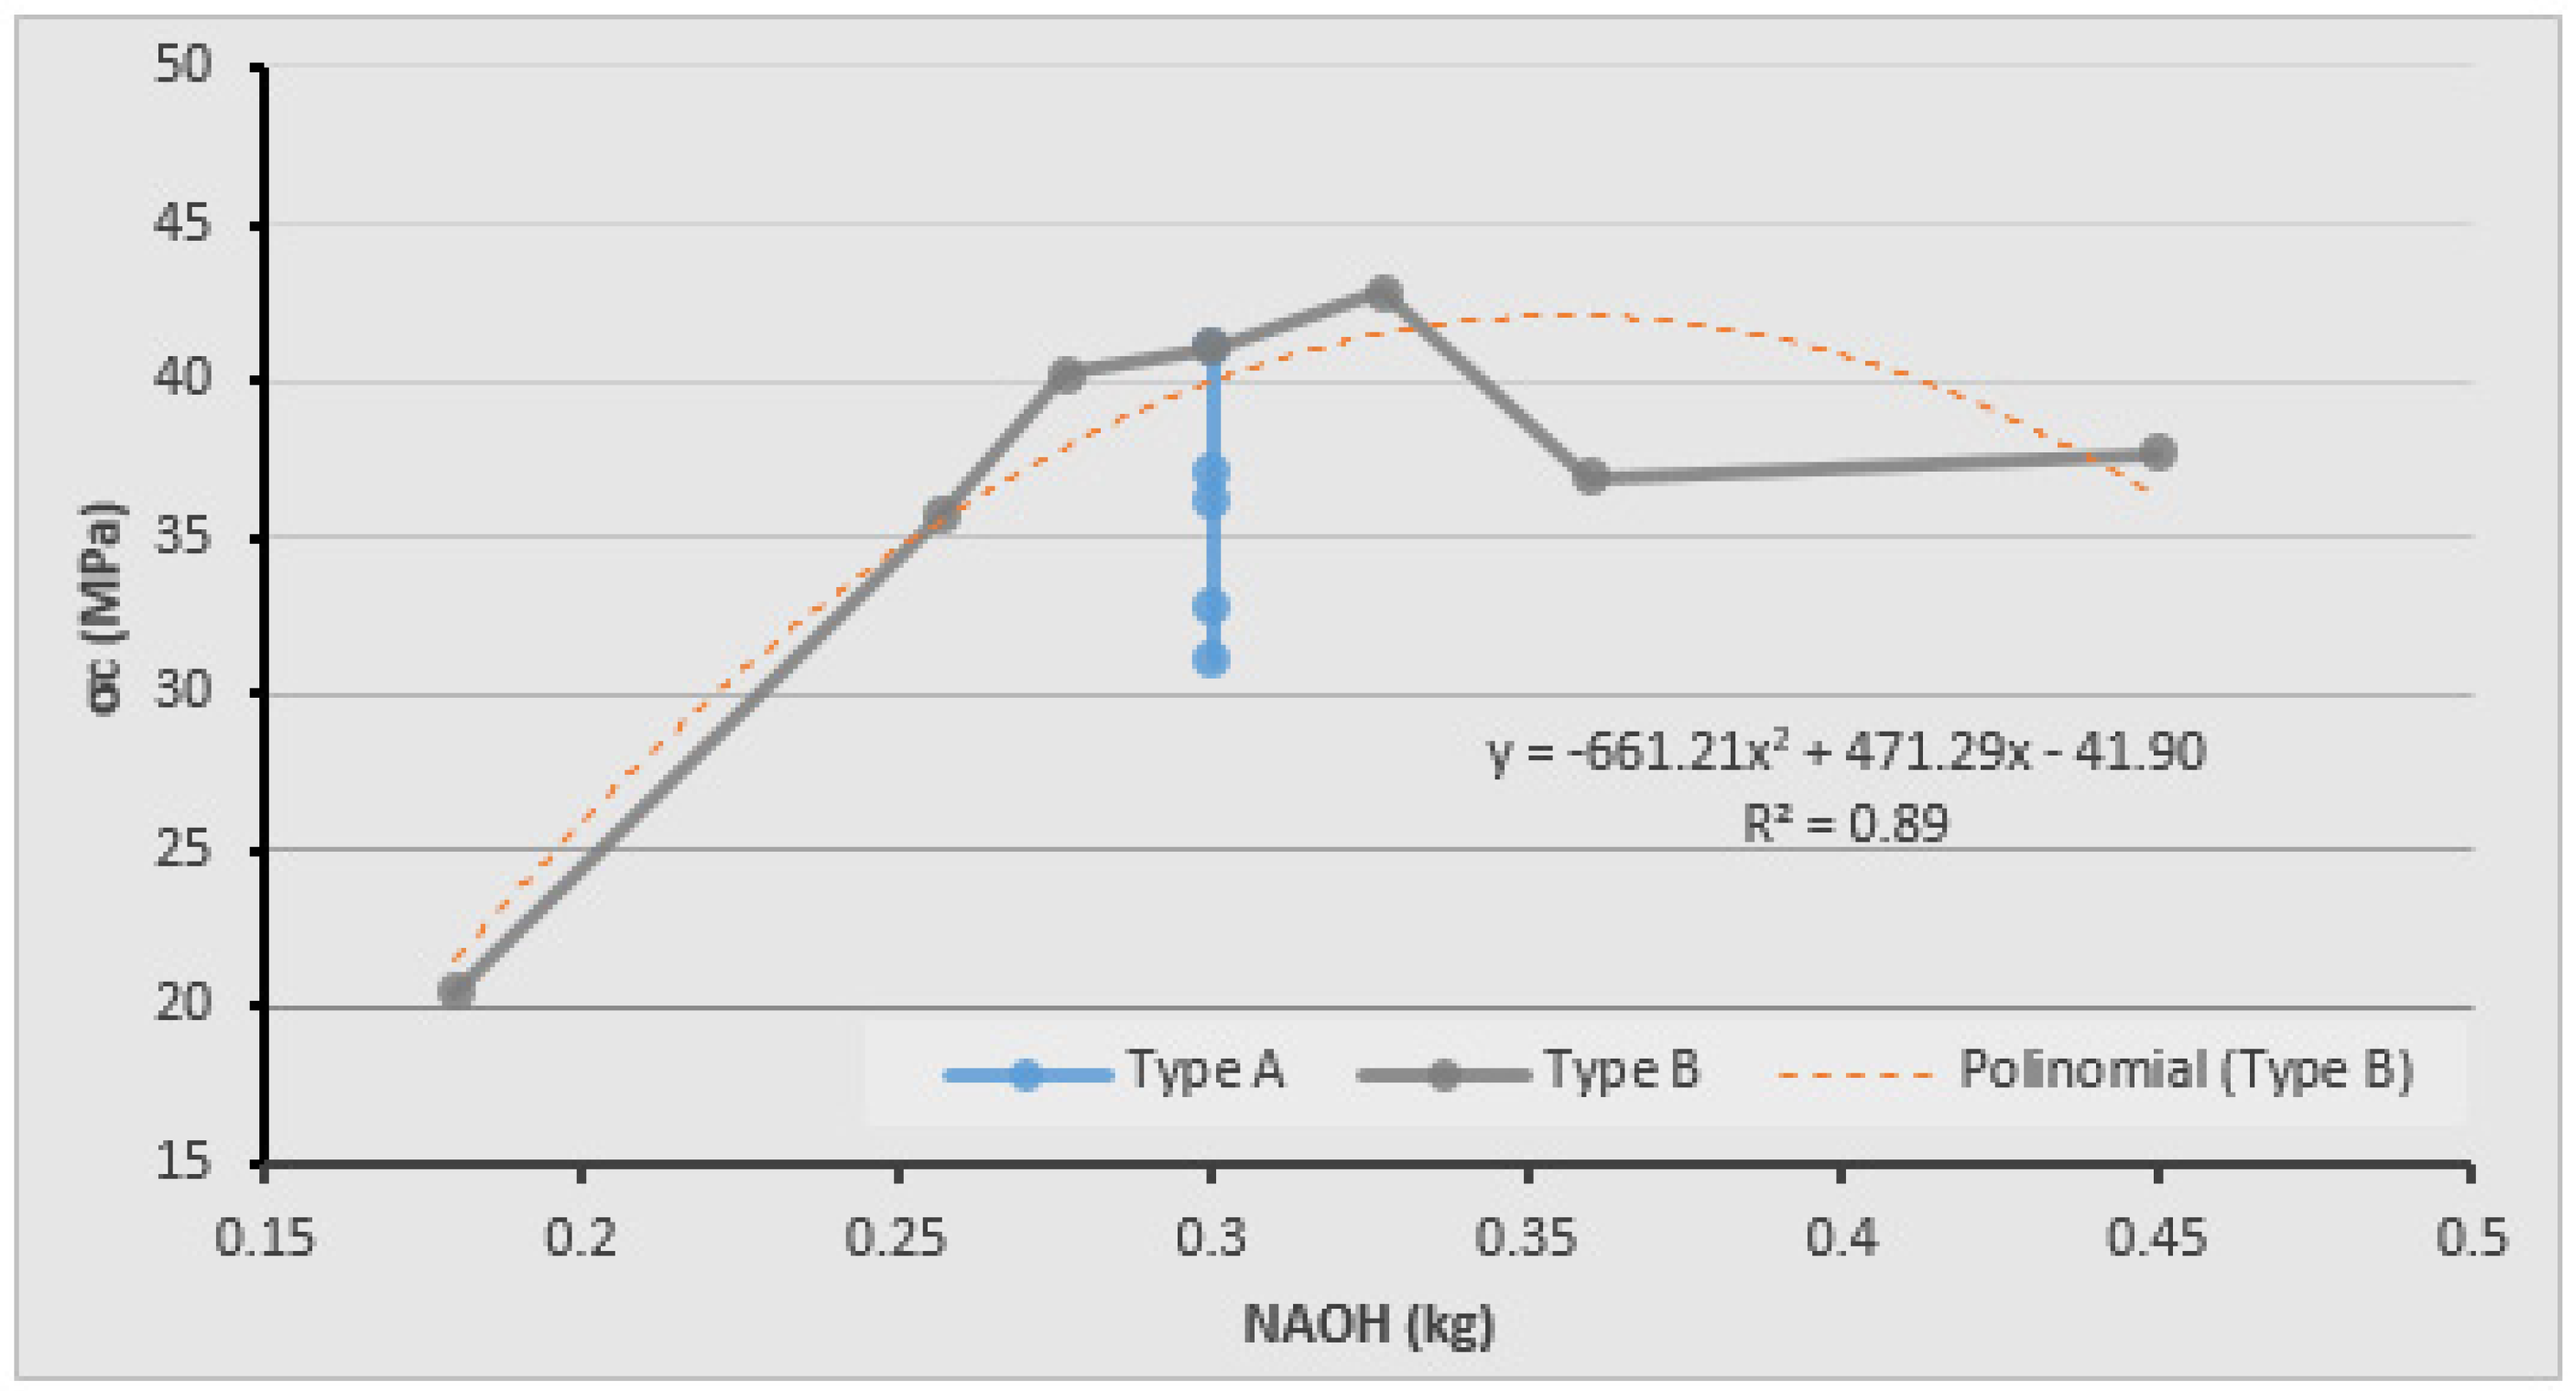
Figure 9 and
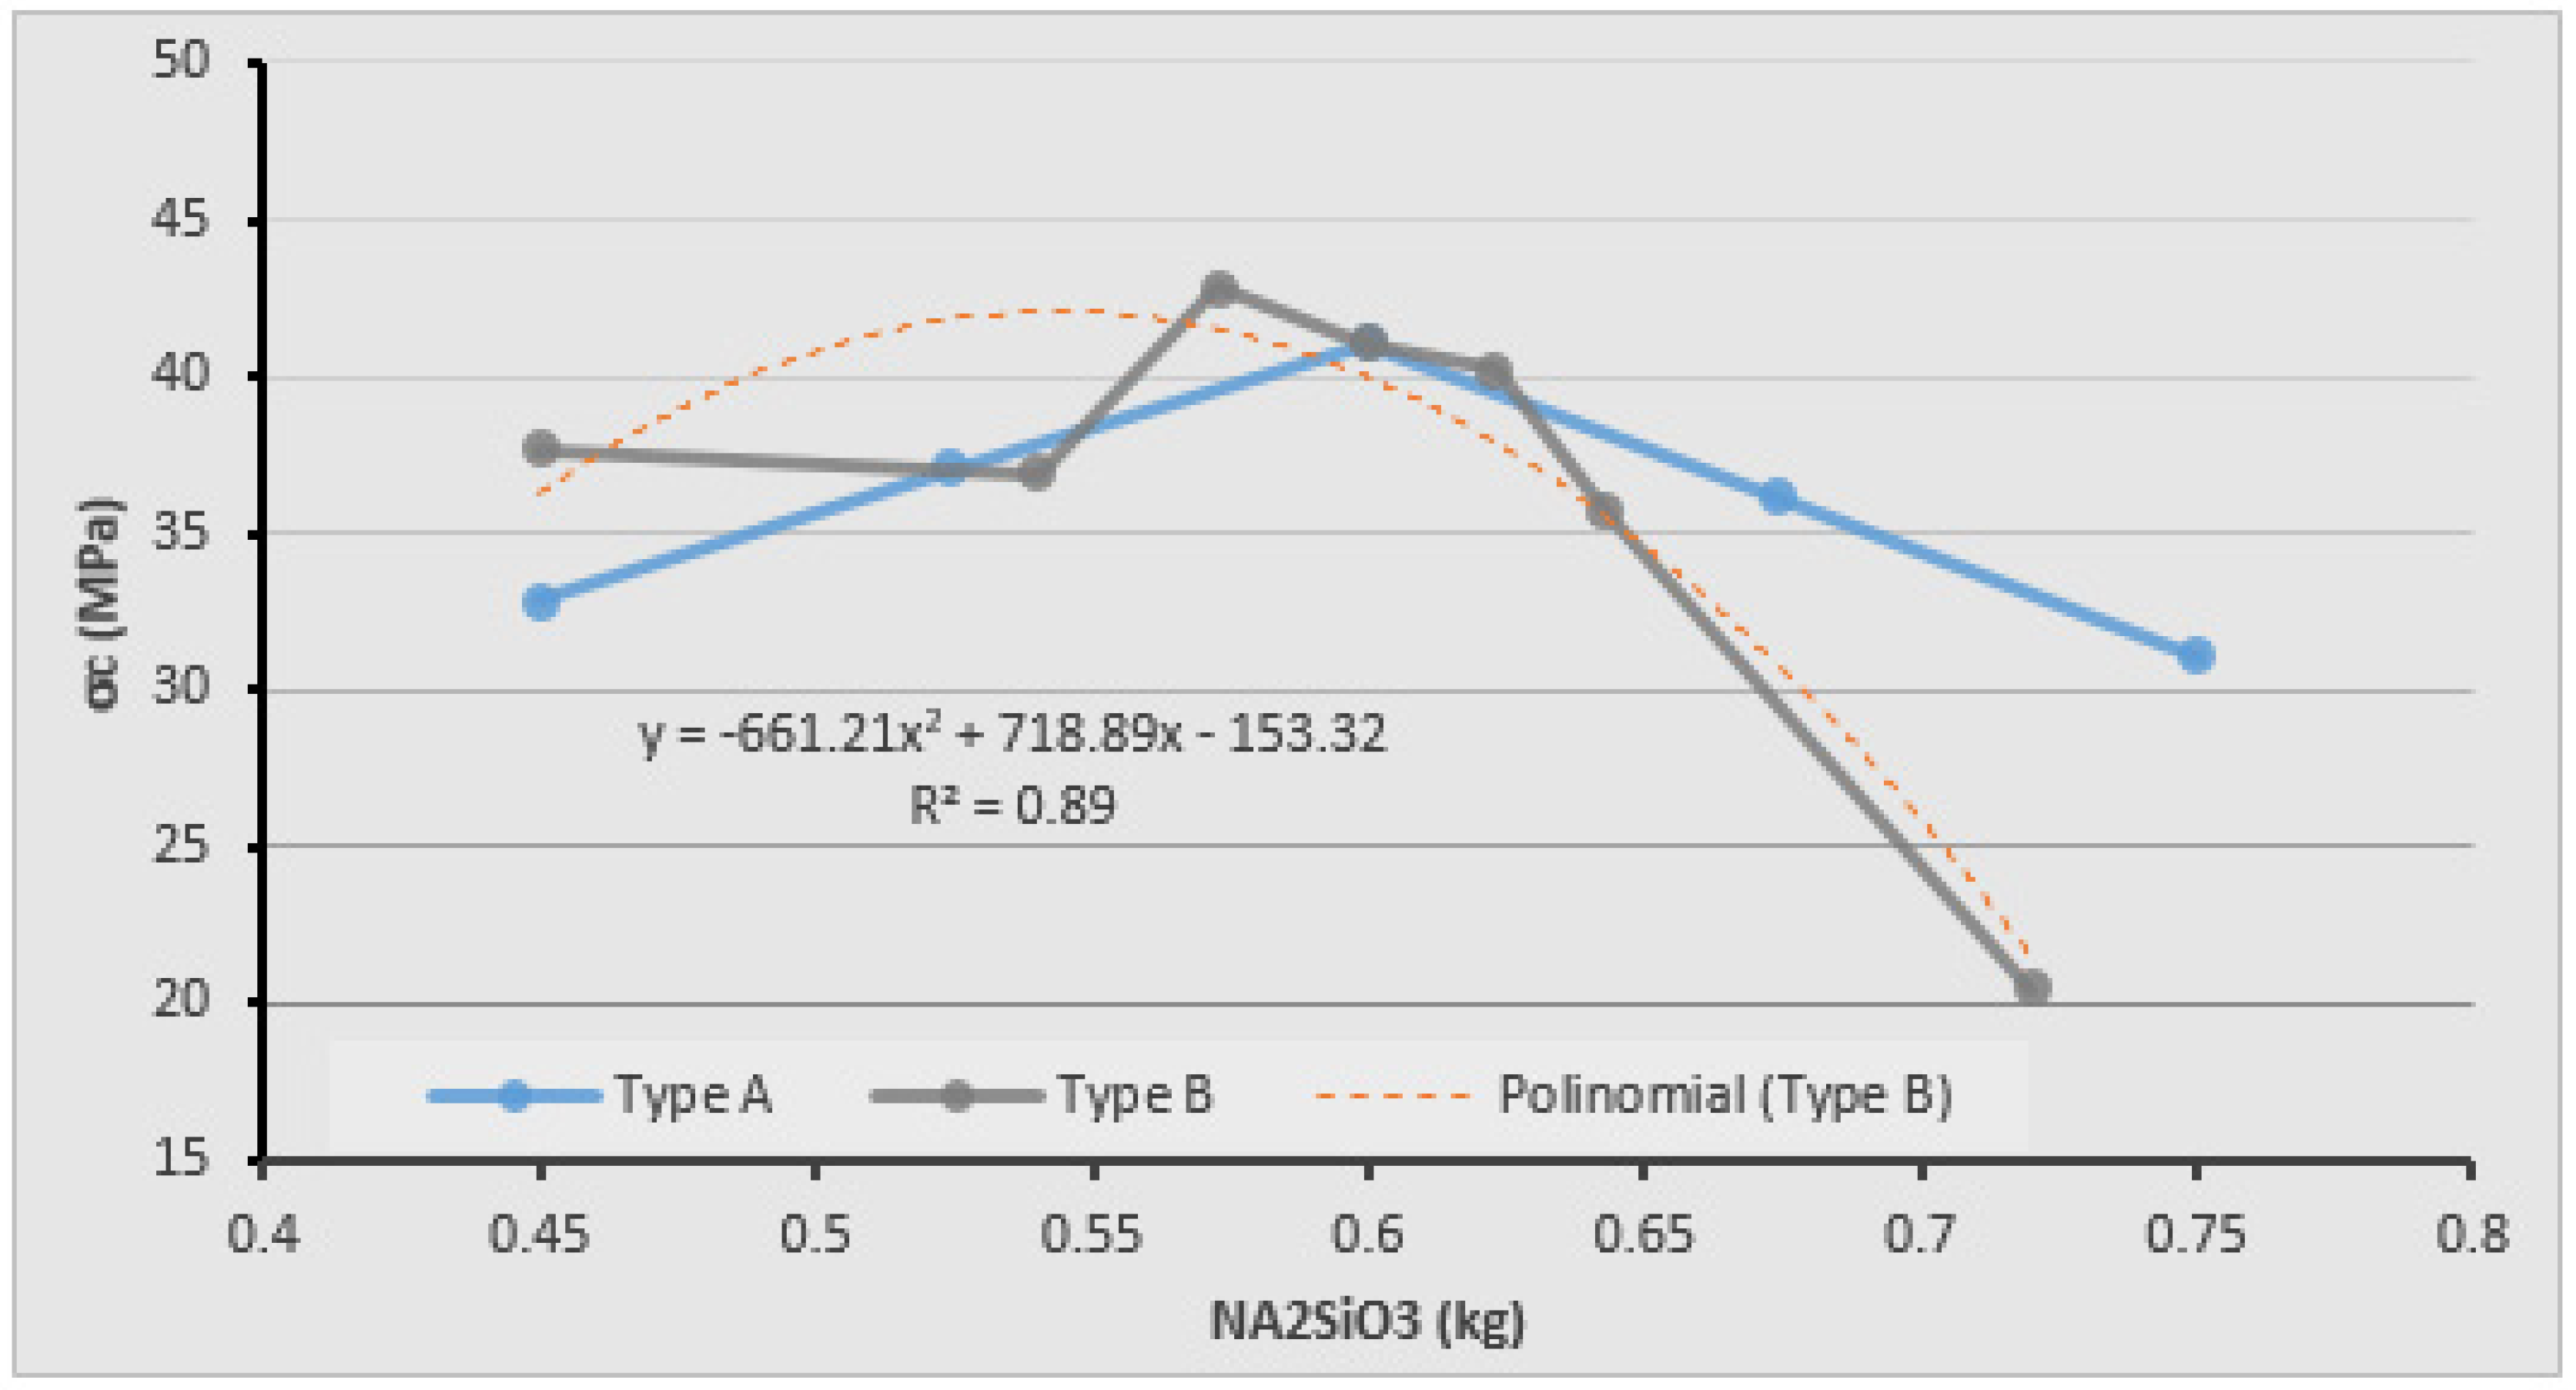
Figure 10 show the variation of the compressive strength, σ
c, with the amount of NaOH and Na
2SiO
3, respectively. For this type of strength, and by combining both figures, it can be concluded that 390 g of NaOH and 514 g of Na
2SiO
3 would be the optimal combination.
Finally, the results seem to show that combination 1:2 (Base Mix) is the most adequate to obtain a material with good properties for structure applications. However, the activator composition of 300 g of NaOH, 450 g of Na2SiO3 and 150 g of water is more economic than the Base Mix and does not seem to lead to mechanical characteristics of inferior quality.
5. Conclusions
The main objective of this work was to evaluate the variation of the mechanical properties, mainly the tensile and compressive strengths with the variation of the composition of geopolymers. Different activator compositions were tried in order to conclude about the consequences in terms of mechanical properties and the possibility of using these materials in structural members and ultimately in the construction industry.
The values obtained for the tensile and compressive strength of geopolymers are good in comparison with those of OPC mortar. Some changes in the composition proved not to affect the mechanical properties significantly. This is a good indication because it shows that there is room for some adaptation of the composition when some practical problems need to be solved. One of the most important issues is the workability of the fluid mass before pouring into the molds. OPC mortars or concretes are well developed in this aspect and nowadays self-compacting concretes are easily produced, even at large scale [
38,
39]. Geopolymers still need more research on this aspect.
The values of the tensile strain and of the modulus of elasticity indicate that the geopolymers are more deformable than OPC mortars. This has some advantages and some drawbacks. For instance, differential soil settlements will have less impact on the internal forces of a geopolymer structure when compared to the impact of similar settlements in an OPC concrete structure. On the other hand, higher deformability of geopolymer structures when compared to that of OPC concrete structures could be a problem when maximum deformations are imposed by design standards. This could lead to thicker cross sections, therefore, with impact on the price. It should be noted that the higher deformability at the elastic phase of the mechanical behaviour of geopolymers could be somehow counterbalanced by their higher tensile strength. Therefore, many particularities of the structural behaviour of geopolymers need to be investigated in the near future. For instance, the bond of reinforcement to geopolymer might be different (possibly higher) when compared to OPC structures. This would lead to shorter anchorage lengths, for instance. The bond between geopolymers and OPC should also require special attention from researchers since rehabilitation works of old OPC structures are in increasing demand.
Focusing on the particular results of this investigation, for mixes with a constant amount of activator, the highest efficiency of the geopolymers appears to take place for ratios (hydroxide: silicate) between 1:1.75 and 1:2. Geopolymers within this ratio range are shown to have the best strength capacities, either on tensile or compression and also better results in terms of modulus of elasticity (better results here means results closer to those of OPC mortars). Furthermore, if the composition of the activator falls within this range, it does not affect significantly any of the mechanical characteristics.
Finally, this article describes an exploratory work on the study of mechanical characteristics of geopolymers and the authors believe that the findings could help other researchers in defining new lines of research. Future work should take different directions suggested earlier. Given some interesting advantages, the authors argue that this material deserves to be further investigated.
