1. Introduction
Variation is an unavoidable element in mass-production. If not handled properly, variation can cause problems and significantly increase costs. Variation management is a broad term, relating to different methods to handle, and reduce the effects of, variation. In this paper, the focus is on geometrical variation. Problems related to geometrical variation usually constitute a significant part of the total cost for poor quality, sometimes up to 40% of the total cost for a manufacturing company in the form of delays, scrap, repair, rework, unsatisfied customers, and warranties [
1,
2].
Methods to reduce the effects of geometrical variation are sometimes referred to as geometry assurance. Additionally, terms such as tolerance analysis and tolerance management are used. Geometry assurance activities can be executed in different phases of the product realization cycle and cover areas such as the design of locating schemes/fixture layout, variation simulation, tolerance analysis, and inspection.
The digital revolution is expected to have a huge impact on the manufacturing industry in the coming years. Industry 4.0, increased digitalization, and access to an increased amount of data also open up for new methods and tools for geometry assurance, such as real-time process optimization using digital twins [
3].
This paper aims at, from a standpoint in the current and future research areas and industrial needs, to identify the challenges, mainly in terms of processes and data flows, that need to be in place to fully capitalize on the possibilities offered by digital twins for zero-defect manufacturing.
A survey was distributed to experts in variation and tolerance management in academia and industry to identify the gap between research areas and needs, today and in the future. Not very surprisingly, this survey pointed out an increased demand for digital twins for improved geometrical quality. A deeper analysis using on-site interviews with over 40 geometry engineers from eight Swedish and Danish companies within the manufacturing sector was then conducted. The purpose of this more detailed study was to increase the understanding of the industrial needs and challenges related to the implementation of digital twins. Those results are the main contribution of the paper.
In the remaining part of the introduction, the basics of geometry assurance are described.
1.1. Geometry Assurance
Geometry assurance is a term describing a set of activities, all aiming to improve the geometrical quality of an assembled product. The geometrical quality affects both the esthetical and functional requirements of the final product. Usually, the maximum geometrical variation allowed in a certain dimension on the product is specified with a tolerance.
The geometry assurance activities start in the early design phases of the product realization process with tasks such as locating scheme optimization to secure a robust positioning system during the joining of parts and variation simulations to predict the variation in the critical dimensions of the final assembly. Inputs to the variation simulation are part geometries, information about joining and fixturing and inspection data, or suggested tolerances on the part level. The analysis is done iteratively to find a reasonable set of part tolerances, i.e., finding limits for maximum allowed variations on the part level at an acceptable cost. The simulation is sometimes based on the assumption that parts are rigid [
4], and sometimes, the flexibility of, for example, sheet metal parts is included [
5,
6]. The latter one usually improves the simulation accuracy [
5] and makes it possible to include clamping and joining forces, different material characteristics, joining processes, etc.
The variation simulation can be done in a standalone CAT (computer-aided tolerancing) software, such as RD&T [
7], or integrated into the CAD system, as, for example, 3DCS [
8]. Both setups are widely used industrially and have their pros and cons.
1.2. Scope of the Paper
This paper focuses on pinpointing future research and industrial needs within the area of variation management and geometry assurance. Digital twins are identified as an important area, and challenges, limitations, and requirements related to the implementation of digital twins for geometry assurance in the industry are identified and discussed.
In
Section 2, the survey aiming to identify gaps between current and future research areas and needs is presented. Digital twins for geometry assurance are discussed in
Section 3, and the interview setup and methods are described in
Section 4. The findings are presented in
Section 5, and challenges related to the implementation of a digital twin in an industrial context are highlighted in
Section 6. This is followed by discussions and conclusions in
Section 7 and
Section 8, respectively.
2. Materials and Methods
As a starting point for this work, a questionnaire was distributed among experienced researchers and engineers in the areas of tolerance analysis and geometry assurance. The purpose was to identify what research topics are perceived as most important today and in the future and, also, what the industrial status and needs are today and in the future.
2.1. Questions
A number of questions considering background variables were posed. Those questions gathered information about age, gender, years of experience in tolerance analysis, affiliation (industry or academia), and what continent the respondent lives on. This information, together with the answers to the four questions below, will be used for the analysis in this section:
Describe the area of tolerancing research of today by choosing a maximum of 4 keywords from below.
Describe the area of tolerancing in the industry of today by choosing a maximum of 4 keywords from below.
Describe important areas of future tolerancing research by choosing a maximum of 4 keywords from below.
Describe important areas of future industrial development by choosing a maximum of 4 keywords from below.
The keywords to choose between were the same for all four questions and can be seen below.
- a.
Tolerance specification - b.
Tolerance synthesis - c.
Tolerance analysis and evaluation - d.
Inspection and Metrology - e.
Simulation - f.
Digital twins - g.
Zero-defect manufacturing and self-compensation - h.
Digital thread (seamless digital flow of tolerance information)
| - i.
Tolerance management process - j.
New materials (composites, etc.) - k.
New manufacturing methods (AM, etc.) - l.
Perceived Quality - m.
Visualization - n.
Industry 4.0 - o.
Robust Design - p.
Education—basic level - q.
Education—lifelong learning - r.
Other:
|
2.2. Statistical Analysis and Method
This digital questionnaire was distributed among participants of the European Group of Research in Tolerancing (E-GRT) Biannual Seminar 2019 and other researchers and industrial engineers with an expertise in tolerance analysis and variation management. In total, 43 answers were collected. Information about the background variable responses can be seen in
Table 1. For age and years of experience in tolerancing, the respondents could choose between different alternatives presented in the form of intervals. The midpoints of the intervals were used in the calculation of the average values presented in
Table 1.
The answers to the questions posed above were analyzed with the purpose to see the participants’ opinions about current focus areas and future needs in research and the industry. To analyze the frequency differences among different answers, a Cochran Q test was employed. This statistical test is a nonparametric test for related categories with binary responses [
9]. The related categories are the questions (a)–(r). This test can determine if there is a significant difference between the categories. The test statistic, for binary responses
Yij,
i = 1, …,
n, and
j = 1, …,
k, is:
The variables are:
n: number of respondents, and
k: the number of questions.
The Q statistic follows approximately a -distribution with k − 1 degrees of freedom. This approximation is considered valid if n > 4 and/or nk > 24. Here, n = 43, and k = 18.
The Cochran
Q test is used to test whether there is a difference between any of the different categories. To point out what categories significantly differ from the other, a minimum required difference (MRD) test is used with Bonferroni adjustments to compensate for repeated tests [
9]. The MRD is calculated as:
where
is the value of (1 −
) in a standard normal distribution. The MRD is based on pairwise observations.
When comparing answers to the same question, with filtering based on the affiliation of the respondent, another test needs to be used. In this case, a standard
z-test with pooled variance will be used [
10]. This test compares the proportions,
pi and
pj, respectively, of positive answers to a certain question and test the hypothesis
for two groups,
i and
j.
2.3. Results
Using the Cochran Q test previously described, it can be shown that there are significant differences between the alternatives (a)–(q) for all four questions: (1)–(4). The p-values for each question are all below 10−7. For a deeper analysis of what categories (a)–(q) actually have a significant difference, the MRD is applied.
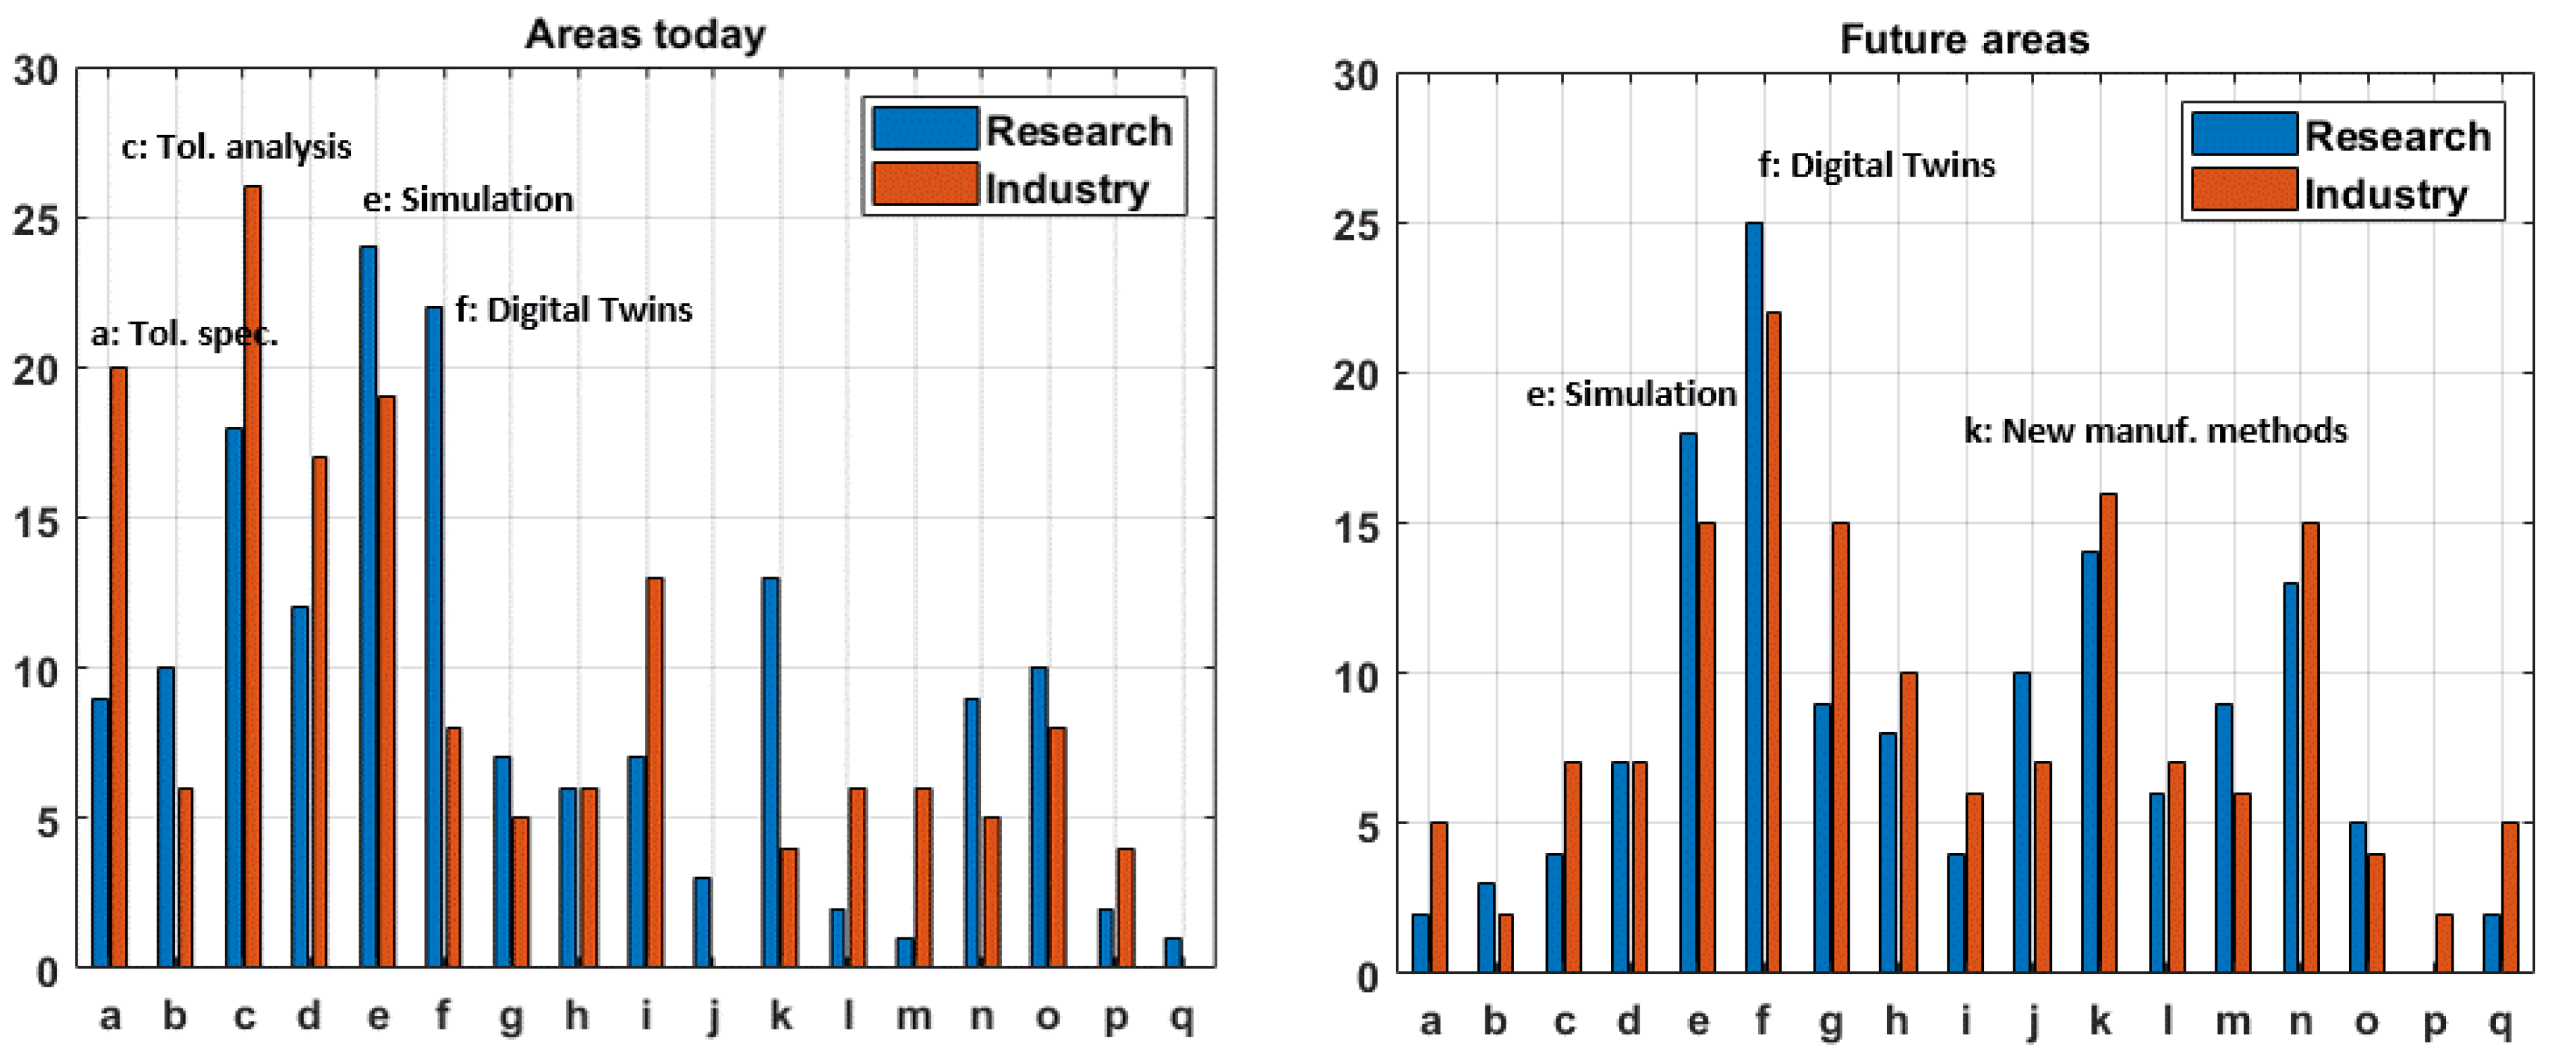
In
Figure 1, the results from the survey are shown. Some observations can be made.
In research today (left chart, blue bars), the most popular areas are simulation (e) and digital twins (f). For simulation (e), the MRD test shows that there is a significant difference (α = 0.05) to all other categories except (c) and (f).
In the industry today (left chart, red bars), the most popular areas are tolerance analysis and evaluation (c), followed by tolerance specification (a) and simulation (e). For (c), the MRD shows that there is a significant difference (α = 0.05) to all other categories.
For the future (right chart), digital twins (f) are considered highly important in both research and the industry. This is also true for simulation (e), new manufacturing methods (k), and Industry 4.0 (n). For research and digital twins (f)), the MRD shows that there is a significant difference (α = 0.05) to all other categories except (e). For the industry and (f), the MRD test shows that there is a significant difference (α = 0.05) to all other categories except (e), (g), (k), and (n).
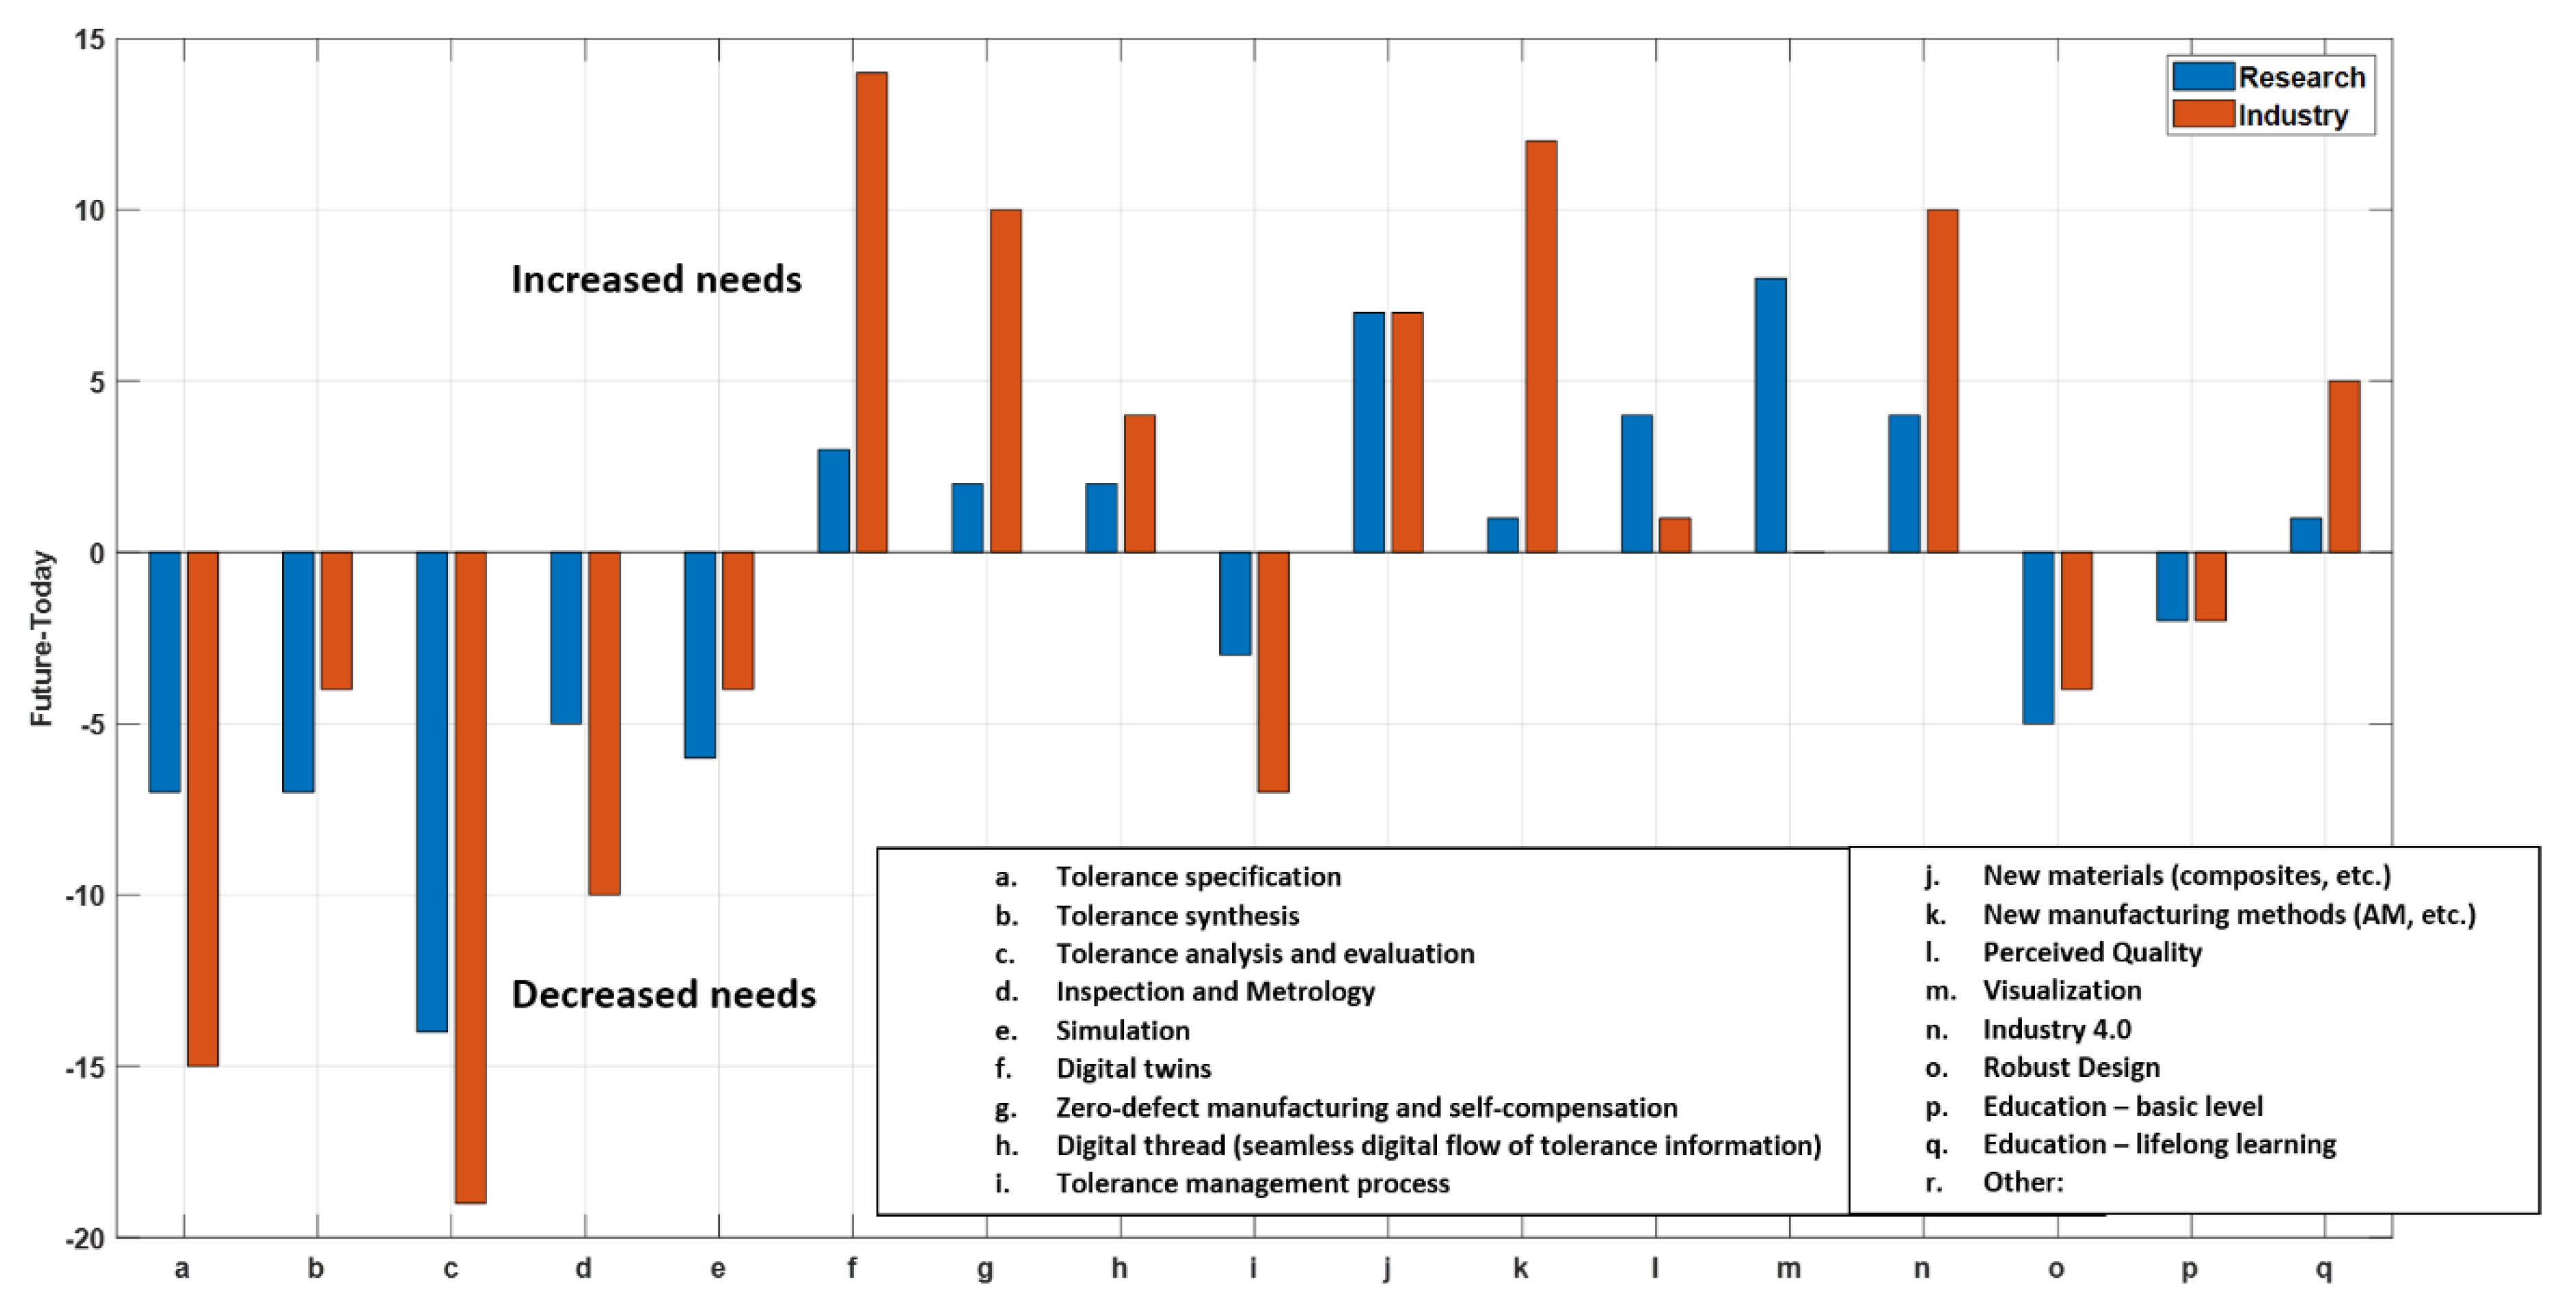
To see the differences between the situation today and future needs, the differences between the answers are compared (see
Figure 2). This illustrates the increased need of (f) (digital twins), g (zero-defect manufacturing), k (new manufacturing methods), and n (Industry 4.0), especially in the industry. For digital twins (f) it can be noted that the increased need for industrial development is not matched by an equally large increase in future research. Digital twins are already a hot research topic, as seen in the left part of
Figure 1, and the challenge is the applicability of the digital twin framework in the industry. This will be the focus of a more in-depth interview study, presented in the following sections.
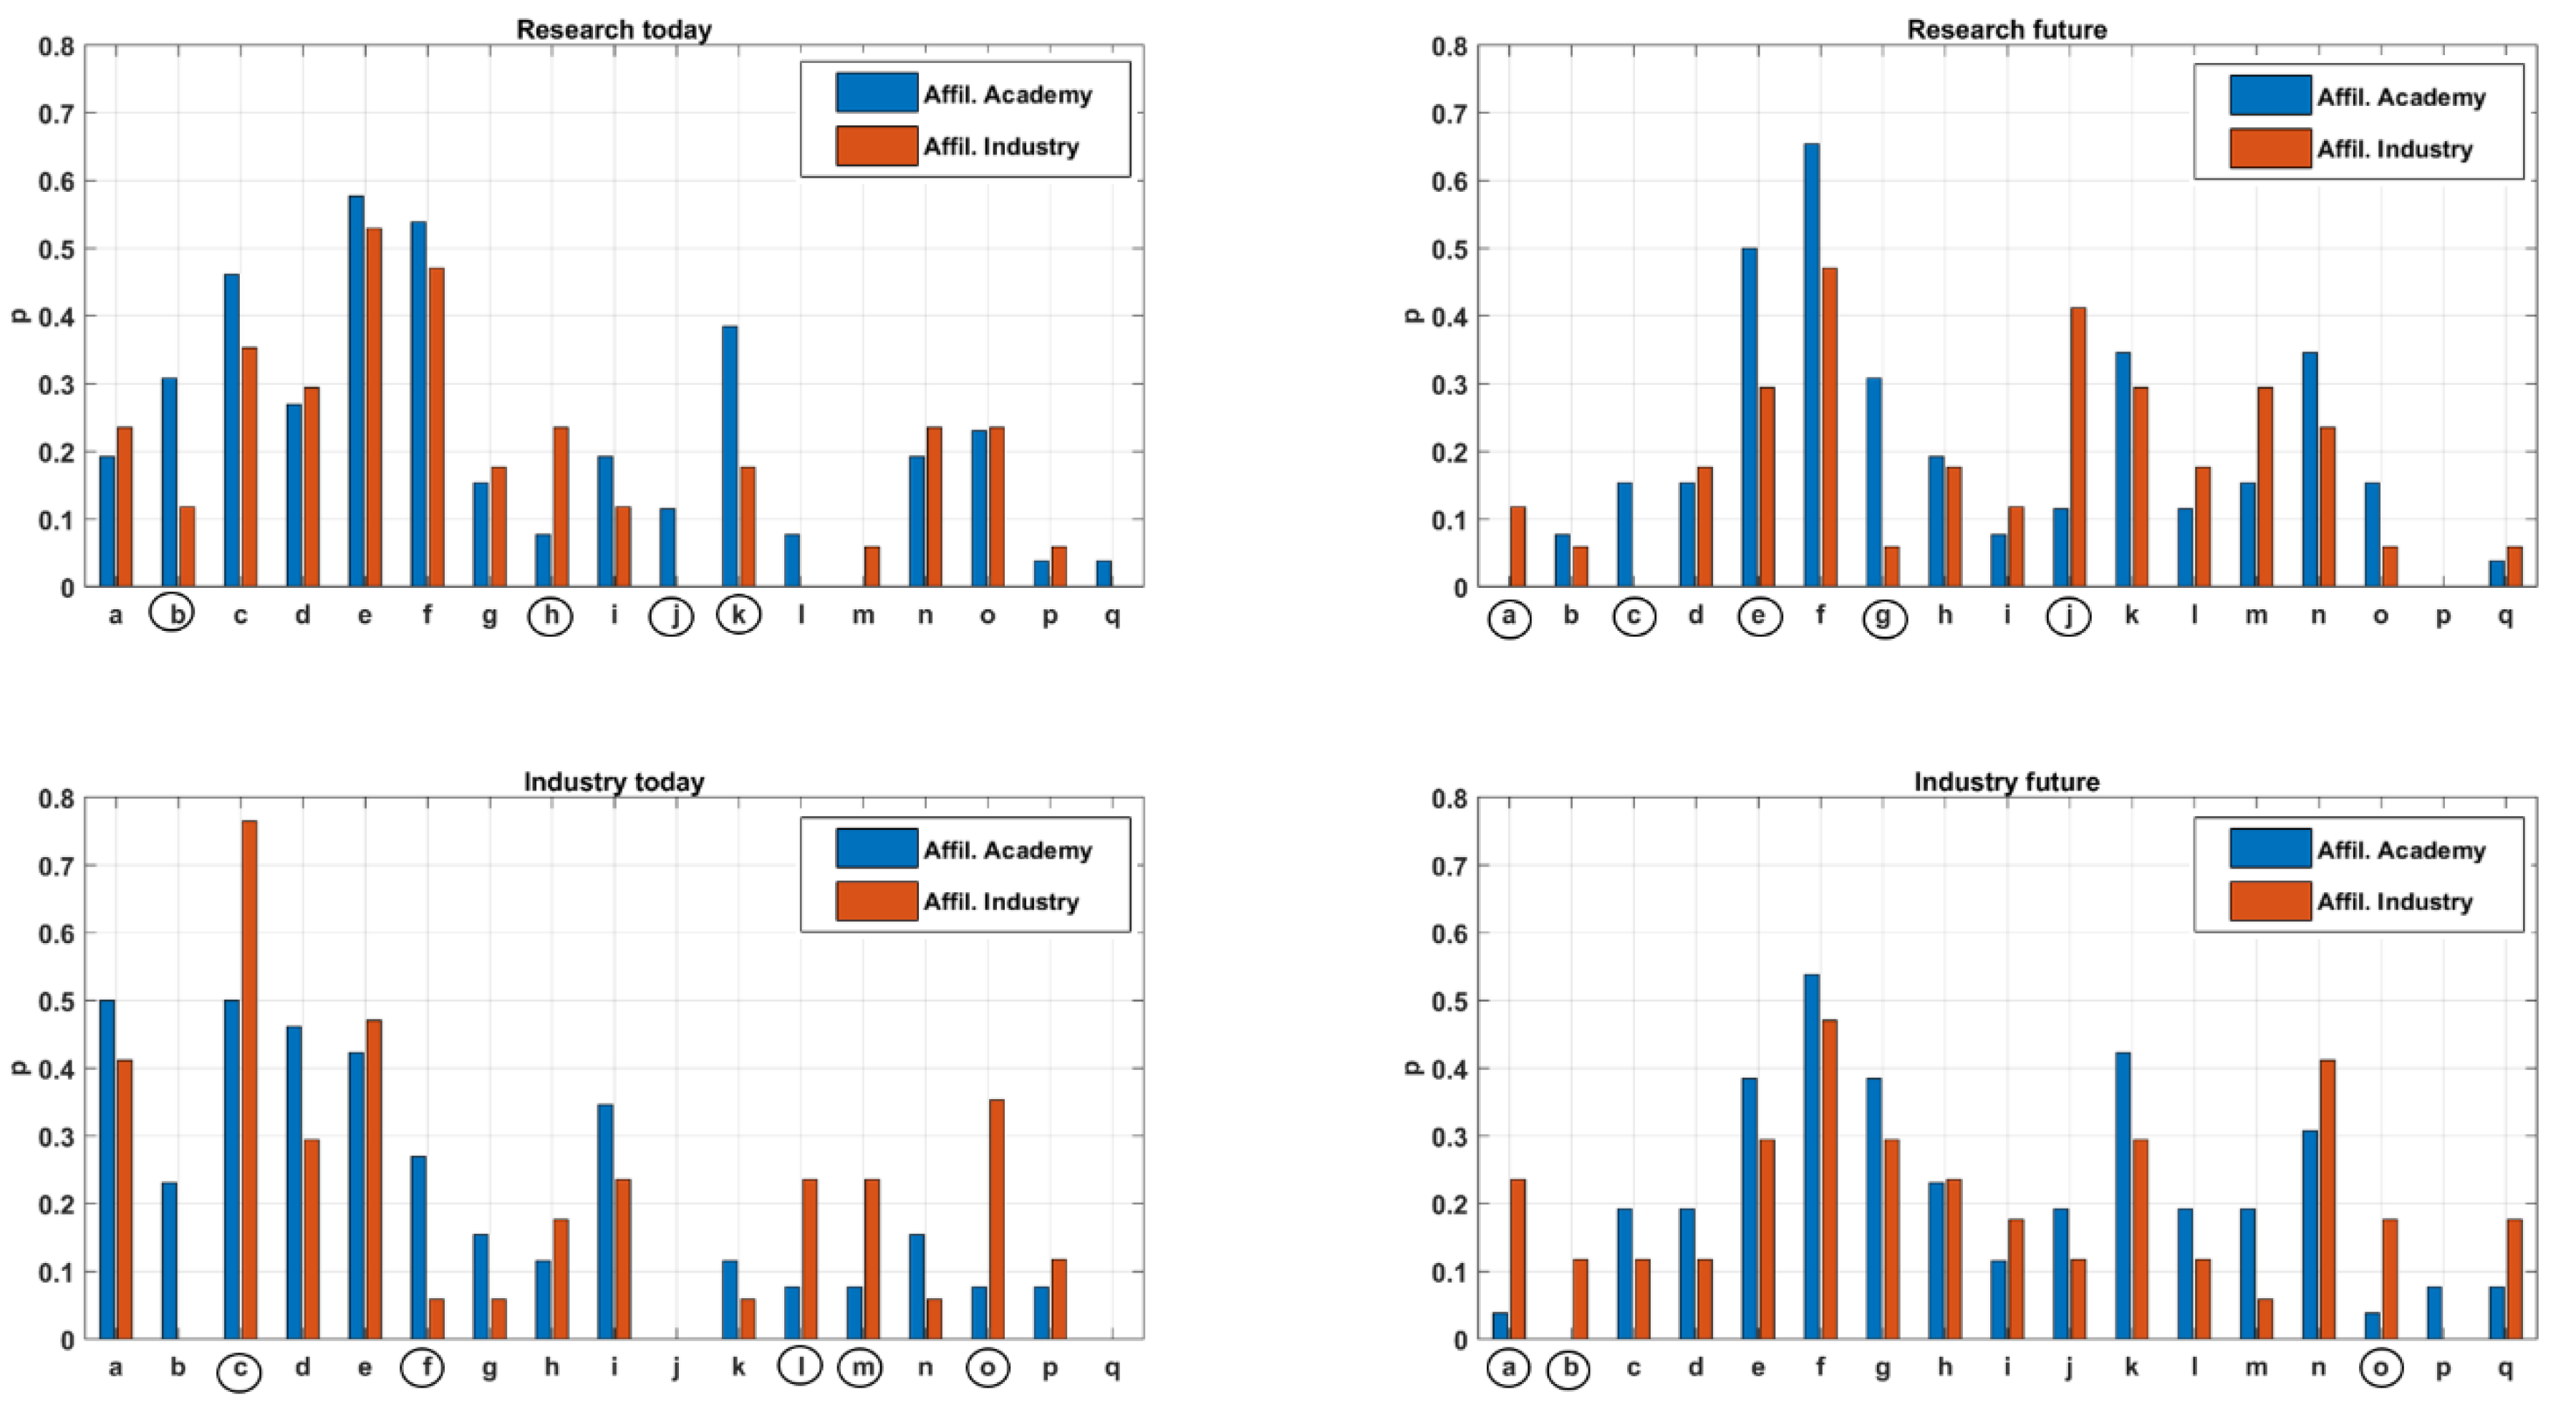
Other interesting observations from the survey can be reached if the data is filtered based on the affiliation of the respondents (see
Figure 3).
By filtering data into groups, the sample size for each group decreases, and therefore, not all differences are statistically significant. The z-test introduced in
Section 2.2 is used to test for significance. Significant differences, using
α = 0.10, are encircled in
Figure 3.
Some observations about the future:
For research in the future, digital twins are highly valued in both academia and the industry. The significant differences are found in (c) (tolerance analysis and evaluation, (e) (simulation), and (g) (zero-defect manufacturing), which all are considered to be more important among employees in academia. On the other hand, (a) (tolerance specification) and (j) (new materials) are considered more important among industrialists than academics.
For the industry in the future, the top priority is, again, digital twins. There is a higher level of agreement between people from academia and the industry in this area compared to research in the future, with significant differences only in (a) (tolerance specification), (b) (tolerances synthesis), and (o) (robust design).
In general, it can, based on the study, be concluded that digital twins are one of the most important areas within variation management. Today, it is most important in research, and in the future, it will become very important also in the industry, with an increased industrial need for development of the digital twins. In the next section, the meaning of a digital twin from a geometry assurance point of view is explained.
3. Digital Twin Framework for Geometry Assurance
The digitization of manufacturing is increasing. In the manufacturing business, 68% of the companies in a recent study stated that digital manufacturing is a top priority [
11]. The number was even higher in countries such as India (94%) and China (87%). It is, however, also reported that the expected benefits are perhaps not yet fully reached. In the context of Industry 4.0, digitals twins are seen as one of the top ten technology strategic trends, according to Gartner Research [
12], and various potential applications of digital twins along the product life-cycle have been identified [
13,
14].
A digital twin is a digital replica of a physical entity. In manufacturing, the terms digital model, digital shadow, and digital twin are used to indicate different levels of data exchange [
15]. A digital model is a digital representation of a physical part or assembly without data exchange, a digital shadow enables a one-way data flow between the physical and virtual representations of an object, while a digital twin allows for a bi-directional automatic data exchange between the physical and virtual representation. In this regard, different reference models for digital twins have been proposed, such as in [
16], considering important properties, such as model scalability, interoperability, expansibility, and fidelity. Most likely, a family of digital twins is needed to achieve optimized products and production flow, where each twin has its own purpose. The digital twins must represent both the product and the production system. As stated in [
17], multi-scale analyses and distributed decisions will be required for optimizing the activities on the shop floor, as well as processes, resources, and machines. In many cases, digital twins will be interlinked. For example, the digital twin for geometry assurance described below must be linked to twins controlling the assembly cell equipment.
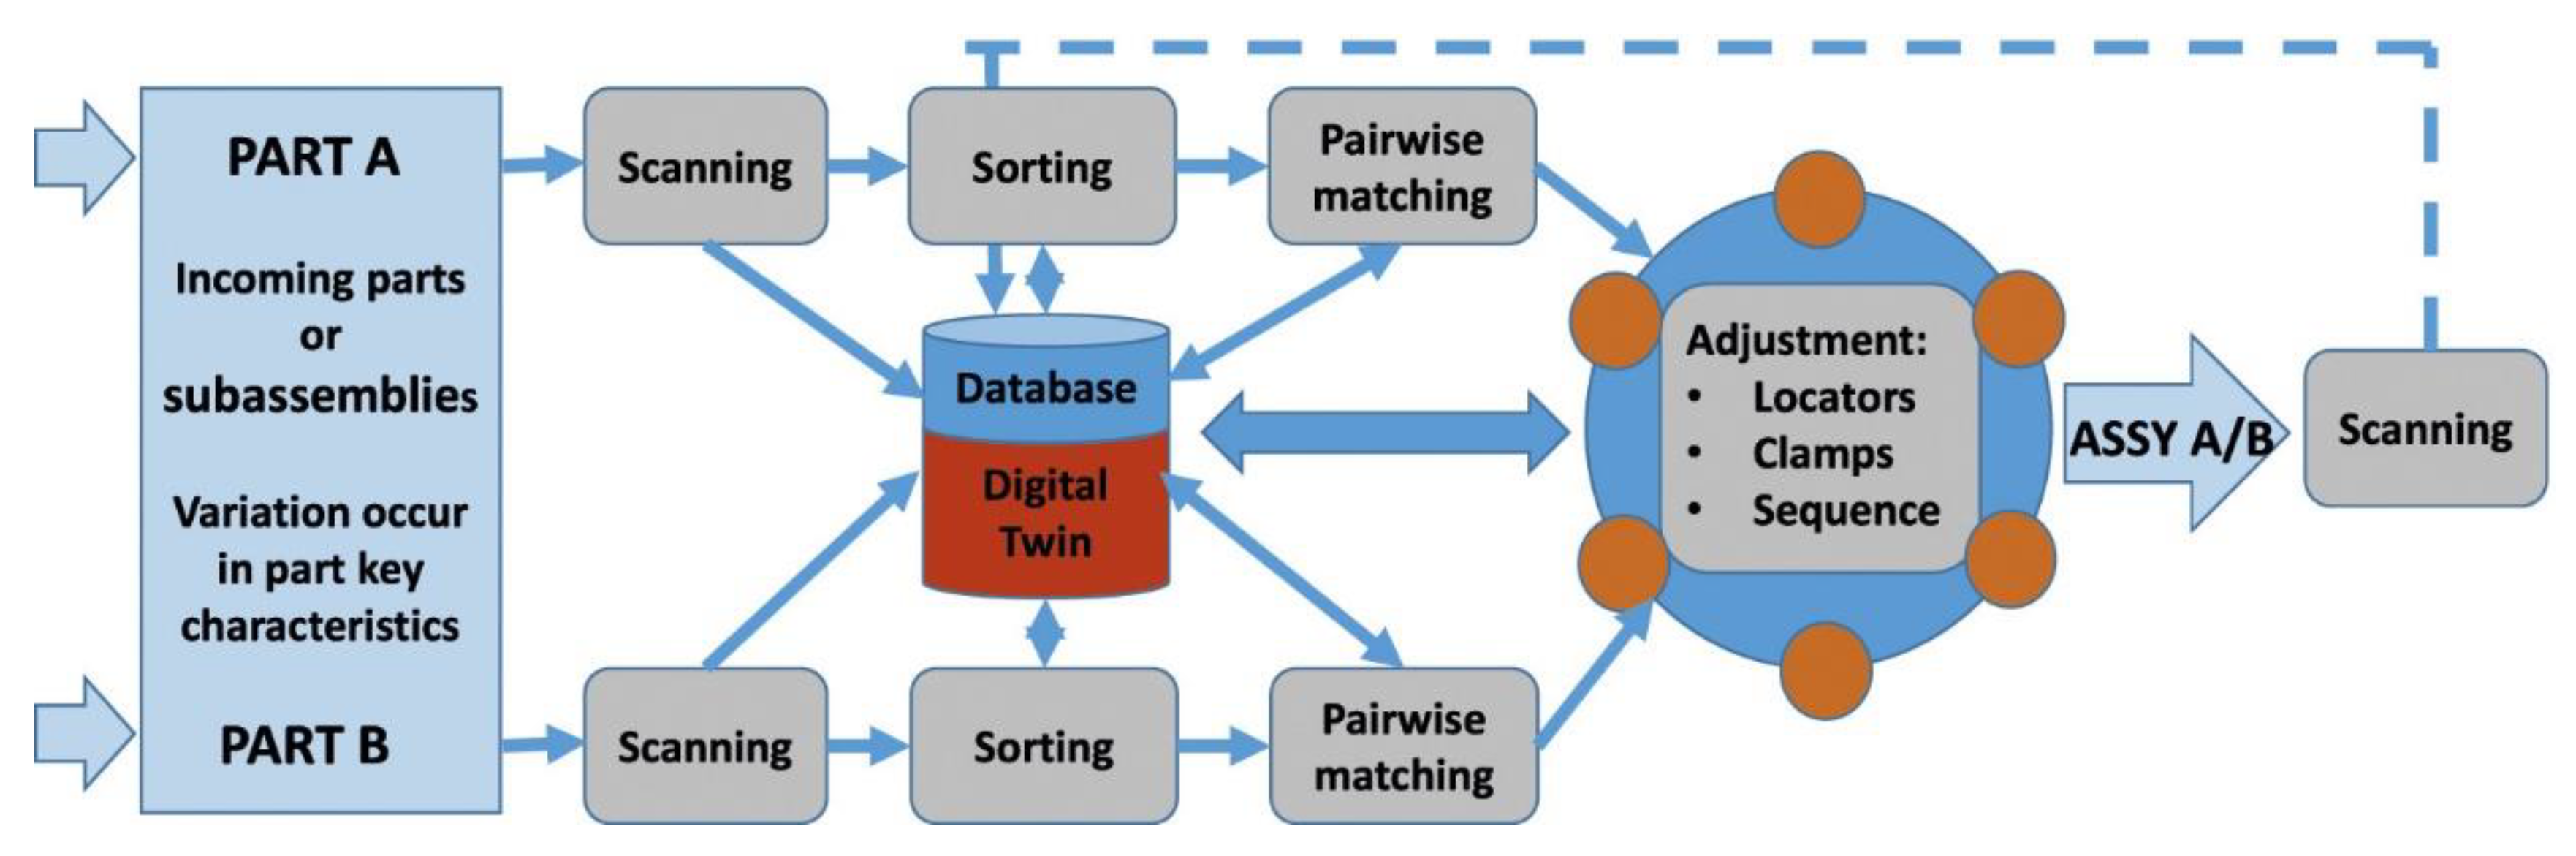
For the geometry assurance application, a digital twin approach was presented by Söderberg et al. [
3]. This approach is also adopted in this paper. It was suggested that the simulation models, used in the design phases, can be reused and fed with inspection data during full production to do real-time individualized optimization of the assembly process to reach high-quality products. In
Figure 4, an overview of the idea can be seen.
The idea is that two parts, A and B, are inspected using, for example, 3D scanning. This data is fed into the simulation model, which constitutes the kernel of the digital twin, to match individual parts over a batch of parts to minimize the geometrical deviation and variation of the assembly of A/B. This is also referred to as selective assembly [
18]. Furthermore, the joining process can be optimized with respect to geometrical quality. Locators can be adjusted [
19], and spot welding sequences can be optimized [
20] for each individual assembly. By those suggested adjustments, the geometrical quality of the assembly can be improved without changing the tolerances of the parts, which is beneficial from a cost perspective.
With this approach, studies on several industrial cases have shown that the variation of the final subassembly can be reduced up to 50%, compared to when no adjustments are done [
18,
19,
20].
With the labeling digital model, digital shadow, and digital twin mentioned at the beginning of this section, a digital twin for geometry assurance can be interpreted as:
a digital model, containing all nominal information about parts and assembly and joining processes. The model must also provide simulation capabilities.
input to the digital model about deviations from nominal values on the part and process levels.
output from the digital model to adjust the assembly and joining processes.
Those three pillars constitute together a digital twin.
3.1. Digital Twin—The Digital Model
As stated in [
21], modeling and simulation are key aspects to implement a digital twin. To build the digital model, which is the core of the digital twin depicted in
Figure 4, information about the joining and assembly process, part geometries, and other characteristics are needed. Using this information, a variation simulation model can be built. In the approach suggested in [
3], the commercial software RD&T was used. This digital model is capable of relating deviation and/or variation on the part level to the deviation and/or variation on the assembly level.
Nominal dimensions, surface textures, material data, etc., which can constitute the input to build the digital model and complement the 3D model of a part, are sometimes referred to as product manufacturing information (PMI), according to ISO 16792. The use and development of PMI are, to some extent, driven by the fact that the 3D models successively are replacing 2D drawings [
22]. This is beneficial not only due to its potential to reduce the amount of time dedicated to producing 2D drawings but also since the accuracy is supposed to increase.
Hedberg et al. [
23] and other researchers at NIST (National Institute of Standards and Technology) discussed a digital model-based definition (MBD) for engineering tasks in manufacturing and inspection phases. This relates to the concept of a digital thread, which referrers to the digital information and data flow between different product realization phases. The digital thread provides important information to the digital model.
The 2017 ISO 1101 tolerancing standard allows for more precise tolerance definitions, which are independent of the viewing plane, and also supports the digital thread.
From a geometry assurance perspective, the digital thread must allow for a cohesive digital information flow between all activities related to product geometries, requirements, fixtures, and assembly cell layouts. This will be the focus of the interviews presented in
Section 4.
3.2. Digital Twin—The Input Data
Scan data of the individual parts constitute the input to the digital model and can also be seen as a part of the digital thread. Given part deviations, adjustments adapted to a certain set of parts, A/B, can be predicted using the digital model. Of course, the scan data needs to be accurate and reliable. Scan data can be mapped to the nominal finite element meshes of the parts. Aspects of the scan data as the input to a digital twin for geometry assurance are discussed in [
24] and are not the main focus of this paper.
3.3. Digital Twin—The Output Data
By feeding the digital model with inspection data, optimal locator adjustments and optimal spot-welding sequences can be determined. This constitutes the output from the digital model and is, of course, an important part of the digital twin. A suggestion of how to handle the data flow between the digital model and the assembly cell is presented in [
25].
4. Interviews
To clarify the industrial state of the art and future needs regarding geometry assurance and digital twins, semi-structured interviews with over 40 engineers at eight Swedish and Danish companies in the manufacturing sector have been conducted.
The presented findings are focused on the information needed to build the digital model, using the terminology introduced in the previous section. However, to not limit the scope of the interviews and risk missing important aspects of the digital model and the simulation procedure, the whole geometry assurance loop is addressed. The importance of acknowledging interactions between different systems in a digital twin context is also highlighted in [
26].
The engineers participating in the interviews work with geometry assurance or on a more general level with product development. Managers responsible for geometry assurance at the different companies were contacted, and they helped to select suitable interviewees. The interviewees were chosen based on their high competence and long experience in the area.
The base assumption of the interviews is that there exists a product development process containing concept, planning, and production phases. At most companies, this process is further detailed with gates and subphases [
27,
28].
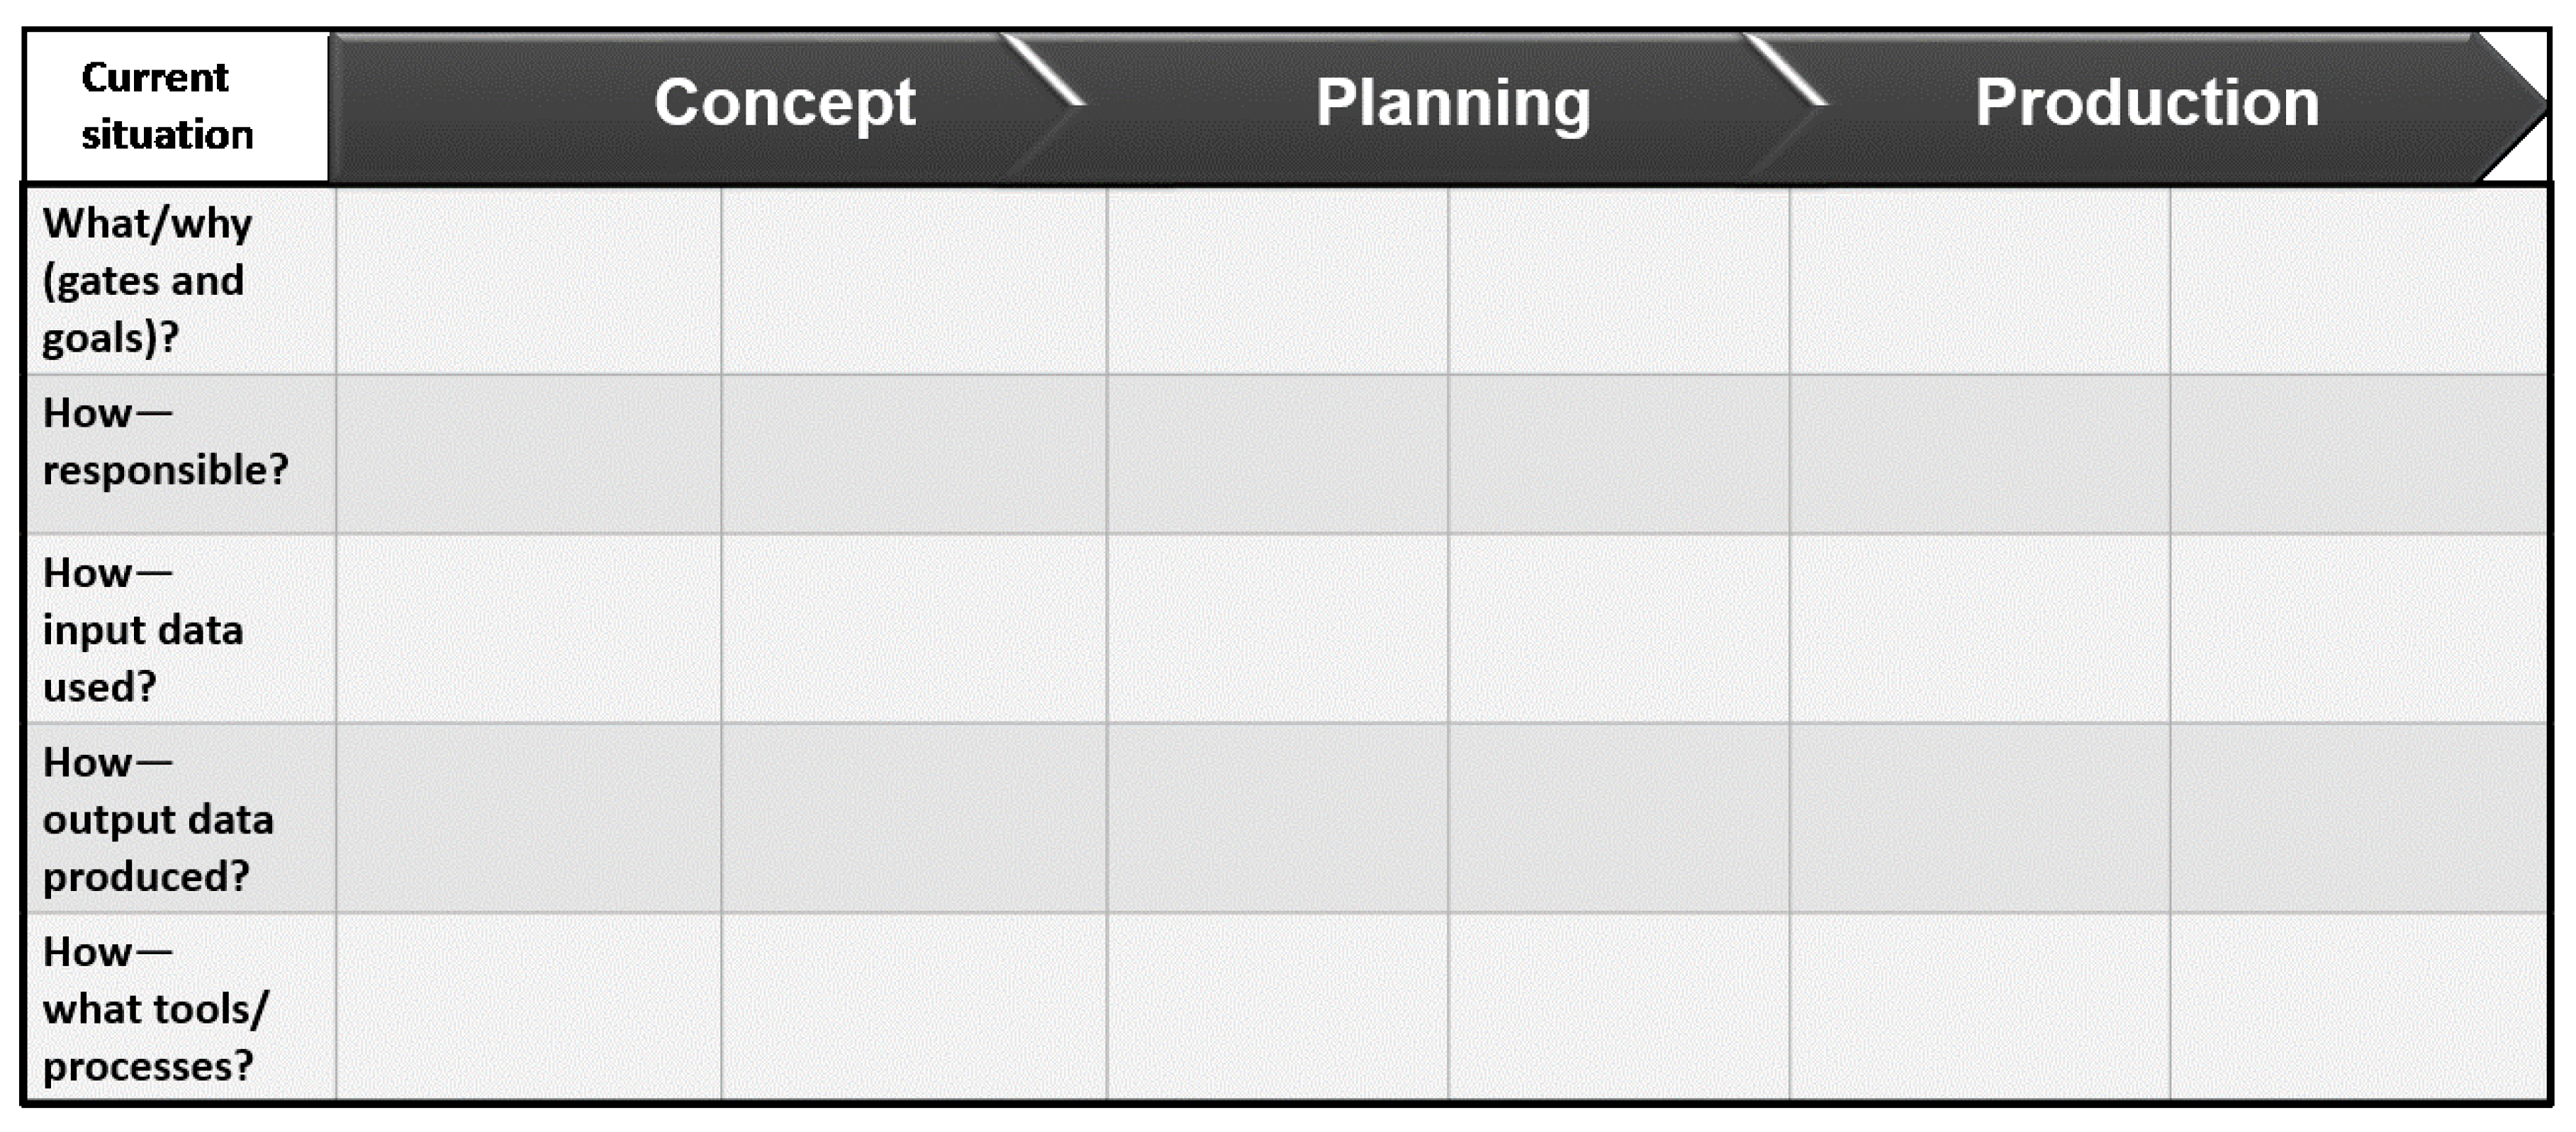
A digital model, which will be the core of a digital twin, should be developed, reused, and updated in the different phases of the product development process in order to provide as much value as possible. Therefore, the respondents of the interviews were asked about the current situation regarding different gates and goals related to geometry assurance in the different phases (see
Figure 5). They were also asked about the responsibilities of different roles, about input and output data for the different activities, and what (software) tools they use. The guide in
Figure 5 was filled out together with an identical form reflecting what an ideal situation for the geometry assurance activities should look like in the future.
As a part of the preparations for the interviews, the form, used as a guide during the interviews, was developed according to the recommended steps for a semi-structured interview described in [
29]. Those steps are:
- (1)
identifying the prerequisites for the interviews.
In this step, the general procedure for the interviews was outlined. The ability to focus on issues being meaningful for the participants and also to allow diverse perceptions to be expressed were taken into consideration [
30]. The companies participating in the study were contacted. All contacted companies accepted the interview invitation.
- (2)
retrieving and using previous knowledge.
Previous research in the area was investigated. The two interviewers had long (over 15 years) experience of research in the area.
- (3)
formulating the preliminary semi-structured interview guide.
The form illustrated in
Figure 5 was developed. This form provided a framework for the interview and allowed easy movement from question to question, which was beneficial for the results [
31] but, also, the possibility to dive deep into certain topics.
- (4)
pilot testing the interview guide.
To confirm the relevance of the developed interview guide, the questions were tested on an experienced engineer with many years of experience as a consultant within geometry assurance. Some small adjustments were made to make the questions clearer.
The interviews were held by two interviewers to reduced bias introduced during the interview. Before the interview started, its purpose and format were clarified. The respondents were free to elaborate on the questions, and follow-up questions were used to clarify answers.
After the interviews, the results were analyzed. One person took notes during the interviews and immediately afterward, those notes were clarified and validated with the other interviewer.
5. Results: The Geometry Assurance Process Today
In this section, the results from the interviews reflecting the present situation for the three main product realization phases are presented. An overview of the results can be found in
Figure 6. In the figure, the different activities (middle) are listed together with the input required for the activity (top), as well as the output generated from the activity (bottom).
4.1. The Concept Phase
For most companies in the study, the geometry assurance process starts with some kind of evaluation of concepts suggested by the design department. The suggested concepts are based on customer demands and other requirements and, to a large extent, also on experiences from previously produced models and projects.
The geometry engineers check if the suggested concept(s) can be built with reasonable geometrical quality (see ①,
Figure 6). At this first stage, the evaluation is usually based on discussions, previous experiences, and sometimes, also on simple styling surfaces. The positions of the split-lines between parts affect both the visual sensitivity to variation and the level of geometrical variation in, for example, a weld between two parts [
32].
The choice of locating scheme (②,
Figure 6) is critical for the geometry assurance process. The locating scheme, used to fixate parts during assembly, must lock all degrees of freedom of a part and should be as robust as possible to variation. At this stage in the process, there usually exists a (not-so-detailed) CAD model of the part. This is exported from the CAD system in a neutral triangular format (often WRL or JT) and used in a variation simulation software to evaluate robustness. At the companies in this study, RD&T [
7] is the most commonly used software. The suggested locating schemes are documented in reports and 2D drawings generated from the CAT tool. At one of the companies in the study, the produced results were linked to the 3D digital model.
The next main step is to define the tolerances on the parts (③,
Figure 6). The goal is to find tolerances such that the final requirements on the product can be fulfilled but, at the same time, keep costs down. Again, triangular representations of the CAD model are used as the input, together with old inspection data (from similar concepts), if available. The analysis is done using variation simulation software to predict the final variation on the product (or subassembly) level or by simplified analyses in Excel or similar. The predicted variation is compared with the requirement on the product level, and the process is iterated until satisfactory results are obtained. Of course, experiences from previous projects are also important input. The output is the part tolerances described in a variation simulation model and/or on 2D drawings.
4.2. The Planning Phase
In the planning, or verification, phase, the interviews focused on system verification activities from a geometry assurance perspective and on inspection preparation.
The system verification (④,
Figure 6) is often done through physical tests and try-outs. This is to complement and extend learnings from simulations. Of course, it would be desirable to reduce, or even exclude, the physical tests and rely only on simulations. This is a matter of “virtual trust” (i.e., trust in simulated results), a topic discussed in the following sections. Changes are done to increase producibility and quality. The changes can include minor changes of the geometries and changes of tolerances, fixtures/locating schemes, joining sequences, etc. After those changes, it is of course very important to update the CAD models and other information in the digital model and the digital thread.
One of the companies reported ongoing work to replace physical trimming, where a part is positioned in a checking fixture to control the shape of the flanges, with a virtual method based on the variation simulation model [
33]. This is something that most companies want to do, but most of them are not there yet. Physical tests are expensive and should be kept to a minimum. At one of the bigger companies, it was reported that over 180 persons work with handling the most acute geometry-related problems exposed during system verification.
The inspection preparation (⑤,
Figure 6) is an activity where the practices at the companies differ a lot. Some companies set inspection points according to the final requirements defined earlier and complement this with process points to monitor the process. At other companies, the chain from the final requirements to inspection points is not that clear. The inspection point preparation is done by the design engineer. Other aspects mentioned were that it is bad practice to do an inspection point preparation leading to points that cannot be evaluated/measured in a good way, that it is difficult to measure very flexible parts (due to effects from gravity), and that the number of inspection points often is too large and lead to difficulties in the evaluation and storage of data. Inspections are also associated with a cost, and it is desirable to keep the number of inspection points to a minimum. At the more advanced companies, 3D scanning is mixed with a CMM (Coordinate Measuring Machine) inspection. At other companies, gauges and other manual inspection tools are used.
For the digital thread, it is important to update the 3D models with inspection point coordinates. This is not always done. Quite often, an inspection point report is generated in PDF or similar, but the information is not fed into the CAD system.
4.3. The Full Production Phase
During full production, the geometry assurance activities are supposed to subside. Most of the geometry assurances should be preventive work in the early phases to make sure that the product and the processes are robust to variation. There are, however, always issues arising, and root causes of deviations and variations must be identified, and changes in the process should be documented (⑥,
Figure 6).
Often, design changes done during full production are not brought back to the design engineers in a systematic way. There can be local systems, logs, and documentation, but it is not fully integrated into the design process. Therefore, it is a risk of repeating mistakes in future projects. Moreover, there is a disagreement between the virtual models and the physical world, and the generated inspection data will not fully reflect the virtual models. This has also been addressed in [
34].
The importance of a good inspection database was mentioned at several companies. They used systems like QSYS [
35] and CM4D [
36] but were still missing some company-specific features. It can be concluded that the inspection database needs to be adapted to specific company requirements but, also, that different users have different needs and demands.
6. Results: Challenges Related to the Implementation of a Digital Twin
The future needs, identified during the interviews, that should be addressed to achieve a comprehensive digital twin for geometry assurance, are listed below. They can be divided into four different categories: system level, simulation working process, management issues, and education. The needs are further discussed in
Section 7.
System-Level
- (a)
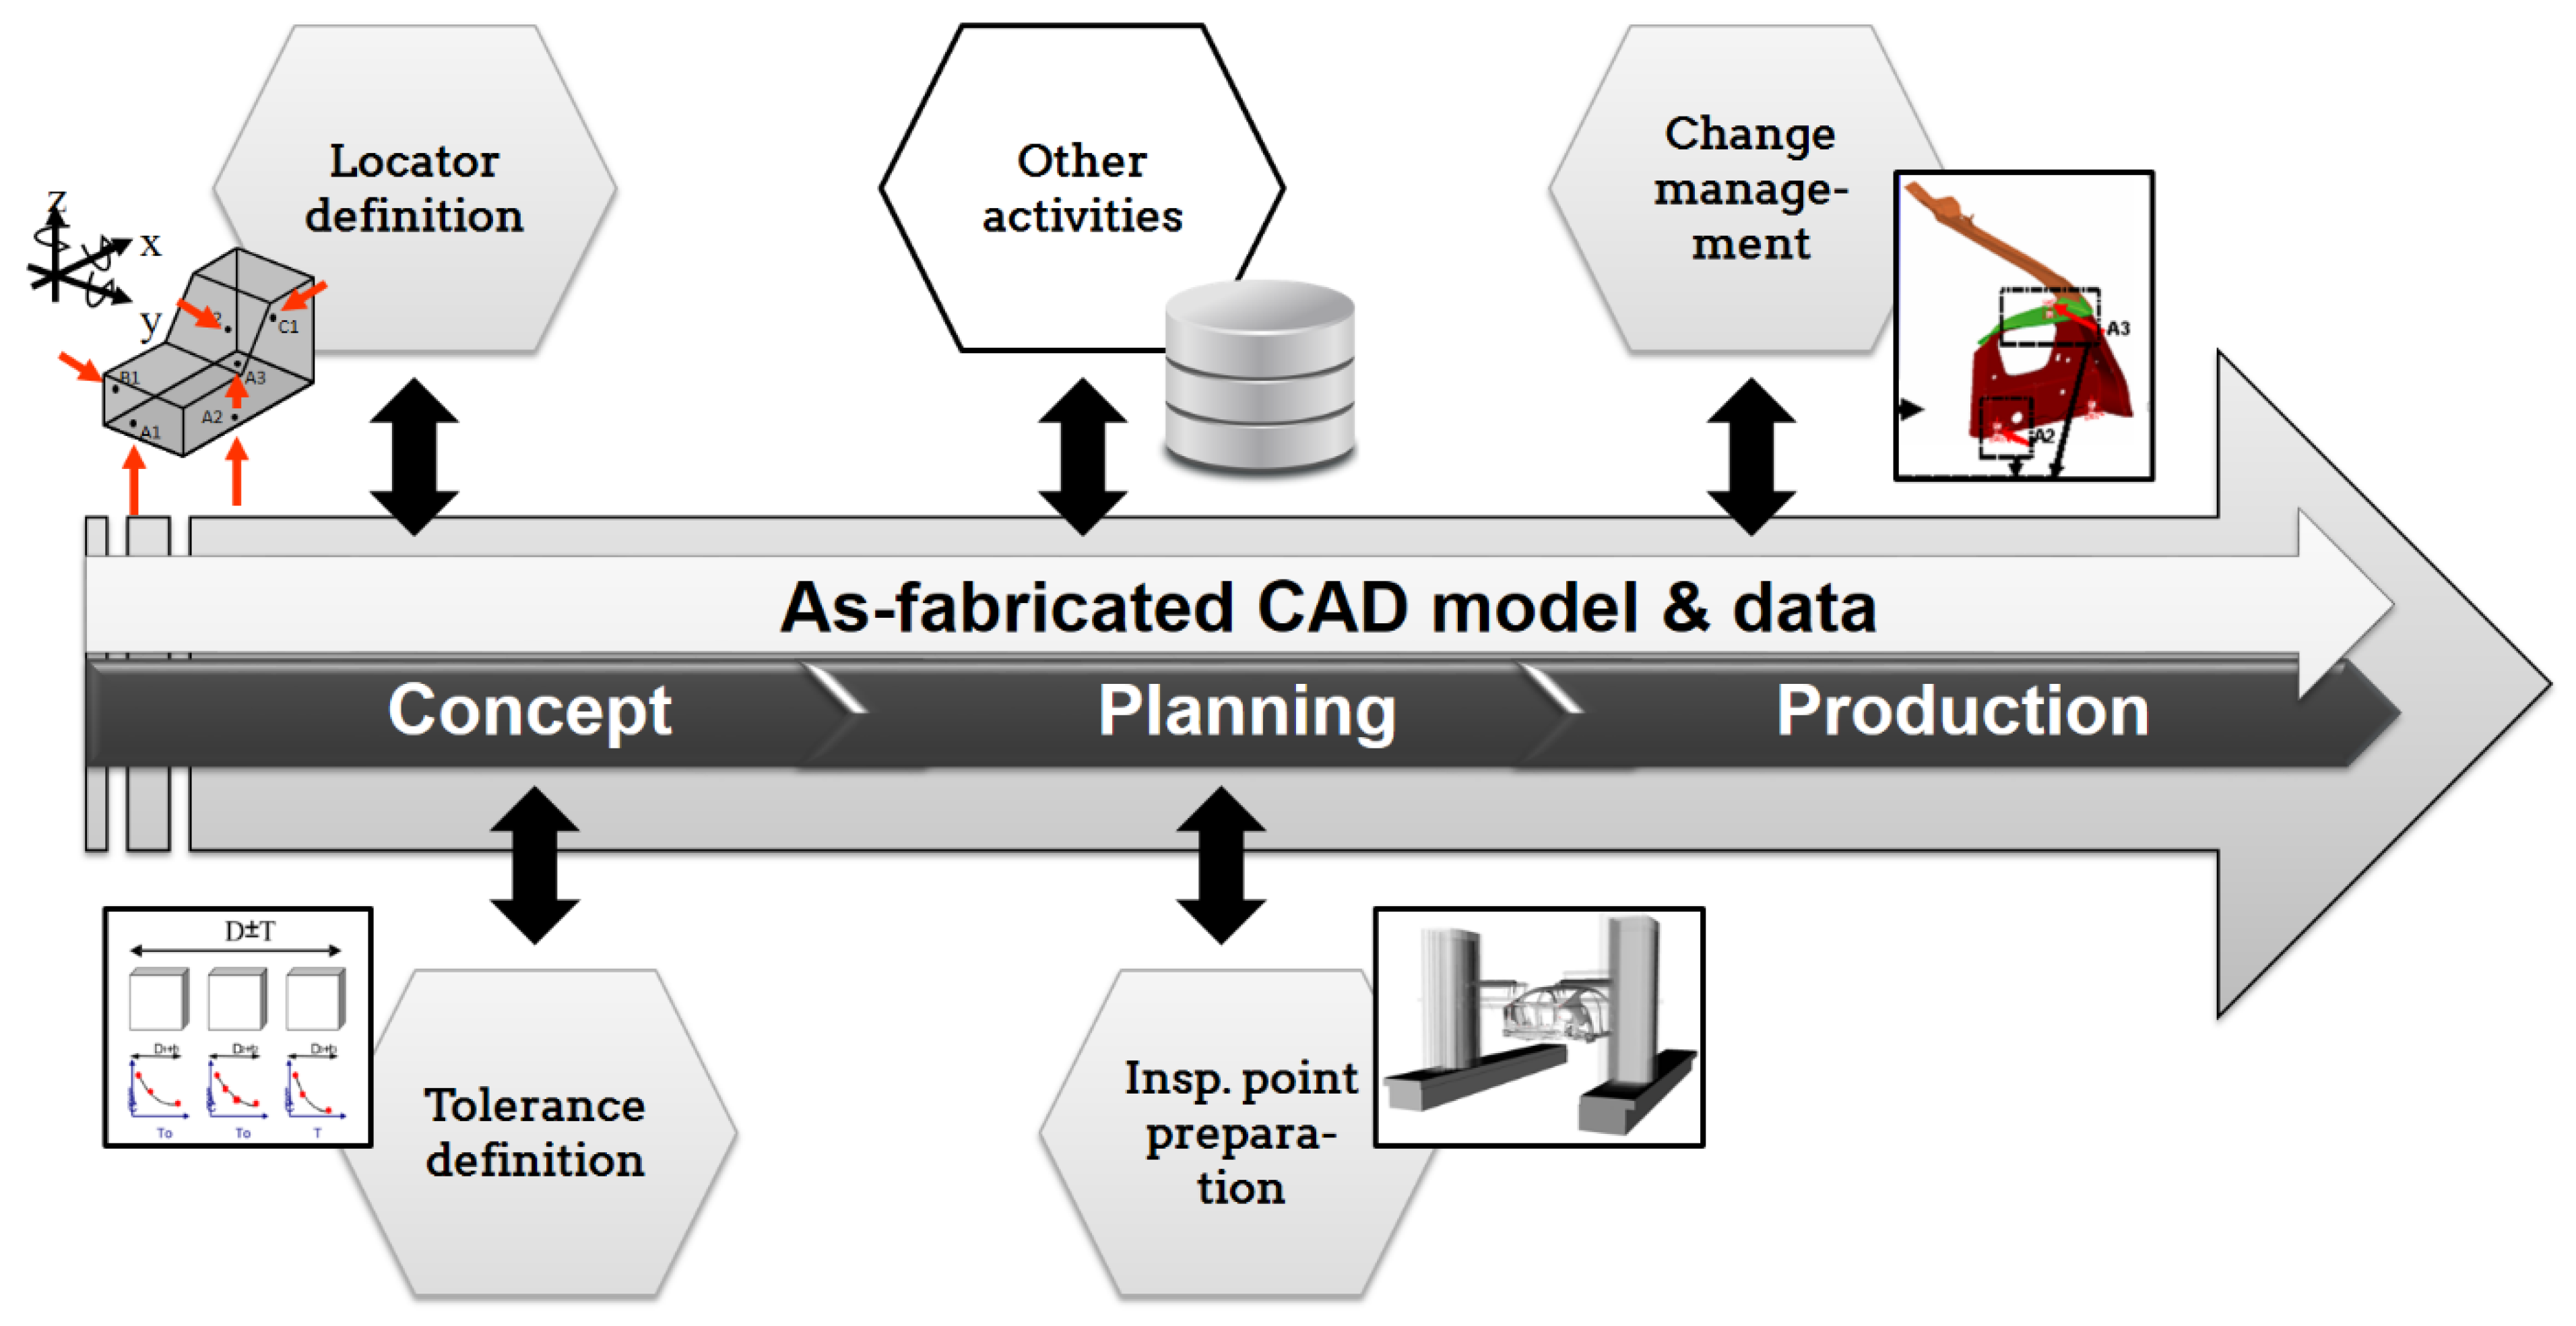
The major future needing identified at all the companies is a fully updated 3D digital model developing through all the phases in the product realization process. This is outlined in
Figure 7. All activities and changes that affect the geometry of a part should also be brought back to the 3D digital model of the product, securing an always-updated and true geometrical representation of the actual produced part. This is today not the case at the companies in the study.
The 3D model should be updated when new information is available during the product realization process. Besides changes in geometry, locator positions, tolerances, and inspection point positions should also be linked to and updated in the 3D model.
Simulation Working Process
- (b)
Assembly models for variation simulations done in the early concept phases should be reused and refined during the planning phase. Today, usually new models are created, due to differences in modeling structures and working procedures. This is not only ineffective, but it can also lead to inaccurate information and misunderstandings due to model differences.
- (c)
The decomposition of final requirements to critical dimensions on the parts, done in the early concept phase, should be reused to a greater extent during inspection preparation in the planning phase.
- (d)
Simulation must be seen as one of the customers to inspection data, and the inspection should be adapted to this. This is necessary to provide high-quality input to the digital model and to achieve a complete digital twin.
- (e)
An individual digital twin of the product should be developed/kept for following-up purposes and for predicting maintenance.
- (f)
“Virtual trust” needs to improve.
Management Issues
- (g)
The design engineers need access to the production inspection data.
- (h)
There should be a generic project manning for all projects to secure that all aspects (including geometry assurance) are fully covered. This is not related to the digital twin concept but is included for completeness.
- (i)
Communication within the companies needs to improve. The design engineers are seldom willing to change their concepts to fit production capacity.
- (j)
People’s willingness to change is sometimes low and needs to improve.
Education
- (k)
Education at universities should cover tolerancing and knowledge in geometry assurance to a greater extent. This finding is also supported by unstructured interviews with experts from German automotive suppliers, who reported that more attention should be paid to education in tolerancing and geometry assurance at universities. More particularly, the students should be introduced to the different steps of the geometry assurance process (as highlighted in previous sections) to fully understand the importance, interdependencies, and repercussions of tolerancing decisions on product quality and cost. Additionally, to cope with the challenges of a digitized design and manufacturing environment, students will need more knowledge and competencies regarding model-based definition workflows and the digital thread in geometry assurance in the future.
7. Discussion
Among the identified needs listed in
Section 6, the main need related to increase the use of digital twins and the digital thread supporting them is point (a) on the system level, the continuous update of the 3D models. If the 3D models only reflect the as-planned and not the as-fabricated product data, there is a huge risk for costly mistakes when using them in a digital twin concept. It is also difficult to learn from previous projects and improve new products without an updated 3D digital model. The reason for this lack of updated models might be practical, since some geometry assurance (and other) analyses are based on neutral triangular formats, such as WRL or JT, and the output might be 2D drawings or text files, not an updated version of the 3D model. Attempts to overcome this could be to use neutral formats—for example, STEP files—as both the input and output from variation simulation software. The STEP files can then be read into the CAD system again to update the geometry models. STEP files support PMI but not all GD&T concepts. An MBD approach where no 2D drawings are used, but the 3D models are the basis, removes some of the problems.
The CAT tool must be able to exchange information with the CAD system (and probably also the PDM/PLM system) regarding:
geometry and material data,
tolerances,
locators (position/direction), and
inspection points (position/direction) and inspection data.
The information can be exchanged directly or via the PDM system. It is also important to be able to quickly remesh the 3D geometries after changes [
37].
The issues related to the simulation working process are also related to the development of the digital model. To improve “virtual trust”, the simulation must be based on correct models and reflect reality. Updated 3D models and a clear digital thread are important aspects of this. Moreover, the inspection data used as the input to a digital twin must be of good quality. As stated, the simulation must be seen as a customer of the inspection data. For nonrigid parts, this means that the parts cannot be measured in an overconstrained position, which is usually the case. Instead, they should be measured by locking in only rigid body motions [
38] to give a good representation of their actual shape. In that way, the variation simulation can predict the spring-back and the final shape of an assembly. Aspects related to how to choose the inspection points with maximum information content are discussed in [
24,
39]. Other factors affecting the accuracy of the simulation, and thereby the virtual trust, are listed in [
5].
In the future, the interviewees state that a non-nominal digital twin of each individual product is desirable. This is also in line with the results of the survey presented in
Section 2. If inspection data is linked to individual products via the digital thread, maintenance can be customized for each individual, which is especially beneficial for high-cost products.
Other aspects given in the list (g)–(k) are related to management and the education system. This is in line with the conclusions in [
40]. Those aspects are not core parts of achieving a digital twin, but to use the full potential of a digital twin, they are probably necessary.
8. Conclusions
To conclude, a digital twin for geometry assurance shows great improvement potential. Examples have shown a reduction of variation on the assembly level with up to 50% compared to a standard joining and assembly process, without individual adjustments and optimization. However, there are barriers that the industry must overcome in order to fully capitalize on those potential improvements. Those barriers are mainly related to the lack of processes for updates and the sharing of the 3D models. Those models must be updated with all changes done during both the development and full production phases. To achieve a complete and reliable digital twin, inspection data must be of high quality and linked to the 3D models. Moreover, universities and research institutions have to elaborate on the underlying digital twin technologies and educational programs for engineers of the future to fully utilize the benefits of a digital twin.


