Abstract
Defective shafts need to be classified because some defective shafts can be reworked to avoid replacement costs. Therefore, the detection and classification of shaft surface defects has important engineering application value. However, in the factory, shaft surface defect inspection and classification are done manually, with low efficiency and reliability. In this paper, a deep learning method based on convolutional neural network feature extraction is used to realize the object detection and classification of metal shaft surface defects. Through image segmentation, the system methods setting of a Fast-R-CNN object detection framework and parameter optimization settings are implemented to realize the classification of 16,384 × 4096 large image little objects. The experiment proves that the method can be applied in practical production and can also be extended to other fields of large image micro-fine defects with a high light surface. In addition, this paper proposes a method to increase the proportion of positive samples by multiple settings of IOU values and discusses the limitations of the system for defect detection.
1. Introduction
The main function of the shaft is to support the transmission components, transmit torque and bear the load. Due to the continuous casting of the steel embryo, cutting and grinding, etc., the surface of the metal shaft is prone to cracks, crusting, roller printing, scratches and other types of defects during processing. The defects of the shaft have a great influence on the performance and life of the shaft and easily cause equipment failure. Therefore, the detection of shaft defects has always been a particular concern of shaft processing manufacturers. At the same time, in order to save costs, some defective shafts are recycled and remachined, and shafts that cannot be remachined are directly scrapped. Therefore, it is necessary to classify defective shafts according to defect types.
The traditional shaft surface defect inspection relies on the manual operation of the workers. The labor intensity of the workers is large, their testing experiences are different, and long-term detection affects their mental state, resulting in low detection efficiency, poor consistency of results, false inspections and missing inspections. The metal shafts are processed by the turning process and polished, and will produce various defects during the machining process. In this project, the length range of the tested polishing metal shafts is from 100 mm to 400 mm, and most of the defects can be classified into pits, breach, abrasion and scratches; the remaining ones are classified as unknown defects. The common shapes of the four defects are shown in Figure 1. Figure 1a is a pit defect characterized by a circular shape and a small diameter of about 0.3 mm. Figure 1b is a breach defect characterized by a short length and a width of 0.5 mm, with non-circular grooves around; Figure 1c is a abrasion defect characterized by a large defect area, a fish scale shape, and a variety of shapes; and Figure 1d is a scratch defect characterized by a long fine length, with a very small width of about 0.3 mm.

Figure 1.
Common metal shaft surface defects, (a) pits, (b) breach, (c) abrasion, (d) scratch.
Machine vision detection is a recognition technology based on computer vision to achieve object detection which replaces traditional manual detection technology. Since the last century, machine vision technology has been widely used in many fields [1,2,3,4,5,6,7,8] of defect detection and quality control, such as mechanics, chemistry, material science, agriculture, tanning, textile, printing, electronics, and so on. In recent years, the application of deep learning technology using neural networks in the field of machine vision has made the recognition ability of machine vision reach new heights.
The neural network [9,10,11] was originally derived from the 1940s, experienced an MP model that mimics the human brain, a single-layer perceptron that adds learning functions, and an enhanced BP neural network. After the 1990s, it was a period of depression. With the development of computer technology, the research of neural networks has risen rapidly, the fields and scopes that can be applied have been greatly expanded, and even in the future there will be a broader application space [12,13,14], Among them, deep learning quickly uses neural network technology [15,16].
In fact, the application of machine vision in surface defect detection, whether based on classical image processing technology, or computer vision technology, or even neural network-based machine learning technology, has been extensively studied.
At present, most of the detection objects are still plane-oriented. For example, Yi, et al. [17] proposed the detection of surface defects of end-to-end steel strips based on deep convolutional neural networks; Ma, et al. [18] proposed blister defect detection based on convolutional neural networks for polymer lithium-ion batteries; He, et al. [19] proposed a new object detection framework classification priority network (CPN) and a new classification network multi-group convolutional neural network (MG-CNN) to detect steel surface defects, using the You Only Look Once: Unified, Real-Time Object Detection (YOLO) neural network—the accuracy rate of hot-rolled strip surface defects could reach more than 94% and the classification rate is above 96%; Liu, et al. [20] proposed periodic surface defect detection of steel plates based on deep learning to improve the detection rate by improving the Long Short-Term Memory (LSTM) network; and Song, et al. [21] proposed a DCNN (deep convolutional neural network) to detect the micro-defects of metal screw end faces, and the detection accuracy could reach 98%. The image detection obtained by directly taking photos of such a plane is mature and the detection accuracy is generally good.
For the image acquisition and detection of irregular surfaces, there is no unified method. Different methods are adopted according to different objects. Xu, et al. [22] proposed using vehicle ground-penetrating radar to obtain irregular railway subgrade images. The improved Fast R-CNN was used to identify hazards and compared with traditional neural network methods; Santur, et al. [23] used a 3D laser to acquire the defect image of arail, and then conducted deep learning to achieve the high-precision and rapid detection of lateral defects such as fracture, scour and abrasion on railway surfaces; Sun, et al. [24] directly adopted fixed-photographing methods for surface irregularities of automobile hubs and achieved the identification of automobile hub surface defects based on the improved Faster R-CNN, comparing this with the current state-of-the-art YOLOv3.
The image acquisition of regular curved surfaces mainly refers to the image acquisition of a rotating curved surface, which is often performed by multiple cameras, and then multiple photos are synthesized. For example, Su et al. [25] proposed taking multiple photographs of the cylindrical surface, then synthesizing these photographs, finally obtaining the complete defect picture. However, with the advent of line-scan cameras and linear light sources, line-scanning is generally used to acquire images for rotating curved surfaces. For example, Shi, et al. [26] used line-scanning to obtain images for the circular curved surfaces of chemical fiber paper tubes. The defect image was detected using Faster R-CNN, and the accuracy rate was 98%. Xu et al. [27] proposed using a line scan camera for image acquisition on the surface of a cylindrical work piece and using Faster R-CNN to detect defects. There is currently no mention of how to obtain high-quality surface images in the case of a highlighted surface.
There are many methods to detect defects after obtaining an image with defects. There are methods based on shallow neural networks. For example, Tao, et al. [28] proposed the use of cascaded autoencoder structures for the segmentation and localization of defects, and by using shallow convolutional neural networks, metalsurface defects are automatically detected and identified. Furthermore, there are deep learning methods based on traditional deep neural networks used to directly identify defects. For example, Chun, et al. [29] used traditional deep learning methods to detect defects on the surface of products; that is, the traditional learning method is directly adopted, in which the image is segmented first, then the segmented image is to added into deep learning, and then a group of deep learners are used and the three deep learning methods are compared for the detection effects. Some people think that due to the limited training samples, deep learning is adopted in practical applications, and the method is not effective, so the proposed feature extraction is based on a convolutional neural network, meaning that the similarity between images is used to classify the defects; the accuracy rate can reach 97.25%in the method proposed by Qian wen et al. [30]. Of course, the poor recognition effect due to the problem of limited training samples does exist, but there are many solutions to this problem; for example, Haselmann, et al. [31] proposed an artificial defect synthesis algorithm based on a multi-step stochastic process in order to increase training images and improve the detection rate for supervised machine learning, which directly creates a large number of training images, but also improves the number of training images by improving the positive samples of images. Additionally, Park, et al. [32] proposed a surface detection system for non-patterned welding defects based on a convolutional neural network using common pictures, and then a convolutional neural network to detect defect images in stages. An increased positive sample method is also proposed. There is also a method to increase the effective training images by directly discarding the redundant images that do not contain defects; for example, Li, et al. [33] proposed the adoption of a regional planning method to crop out defective images roughly in the preprocessing stage and to remove a large number of redundant images, finally using Faster R-CNN to train the images.
Of course, with the in-depth study of deep learning, in addition to creating more and better deep neural network structures and algorithms, certain good detection effects can be obtained by improving the existing neural network structure, algorithm and optimization parameters for specific detection objects. For example, Cheon, et al. [34] used scanning electron microscopy images to acquire images of wafer surface defects, and improved the deep learning Automatic Defect Classification (ADC) methods to classify defects; and Li, et al. [35] proposed a surface defect detection method based on the mobile net–Single Shot MultiBox Detector (SSD) framework. The goal is to simplify the detection model without sacrificing accuracy. This is the reason for the optimization of the model structure and parameters from a practical point of view. This research objects also have certain specificities.
Among all of the above deep learning methods, there is no detection method for large images and small objects. Currently, the network structure that can directly detect small objects using deep neural networks is YOLOv3, but it cannot detect fine and micro objects, and so people will use other auxiliary means to achieve the purpose. For example, Cha, et al. [36] used 256 × 256 small images to participate in training after image pre-processing and then detected 5888 × 3584 large images based on convolutional neural networks. Tang, et al. [37] proposed a multi-view object detection method based on deep learning, due to the weak ability of detecting small objects in classical object detection methods based on regression models, and experimented with multi-view YOLO, YOLO2, SSD, improving the accuracy and speed in small object detection; Tayara, et al. [38] proposed object detection in very high-resolution aerial images using a one-stage densely connected feature pyramid network, by which high-level multi-scale semantic feature maps with high-quality information are prepared for object detection. This work has been evaluated on two publicly available datasets and outperformed the current state-of-the-art results both in terms of mean average precision (mAP) and computation time. However, these small objects do not have a clear definition. These detected images are not large enough; that is, for a high-precision large image to detect fine or micro defects, there will be two problems: one is whether large images can participate training and whether the detected speed can meet the actual needs of production, while the other is that when the proportion of micro defects in the image is large, they can be detected. This paper will give partial solutions to these.
The feature of the detection object in this paper is the micro-fine defect, highlighted on the surface of the metal shaft; when the image resolution reaches 16,384 × 4096,a small group of pixels with a minimum of 80 points or fine lines with a width of 4 pixels can be detected. The classification of this defect proportion has not been studied before. According to the previous research results, it is still challenging to use existing deep learning technology for such features to achieve good classification results. The following solutions are adopted in the research.
Firstly, the data set of surface defects of the metal shafts was collected in the project, and the image of highlighted shaft surface defects was obtained by line scanning; secondly, the proposed ResNet [39] convolvutional neural network feature extraction is combined with the Faster-R-CNN [40] object detection model for the detection of metal shaft surface defects, and the structure and parameter of the ResNet model is adjusted and optimized for defect detection; third, we realize the detection and classification of a 16,384 × 4096largeimageof a small object by screen capture; fourth, the ResNet convolutional neural network is embedded in the Faster-R-CNN program framework, which can be changed later by replacing the convolutional neural network, realizing the scalability application of practical object detection and classification. In addition, due to the disadvantages of positive and negative sample screening methods, a method to increase the number of positive samples is proposed base on IoU multiple values; finally, the method of improving the recall, precision and accuracy rate is analyzed based on the experimental results. A limiting condition is proposed in this paper when using an existing deep learning network system in industry.
The rest of the paper is organized as follows; The system construction of the industry application and Faster R-CNN is described in Section 2. Data collection is introducted in Section 3. The system framework design is shown in Section 4. The experiment parameters setting, operation, ablation experiments, and performance evaluations are discussed in Section 5. Finally, the conclusions are presented in Section 6.
2. System Overview
The defect detection of this project is part of an automated assembly line. The resolution of the image obtained by line scanning is 16,384 × 4096. Due to real-time requirements, the time of image processing and detection was limited to less than 1 s. There are two ways to achieve image detection, traditional defect detection and deep learning object detection. Certainly, the throughput will be the decisive factor. The hardware configuration is Intel(R) Xeon(R) CPU E5-2620 v3@ 2.40 GHz (two cores), RAM:32 GB, single chip Graphic Processing Unit(GPU):GTX1080Ti. Comparison experiment results are shown in Table 1.

Table 1.
Throughput comparison base on different image resolution.
Table 1 shows that traditional defect detection methods have to be selected, due to the operation times is far less than 1 s. It is obviously, the whole detection system and construction have to be considered as follow.
The entire defect detection and classification is split into two stages: the first stage is used to quickly screen out qualified and unqualified products, and this part of the inspection is installed in the assembly line. The image preprocessing and the identification of defects are included in the first stage. As this stage involves Computer Unified Device Architecture (CUDA)-based and other fast algorithms, it is beyond the scope of this article. The second stage is defect classification system for the unqualified products that have been screened out. The system is not installed in the assembly line, and the time of defect classification do not have real-time requirements, because there are few unqualified products every day according to the plant product data, so the deep learning based on deep convolutional neural network is studied in this paper.
This project is proposed for the detection of micro-fine defects of a minimum of 0.3 mm or so. The resolution of the image obtained by line scanning is 16,384 × 4096. In the training stage, we do not need to train this resolution image as a sample. Excessive sample data will cause the training speed to be very slow, and there is a problem of positive and negative sample imbalance. In the prediction stage, if the whole scan image is input into the object detection model, the prediction speed will be abnormally slow, or the object cannot be realized because the object is too small.
The defect image of 16,384 × 4096 generated by line scanning and image preprocessing in the screening stage of non-conforming products is shown in Figure 2. The basic feature is that the proportion of defective images is very small. The smallest recognition image is only about 80 pixels. The use of convolutional neural networks and current popular object detection is very difficult and the detection will fail to classify defects. In addition, the defect images we need to classify are relatively simple and are basically based on image geometric images. According to these characteristics, the whole processing system is as follows: firstly, a large number of 500 × 500 images containing a single defect are manually constructed according to the actual defects of the shaft, then they are labelled and manually input into the convolutional neural network for learning, and finally the model is obtained. In this scheme, the image generated by the screening stage is used for the defect search, and after finding the 500 × 500 image (the insufficient portion is filled with 0), it is extended around the defect point, and the intercepted image is in put to model for recognization, then the marked results output; meanwhile, we obtain the coordinate position of the detected point. The system overview is shown in Figure 2.
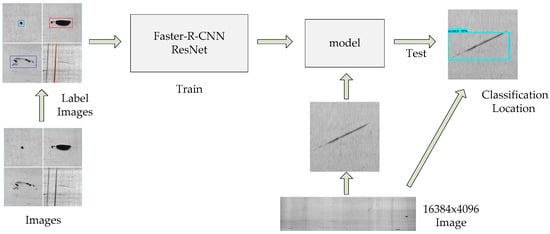
Figure 2.
System overview, CNN: Convolutional Neural Network.
The internal structure system diagram of the Faster R-CNN is shown in Figure 3. The scheme is divided into two modules: one is based on the Region Proposal Network (RPN) are a proposal network module, which is used to generate candidate regions; the other is based on Faster R-CNN classification network module, which is used to detect and classify candidate regions generated by the RPN. Firstly, we input the pre-processed line-scan image of the metal shaft, and the image is pre-processed. The convolution feature map is extracted by the shared convolutional neural network; then, the candidate region is quickly generated through the RPN network, and the redundant candidate bounding box is initially eliminated by non-maximum suppression. Then, the candidate bounding box is extracted by the Region of Interest(ROI) pooling layer, and the Softmax multi-classification and bounding box regression are directly output through the fully connected layer in the convolutional neural network; finally, the final output is obtained by the non-maximum suppression fine screening bounding box.

Figure 3.
Faster R-CNN system overview. ROI: Region of Interest.
3. Dataset
In this paper, the method of machine vision detection is used to classify defects, and so it is necessary to obtain the image information of the defects. However, the surface of the metal shaft is polished and the finish is high. The ordinary photos will produce severe highlights. The effect of highlights on the images is very serious. A camera with a normal global exposure may not be able to capture the defect information very well, which has a great influence on the final result and the performance of the model. Therefore, this paper uses line scanning to avoid highlights during the imaging of the metal shaft surface, thus obtaining a higher quality picture. The scanned defect picture is shown in Figure 4a,b: (a) is a normal picture, (b) is a picture of the worst condition, and Figure 5 is an enlarged view of the four defects.
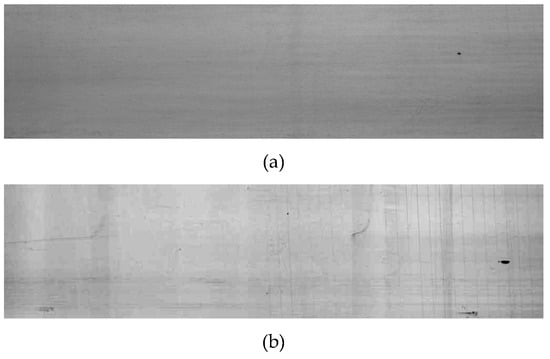
Figure 4.
Typical line scanning image, (a) Normal image, (b) Bad image.
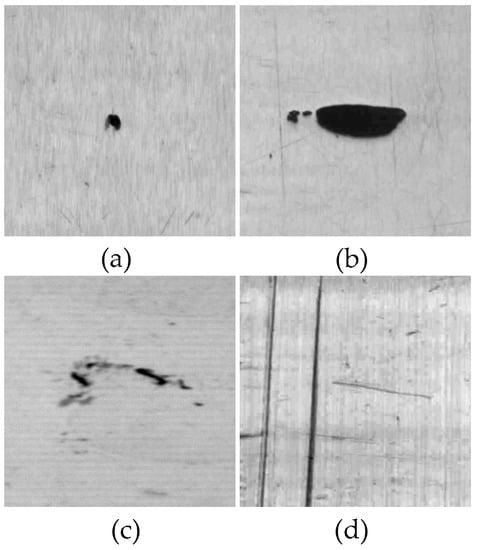
Figure 5.
Enlarged defect, (a) pits, (b) breach, (c) abrasion, (d) scratch
As mentioned earlier, the original image for training is obtained by line scanning, and then the defect image is manually cut out, and these images are used for training. Some images undergo variations to expand the training samples. The training image collected by this project has a resolution of 500 × 500. The line scan experiment device is shown in Figure 6. The samples of training imagesareshown in Figure 7.
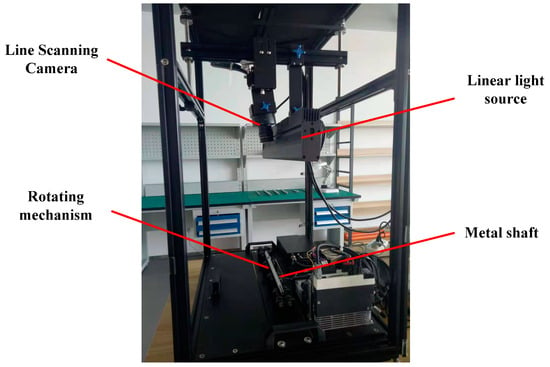
Figure 6.
Line scanning facility.
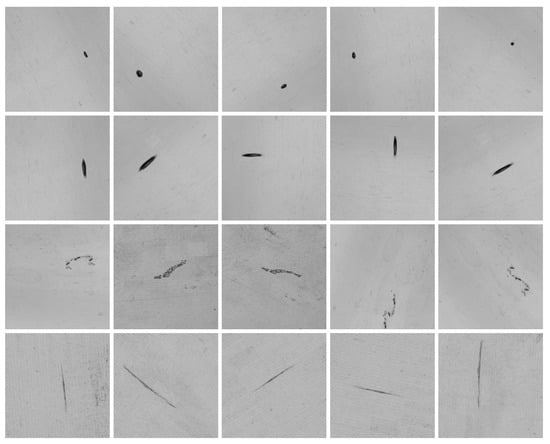
Figure 7.
Sample for training.
4. Design
Applying the deep learning object detection technology to the industry is a current trend, but since the pattern of the metal shaft defect image is clearly different from the current popular daily photo image, the bounding box structure and the convolutional neural network feature of the object detection are selected. Some modifications are needed to extract the algorithm. This section describes the detailed design and modification of the Faster R-CNN network structure to accommodate metal shaft surface defect detection.
4.1. Convolutional Layer Sharing Mechanism
In Faster R-CNN, the Region Proposal Network (RPN) and the classification network use a shared convolutional layer to extract features. Compared with the selective search method, the speed of the candidate region generated by the RPN can be increased by about 10 times, which can effectively shorten the detection time.
4.2. Feature Extraction Network Structure Design
Since we are facing industrial production, although the graphics are simple, the reliability of feature extraction is very high. ZFNet [41] is used in the original paper describing Faster R-CNN, and VGG-Net [42] and other networks are used later. According to some references, and considering the various advantages and disadvantages and reliability, it is more reliable when ResNet-101 is used as the feature extraction network for deep learning.
ResNet was proposed by Kaiming He et.al. of the Microsoft Research Institute and won the ILSVRC2015 competition. Its parameter quantities are lower than VGGNet and the recognition accuracy is higher than VGGNet. At the same time, ResNet is a very popular network structure that can be combined with many different structures of neural networks. The ResNet101 feature extraction network shares four kinds of residual learning units. The network structure is shown in Figure 8.
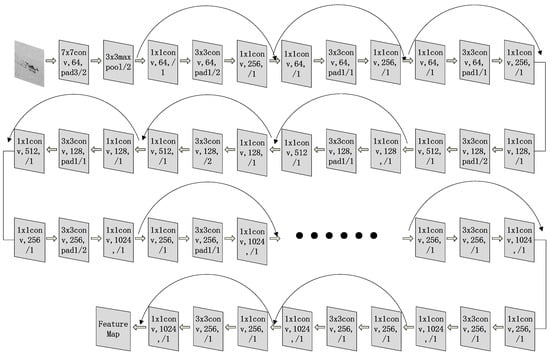
Figure 8.
ResNet-101 feature extraction.
4.3. RPN Network Structure Design
The input image of the RPN can be any size; the output is a set of rectangular target candidate regions and the score of each region. The specific design has been described in detail in the original paper and other documents. The network structure is shown in Figure 9.
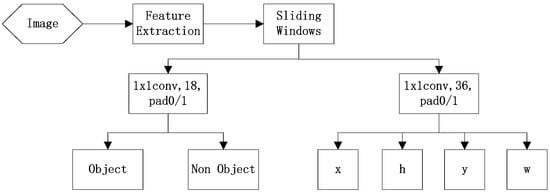
Figure 9.
Region Proposal Network (RPN) implementation process.
4.4. Classification Network Structure Design
The RPN is only responsible for the generation of candidate regions, and the region after the generation needs a classification network to be designed to identify it. Here, based on the characteristics of the detected image, a general method for improving the positive sample is proposed.
The classification network maps the candidate regions generated by the RPN back to the feature map. The candidate regions contain positive and negative samples, where the positive samples represent the defect regions, the negative samples represent the non-category regions, and the positive and negative samples are filtered according to the IoU (Intersection-over-Union). The calculation formula of IoU is shown in Equation (1); that is, the intersection area between the real border A and the predicted border B divided by the union between the real border A and the predicted border B:
Usually, positive and negative samples have a great impact on the performance of the model. In general, it is necessary to maintain an approximately 1:3 ratio of positive and negative samples to achieve the best classification effect. If IoU is greater than a certain threshold, it can be classified as a positive sample. If IoU is less than a certain threshold, it will be used as a negative sample. In the general object recognition field, IoU takes a value of 0.5 as the judgment value for dividing the positive and negative samples. In practice, in the RPN output stage, the IoU screening threshold of the positive and negative samples needs to be adjusted. Here, since the identified objects are different in the detected image, the pits and the breaches are small, and the abrasion and scratches are large; thus, the small target defects such as the pit and the breach defects are sensitive to the offset of the bounding box. It is easy to treat this as a negative sample, resulting in too many positive samples and too few positive samples. Therefore, using 0.5 as the screening threshold in the identification of shaft surface defects obviously produces a large number of negative samples. Here, we propose a multiple IoU value setting idea; the principle is shown in Figure 10, where border 1 is the ground truth (real border) generated by our label, and border 3 and border 2 are all converted from the anchor. Now, let IoU=x, and below the value of x (generally x = 0.5), we then select two IoU values: x1 and x2, and 0 < x1 < x2 < x. Assuming the IoU value of border 3 and border 1 and the IoU value of border 2 and border 1 are between x1 and x2, respectively, both will be judged as positive samples. However, although the IoU value of border 2 and border 1 are within the screening range of the positive sample, the defect object is not within border 2, and it is obviously undesirable for this to be judged as a positive sample. For border 3, with the same IoU value, the defect object is obviously in bounding box 3, and its judgmentas positive sample is suitable. Thus, we will discard the candidate regions generated by the small-size anchor and select the candidate regions generated by the large-size anchor.
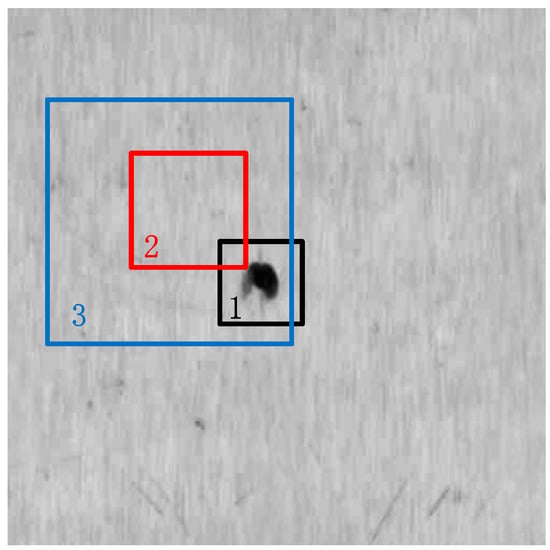
Figure 10.
New positive and negative sample screening.
The screening process of positive and negative samples is shown in Figure 11. The IoU between the input candidate region and the ground truth is directly discriminated as a negative sample if IoU < x1; if x1 < IoU < x2 (let x2=x),the candidate region generated by the anchor of 1282 (the largest-size group) is used as a positive sample, and the rest as a negative sample; if IoU > x2, it is determined as a positive sample. If x2 is not equal to x, the chance of the selection of positive samples can be increased again.

Figure 11.
Flow chart of positive and negative sample screening.
After the candidate region is obtained, a feature is extracted for the region using the ROI (Region of Interest) pooling layer for the candidate region bounding box. The fully connected layer is used directly by the conventional classification network after the ROI pooling layer. The fully connected layer has two outputs: one for classification and another for bounding box regression. Regarding the classification, for the metal shaft surface defect detection project, since there are four types of defects in the project, it is necessary to add an “N/A class” for the case of unknown class defects in the candidate region, meaning the output of the final classification amounts to five categories. The box regression is used to calibrate the original detection bounding box, because the position of the candidate bounding box generated by the RPN network may have errors.
4.5. Non-Maximum Suppression
Non-maximum suppression is one of the commonly-used algorithms in the field of computer vision. Its main function is to suppress elements that are not maxima and search for local maxima. In the field of object detection, the effect of non-maximum suppression is to remove a large number of overlapping bounding boxes, so that the final detection object position is more accurate, because the redundant bounding box will have a great influence on the detection object positioning.
In this project, in order to ensure the positioning accuracy, we will use the non-maximum suppression algorithm to reject the redundant bounding box twice, after the RPN and after the classification network, where the non-maximum suppression after the RPN network is the coarse elimination of the redundant bounding box, and the non-maximum suppression after the classification network is the fine elimination of the redundant bounding box.
5. Experiments
5.1. Parameter Setup
After the software structure design is completed, the selection and setting of system parameters is very important. The parameters were chosen and optimized in this paper as follows.
5.1.1. Loss Function Setting
In the process of Faster-R-CNN training, a loss of multitasking results; i.e., the classification information and the bounding box position information need to be corrected. The total mission loss of the Faster R-CNN network consists of the loss of the RPN, the fine-tuning loss of the classification network, and the L2 regularization loss.
The Faster R-CNN loss function formula is shown in Equation (2). L represents the total loss value of Faster R-CNN, Lp represents the loss value of the RPN, LC represents the fine-tuning loss value of the classification network trimming, and LR represents the regularization loss value of the weight value, which is L2:
(1) RPN region proposal network loss function
The final output of the RPN involves two parts: one part is the binary classification output—i.e., it is the object or it is not the object—and the other part is the bounding box regression output including the center coordinates and size of the candidate bounding box. The total loss of the defined RPN is the sum of two loss functions, as shown in Equation (3):
where i is the i-th anchor, pi is the probability that the i-th anchor predicts that it is the object, pi* represents the i-th anchor’s real category. If pi* = 1 represents the detection object, pi* = 0 means it is not a detection object. Ti is a 4-dimensional vector representing the position and size of the i-th anchor, and ti* represents the real position and size of the i-th anchor. For the classification, the loss function Lcls uses Softmax Loss, with two categories. For the bounding box regression, the loss function is Smooth L1 Loss, and pi*Lreg means that the loss function of the bounding box regression is calculated only when pi* = 1; that is, when the anchor detects the object, then it calculates the loss of the bounding box regression. The loss of classification and bounding box regression needs to be normalized with Ncls and Nreg and parameters to speed up the convergence of iterative calculations and prevent divergence. Ncls and Nreg represent the sample size and the number of anchors that each sent in random small batch iteration, respectively. represents the equilibrium parameters. The function of this is to balance the weight between the classification loss function and the bounding box regression loss function. The values will be adjusted based on Ncls and Nreg. For the bounding box regression, we use the four coordinates as shown in Equation (4):
where x, y, w, and h represent the center coordinates and dimensions of the RPN output bounding box, xa, ya, wa, and ha represent the center coordinates and dimensions of the anchor, and x*, y*, w*, and h* represent the center coordinates and demensions of the real bounding box.
(2) Classification network fine-tuning loss function
The classification network fine-tunes the loss function in the same form as the RPN. The difference from the RPN loss function is the two-part content of the output of the classification network: the first part is the object category—here, according to this item, there are 5 categories—and the second part is the center coordinate and size of the bounding box regression output bounding box, but the number of candidate bounding boxes is different from the RPN, because a large number of untargeted and overlapping blocks are removed in the RPN screening anchor and non-maximum suppression.
(3) L2 regularization loss function
The main function of the regularized loss function is to add an index describing the complexity of the model to the loss function. By limiting the weight value, the model cannot arbitrarily fit the random noise in the training data, which can effectively prevent over-fitting after the model training. The commonly-used regularization comprises two kinds of function: L1 and L2. Here, we use the L2 regularization loss function, because the L1 regularization loss function will make the parameters sparse, while the L2 regularization will not be similar, and secondly, because the L2 regularization function is derivable, while the L1 regularization function is non-derivable. We use a random small batch gradient descent algorithm for training; there are a large number of derivation operations, and it is easier to calculate these using the L2 regularization loss function. The formula for the L2 regularization loss function is shown in Equation (5):
The regularization coefficient can be used to adjust the fitting strength to prevent over-fitting and under-fitting. Wi is the weight parameter value of the model.
5.1.2. Model Optimization Method Settings
The neural network model optimization algorithm is the key of model training. Through the optimization, the loss value is gradually reduced and finally reaches convergence. The selection of the optimization method directly determines the quality of the model. Here, we use the gradient descent algorithm [43] as the model optimization algorithm, because the gradient descent algorithm can be used well for large-scale data set optimization. The iterative formula is shown in Equation (6), where the weight parameters are , and is the learning rate:
The commonly-used gradient descent algorithms include batch gradient descent, random gradient descent, and small batch gradient descent. Compared with the three gradient descent algorithms, the batch gradient descent algorithm is suitable for the calculation of small sample sizes; the random gradient descent algorithm is suitable for large sample size online learning; and the small batch gradient descent is suitable for the general case. The data to be trained in the metal shaft surface defect detection and recognition project is currently a relatively large amount of data, and the training samples are completed offline, without real-time requirements, and so to comprehensively consider the advantages and disadvantages of the three gradient descent algorithms, we select the small batch gradient descent algorithm to be used as the optimization algorithm.
5.1.3. Learning Rate Settings
In the previous section, we chose the small batch gradient descent algorithm as the optimization method of the model. For the gradient descent algorithm, the learning rate setting is a very important factor. An overly high learning rate may cause the iteration to oscillate near the minimum value and not converge, while too small a learning rate may cause the iteration convergence to be too slow.
In order to avoid manual adjustment of the learning rate, here we use the adaptive learning rate optimization gradient descent algorithm to automatically adjust the learning rate. Currently, the commonly-used adaptive learning rate gradient descent algorithm optimizers are Adagrad, Adadelta, RMSprop and Adam. After comparing the advantages and disadvantages of each optimizer and the pre-project conditions, the Adam optimizer is selected as the gradient descent algorithm optimizer for this project.
5.1.4. Moving Average Parameter Setting
In order to train the model generalization ability by the random gradient descent training neural network more strongly, the sliding average model is adopted in the training process of the model. The sliding average model maintains a shadow variable for each variable parameter in the neural network. The initial value of the shadow variable is the initial value of the corresponding variable. When each iteration parameter variable is updated, the value of the shadow variable is also updated at the same time. The update formula is as shown in Equation (7), where s is the shadow variable and is the decay rate. Generally, when the number is close to 1 (such as 0.999), is the variable parameter to be updated:
The attenuation rate determines the update speed of the model. The larger the attenuation rate is, the more stable the model is. In order to better control the update speed of the model and get a better model, we set the attenuation rate dynamically by the number of iterations. The updated formula of the decay rate is as shown in Equation (8), where t represents the t-throunds:
5.2. Experimental Parameters
According to the characteristics of the detected image and the above parameter setting analysis, the optimization of the parameter setting is divided into the following three parts:
- (1)
- The first part is the setting of the model parameters. The setting of the model parameters includes the number of categories, the feature extraction network-related settings, the first candidate region generation network setting, the first prediction network hyper parameter setting, non-maximum value suppression setting, loss function parameter setting, pooling kernel parameter setting, second prediction network hyper parameter setting, second bounding box regression parameter setting, positive and negative sample screening IoU threshold, and so on. The specific parameter settings are shown in Table 2.
 Table 2. Model parameter settings.
 - (2)
- The second part is the setting of training parameters. The training parameter setting includes one training data point, the optimization method, moving average, model file saving path and so on. The specific parameter settings are shown in Table 3.
 Table 3. Training parameter settings.
 - (3)
- The third part is the setting of the evaluation parameters. The evaluation parameter settings include the number of evaluation samples, the evaluation data input path, the label path, and so on. The specific parameter settings are shown in Table 4.
 Table 4. E valuation parameter settings.
5.3. Experimental Operation
The hardware configuration of the object detection model training and prediction is shown as Section 2.The GPU model is the GeForce GTX1080Ti-11GD5X Extreme PLUS OC, the core frequency is 1544~1657 MHz, and the stream processing unit is 3584. The operating system is Windows Server 2012 R2, and the operating environment is Anaconda3.5, Tensorflow 1.8.0 and Cudnn9.0.
The training steps of the metal shaft surface defect object detection model in this project are shown in Figure 12. Firstly, we set the training parameters of the model; then, we import the previously prepared metal shaft surface defect data set into the model and convert the data set into the TFRecord file format—the TFRecord data file is a binary file that stores the image data and the label, which better uses the memory, and allows fast copying, moving, reading, storing, etc. in Tensorflow—due to the random small batch gradient descent algorithm iteration, the data in the TFRecord file is randomly disorganized and then batched in small batches, and the input model is calculated in the graph; then, the calculation graph is determined for forward propagation, and the result of the forward propagation is returned; the model is saved once every 100 rounds. To determine whether the number of iterations is a multiple of 100, if the number of iterations is A multiple of 100, the model file is saved by the Tensorflow model, and the model file generated during the training process can be tested and adjusted on the verification set; then, it is judged whether the number of iterations reaches 30,000 rounds, and the iteration is stopped when it arrives. If it is not reached, the weight parameter is updated by back propagation, and the next iteration is entered and TFRecord queue file is read again; if the number of iterations is not a multiple of 100, the reverse is spread directly into the updated weight parameters, into the next iteration. The final trained model is the ckpt file. When the prediction is made, the image to be detected is directly placed in the folder to be detected. The system automatically reads the file and imports the predicted model to calculate and display the result. In order to speed up training and forecasting, the CUDA parallel computing program was called throughout.
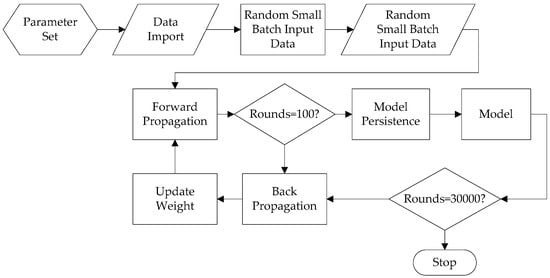
Figure 12.
Training step.
The experiment verified and predicted the pictures. Figure 13, Figure 14 and Figure 15 show the detection effects of the three types of defects in single-image single-object, single-image double-object, single-image three-object.
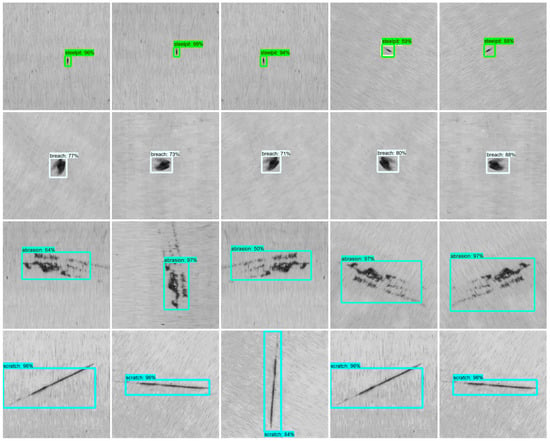
Figure 13.
Faster R-CNN+ ResNet101 single object recognition effect.
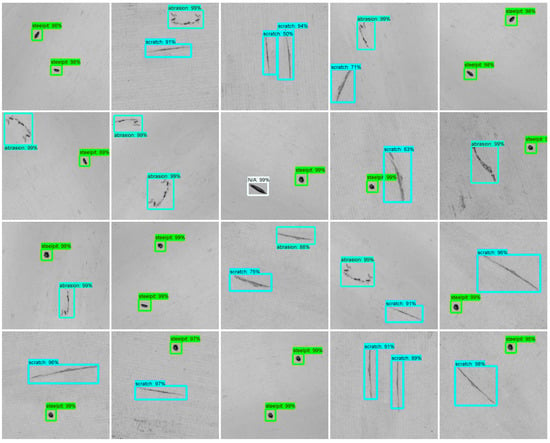
Figure 14.
Faster R-CNN+ ResNet101 dual object recognition effect.
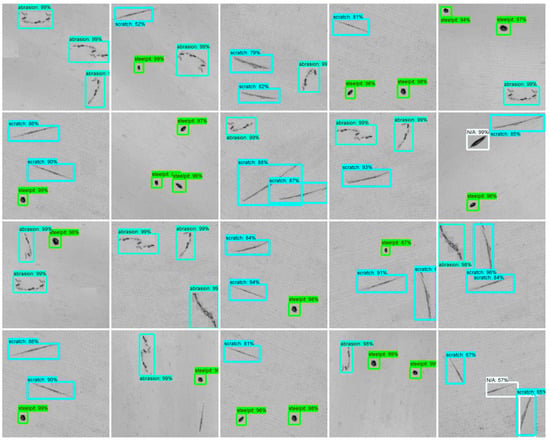
Figure 15.
Faster R-CNN+ ResNet101 three-object recognition effect.
5.4. Performance Evaluation
At present, the most commonly-used model evaluation methods in the field of deep learning are the error rate and accuracy rate evaluation, F1 evaluation, mAP, etc. Each evaluation method has its own advantages and disadvantages.
(1) Error rate and accuracy rate
Error rate and accuracy rate are the most commonly used evaluation methods in the classification field. The applicability is very strong. The error rate is the ratio of the number of samples with incorrect classification to the total number of samples. The accuracy rate is the ratio of the number of samples with the correct classification to the total number of samples.
Regarding the classification, it is assumed that for the data set containing n samples, there is a corresponding prediction result , where x is the defect picture sample, y is the defect real label, and Y is the prediction result by the object detection model, and the error and accuracy rate formula is as shown in Equations(9) and (10):
The accuracy rate assessment in the project can meet the project requirements.
(2) Recall rate, precision rate and F1 assessment
The recall ratio is the proportion of the number of predicted samples in all samples. The precision ratio is the ratio of the number of examples of accurate predictions to the total number of prediction samples in all prediction examples in which the prediction result is a certain category. For the classification problem, the combination of the real category and the prediction category can be divided into real cases, false positive cases, true counterexamples, and false counterexamples, and the numbers are represented by TP, FP, TN, and FN, respectively. Then, the calculation formula of the recall ratio is as shown in Equation (11):
The formula of the precision ratio is as shown in Equation (12):
The recall rate and the precision rate are a pair of contradictory measures. The higher the recall rate, the lower the precision; the lower the recall rate, the higher the precision. In the general classification problem, to balance the recall rate and the precision rate, it is necessary to find a balance point between the recall rate and the precision rate. The F1 assessment is based on the harmonic mean of the precision and recall. By calculating F1, the equilibrium can be established. The formula for F1 is shown in Equation (13):
(3) mAP assessment [44]
Mean average accuracy (mAP) is the most commonly used evaluation criterion in object detection. In common classification problems, recall and precision are the most commonly-used statistics. However, in object detection, we also need to confirm the position of the object in the image, and so this is different from the normal classification in calculating the recall ratio and precision ratio.
The mAP calculation is based on the IoU between the predicted bounding box and the real bounding box. We calculate the IoU of each detection bounding box and compare it with the calculated IoU value and the threshold (usually set to 0.5), then we obtain the number of correct detections in each image.
The object position in this project is not required to be accurate. Because it is a small object in a big image, the approximate position has been determined by the screenshot during the screening stage (not covered in this paper). Therefore, mAP is not used as an evaluation criterion. According to production requirements, as long as the probability of a certain defect is greater than a certain value (for example, greater than 50%), and in order to meet a certain value of accuracy rate, precision rate and recall rate, the evaluation criterion of the classification model system meets the production requirements.
5.5. Experimental Evaluation and Discussion
According to the evaluation method of the classified image, the following gives the experimental analysis and evaluation of the single object situation. On the multi-objective experimental results, as shown in Figure 13, Figure 14 and Figure 15. Because there are few multi-target situations in practice, this case is for reference only and not discussed in the paper.
For verification and evaluation results of deep learning, ablation experiments are needed and as follows: First, verification and evaluation prediction results base on training and non-training images; Then, discussion and evaluation influence the factors of detecting results base on ablation experiments of deep learning system; Finally, analysis some issues for unrecognized and incorrectly identified.
5.5.1. Using Training Image Prediction
The performance evaluation using the training image prediction is shown in Table 5.

Table 5.
Four-defect evaluation using training images (no negative samples).
It can be seen from Table 5 that the recognition rate of the breach is relatively low, the detection is N/A, and the recognition rate of the other three defects is relatively high.
5.5.2. Non-Training Image Prediction
The performance evaluation using non-training image prediction is shown in Table 6.

Table 6.
Four-defect evaluation using non-training images (no negative samples).
It can be seen from Table 6 that the accuracy rate of the breach is much lower, which is basically consistent with the prediction using the training image. Moreover, the geometric image is simple, the pits and breach detection rates for small sizes are low, the complex images can be all detected, and all are correct.
Actually, when using a non-training image for detection, the correct ratio will be determined by the similarity between the image being trained and the image being detected; otherwise, the “N/A” condition will occur, e.g., Figure 21(a), but there were almost no undetected cases.
5.5.3. Ablation Studies
Ablation study is usually used in relatively complex neural networks for verification and research network feature by cancel parts network structure or module. But the project is a application project, and Faster R-CNN+ResNet101 is a mature and classic model, it is just used as a module in whole application system, so it’s not necessary to do ablation experiments on the network structure. But as a whole defect detection application system, it is necessary to do ablation studies, i.e., the ablation research method of original meaning is transplanted into the research for the whole deep learning defect detection system.
The detection system involves five modules, i.e., image capture, image, filtering de-noising, image segmentation, Faster R-CNN image recognition:
(1) Image capture module. It involves shooting and lighting. If the original image in the project is removed, but the image obtained under unstable shooting and lighting conditions are used, the images have different contrast, brightness, uneven illumination and the like. These images are tested by the defect of this system, and the effect is shown in Figure 16.
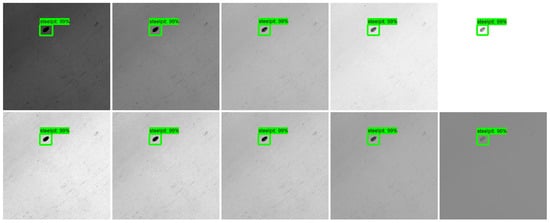
Figure 16.
Object detection under different brightness and contrast conditions.
As can be seen from Figure 16, under different background conditions of shooting and illumination, as long as the defect image can be visually identified, it can be detected.
(2) Image module. If do not cut the image, but use the image directly taken, and the shape is different, the image resolution is original, the object detection effect is shown in Figure 17.
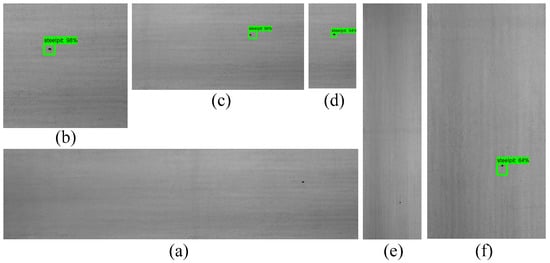
Figure 17.
Object detection of original images of different shapes (a) 16384x4096, (b) 4096x4096, (c) 8192x4096, (d) 2048x4096, (e) 4096x16384, (f) 4096x8192.
As can be seen from Figure 17. The resolution of original image (a), (e) is 16,384 × 4096 and 4096 × 16,384, (a), (e) can’t be detected because of the image size is too big. When the original image size is small enough, the defect can be detected. In addition, when the shape of the detected image and the shape of the training image do not match, the defect can still be detected.
(3) Filtering de-noising module. If the image is not filtered, it contains various typical noises. This kind of image directly performs the object detection effect as shown in Figure 18.
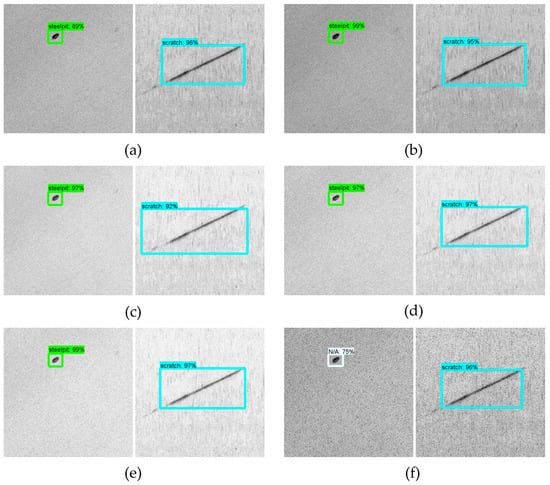
Figure 18.
Object detection under different noise backgrounds, (a) Gaussian, (b) Rayleigh, (c) Erlang, (d) Exponential, (e) Uniform, (f) Salt & pepper.
As can be seen from Figure 18, when the noise destroys the image, an identification error occurs, otherwise the conventional noise has no effect on image recognition.
(4) Image segmentation module. In this module, If the 500 × 500 resolution image is not adopted, the image with other resolutions is used, the detection effect is as follows.
(a) The image detection of different resolution
Because of the actual needs of production, sometimes, the time of image detection needs to be considered. The time of large image detection will be long, and the time of small image detection will be short. However, this involves the proportion of defect images in the detected image. The impact of this situation on the prediction results is shown in Table 7 and Figure 19.

Table 7.
Detection and evaluation of images of different resolution.
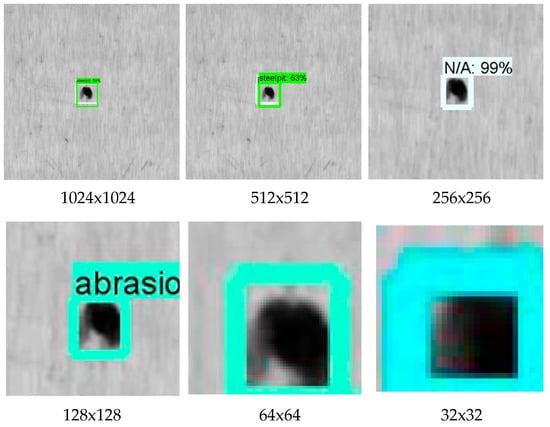
Figure 19.
Actual detection effect of pits in different-resolution images.
Table 7 shows that the prediction time of 512 × 512 images is about 4 s in the whole system without CUDA participation. The speed of detecting a picture is about 2.29 s when there is CUDA parallel computing participation. The smaller the image, the faster the detection speed. Table 7 shows the image detection speed in the case of different image resolutions and with CUDA participation. The training time of the model, training 30,000 rounds in the absence of CUDA participation, will take about 1 day; in the case of CUDA participation, the training time of about 6 h can be reached, although this training time is for reference only.
As can be seen from Table 7, in some cases, the detection result is “indefinite”, which means that different images can be detected in some cases, some cannot be detected, and some can be detected but with display errors, or N/A, or not marked. In particular, there are significant differences between small objects such as pits and breaches, and large objects such as brasions and scratches, similar to Figure 20 (2:1).
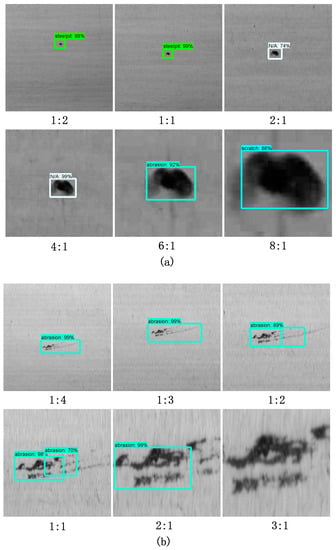
Figure 20.
Different scale defects with the same resolution, (a) Pits, (b) Abrasion.
(b) Images detection of different scales.
In the case of an image with the same resolution (consistent with the training image), when the defect image accounts for a different proportion of the entire image, the detection effect is as shown in Figure 20.
The subscript of each figure in the figure is the ratio of the enlargement and reduction of the defect. It can be seen from the figure that when small objects such as pits become larger, they are recognized as N/A, and when they become larger, they are recognized as brasions and scratches. If they become smaller, they will not be detected (there are no columns in the legend). Brasion defects cannot be recognized when enlarged more than 3 times, regardless of zooming in or out; as long as the overall shape of the defect does not change, it can always be correctly identified. The above phenomenon is very meaningful for the reliability of industrial applications.
(5) Faster R-CNN image recognition module. If don’t use the manuscript’s deep learning network, comparative studies using other deep learning models have been described in the manuscript Section 5.6.
5.5.4. Unrecognized and Incorrectly Identified Analysis
Various cases of unrecognizable defects and misidentification are shown in Figure 21. The analysis of and solution to various error phenomena are listed in Table 8.
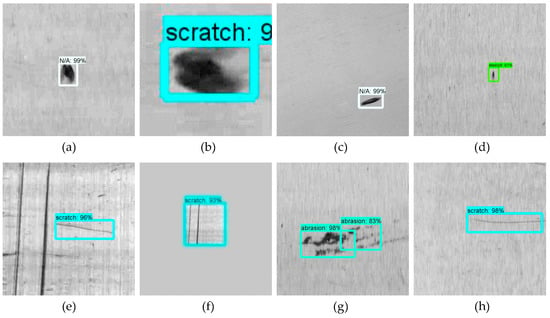
Figure 21.
Some detection legends, (a) N/A case, (b) Classification error, (c) N/A case, (d) Low similarity, (e) Unlabeled, (f) Label overlapp, (g) Multi label, (h) Normal case

Table 8.
Various misrecognition samples and analysis.
According to Table 8, it can be seen that: (1) defective images participating in training should be as comprehensive as possible—no object or a wrong object should be added during the model to upgrade training; (2) the proportions of the object to be detected must be appropriate in the image. We try to match the object image of the defect object that is involved in the training; on the other hand, the defect is basically fixed. The proportions of the defect object in the image should be consistent, and the resolution of the image should not be changed to detect it. This is an essential difference from object recognition immutability. In this project, the image obtained according to the principle of the interception of the detected image is shown in Figure 21(h). This is a typical normal case, and other images are only for reference.
According to the above analysis, in order to obtain a relatively high and reliable accuracy rate in practice, the following conditions must be met: (a) the proportion of the object to be inspected in the figure should be as close as possible to the training image; (b) when the size of the defect being detected is in the image is very different, the proportion of small objects and large objects in the image should be considered comprehensively; (c) if the trained defects are not much different in geometry and size, they should be considered unclassified.
5.6. Comparative Study
For the evaluation of deep learning classification performance, the comparison between Faster R-CNN+ResNet101 and some classical neural networks has been shown in reference [4], Table 3. The performance comparison of the network system between the Optimized Faster R-CNN and other more advanced deep learning methods such as R-FCN [45], YOLOv3 [46] is shown in Table 9. In the experiment, the same datasets were used for training, and then the same 120 mixed defect datasets were still used for prediction. Experiments show that the Faster R-CNN can have better performance than the more advanced neural network structure if the design of the framework structure is reasonable and the parameter adjustment is appropriate. Practice has shown that the advanced deep learning system is not the best object detection system for some specific detection objects in the field of industry. Of course, it should not be ruled out that advanced neural networks can be optimized and modified to achieve better performance.

Table 9.
Comparison with other advanced deep learning system.
YOLOv3 is a more advanced deep learning system than Faster R-CNN. When using standard datasets, YOLOv3 works better, but it is not very good in the defect detection of this paper. The experimental data in some reference [19] also proves at this point, Table 10 shows that there are more defects detected on pit, and the breach, abrasion and scratch images are better, but the accuracy of abrasion detection involving a large number of small points is not high. The R-FCN test results are exactly the opposite. We just analysis some reason between Faster R-CNN and YOLOv3. Reason analysis:(a) YOLOv3 input image is a fixed image of 416 × 416 resolution, Faster R-CNN input image size is variable and much smaller than 416 × 416, so when extracting features, small targets like pits and small dots can easily lose useful information for inputting large images. Dimmed small images are not easy to lose useful information; (b) YOLOv3 requires a large number of training samples, and Faster R-CNN does not require a large number of training samples, so under the same sample quantity conditions, when Faster R-CNN achieves good results, YOLOv3 is not as good as Faster R-CNN.

Table 10.
YOLOv3 comparison study for four detects base on non-training image.
Certainly, over-fitting must be considered, to prove the model for comparison in the project is the comparable one. The reasons of over-fitting of deep learning include training sample quantity, model and match between the two, etc. Because the training sample quantity is fixed for comparability, so a suitable model has to be selected. To prevent over-fitting, a suitable model is generated by adjusting net architecture, early stopping, regularization and adding noise, etc. But the image and YOLOv3 (YOLOv3 is from another mature trademark recognition project) are fixed, that means, early stopping is a good choice.
In order to select a suitable model, the early stop strategy is applied in YOLOv3 training. Figure 22 shows accuracy, precision and recall of YOLOv3 base on different training rounds. It shows, when the training rounds is increase, the accuracy, precision and recall will gradually stabilize. In fact, on the project, involving simple geometric images (e.g., pits) and complex geometric images (e.g., abrasion), with the increase of training rounds, a fewer simple geometric images that can’t be detected, complex geometric images can be detected, but the repetition rate and error rate of detection is higher. These problems are out of the scope of this paper.
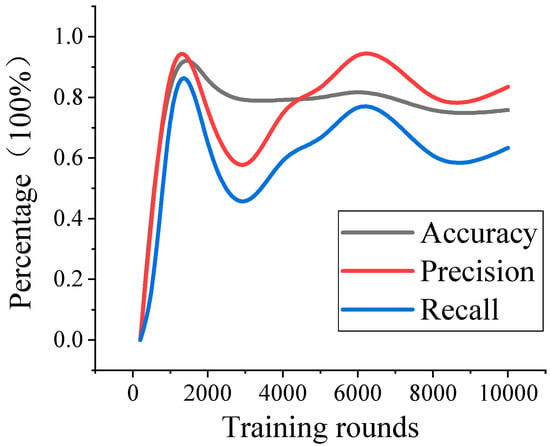
Figure 22.
Evaluation against different training.
In addition, in order to determine whether the models used for comparison are significantly over-fitted, the cross-validation is usually adopted, i.e., the training data set is used for testing. The result shows that the accuracy, precision and recall tested using the training image is better than the test results with non-training data. Because of the line scan defect image is very different from civil image, so cross-validation can’t be used as a basis for judgment.
6. Conclusions
Because of the requirements of saving production costs, it is necessary to classify defective shafts. The classification of micro-fine defects on the polished shaft surface is a challenging aspect of research. For the characteristics of defects, a deep neural network-based machine learning system using artificial intelligence is proposed. Experimentation proves that the methods can be applied to production practices. The research in this paper draws the following conclusions:
- 1)
- The Faster-R-CNN object detection framework with the ResNet101 convolutional neural network feature extraction algorithm can be applied to industrial practical environments
- 2)
- The limiting condition is the proportion of the detected object in the whole image, which should be as close as possible to the training image when using an existing deep learning network system in industry. This is different from the image size invariance of object detection and image processing fields.
- 3)
- As long as the defect is visually identifiable in the image, background interference, brightness, and contrast have little effect on image recognition; the shape of the detected image has no effect on the detection.
- 4)
- A processing method for large image small object is proposed to meet the requirements of deep learning model for processing high precision large image base on polishing shaft scanning image.
- 5)
- It is theoretically feasible to increase the number of positive samples by setting multiple IoU values, and the method is necessary in practice. Further proof is left for the next step work.
Author Contributions
Conceptualization, S.J. and Y.L.; methodology, S.J. and D.T.; software, Q.J., C.C. and Q.Z.; validation, Q.J. and Q.Z.; formal analysis, Q.J. investigation, Q.J.; resources, Q.J. and C.C.; data curation, Q.J.; writing—original draft preparation, Q.J.; writing—review and editing, D.T.; supervision, S.J. and Y.L.; project administration, S.J.; funding acquisition, Y.L. All authors have read and agreed to the published version of the manuscript.
Funding
This research received no external funding.
Conflicts of Interest
The authors declare no conflict of interest. The authors declare no conflict of interest.
References
- Jia, H.B.; Murphey, Y.L.; Shi, J.J. An intelligent real-time vision system for surface defect detection. In Proceedings of the 17th International Conference on Pattern Recognition, Cambridge, UK, 23–26 August 2004; pp. 239–242. [Google Scholar]
- Aleixos, N.; Blasco, J.; Navarron, F.; Moltó, E. Multispectral inspection of citrus in real-time using machine vision and digital signal processors. Comput. Electron. Agric. 2002, 33, 121–137. [Google Scholar] [CrossRef]
- Choonjong, K.; Josea, V.; Karim, T. A neural network approach for defect identification and classification on leather fabric. J. Intell. Manuf. 2000, 64, 485–499. [Google Scholar]
- Stojanovic, R.; Mitropulos, P.; Koulamas, C.; Karayiannis, Y.; Koubias, S.; Papadopoulos, G. Real-time vision-based system for textile fabric inspection. Real Time Imagin. 2001, 7, 507–518. [Google Scholar] [CrossRef]
- Li, L.; Qi, H.; Yin, Z.; Li, D.; Zhu, Z.; Tangwarodomnukun, V.; Tan, D. Investigation on the multiphase sink vortex Ekman pumping effects by CFD-DEM coupling method. Powder Technol. 2019. [Google Scholar] [CrossRef]
- Fucheng, Y.; Lifan, Z.; Yongbin, Z. The research of printing’s image defect inspection based on machine vision. In Proceedings of the 2009 International Conference on Mechatronics and Automation, Changchun, China, 9–12 August 2009; IEEE: Piscataway, NJ, USA, 2009; pp. 2404–2408. [Google Scholar]
- Ma, J. Defect detection and recognition of bare PCB based on computer vision. In Proceedings of the 2017 36th Chinese Control Conference (CCC), Dalian, China, 26–28 July 2017; IEEE: Piscataway, NJ, USA, 2017; pp. 11023–11028. [Google Scholar]
- Pan, Y.; Ji, S.; Tan, D.; Cao, H. Cavitation based soft abrasive flow processing method. Int. J. Adv. Manuf. Technol. 2019. [Google Scholar] [CrossRef]
- McCulloch, W.S.; Pitts, W. A logical calculus of the ideas immanent in nervous activity. Bull. Math. Biophys. 1943, 5, 115–133. [Google Scholar] [CrossRef]
- Rosenblatt, F. The perceptron: A probabilistic model for information storage and organization in the brain. Psychol. Rev. 1958, 65, 386–408. [Google Scholar] [CrossRef]
- Rumelhart, D.E.; Hinton, G.; Williams, R.J. Learning representations by back-propagating errors. Nature 1986, 323, 533–536. [Google Scholar] [CrossRef]
- Li, L.; Tan, D.; Yin, Z.; Li, D.; Zhu, Y.; Zheng, S. Ekman boundary layer mass transfer mechanism of free sink vortex. Int. J. Heat Mass Transfer 2019. [Google Scholar] [CrossRef]
- Tan, D.P.; Li, P.Y.; Ji, Y.X.; Wen, D.H.; Li, C. SA-ANN-based slag carry-over detection method and the embedded WME platform. IEEE Trans. Ind. Electron. 2013, 60, 4702–4713. [Google Scholar] [CrossRef]
- Tan, D.P.; Li, L.; Zhu, Y.L.; Zheng, S.; Ruan, H.J.; Jiang, X.Y. An embedded cloud database service method for distributed industry monitoring. IEEE Trans. Ind. Inf. 2018, 14, 2881–2893. [Google Scholar] [CrossRef]
- Hinton, G.; Salakhutdinov, R. The dimensionality of data with neural networks. Reduc. Sci. 2006, 313, 504–507. [Google Scholar] [CrossRef] [PubMed]
- Krizhevsky, A.; Sutskever, I.I.; Hinton, G. Imagenet classification with deep convolutional neural networks. Adv. Neural Inf. Proc. Syst. 2012, 97–110. [Google Scholar] [CrossRef]
- Yi, L.; Li, G.; Jiang, M. An End-to-End Steel Strip Surface Defects Recognition System Based on Convolutional Neural Networks. Steel Res Int. 2017, 88. [Google Scholar] [CrossRef]
- Ma, L.; Xie, W.; Zhang, Y. Blister Defect Detection Based on Convolutional Neural Network for Polymer Lithium-Ion Battery. Appl. Sci. 2019, 9, 1085. [Google Scholar] [CrossRef]
- He, D.; Xu, K.; Zhou, P. Defect detection of hot rolled steels with a new object detection framework called classification priority network. Comput. Ind. Eng. 2019, 128, 290–297. [Google Scholar] [CrossRef]
- Liu, Y.; Xu, K.; Xu, J. Periodic Surface Defect Detection in Steel Plates Based on Deep Learning. Appl. Sci. 2019, 9, 3127. [Google Scholar] [CrossRef]
- Song, L.; Li, X.; Yang, Y.; Zhu, X.; Guo, Q.; Yang, H. Detection of Micro-Defects on Metal Screw Surfaces Based on Deep Convolutional Neural Networks. Sensors 2018, 18, 3709. [Google Scholar] [CrossRef]
- Xu, X.; Yang, L.; Feng, Y. Railway Subgrade Defect Automatic Recognition Method Based on Improved Faster R-CNN. Sci. Program. 2018, 2018, 1–12. [Google Scholar] [CrossRef]
- Santur, Y.; Karaköse, M.; Akin, E. A new rail inspection method based on deep learning using laser cameras. In Proceedings of the 2017 International Artificial Intelligence and Data Processing Symposium (IDAP), Malatya, Turkey, 16–17 September 2017; IEEE: Piscataway, NJ, USA, 2017; pp. 1–6. [Google Scholar]
- Sun, X.; Gu, J.; Huang, R.; Zou, R.; Palomares, B.G. Surface Defects Recognition of Wheel Hub Based on Improved Faster R-CNN. Electronics 2019, 8, 481. [Google Scholar] [CrossRef]
- Su, J.H.; Liu, S.L. Measure System of Surface Flaw and Morphology Analysis of Cylindrical High Precision Parts. Laser Optoelectron.Prog. 2014, 51, 154–158. [Google Scholar]
- Shi, Y.; Li, Y.; Wei, X.; Zhou, Y. A faster-rcnn based chemical fiber paper tube defect detection method. In Proceedings of the 2017 5th International Conference on Enterprise Systems (ES), Beijing, China, 22–24 September 2017; IEEE: Piscataway, NJ, USA, 2017; pp. 173–177. [Google Scholar]
- Xu, X.; Xuan, J.Y.; Cao, T.T.; Dai, Z.X. Surface Defect Detection of Cylindrical Metal Workpiece Based on Faster R-CNN. Softw. Guide 2019, 18, 136–139. [Google Scholar]
- Tao, X.; Zhang, D.; Ma, W.; Liu, X.; Xu, D. Automatic metallic surface defect detection and recognition with convolutional neural networks. Appl. Sci. 2018, 8, 1575. [Google Scholar] [CrossRef]
- Lien, P.C.; Zhao, Q. Product Surface Defect Detection Based on Deep Learning. In Proceedings of the 2018 IEEE 16th Intl Conf on Dependable, Autonomic and Secure Computing, 16th Intl Conf on Pervasive Intelligence and Computing, 4th Intl Conf on Big Data Intelligence and Computing and Cyber Science and Technology Congress (DASC/PiCom/DataCom/CyberSciTech), Athens, Greece, 12–15 August 2018; IEEE: Piscataway, NJ, USA, 2018; pp. 250–255. [Google Scholar]
- Lv, Q.; Song, Y. Few-shot Learning Combine Attention Mechanism-Based Defect Detection in Bar Surface. ISIJ Int. 2019, 59, 1089–1097. [Google Scholar] [CrossRef]
- Haselmann, M.; Gruber, D. Supervised machine learning based surface inspection by synthetizing artificial defects. In Proceedings of the 2017 16th IEEE international conference on machine learning and applications (ICMLA), Cancun, Mexico, 18–21 December 2017; IEEE: Piscataway, NJ, USA, 2017; pp. 390–395. [Google Scholar]
- Park, J.K.; An, W.H.; Kang, D.J. Convolutional Neural Network Based Surface Inspection System for Non-patterned Welding Defects. Int. J. Precis. Eng. Manuf. 2019, 20, 363–374. [Google Scholar] [CrossRef]
- Li, Y.T.; Xie, Q.S.; Huang, H.S.; Yao, L.G.; Wei, Q. Surface defect detection based on fast regions with convolutional neutral network. Comput. Integr. Manuf. Syst. 2019, 25, 1897–1907. [Google Scholar]
- Cheon, S.; Lee, H.; Kim, C.O.; Lee, S.H. Convolutional Neural Network for Wafer Surface Defect Classification and the Detection of Unknown Defect Class. IEEE Trans. Semicond. Manuf. 2019, 32, 163–170. [Google Scholar] [CrossRef]
- Li, Y.; Huang, H.; Xie, Q.; Yao, L.; Chen, Q. Research on a surface defect detection algorithm based on MobileNet-SSD. Appl. Sci. 2018, 8, 1678. [Google Scholar] [CrossRef]
- Cha, Y.J.; Choi, W.; Büyüköztürk, O. Deep learning-based crack damage detection using convolutional neural networks. Comput. Aided Civil Infrastruct. Eng. 2017, 32, 361–378. [Google Scholar] [CrossRef]
- Tang, C.; Ling, Y.; Yang, X.; Jin, W.; Zheng, C. Multi-view object detection based on deep learning. Appl. Sci. 2018, 8, 1423. [Google Scholar] [CrossRef]
- Tayara, H.; Chong, K. Object detection in very high-resolution aerial images using one-stage densely connected feature pyramid network. Sensors 2018, 18, 3341. [Google Scholar] [CrossRef] [PubMed]
- He, K.M.; Zhang, X.Y.; Ren, S.Q. Deep residual learning for image recognition. In Proceedings of the Computer Vision and Pattern Recognition, Las Vegas, NV, USA, 27–30 June 2016. [Google Scholar]
- Ren, S.Q.; He, K.M.; Ross, G. Faster R-CNN: Towards real-time object detection with region proposal networks. In Proceedings of the Computer Vision and Pattern Recognition, Las Vegas, NV, USA, 27–30 June 2016. [Google Scholar]
- Zeiler, M.D.; Rob, F. Computer Vision-ECCV 2014, PTI. Lecture Notes in Computer Science. In Proceedings of the 13th Europen Conference on Computer Vision (ECCV), Zurich, Switzerland, 6–12 September 2014; pp. 818–833. [Google Scholar]
- Simonyan, K.; Zisserman, A. Very Deep Convolutional Networks for Large-Scale Image Recognition. arXiv 2015, arXiv:1409.1556v6. [Google Scholar]
- Zinkevich, M.; Weimer, M.; Smola, A.J.; Li, L. Parallelized stochastic gradient descent. In Proceedings of the Conference on Neural Information Processing Systems, Vancouver, BC, Canada, 6–9 December 2010. [Google Scholar]
- Demisse, G.G.; Aouada, D.; Ottersten, D. Similarity metric for curved shapes in euclidean space. In Proceedings of the Computer Vision & Pattern Recognition, Las Vegas, NV, USA, 27–30 June 2016; pp. 5042–5050. [Google Scholar]
- Dai, J.; Li, Y.; He, K.; Sun, J. R-FCN: Object detection via region-based fully convolutional networks. In Proceedings of the Advances in Neural Information Processing Systems, Barcelona, Spain, 5–10 December 2016; pp. 379–387. [Google Scholar]
- Joseph, R.; Ali, F. YOLOv3: An incremental improvement. In Proceedings of the Computer Vision and Pattern Recognition, Salt Lake City, UT, USA, 18–23 June 2018. [Google Scholar]
© 2019 by the authors. Licensee MDPI, Basel, Switzerland. This article is an open access article distributed under the terms and conditions of the Creative Commons Attribution (CC BY) license (http://creativecommons.org/licenses/by/4.0/).