Article

Full-Scale Train Derailment Testing and Analysis of Post-Derailment Behavior of Casting Bogie

1
R&D Lab., Road Kinematics co., Ltd., Cheonan 31094, Korea
2
Department of Civil Engineering, Kangwon National University, Chuncheon 24341, Korea
3
Chungnam Railway Research Institute, Chungnam National University, Daejeon 34134, Korea
4
Department of Civil Engineering, Chungnam National University, Daejeon 34134, Korea
*
Author to whom correspondence should be addressed.
Appl. Sci. 2020, 10(1), 59; https://doi.org/10.3390/app10010059
Submission received: 10 November 2019 / Revised: 18 December 2019 / Accepted: 18 December 2019 / Published: 19 December 2019
(This article belongs to the Special Issue Buildings and Structures under Extreme Loads)

Abstract

:
In this study, a full-scale train bogie derailment test was conducted. For this, test methodologies to describe the wheel-climbing derailment of the train bogie and to obtain accurate test data were proposed. The derailment test was performed with the casting bogie for a freight train and a Rheda 2000 concrete track. Two different derailment velocities (28.08 km/h and 55.05 km/h) were considered. From the test, it was found that humps in the concrete track affected the post-derailment behavior of the bogie when the derailment velocity was 28.08 km/h. For a higher derailment velocity (55.05 km/h), significant lateral movement of the derailed bogie was observed. This lateral movement was first controlled by wheel–rail contact, followed by contact with the containment wall. Finally, the train was returned to the track center.

1. Introduction

In Korea, there were 33 train accident cases in total during the five-year period 2012–2016. Among these, derailment accidents accounted for 78.8% (26 cases) [1], and derailment occurred more often than other types of train accidents. Derailment accidents can cause catastrophic damage to a community. It is hard to prevent 100% of derailment accidents since there are always unexpected factors that can cause derailment, such as human error and natural disasters. Thus, it is necessary to develop technology to reduce damage due to derailment. This technology can be categorized as derailment protection [2,3,4].
To reduce the damage from derailment accidents, protection facilities can be installed in the railway track. In Korea, guard rails to prevent derailment are used at sharp curves, bridges, and switches, as shown in Figure 1a. Containment walls are also installed on bridges for high-speed railways (where the minimum speed of the line is 200 km/h), as shown in Figure 1b [5,6,7].
In European countries, three different types of derailment containment provisions (DCPs) are used (DCP types I, II, and III), as shown in Figure 2 [8]. The guard rail is one example of a DCP type I facility, where the DCP is installed inside the track gauge. The wheel of the derailed train comes into direct contact with the facility. DCP type II is similar to DCP type I, but is installed outside of the track gauge. DCP type III facilities are installed outside of the track, similar to DCP type II. However, they are different from DCP type II since the axis of the wheel or bogie of the derailed train impacts this type of DCP.
To verify the performance of such derailment protection facilities, tests and simulations must be conducted, including investigation of the post-derailment behavior of the train. Some researchers have conducted derailment and post-derailment simulations by using 3D finite element analysis. Researchers in Sweden [9,10] analyzed the post-derailment behavior of the wheel of a derailed train colliding with a concrete railroad sleeper. Some researchers in China [11,12,13] investigated the post-derailment dynamic behavior of a railway vehicle under earthquake excitations. Also, there have been studies simulating collision with a protective facility after the derailment of a high-speed train [2,3,4].
Full-scale derailment testing is the most reliable method to evaluate the post-derailment behavior of a train and the performance of derailment protection facilities. However, it is very difficult, and only a few such studies can be found in the literature. Wu et al. [14] performed derailment testing, but it was lab-scale testing and the speed was limited to 16 km/h. The test methods relating to train derailment, such as the derailing method and data filtering, are not well established and must be investigated.
In this study, full-scale train derailment testing was conducted. For realistic simulation of the derailment situation and reliable data acquisition from the test, a derailment device and data acquisition system were proposed. Then, from the test, the post-derailment behavior of the train was analyzed.

2. Experimental Methodologies

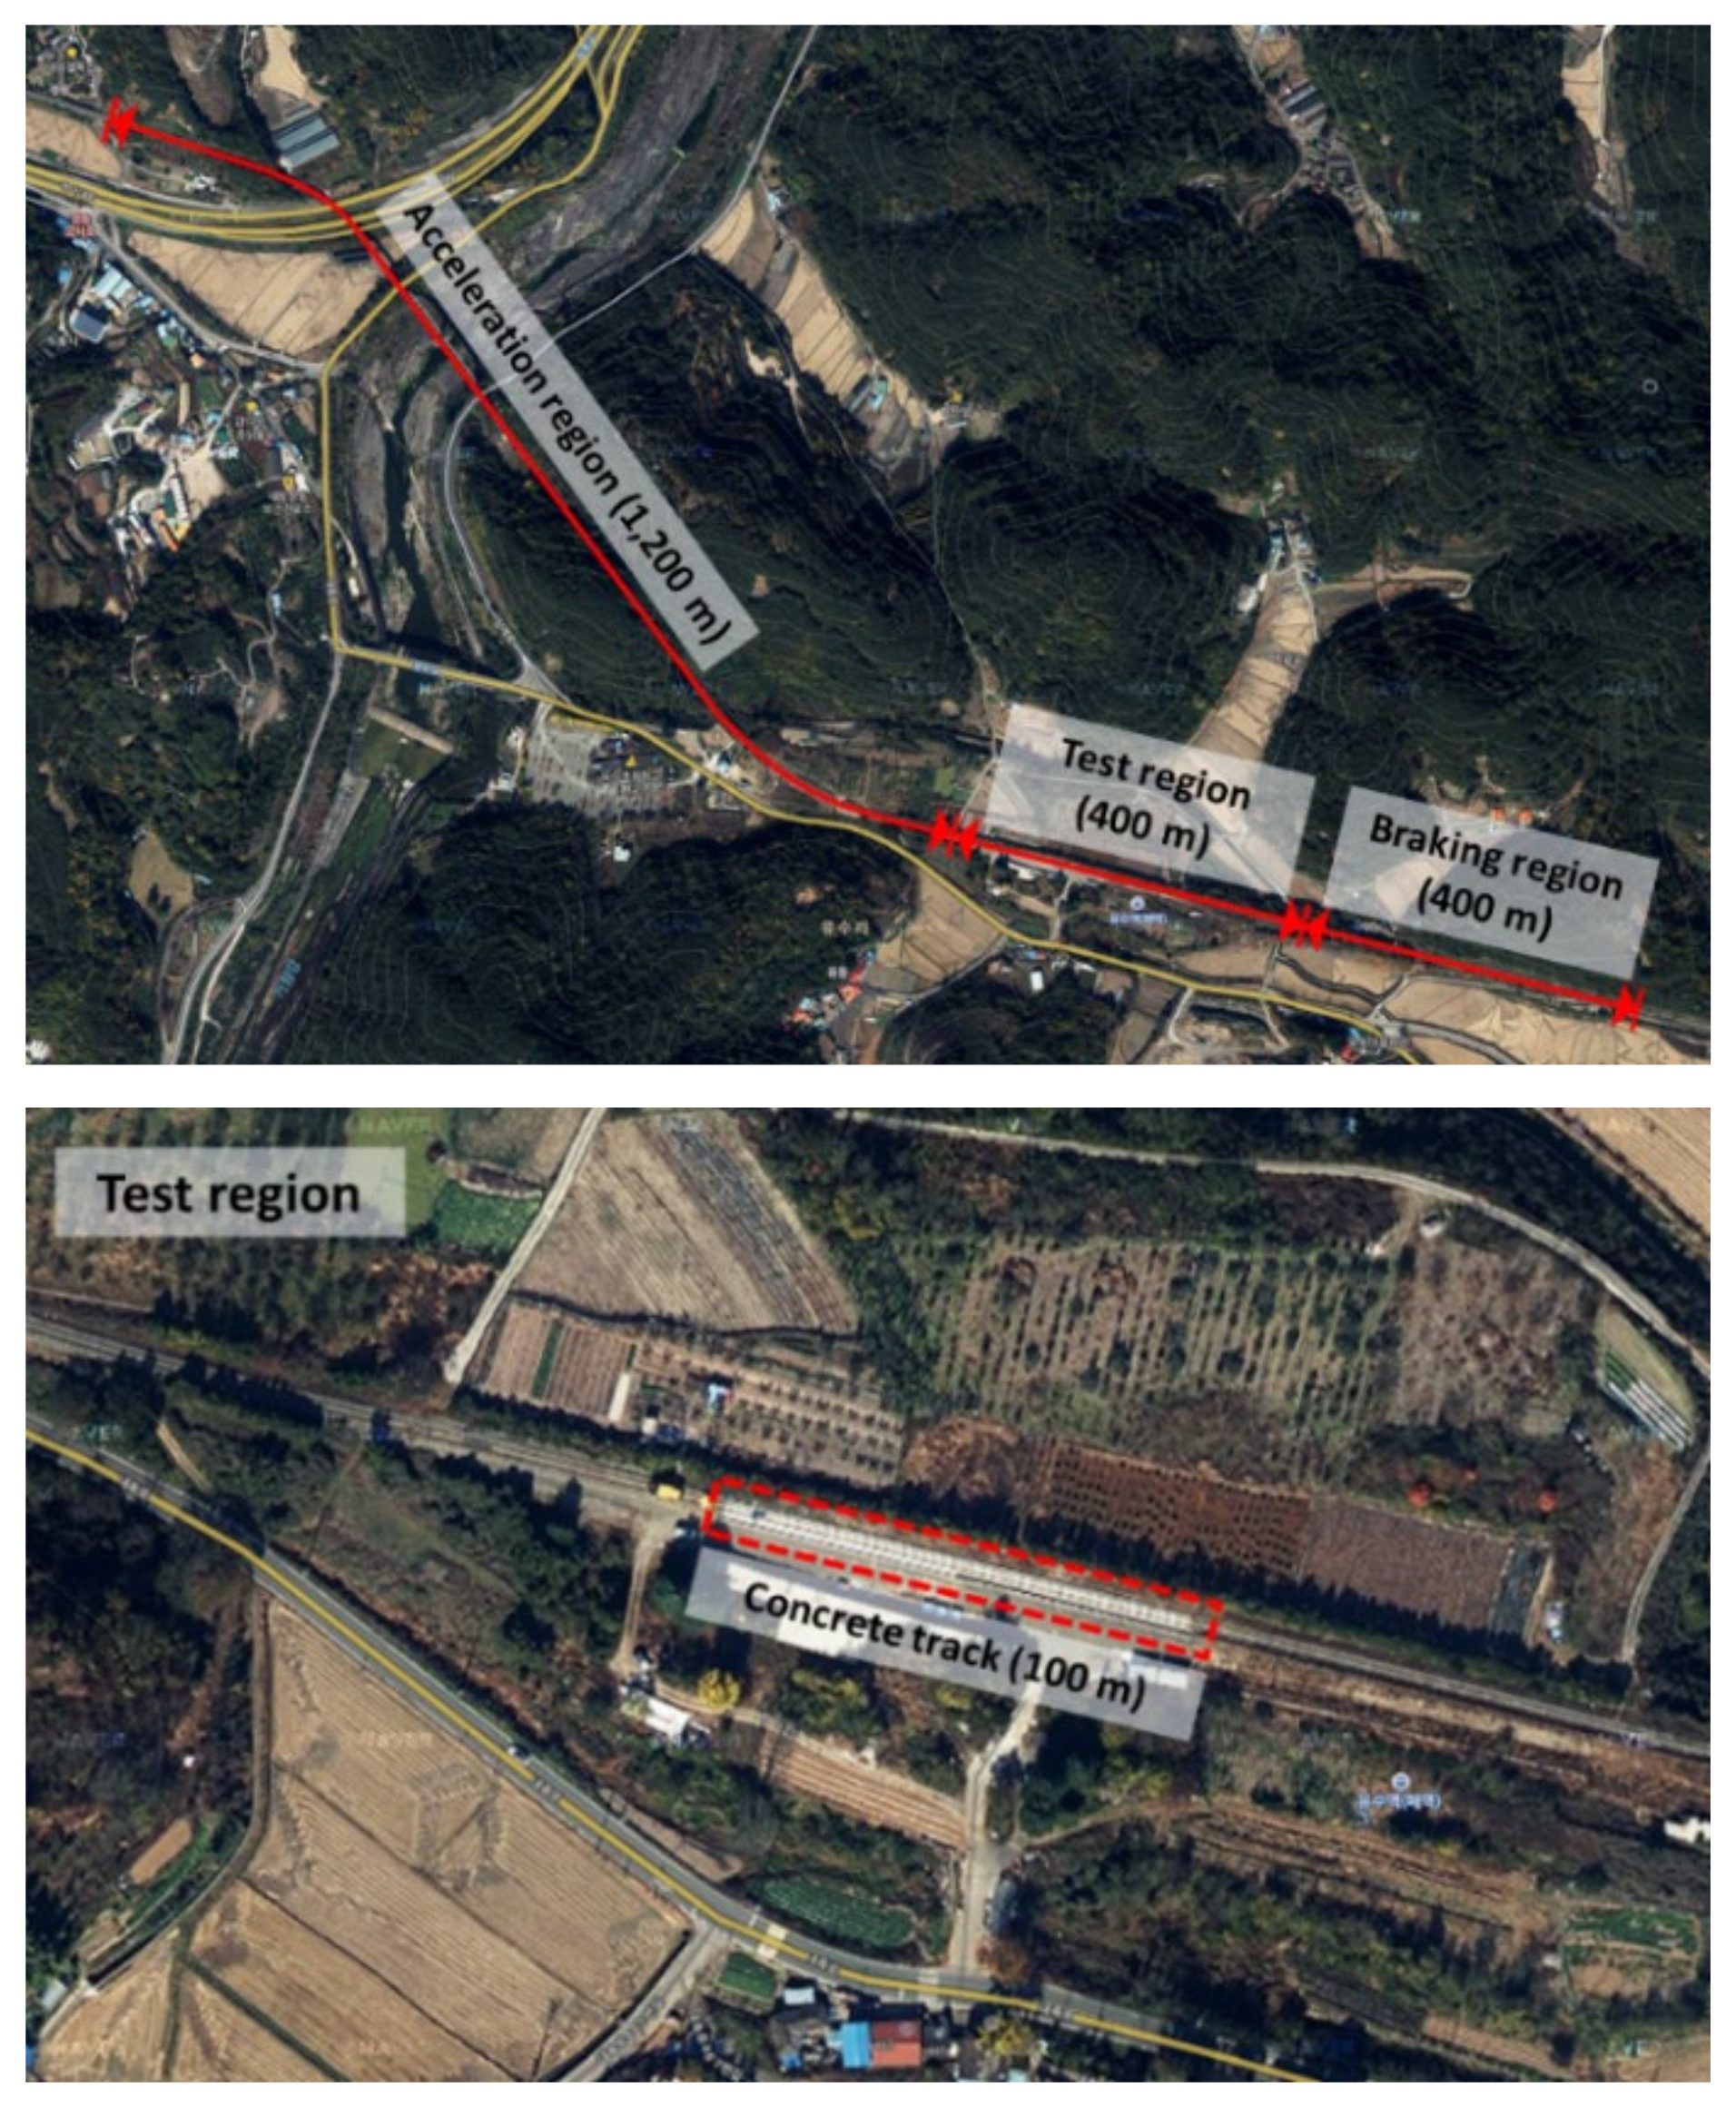
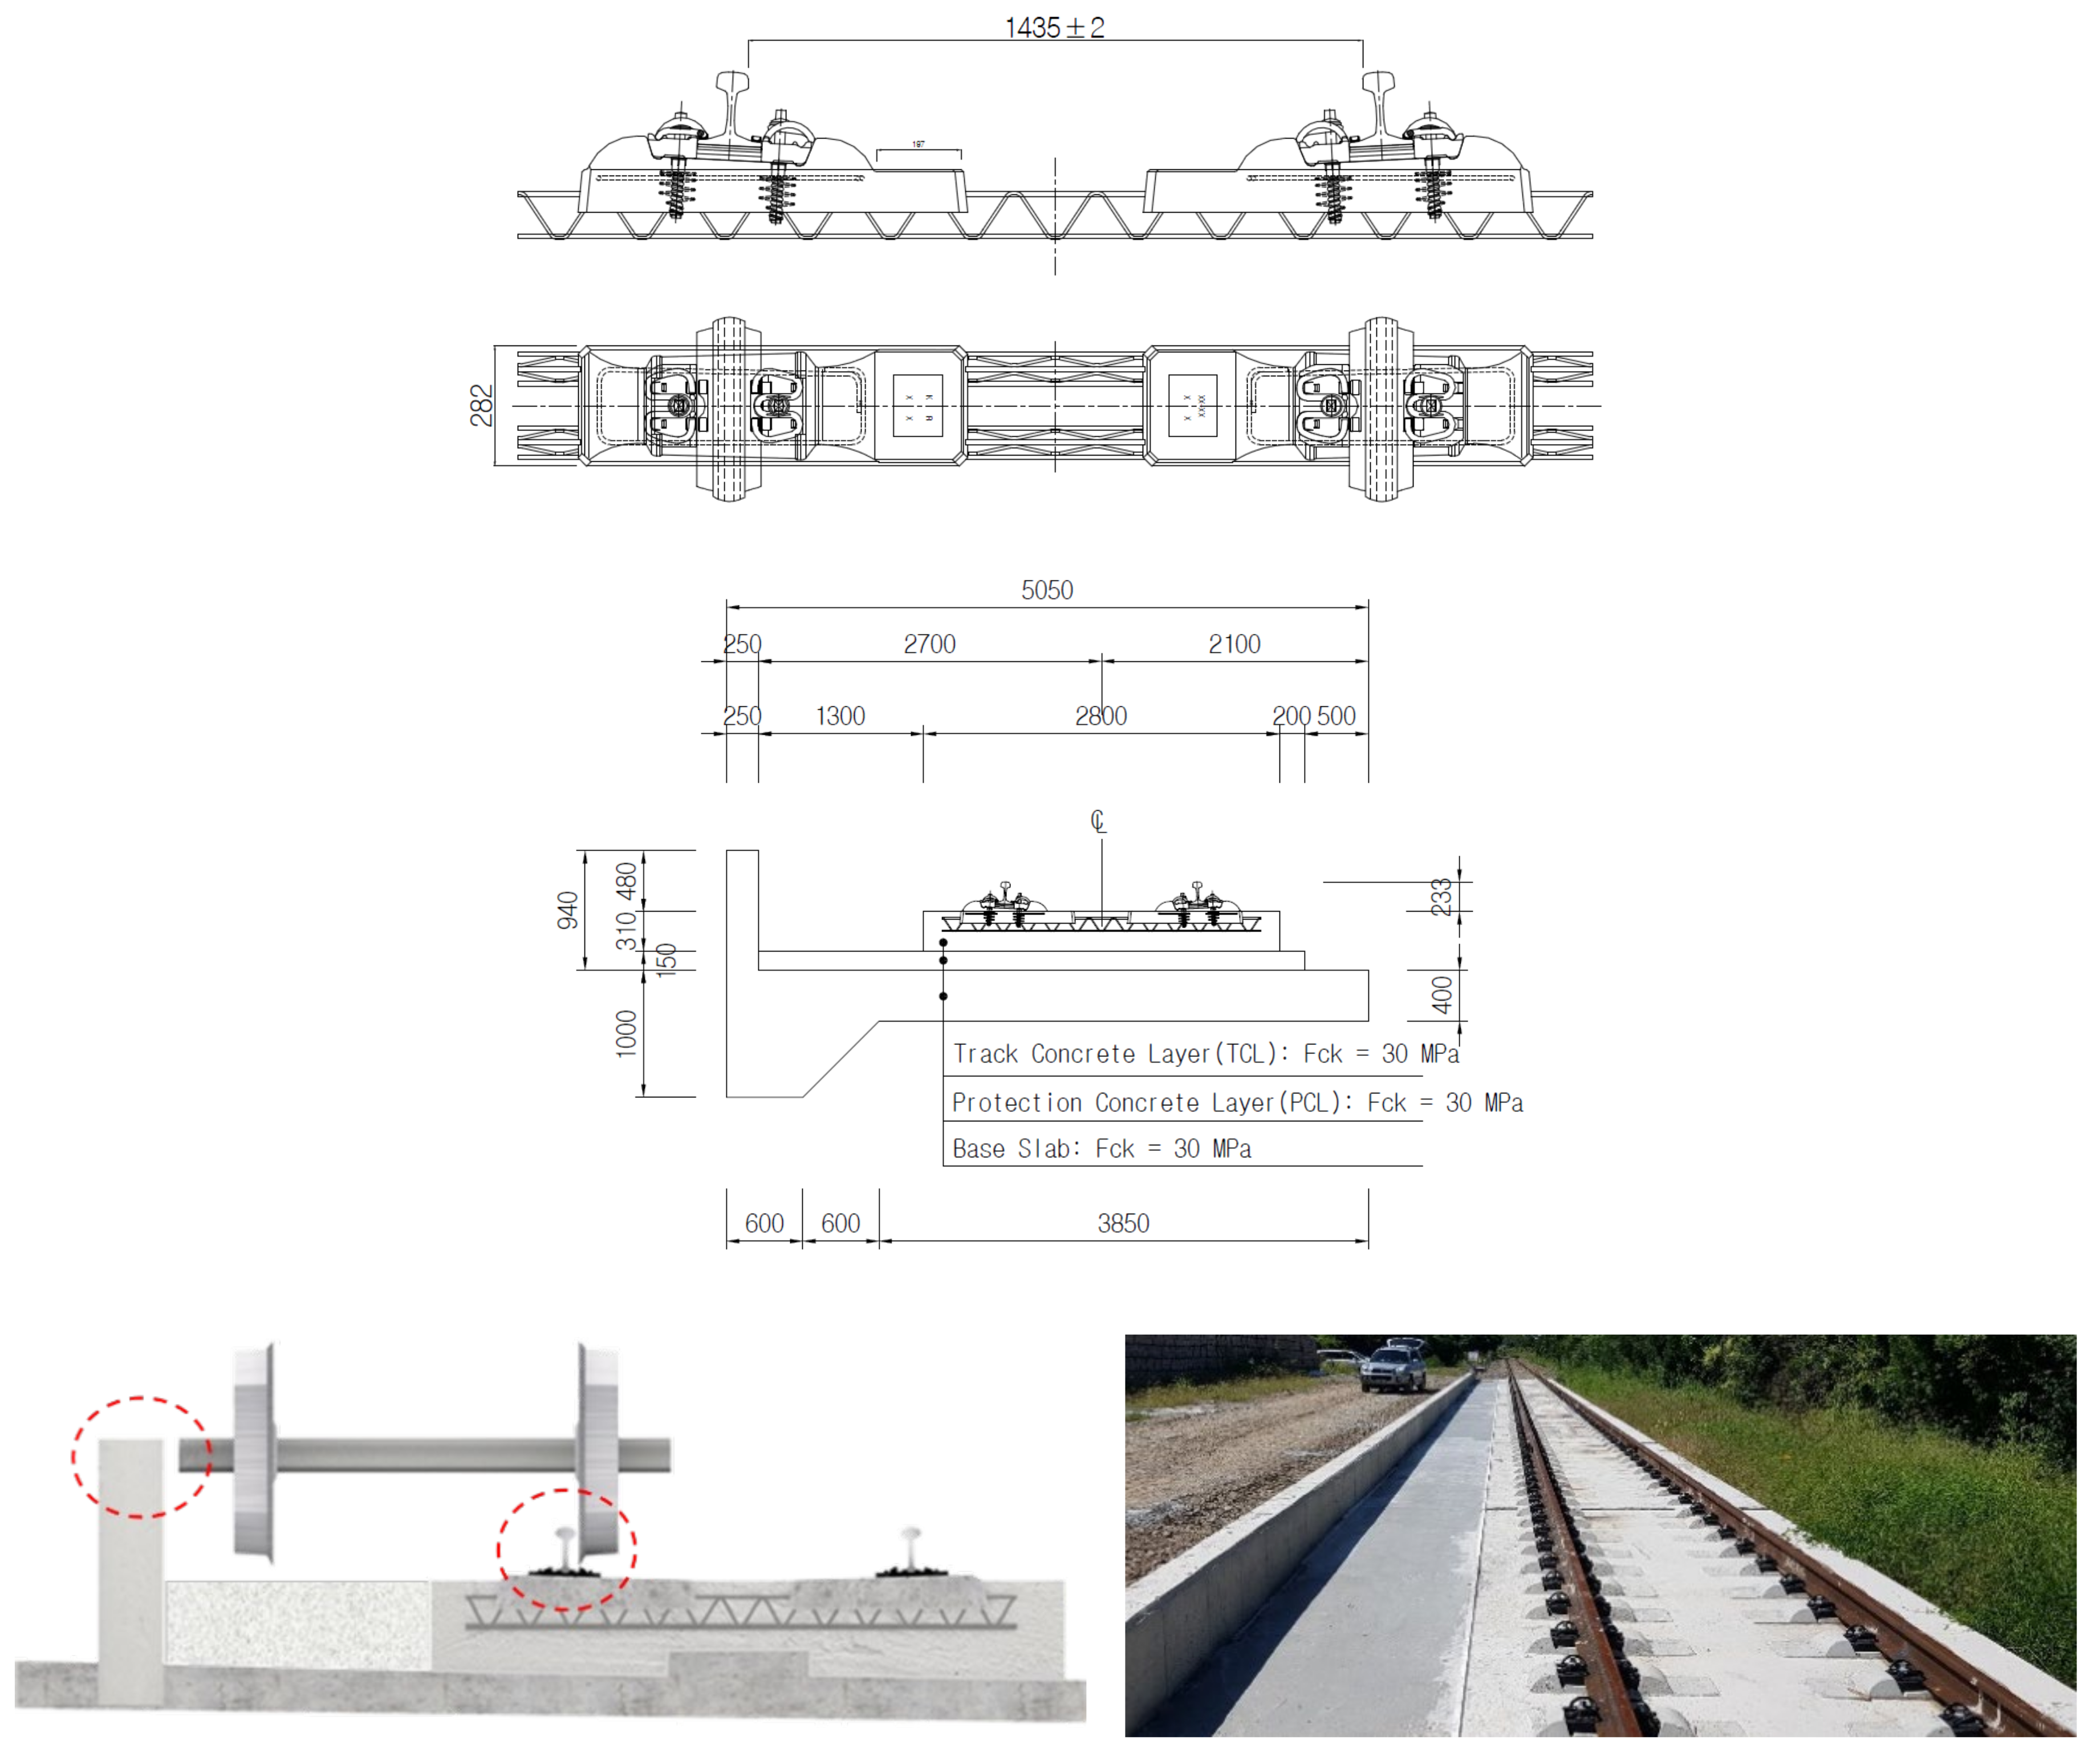
2.1. Test Site and Track

Full-scale train derailment testing requires a large test site. The test site consisted of acceleration, test, and braking regions, as shown in Figure 3. To increase the speed of the train at the point of derailment, a sufficient acceleration region is needed. Also, adequate test and braking regions should be provided to investigate the post-derailment behavior and to ensure safety, respectively. The lengths of the acceleration, test, and braking regions were 1200 m, 400 m, and 400 m, respectively. In the 400 m test region, a region of 100 m was used to construct a concrete track. The total length of the test line was about 2000 m. Once the target speed of the bogie is reached, a test bogie is released at the end of the acceleration region. The test bogie is derailed at the start of the test region and the post-derailment behavior is observed in the test region. A braking region is provided at the end of the test region. This is a margin region to provide safety after the unexpected behavior of derailed bogie or train. The derailment test site was constructed using a closed railway line to save on costs and replicate actual railway operating conditions.
In this study, the focus was on the post-derailment behavior on a concrete track. A Rheda 2000 concrete track, shown in Figure 4, was constructed in the test region where the post-derailment behavior was observed. The Rheda 2000 concrete (ballastless) track was used for the first time in Germany in 2000 as a pilot project on the new rail line between Erfurt and Halle-Leipzig. It was also installed on the high-speed railway in Korea in 2004. Apart for this 100-m concrete track, ballast tracks were used. It should be noted that the derailment containment wall was installed on the left side of the track, as shown in Figure 4. The distance between the wall and the center of the track was 2700 m, considering the geometric condition of the axle of the test vehicle after the derailment.

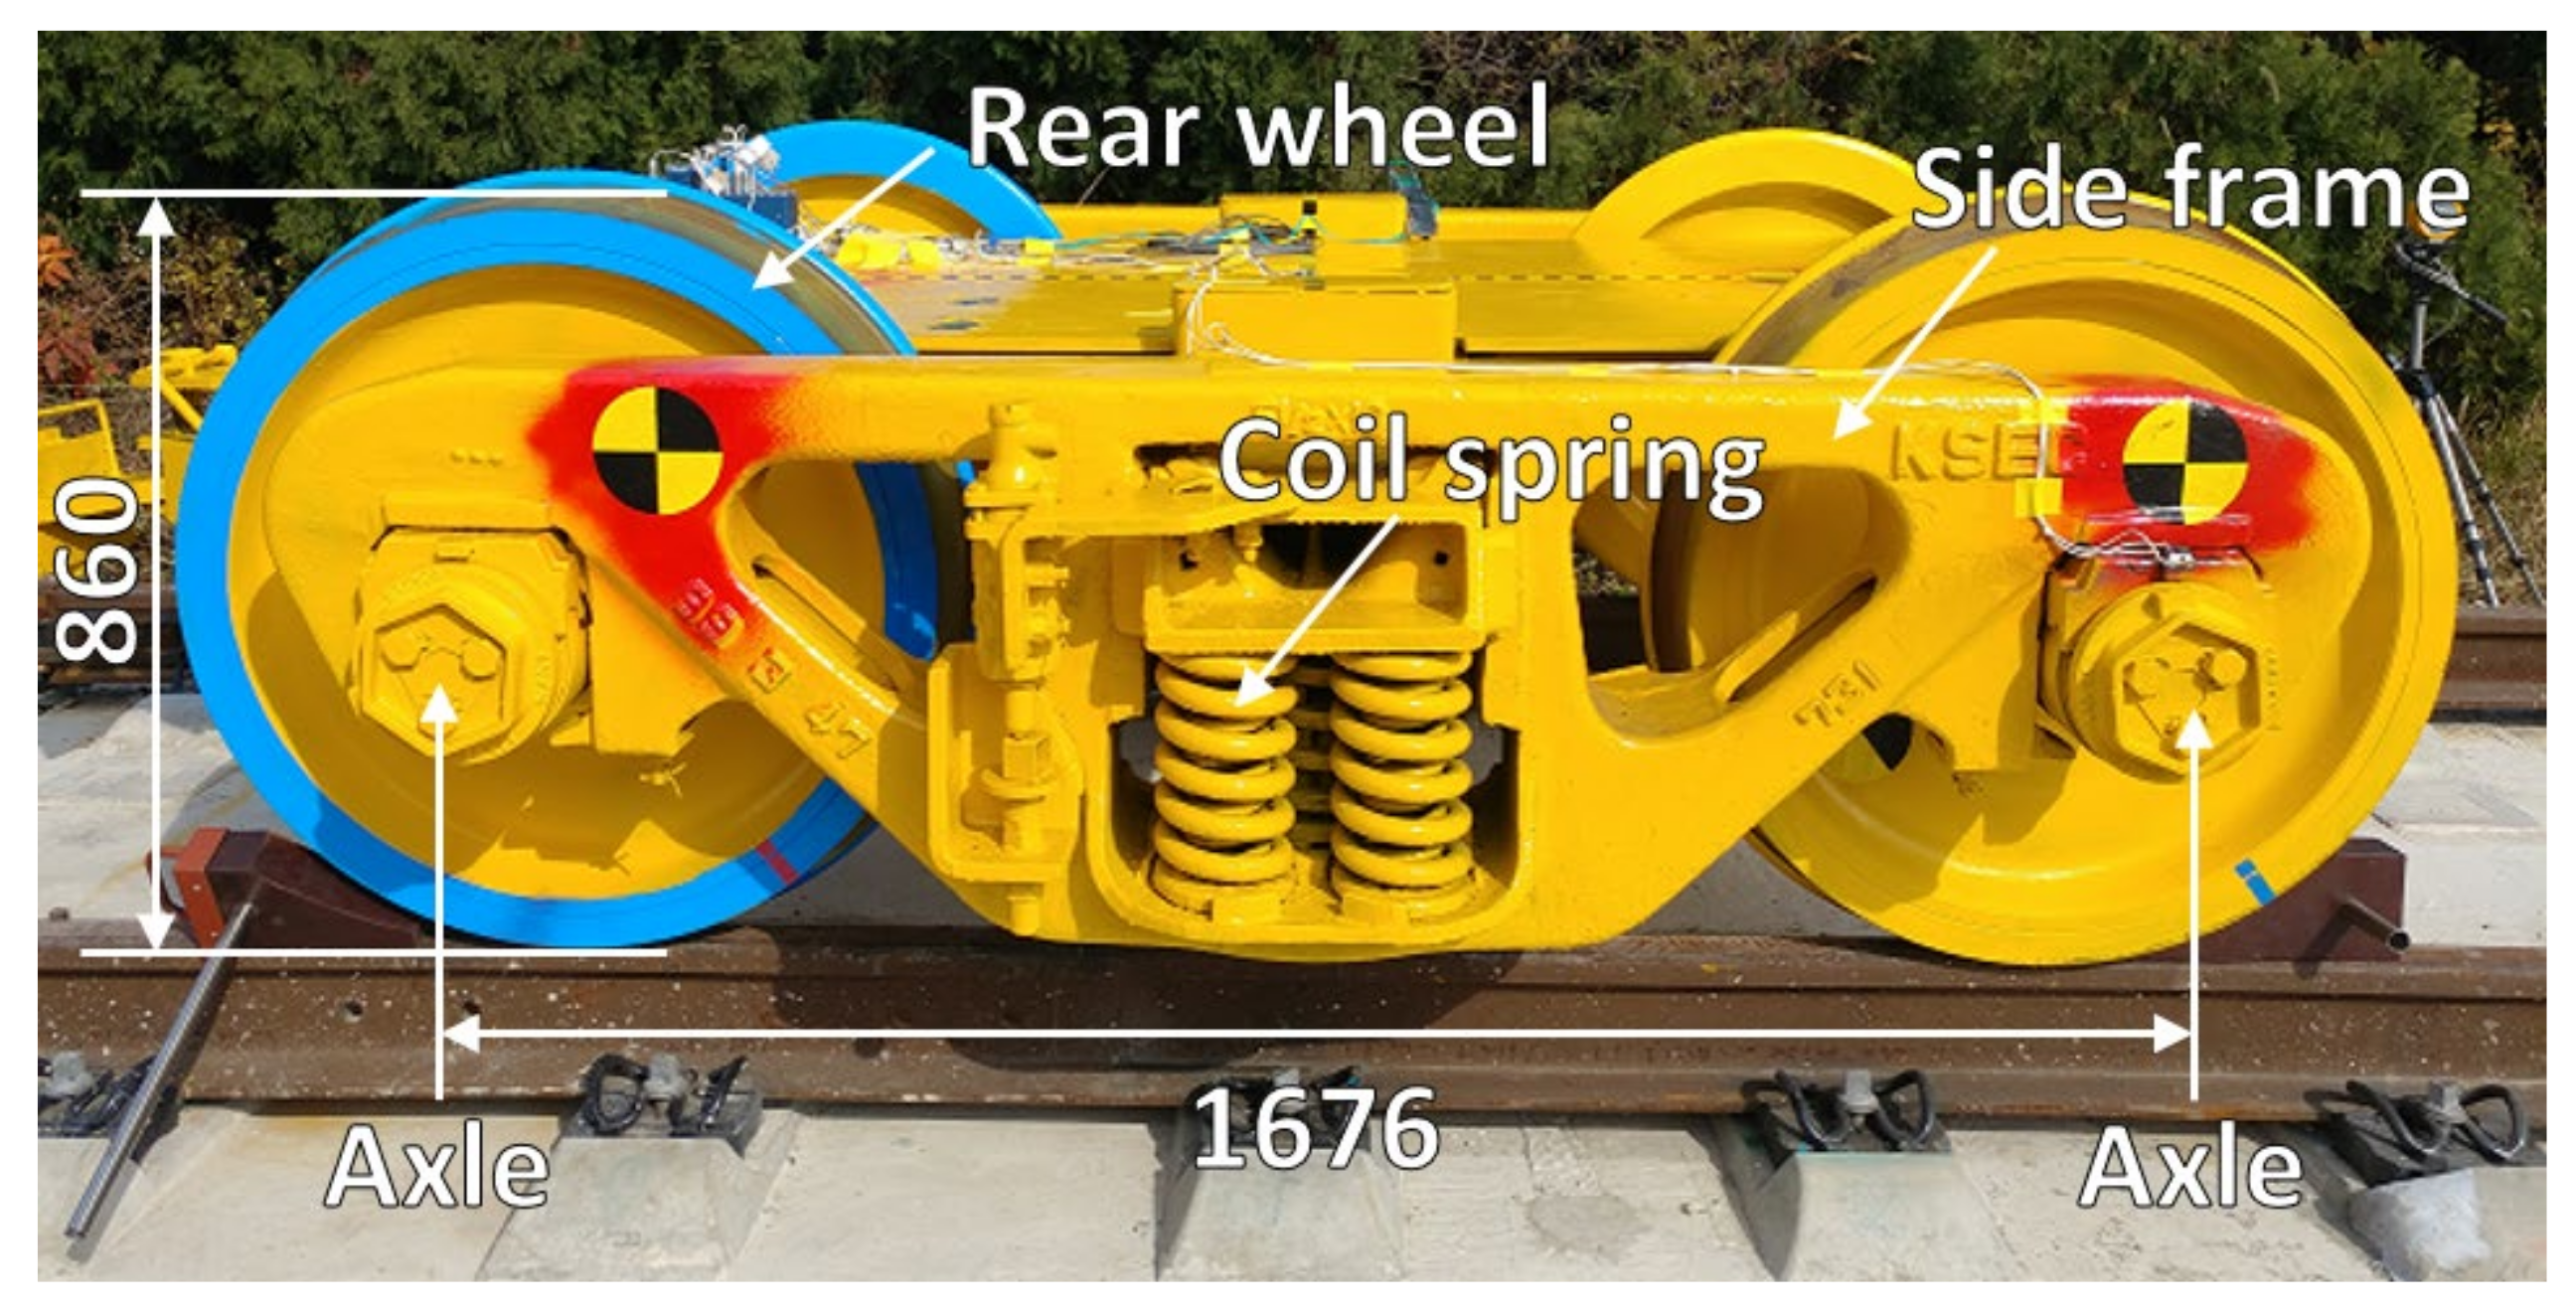
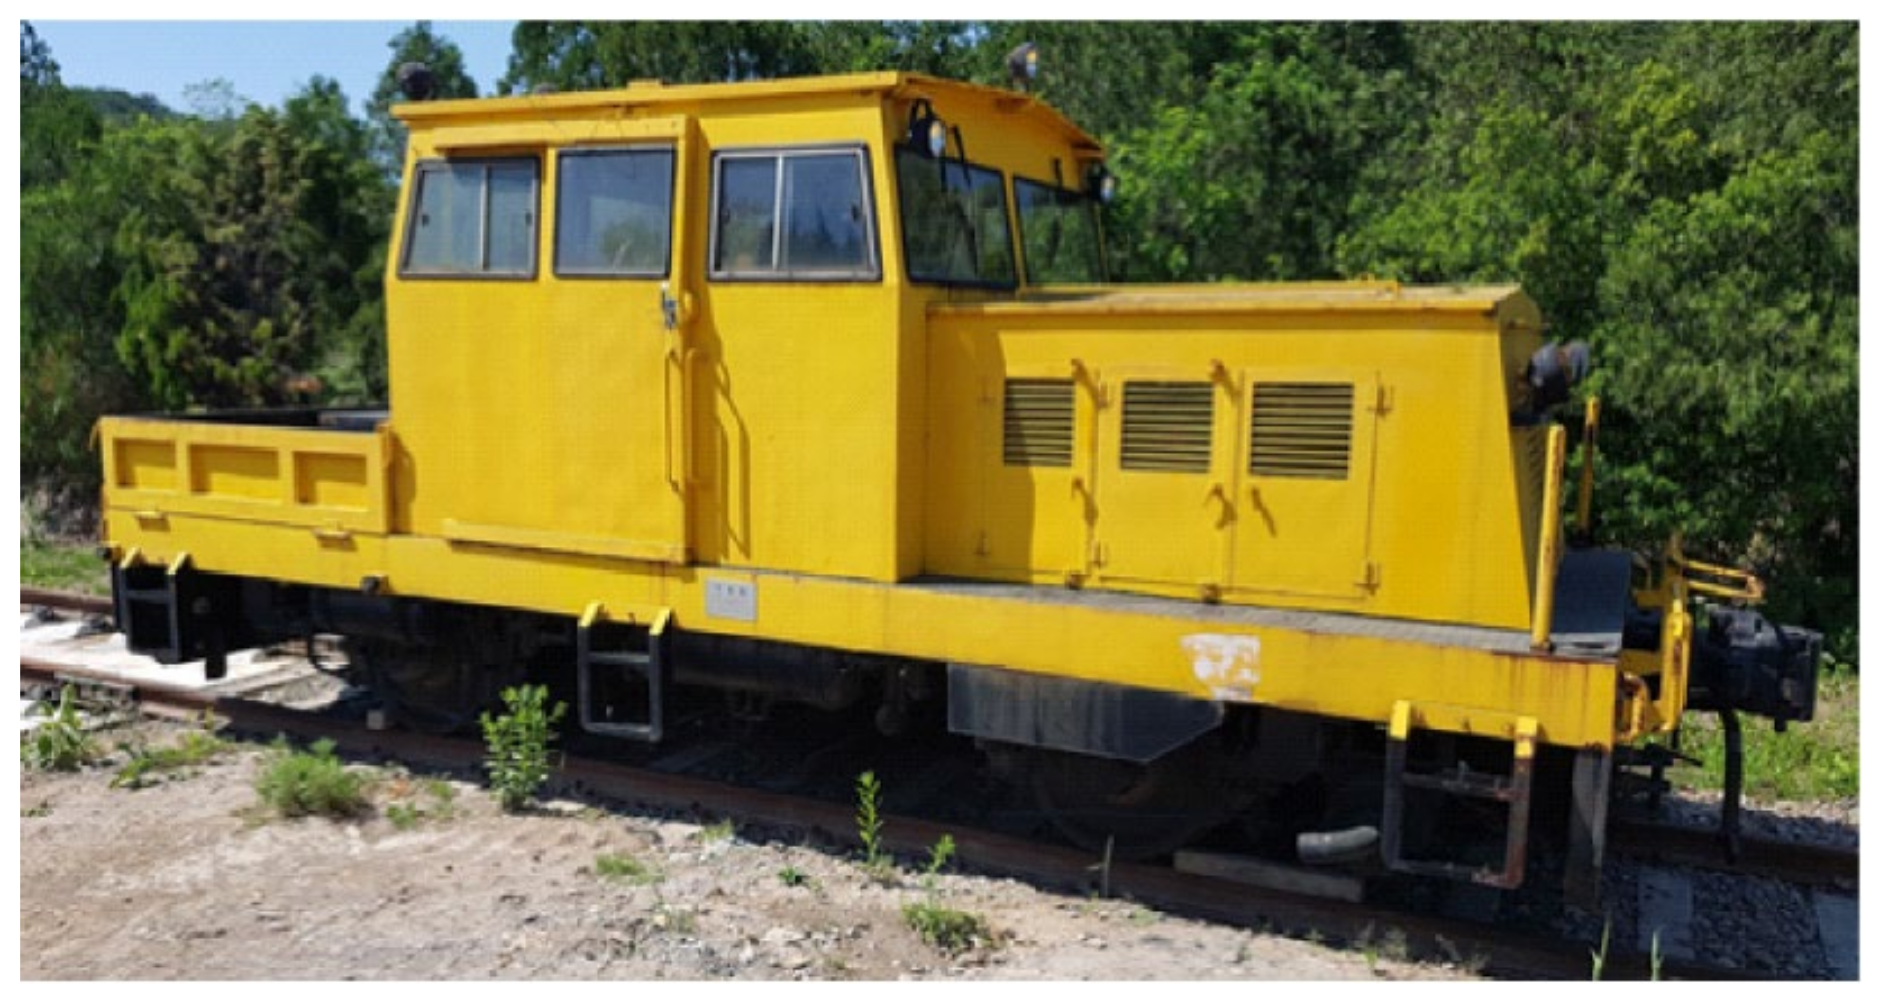
2.2. Test Bogie and Acceleration Method

In this study, a bogie-level test was conducted. The bogie used in this study was a casting bogie for a freight train, as shown in Figure 5. The total weight of the test bogie was 40.91 kN and the specifications of the test bogie are listed in Table 1. The frame structure was made of three pieces of cast steel. The fixed wheel base and wheel diameter were 1676 mm and 860 mm, respectively. A suspension system with coil springs was used between the bolster and side frame.
In order to accelerate the test bogie, several methods can be used, such as a reverse towing system, push system, or remote-controlled system. In this study, the push system shown in Figure 6 was used. The power car was linked to the test bogie with a connector. The test car was accelerated by the power car. Then, the test car was released after reaching the target speed. For this, the releasing system of the connector and braking system of the power car were designed to be controlled by air pressure and a remote controller, as shown in Figure 7. The power car used in this study is shown in Figure 8. The power car had a traction power of 147 kN.

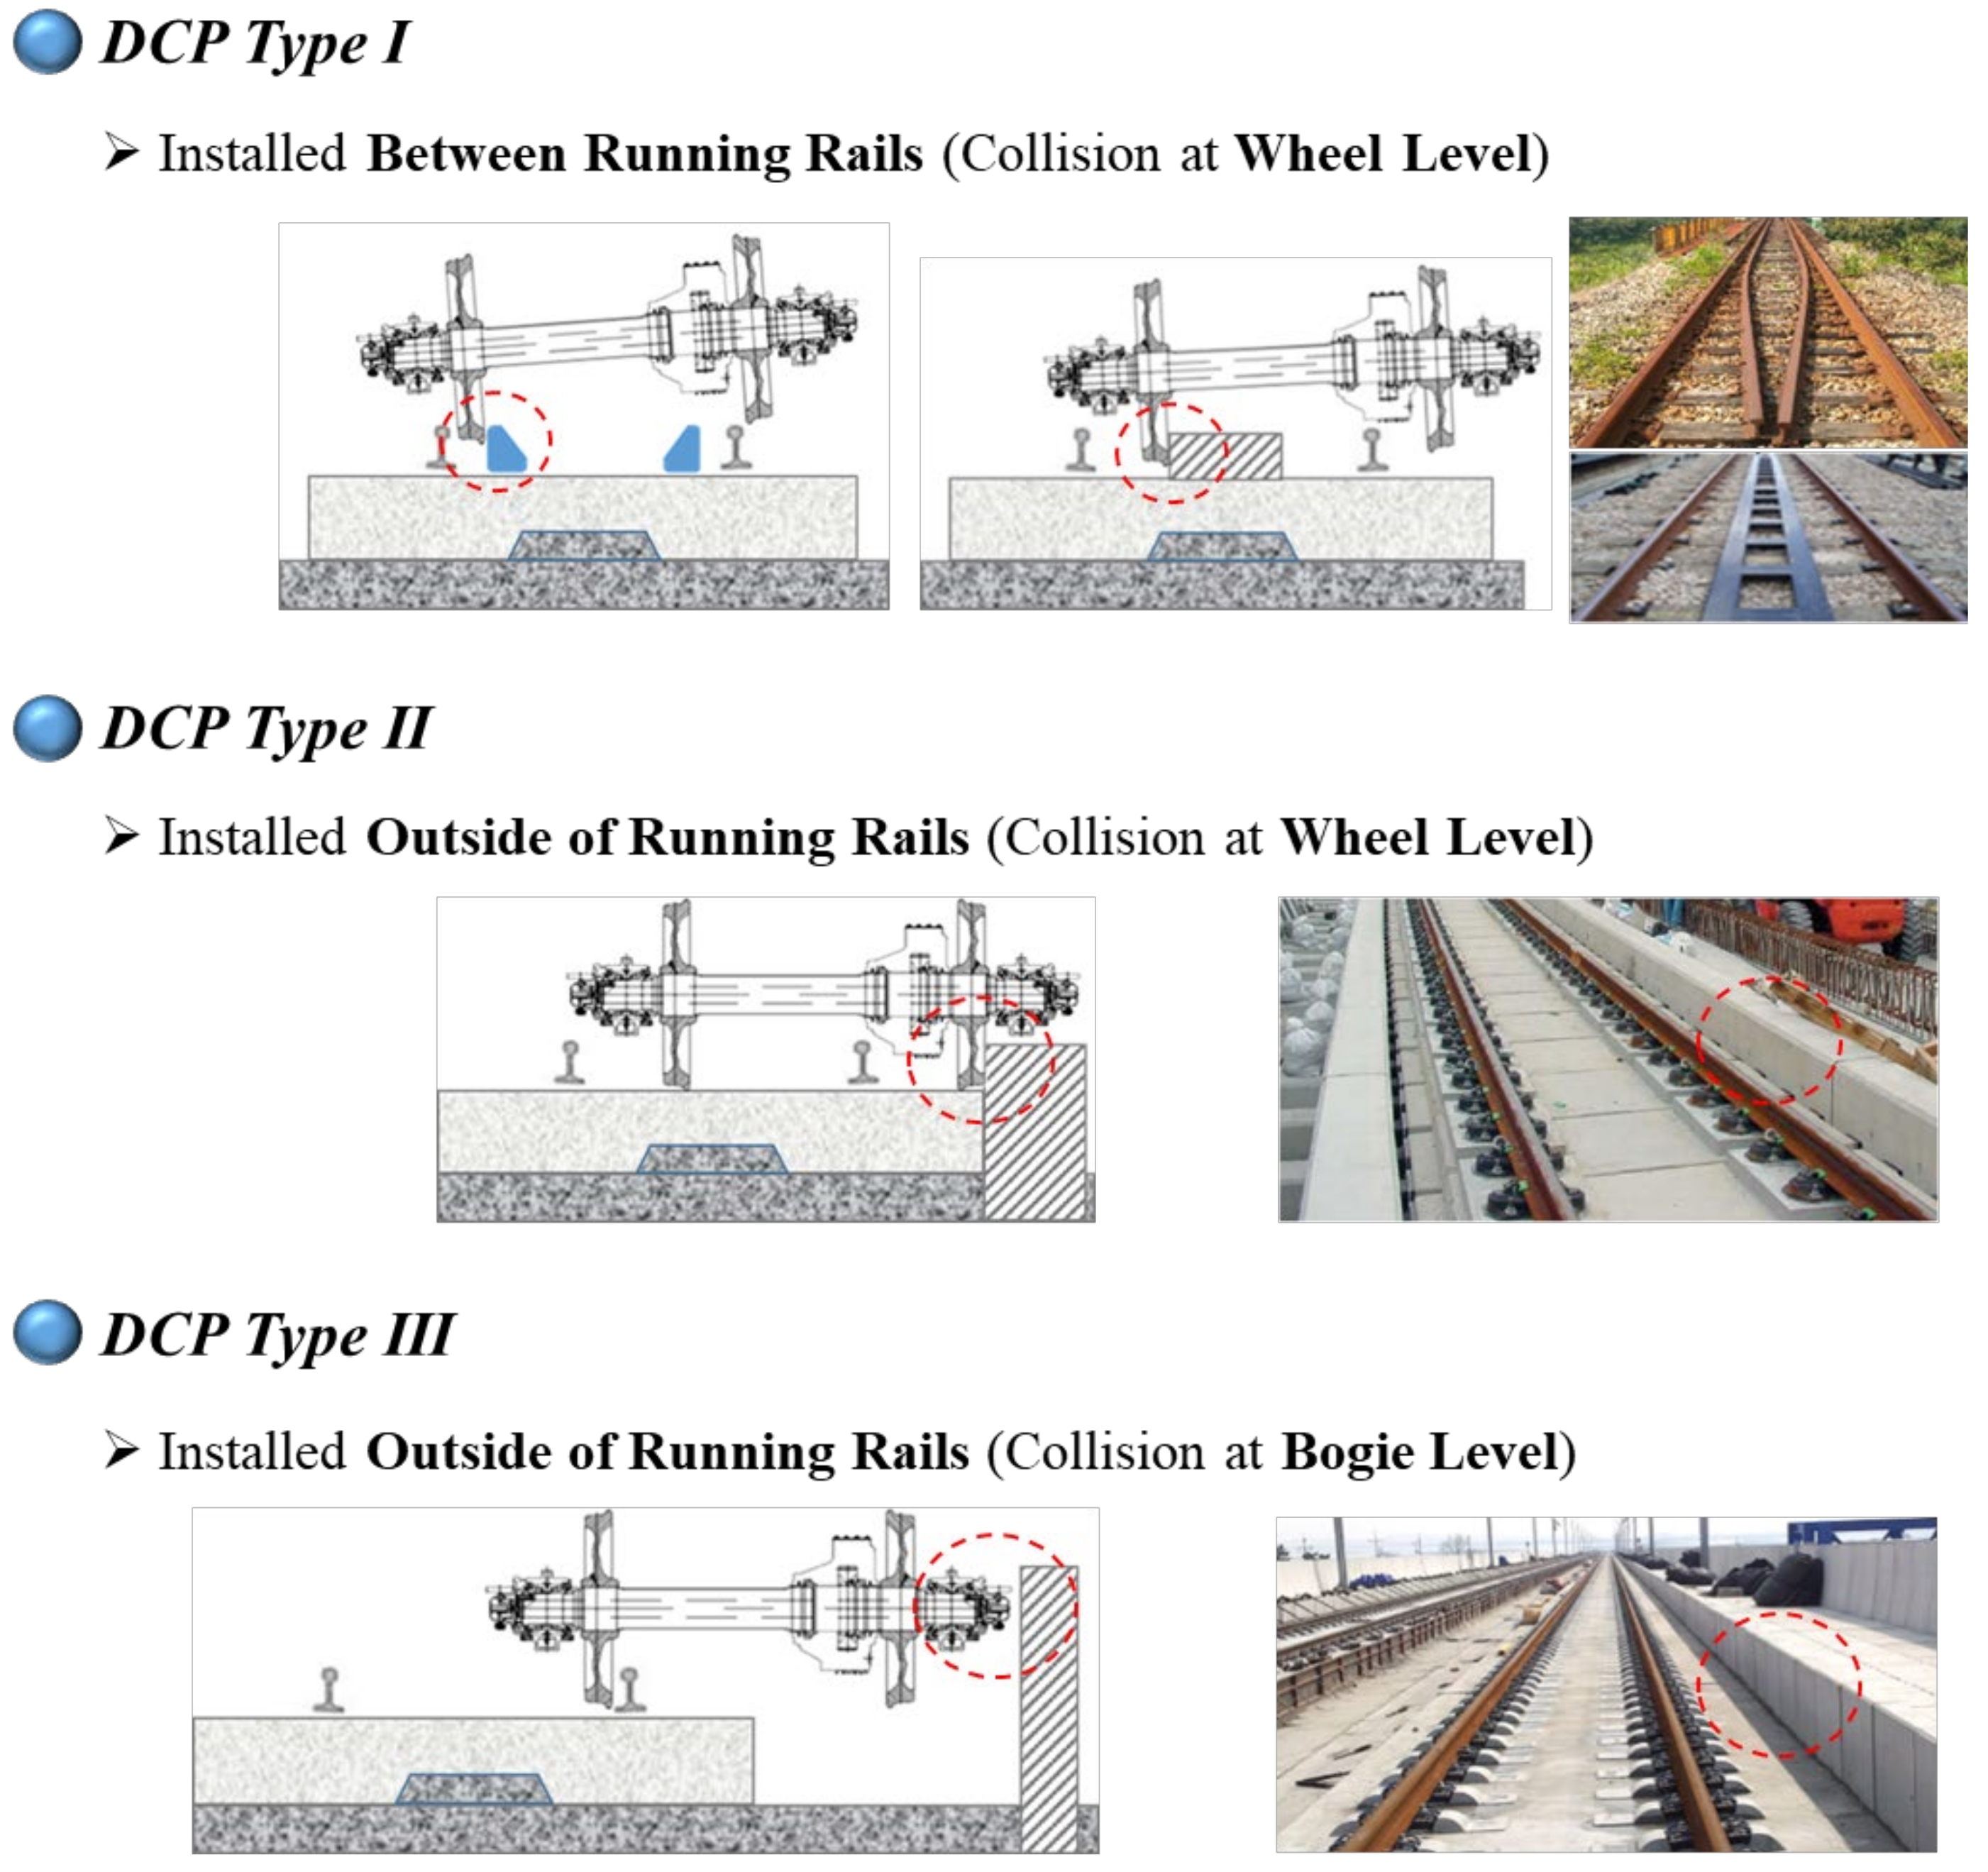
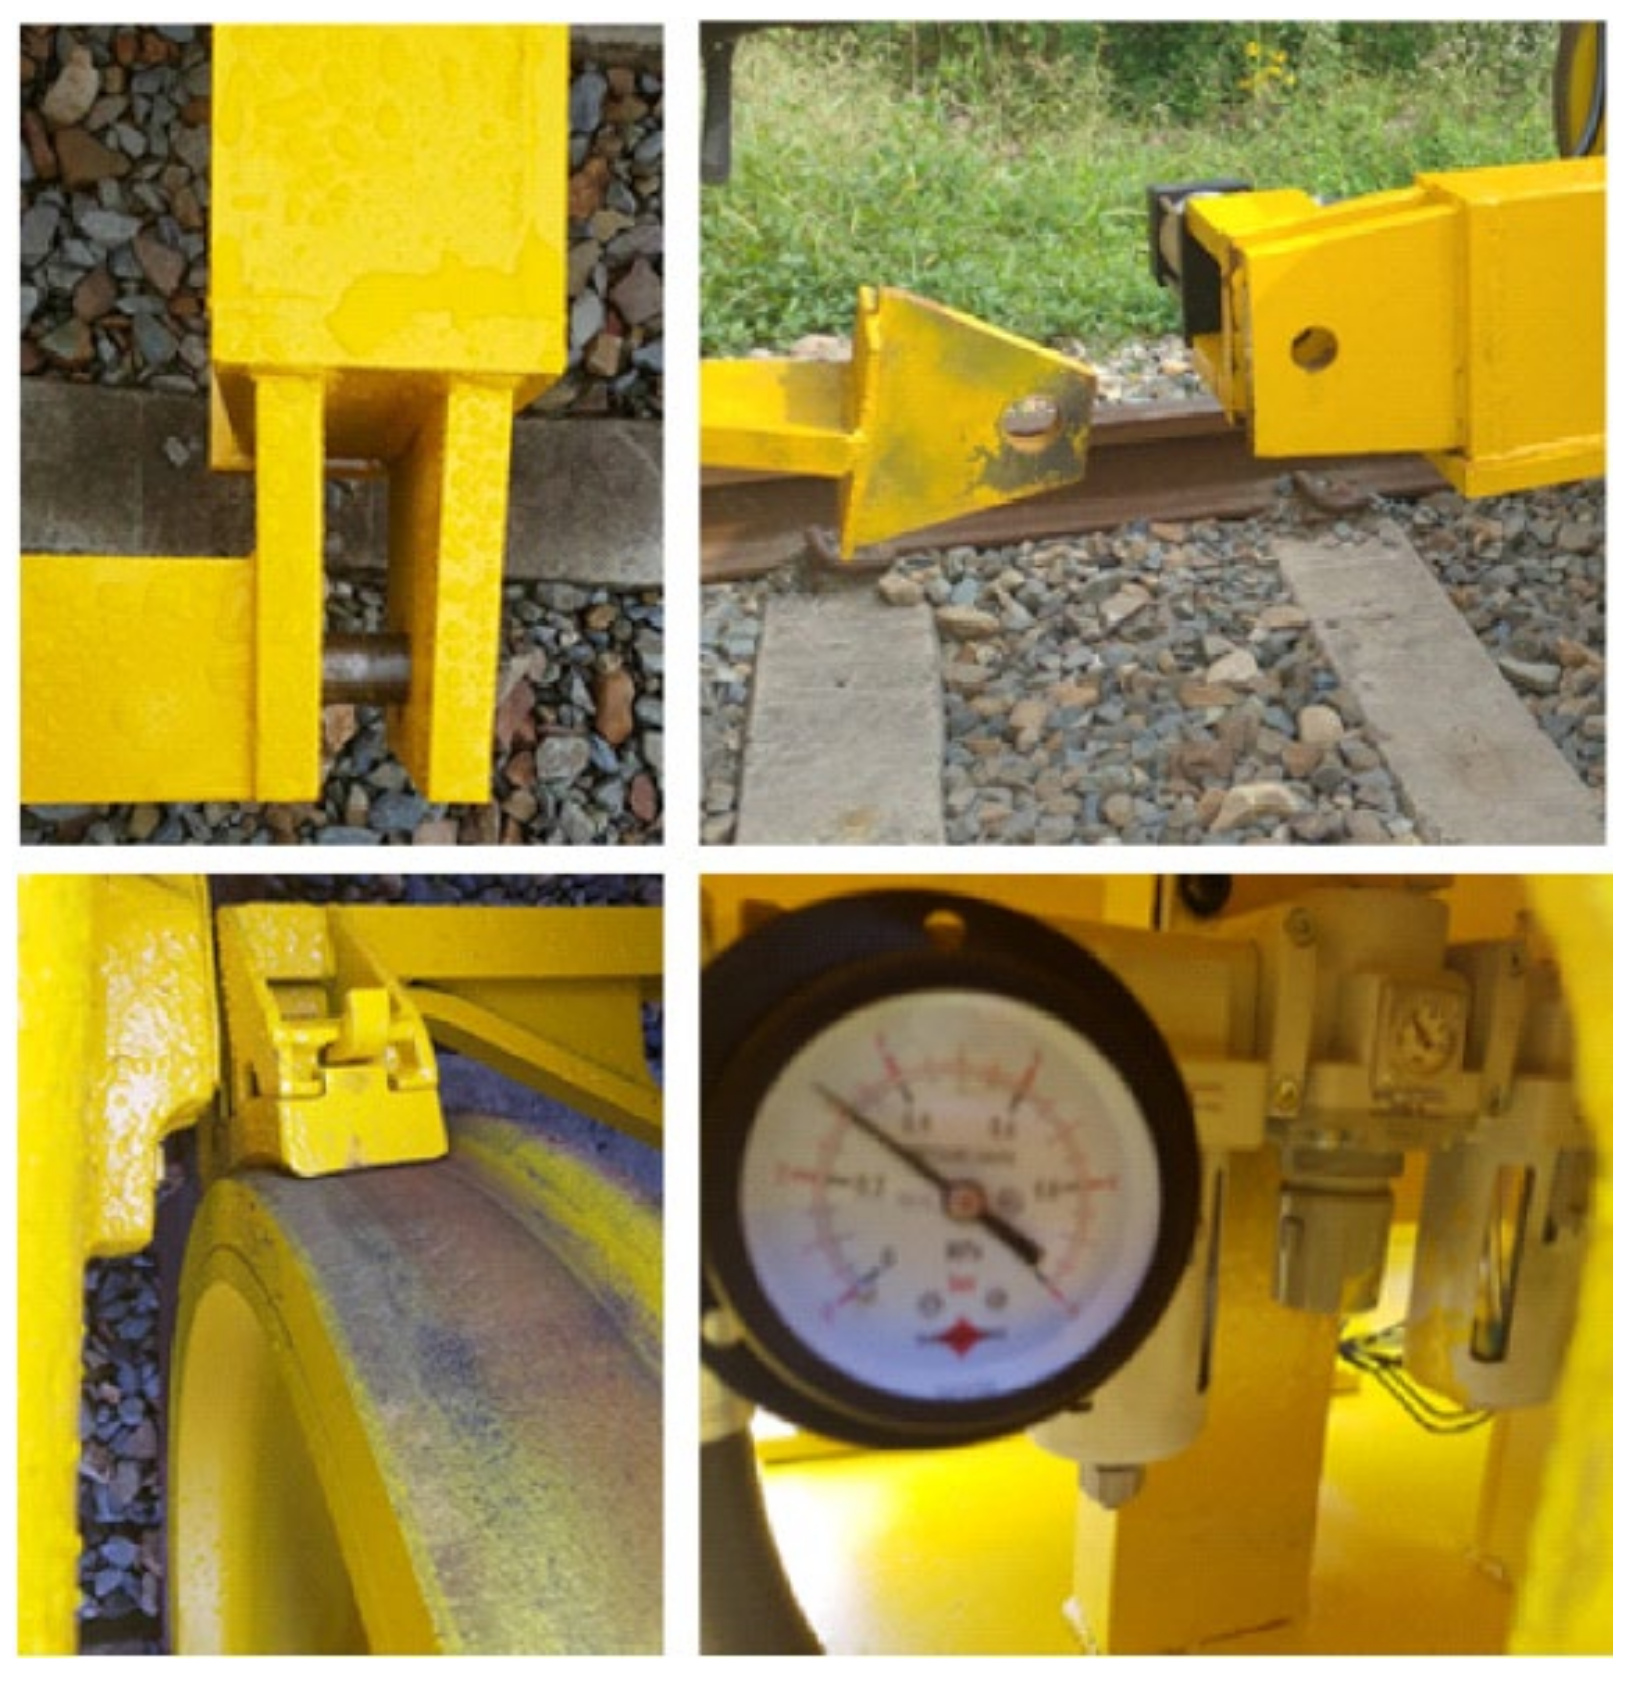
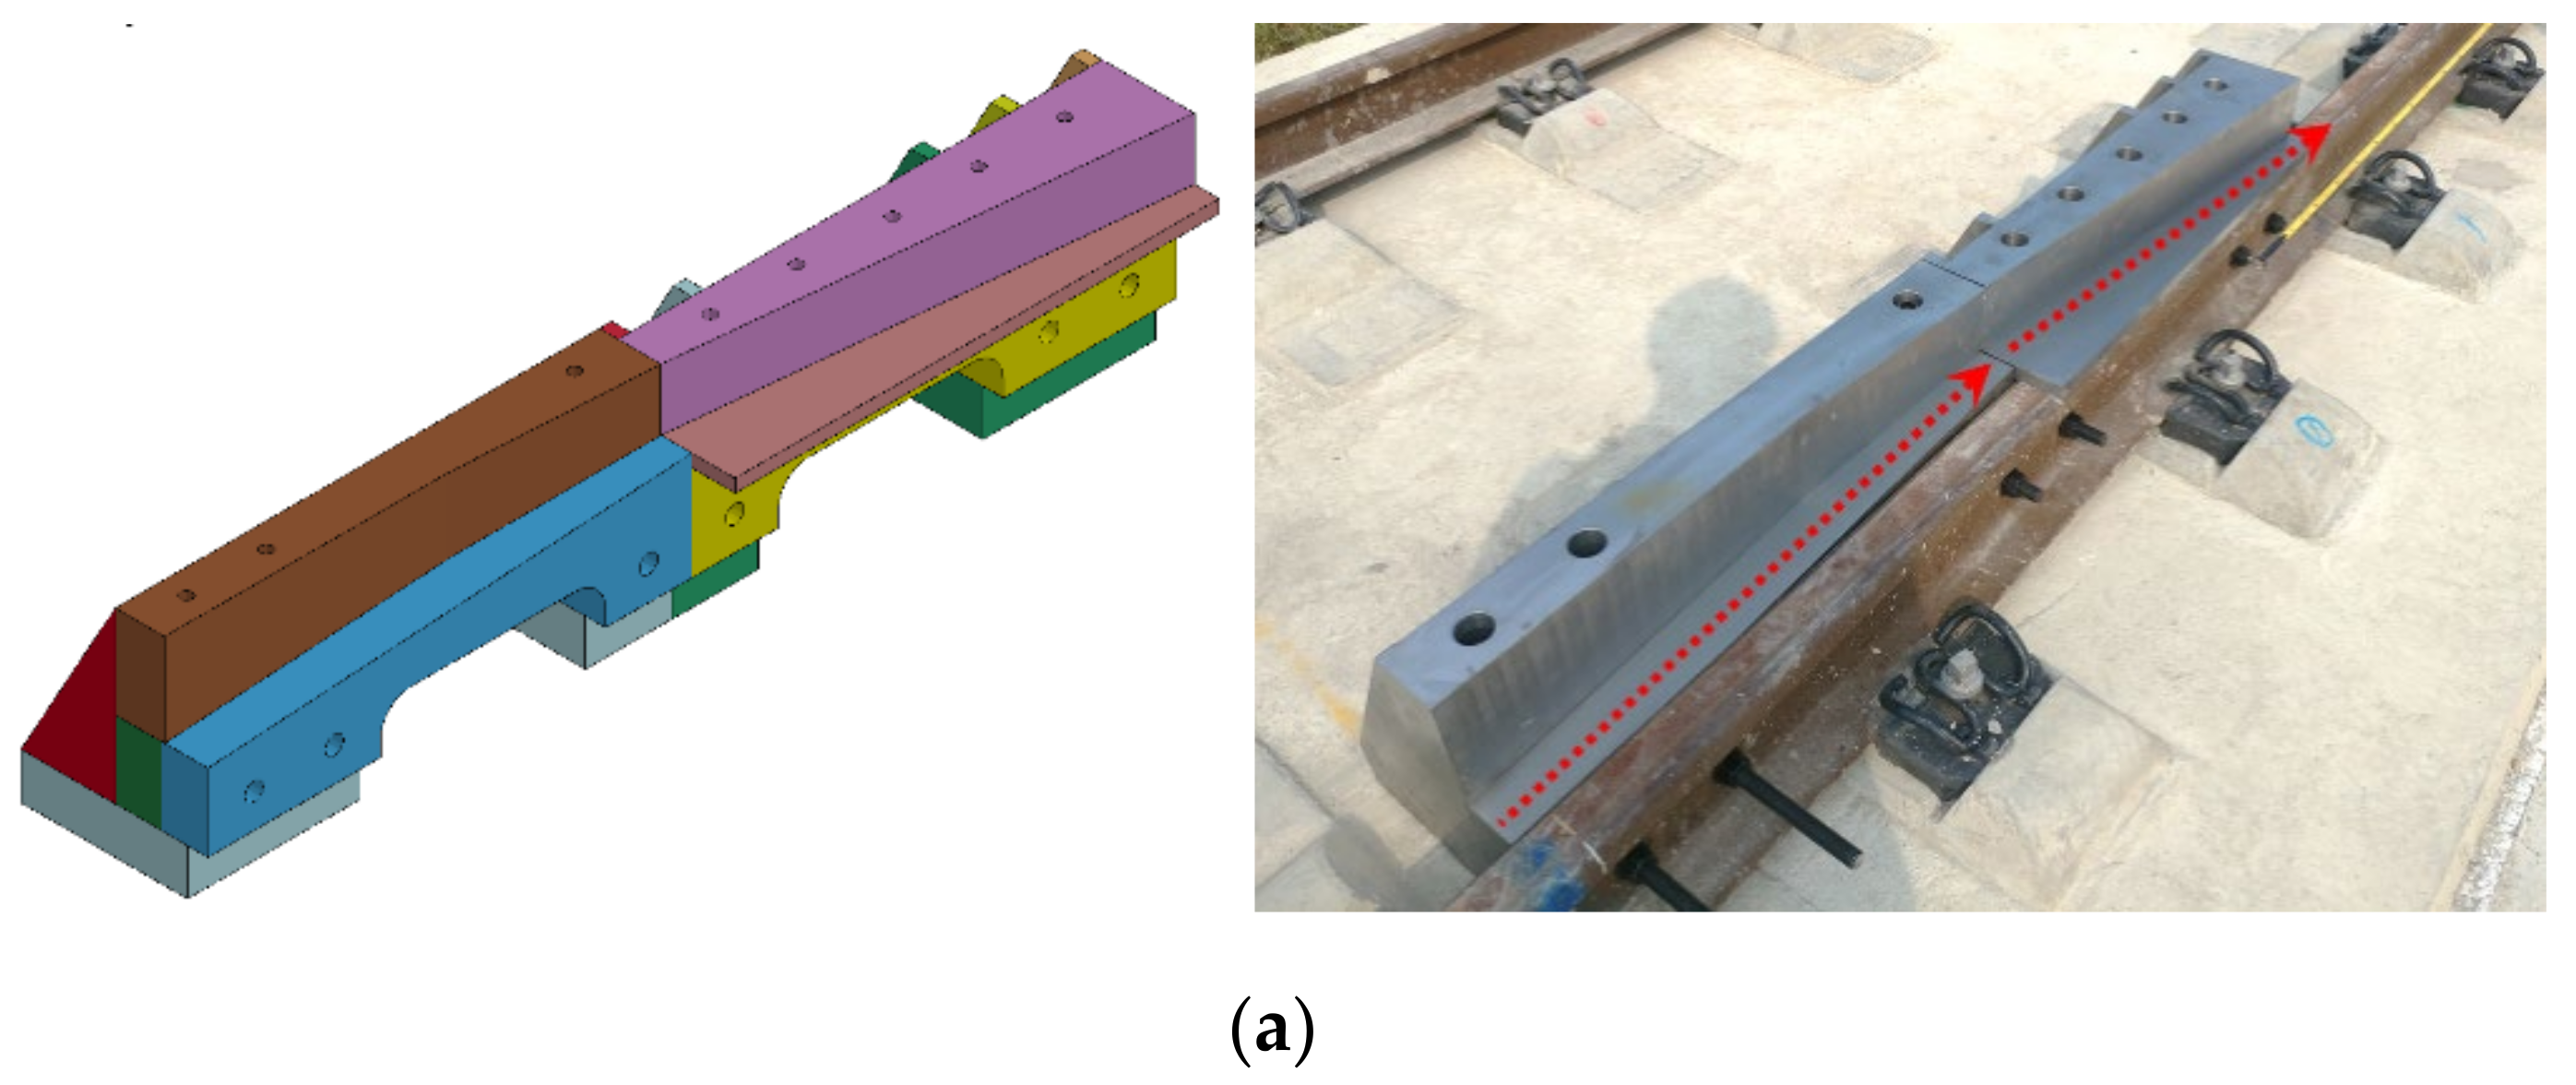
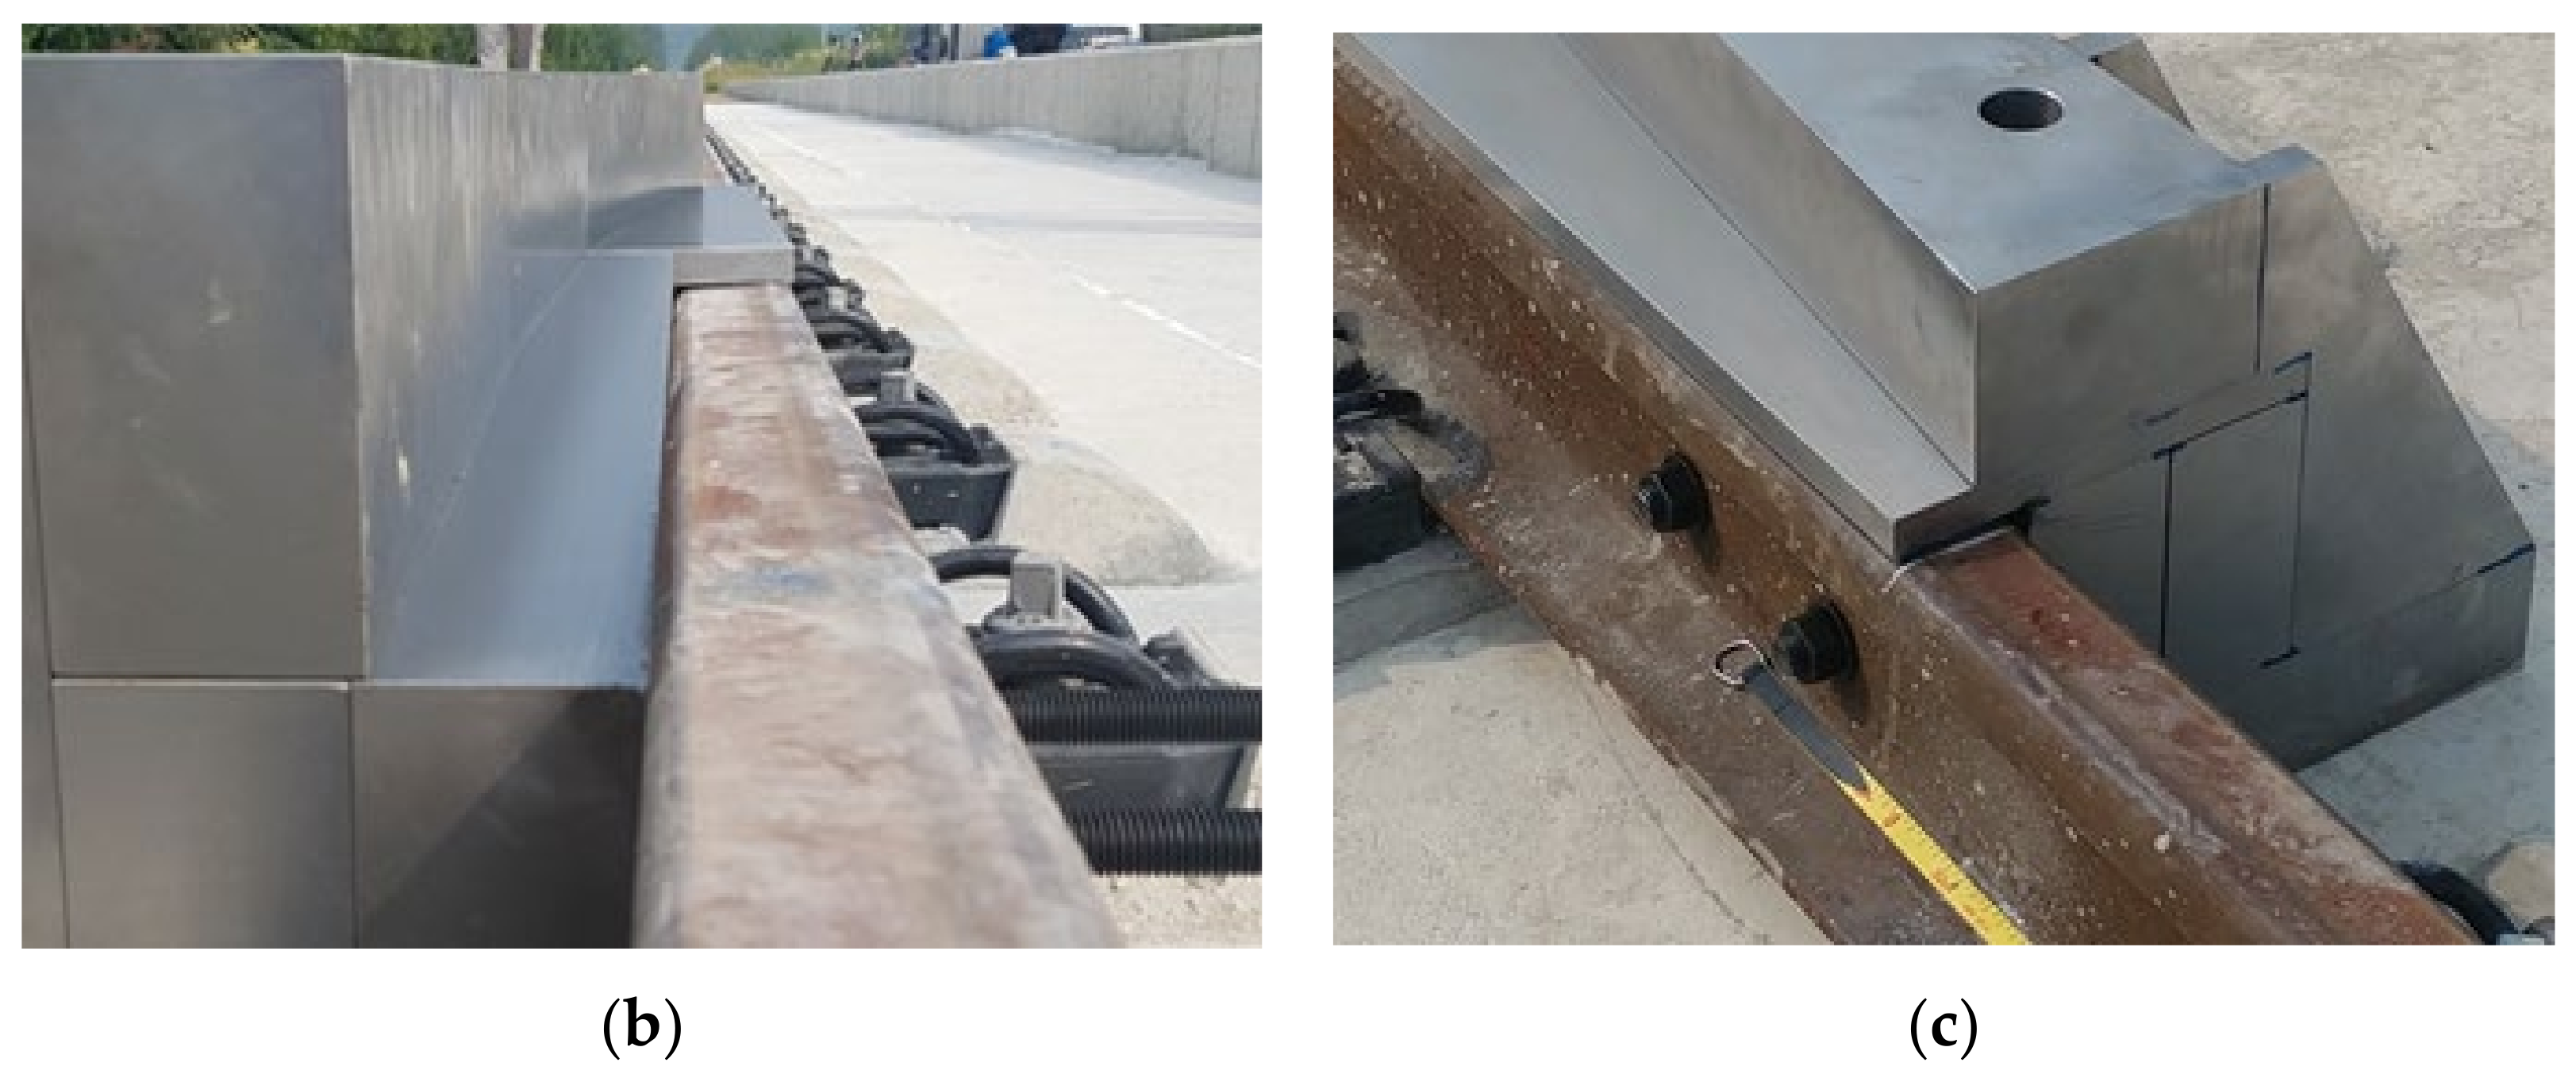
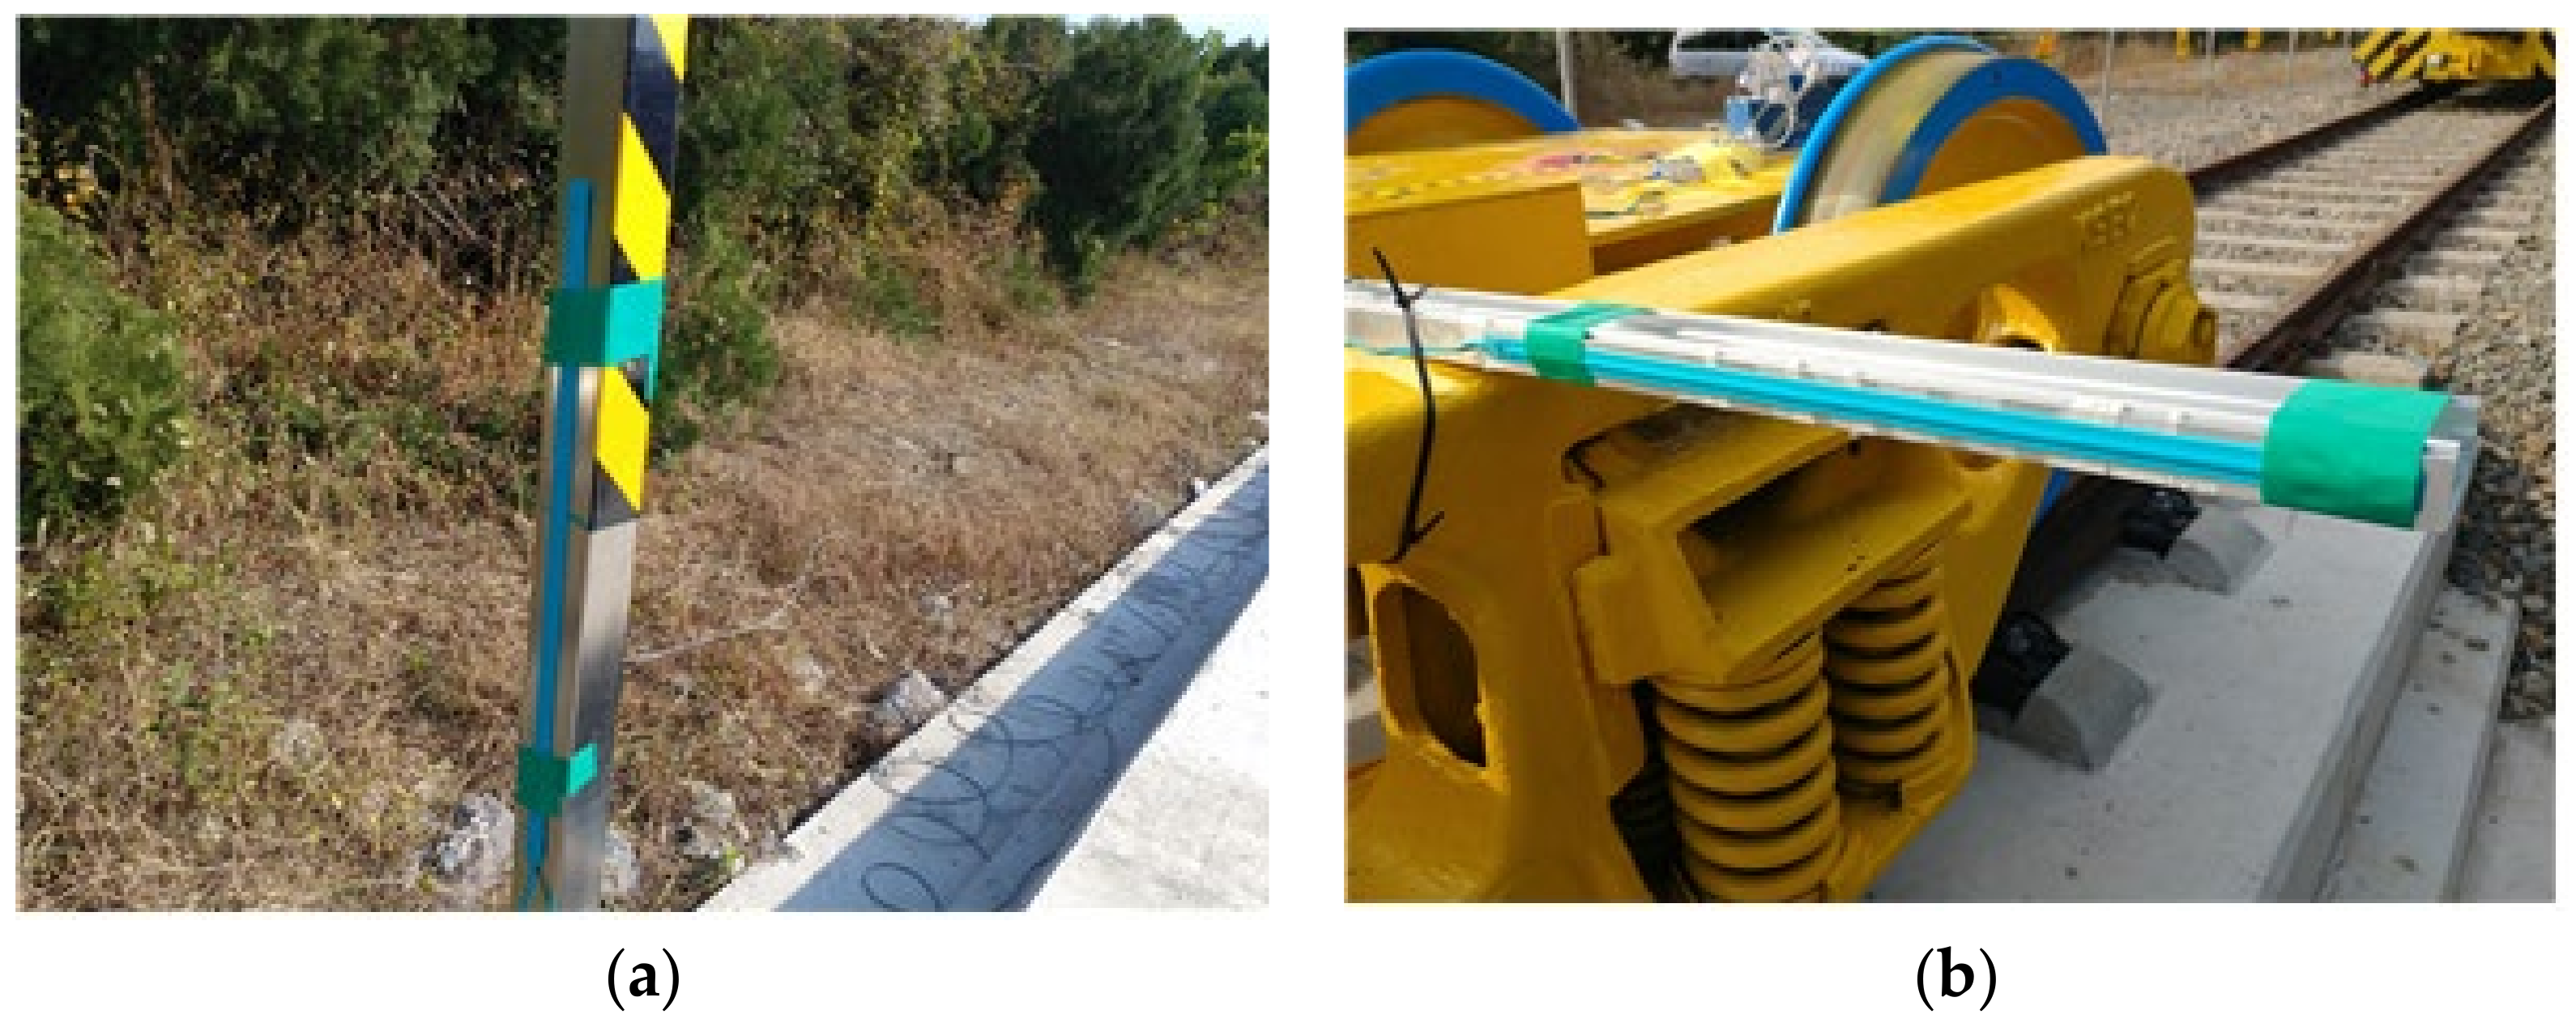
2.3. Derailment Device

A device to induce derailment was needed for the test. Wheel-climbing derailment is one of the most frequent types of derailment. In this study, a derailment device that can induce wheel-climbing derailment was developed and installed at the derailment point, as shown in Figure 9 [15]. The device consisted of a wheel entrance part and a derailment part. In the wheel entrance part, there is an upward slope, and the entered wheel flange reaches the same height as the surface of a rail head. Then, the wheel climbs the surface of a rail head in the derailment part, shown in Figure 9c. Thus, the train or bogie is derailed due to wheel-climbing derailment.

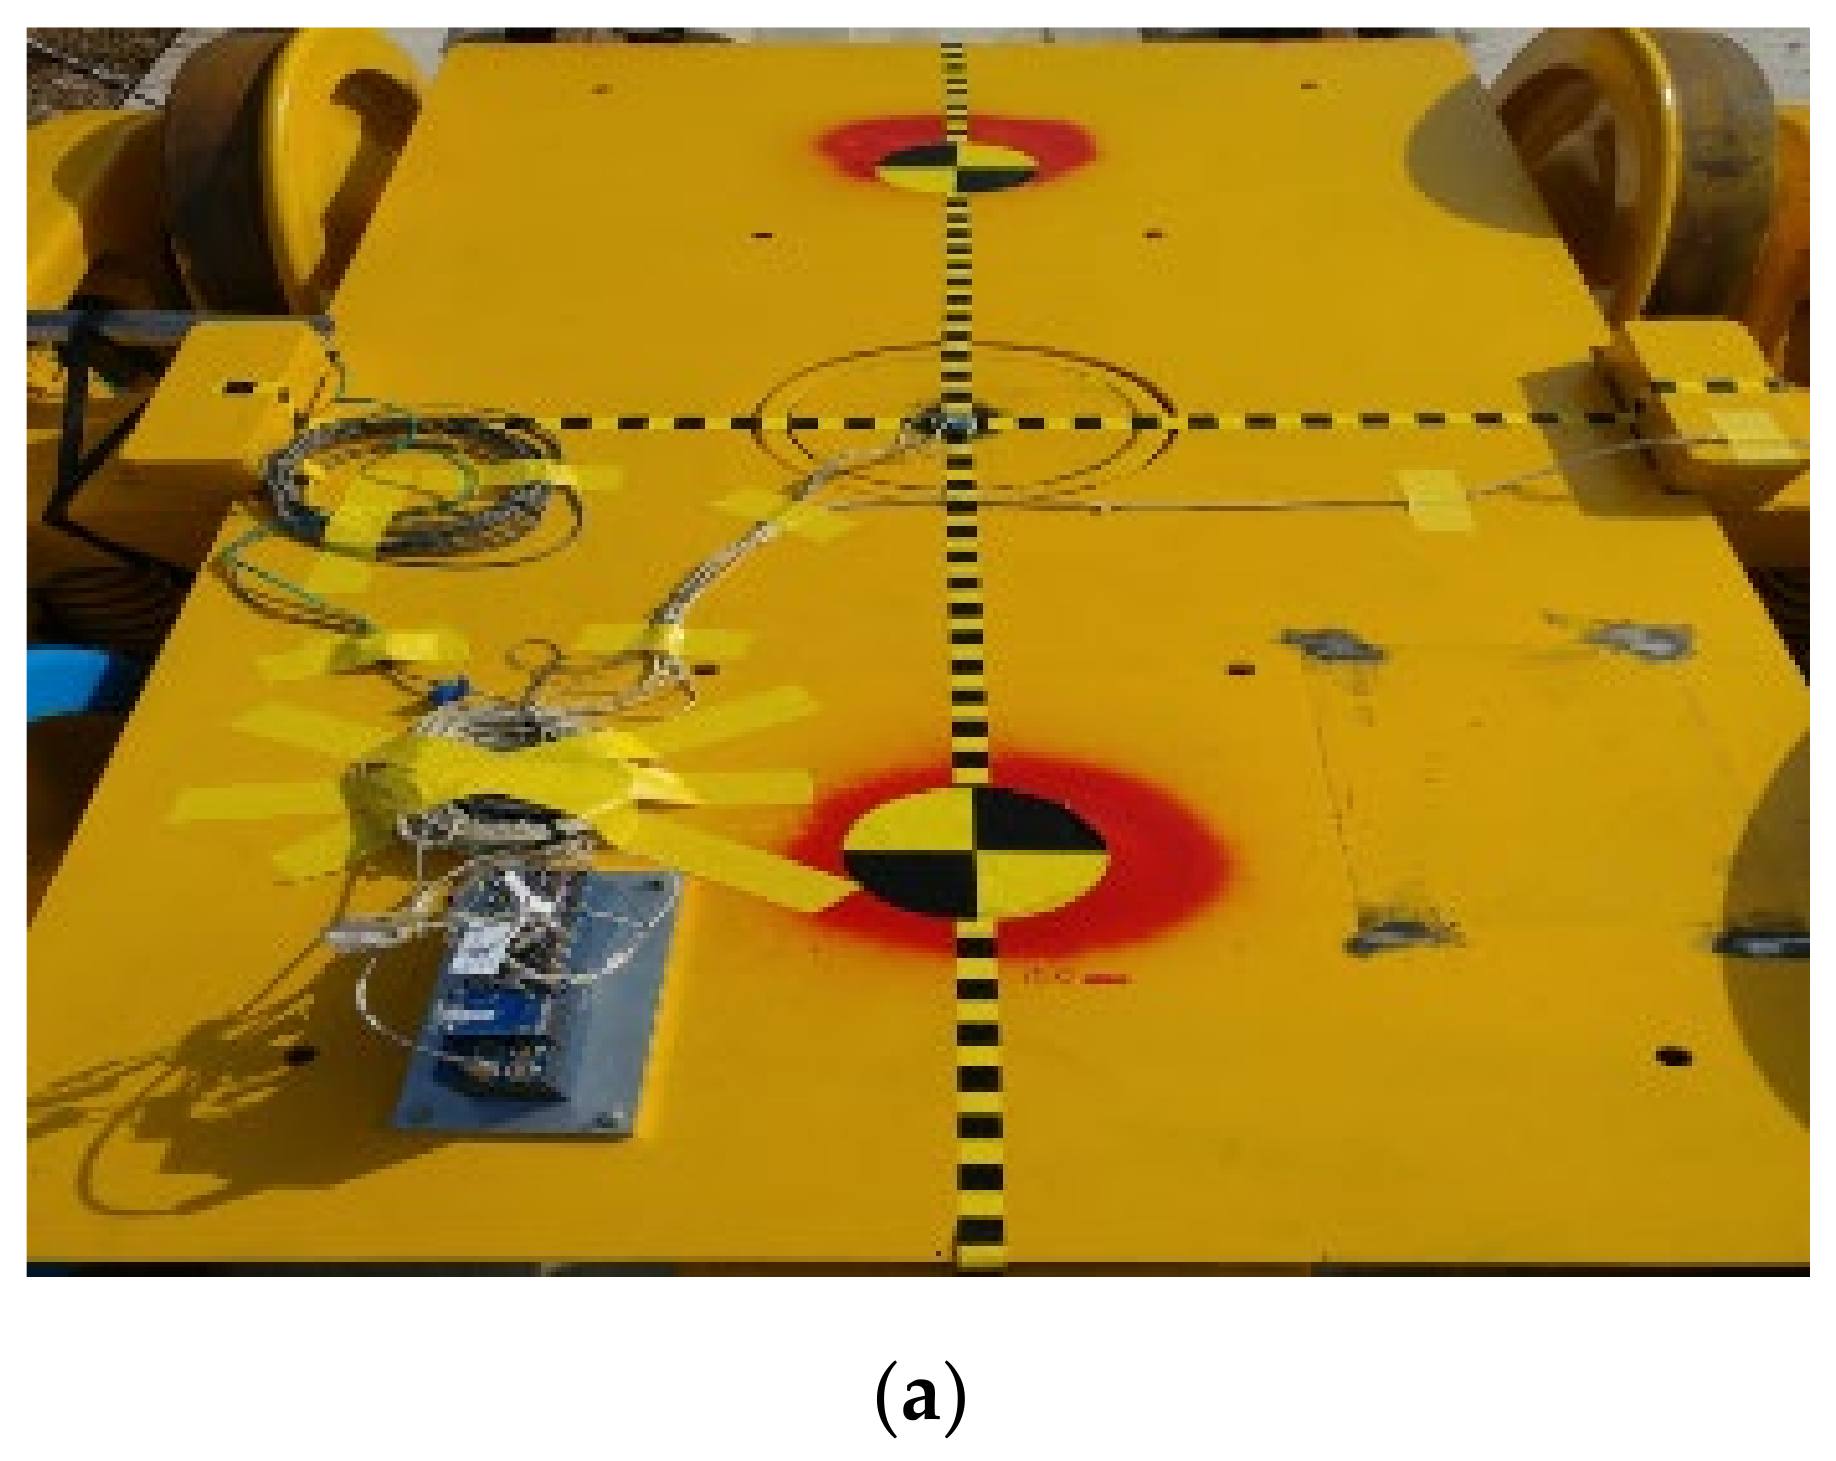
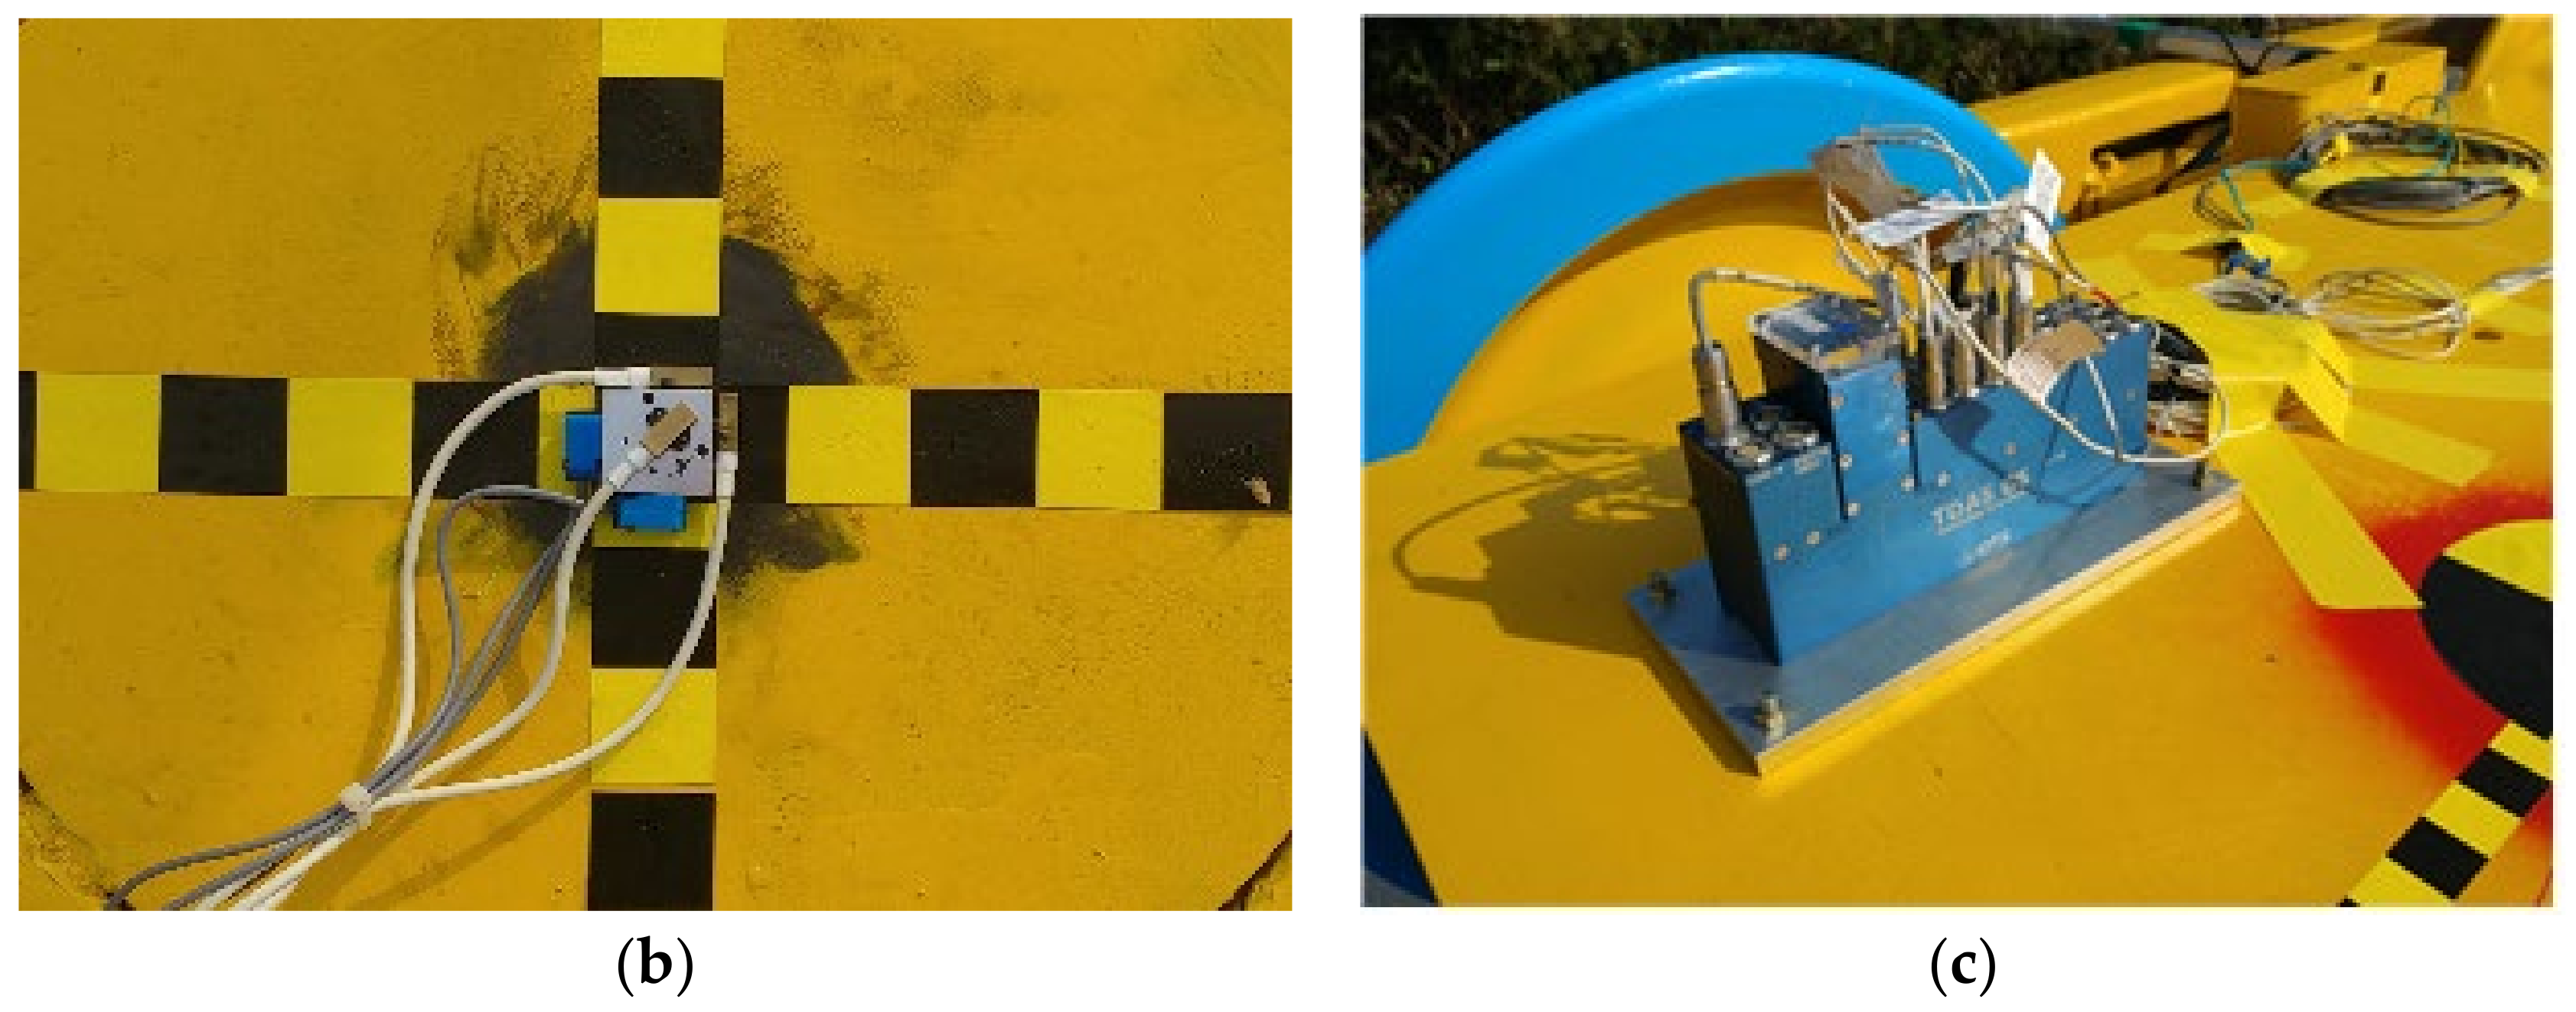
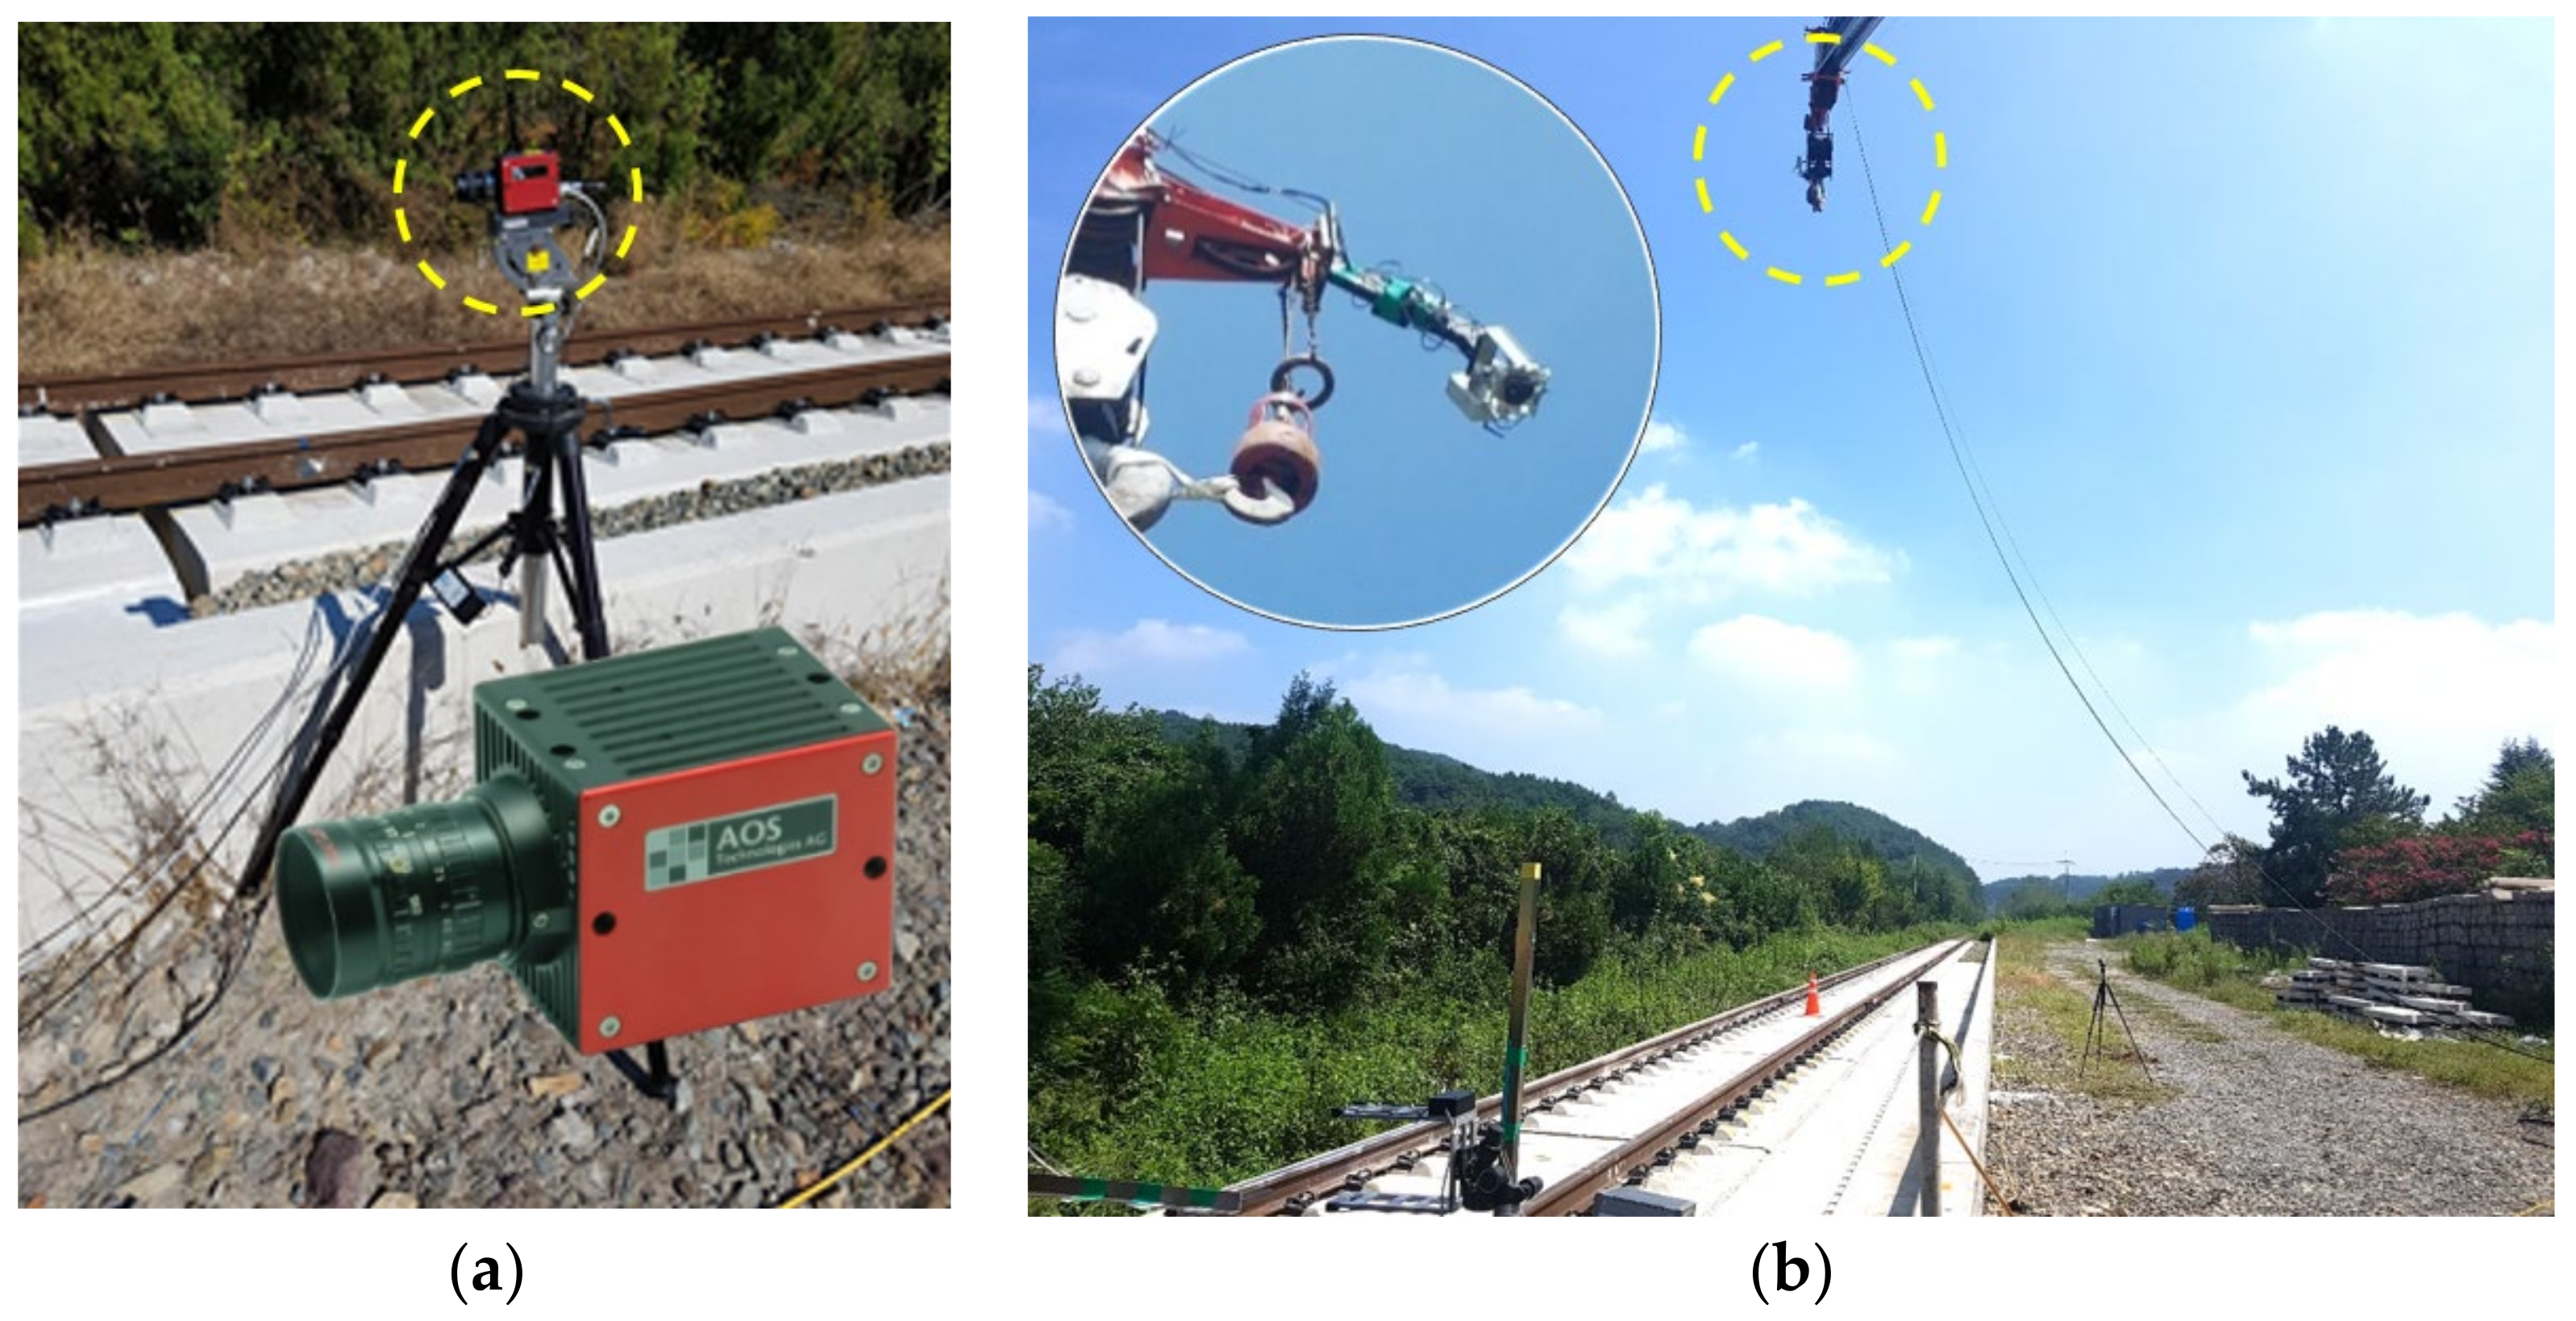
2.4. Data Acquisition System

The position of the derailed train bogie and related data have to be accurately measured during the test. The acceleration and angular velocity of the bogie were measured. For this, an accelerometer and an angular velocity sensor were installed on the geometrical bogie center as shown in Figure 10b, where the capacities of the accelerometer and angular velocity sensor were 2000 g and ±1500 deg/s full-scale range, respectively. Large impact forces are expected after derailment. Thus, the sensors must be securely fixed to the test bogie. To measure the impact force, special accelerometers such as MEMS accelerometers [16] can be used. However, it is hard to determine the exact impact point after derailment. Thus, the impact force to the rail was estimated from the acceleration data of the test bogie. A data logger was installed on the test bogie, as shown in Figure 10c. The data logger used was a shock-resistance data logger (high shock rating of 500 g) for collision testing and it has high sampling capabilities (max. sampling rate of 100 k samples/s/channel). The sampling rate of the data was 1/10,000 s (10,000 Hz) in this test.
The velocity of the test bogie at the derailment point is important information for the analysis of post-derailment behavior. Since the test bogie was released before the derailment point, it was necessary to set up an additional velocity measurement system at the derailment point, as shown in Figure 11. In this study, a photoelectric tube speedometer was used. Two lights and two receiver sensors were installed at a specific distance. As the test bogie passes, the passing time between the two lights can be obtained. Then, the initial derailment velocity of the test bogie can be calculated.
In this study, a high-speed camera was also used to investigate the post-derailment behavior of the test bogie in depth. Image data are very useful to evaluate the trace of the bogie after derailment. The high-speed camera used in this study is shown in Figure 12. According to its specifications, it can store 3.6 s at 1000 fps (frame/s) when the image format is 1024 × 1024. In total, three high-speed cameras were used. One camera was used to take the top view with a crane, as shown in Figure 12. The others were used to take the side views. For each second, 500 frames were obtained (500 fps). Also, some ordinary digital cameras were installed to obtain image data from various viewpoints.

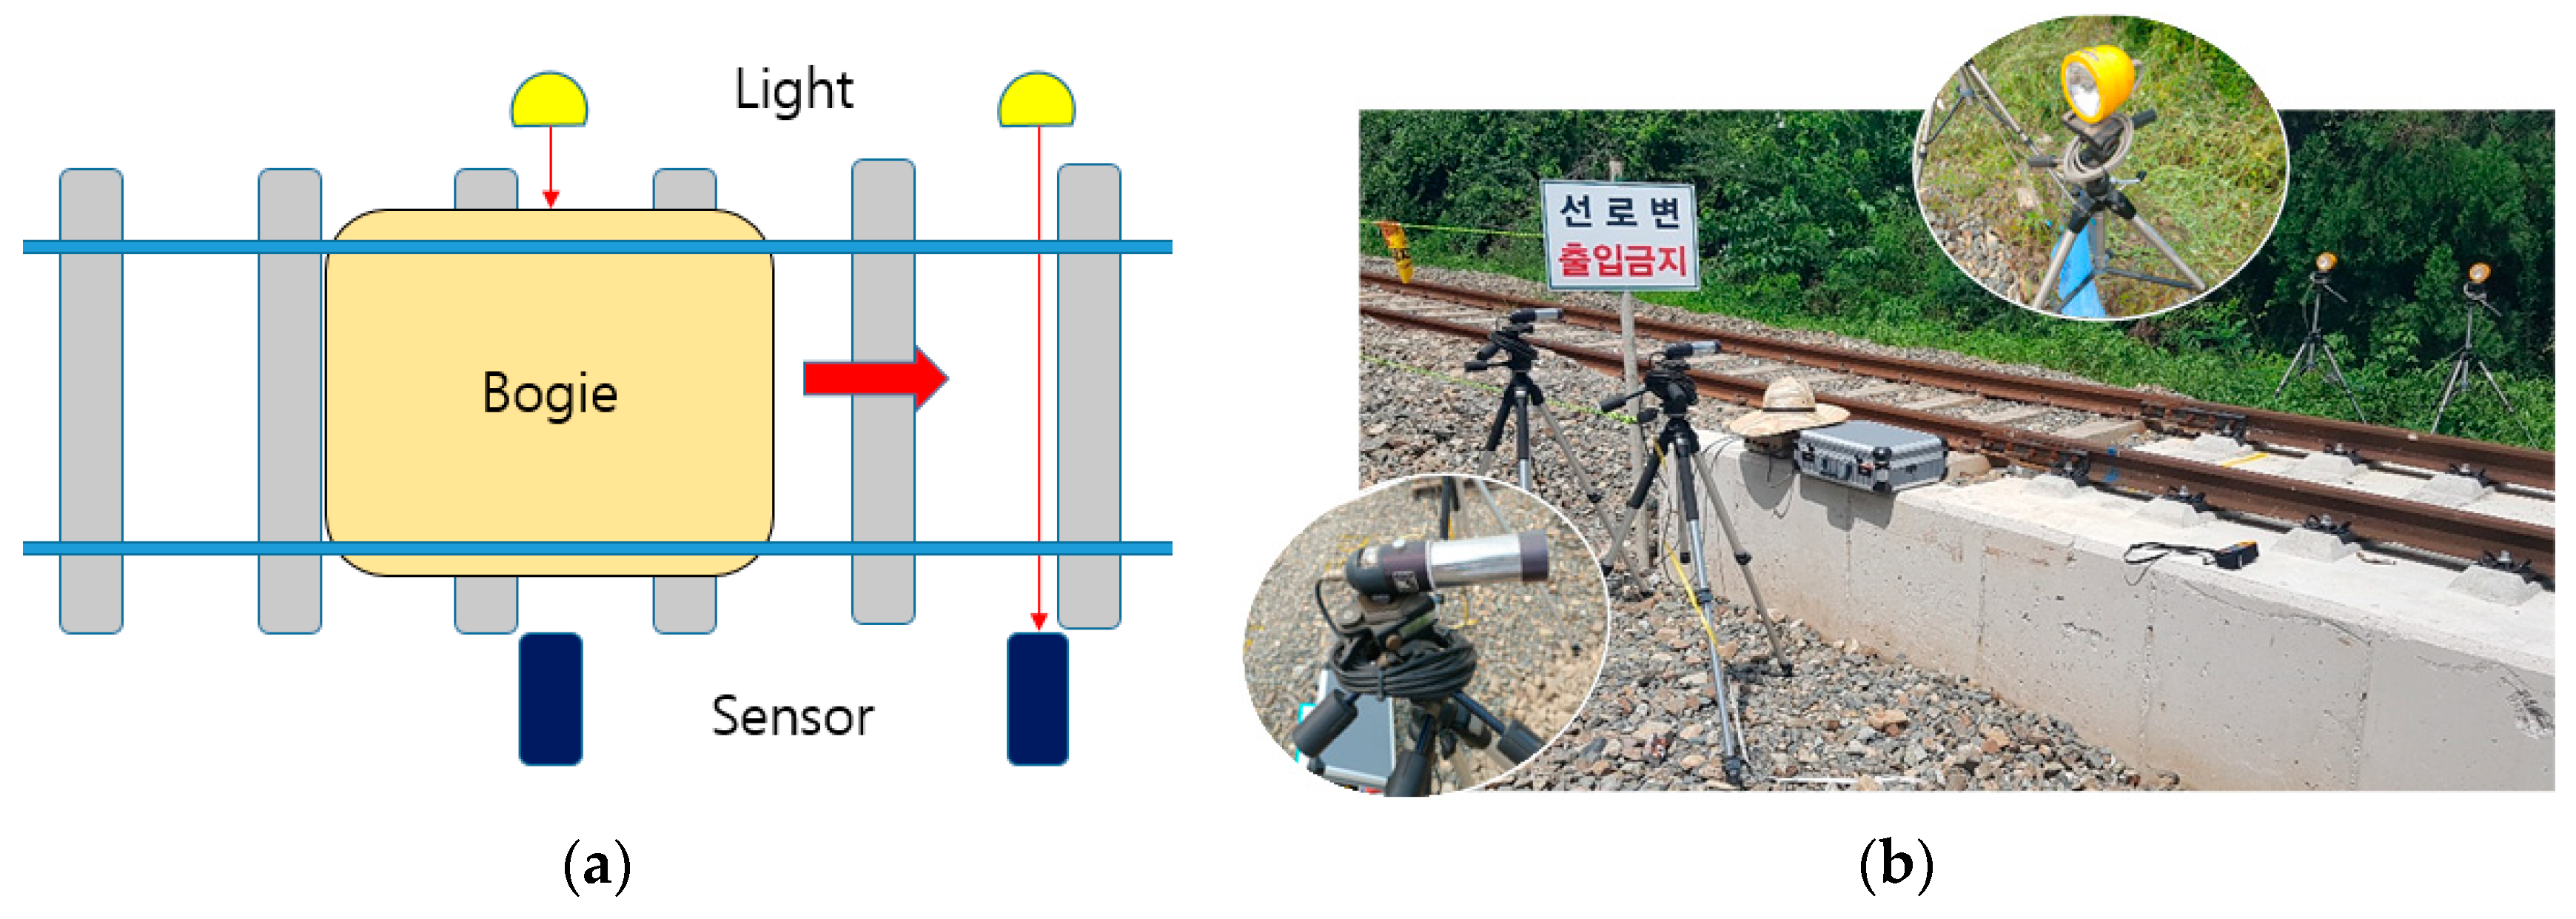
2.5. Simultaneous Trigger System

Trigger systems are used to synchronize several different pieces of measurement equipment. By synchronizing the equipment, data analysis is convenient since the initial time of data recording is the same for all equipment. In this study, the three high-speed cameras and data logger were synchronized by a trigger system with a tape switch, as shown in Figure 13.
The tape switch method is simple and free from spurious operation. The trigger for the high-speed cameras was set up on the test track at the derailment point, as shown in Figure 13a. The trigger for the data logger, shown in Figure 13b, was installed on the test bogie. When the test bogie passes the derailment point, the trigger on the test bogie contacts the trigger for the high-speed camera. Then, data recoding is started. It should be noted that the trigger on the bogie was made of flexible materials since the post-derailment behavior could be affected by high stiffness and contact force between the triggers.

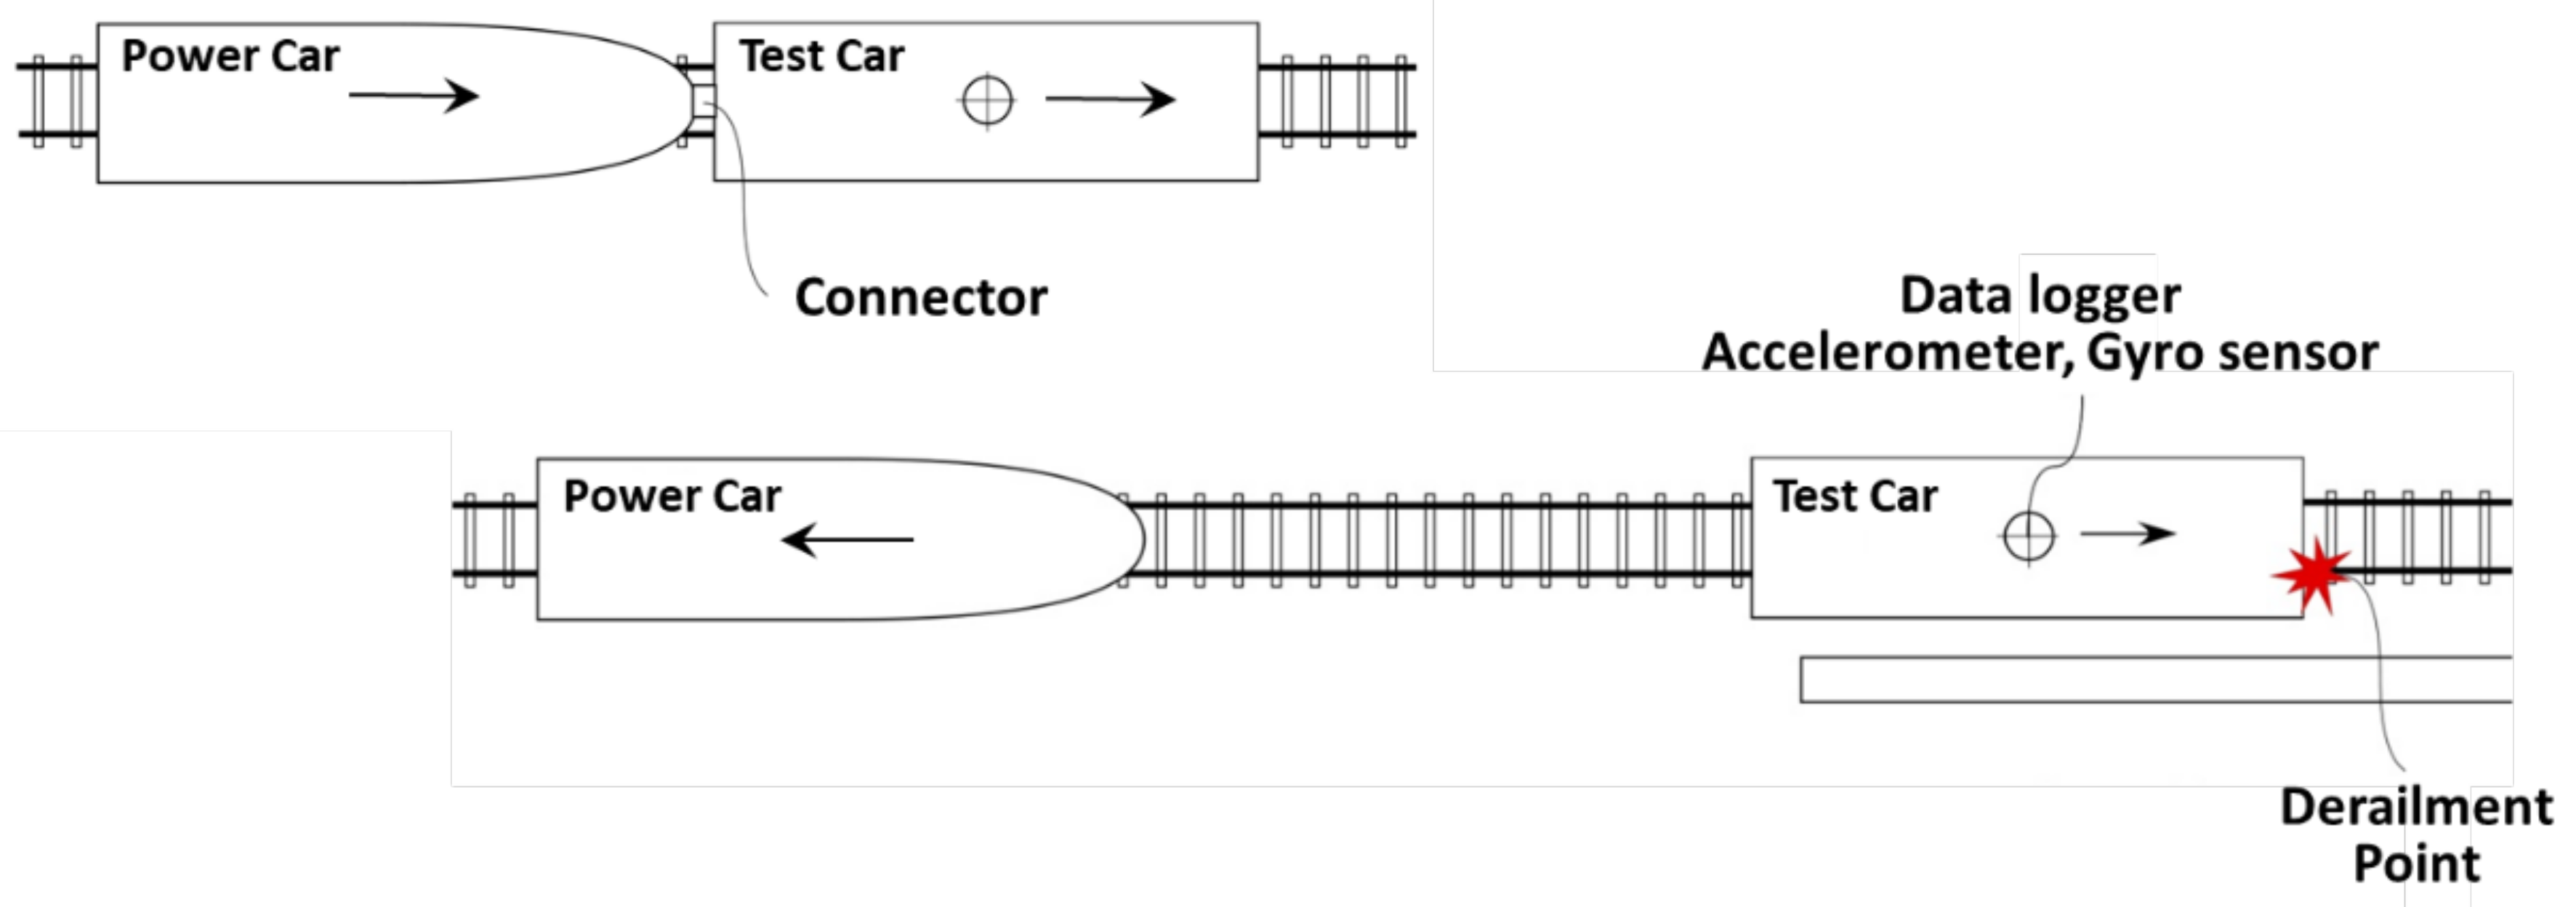
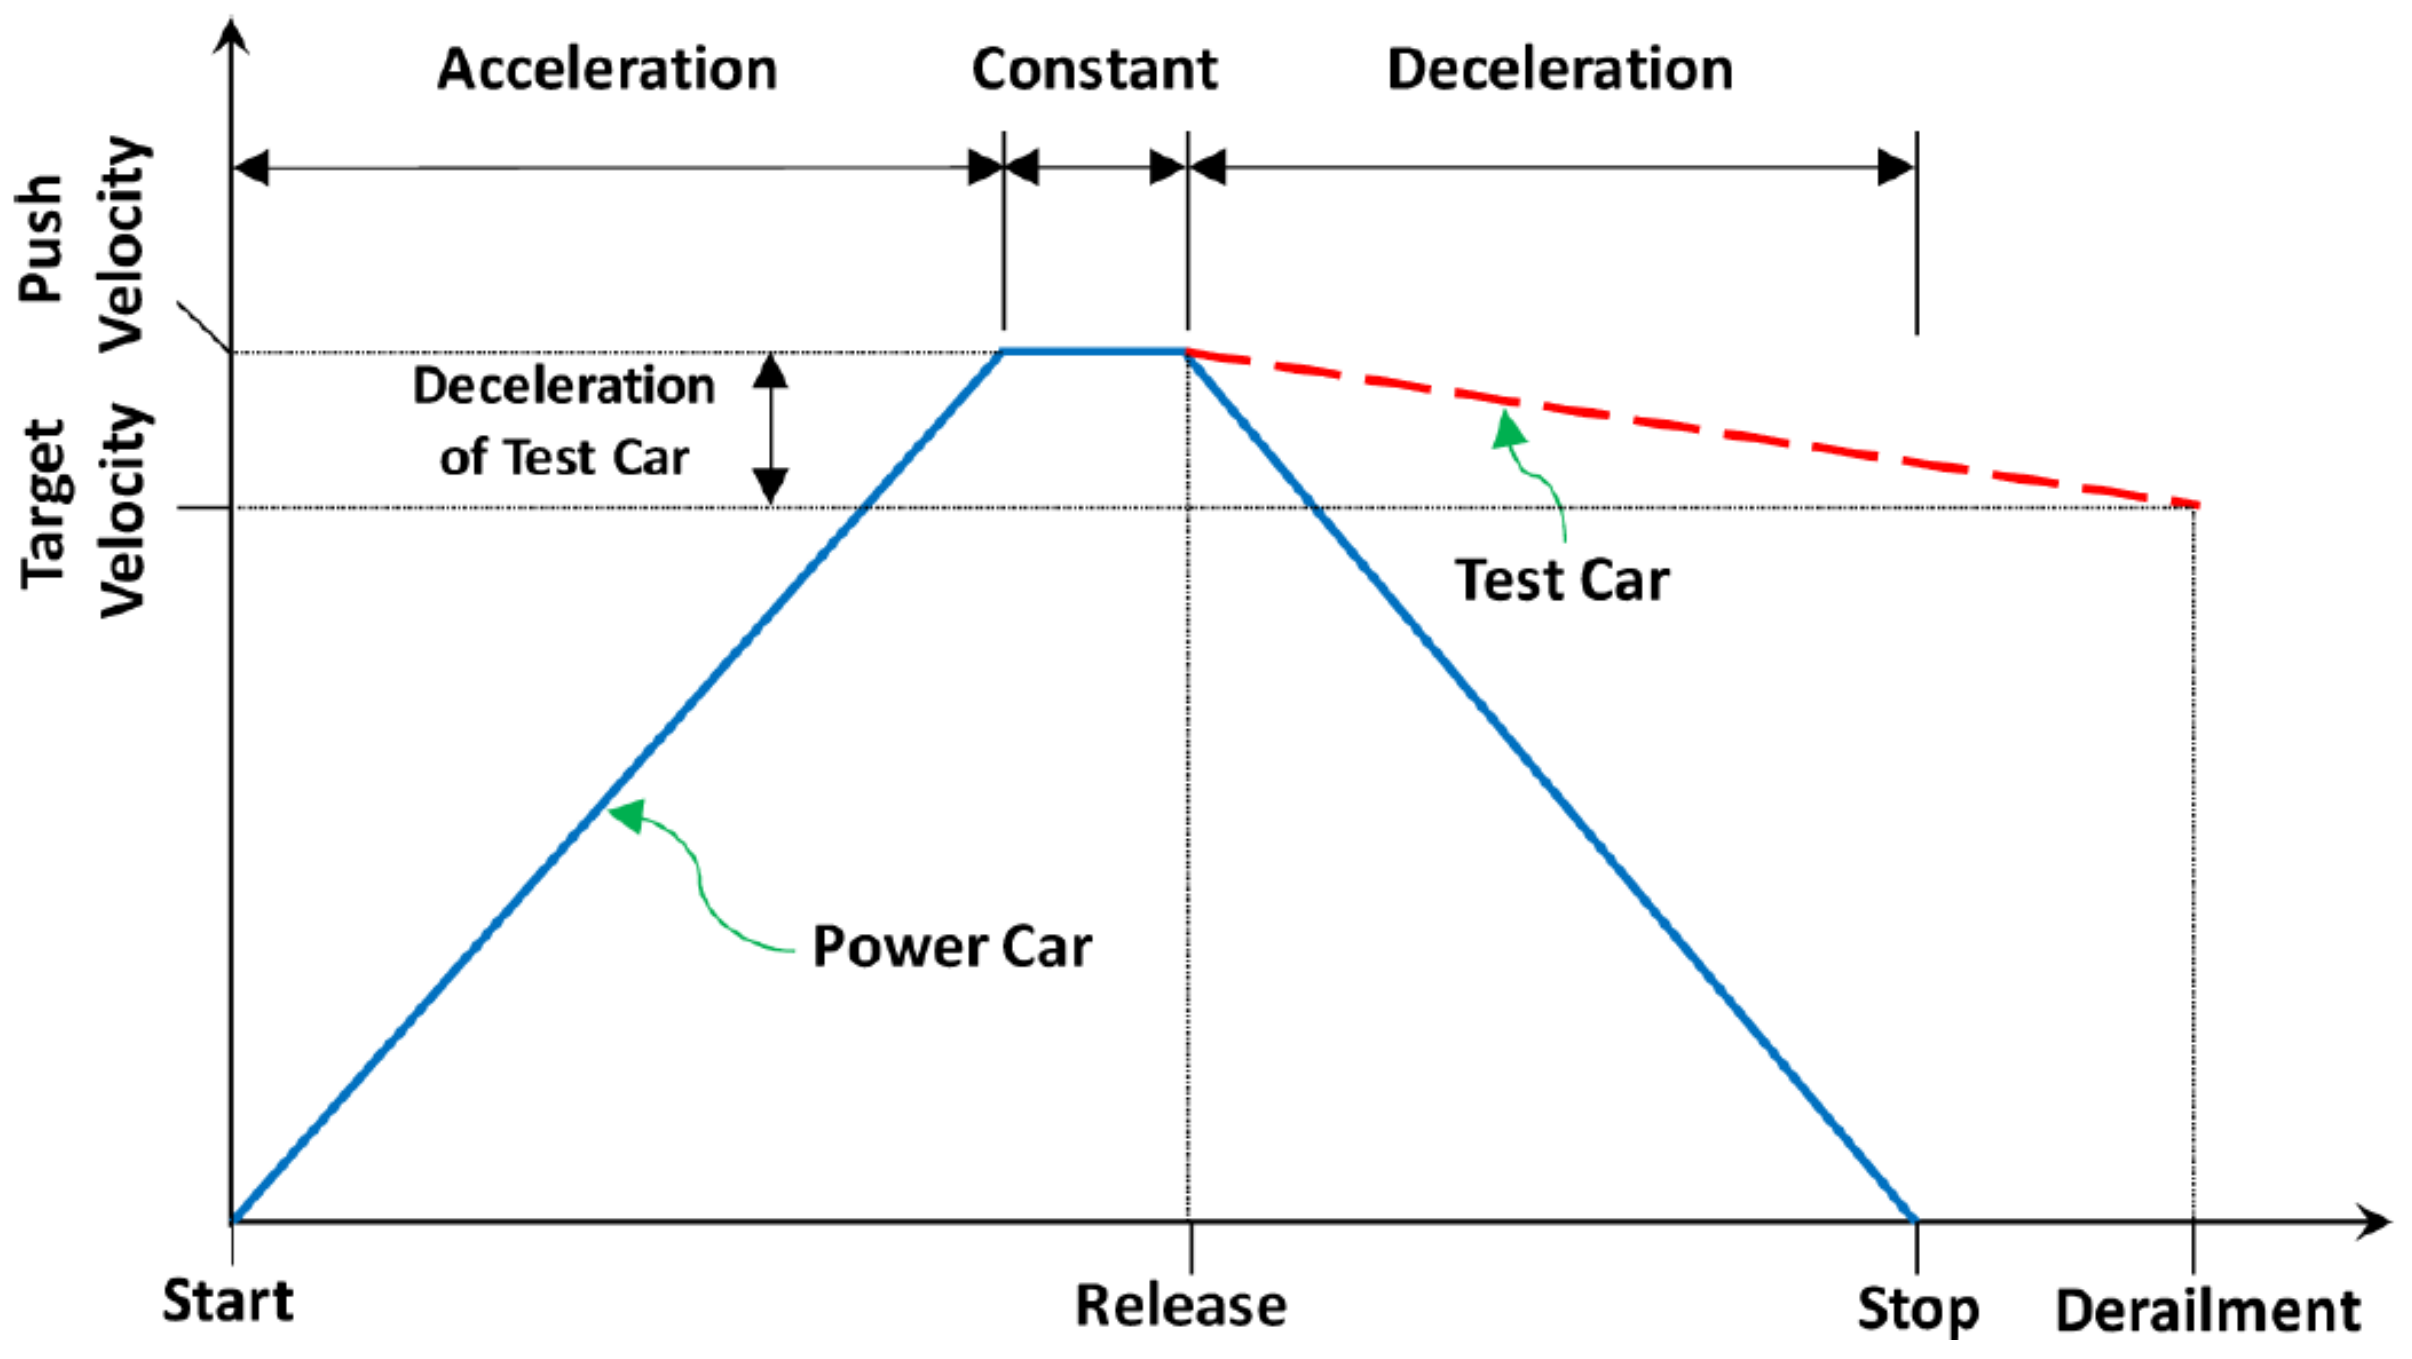
2.6. Running Diagram of the Power Car and Test Bogie

It was necessary to determine the running diagram of the power car and test bogie to achieve the target speed of the test bogie and to ensure the safety of the power car after releasing the test bogie. Figure 14 shows a schematic view of the running diagram of the power car and test bogie. The blue solid line and red dashed line represent the running diagrams of the power car and the test bogie, respectively. Before releasing the test bogie, the power car and the test bogie move together. The velocity at the release time is larger than the target speed. After releasing the test bogie, the power car reduces its speed and stops before the derailment point. The test bogie reaches the target velocity at the derailment point and is derailed.
The distance to the release point depends on the target speed and acceleration capacity of the power car. The running diagram was constructed from the results of several preliminary tests. In this study, the target speeds of the test bogie were 30 km/h and 55 km/h. Figure 15 shows a representative running diagram of the power car through the preliminary tests. An acceleration distance of about 480 m was required for the stationary power car to accelerate to about 56 km/h, and a braking distance of about 150 m was required for subsequent stops. The deceleration to the derailment point after the release of the test bogie was approximately 1–2 km/h. Therefore, the running distance of the power car to ensure safety during the experiment with a target speed of 50 to 55 km/h was determined to be 650 m. In addition, an acceleration distance of about 140 m was required for the power car to accelerate to about 32 km/h, and a braking distance of about 90 m was required for subsequent stops. The deceleration to the derailment point after the release of the test bogie was approximately 2–3 km/h. Thus, the running distance of the power car to ensure safety with a target speed of 25 to 30 km/h was determined to be 250 m.

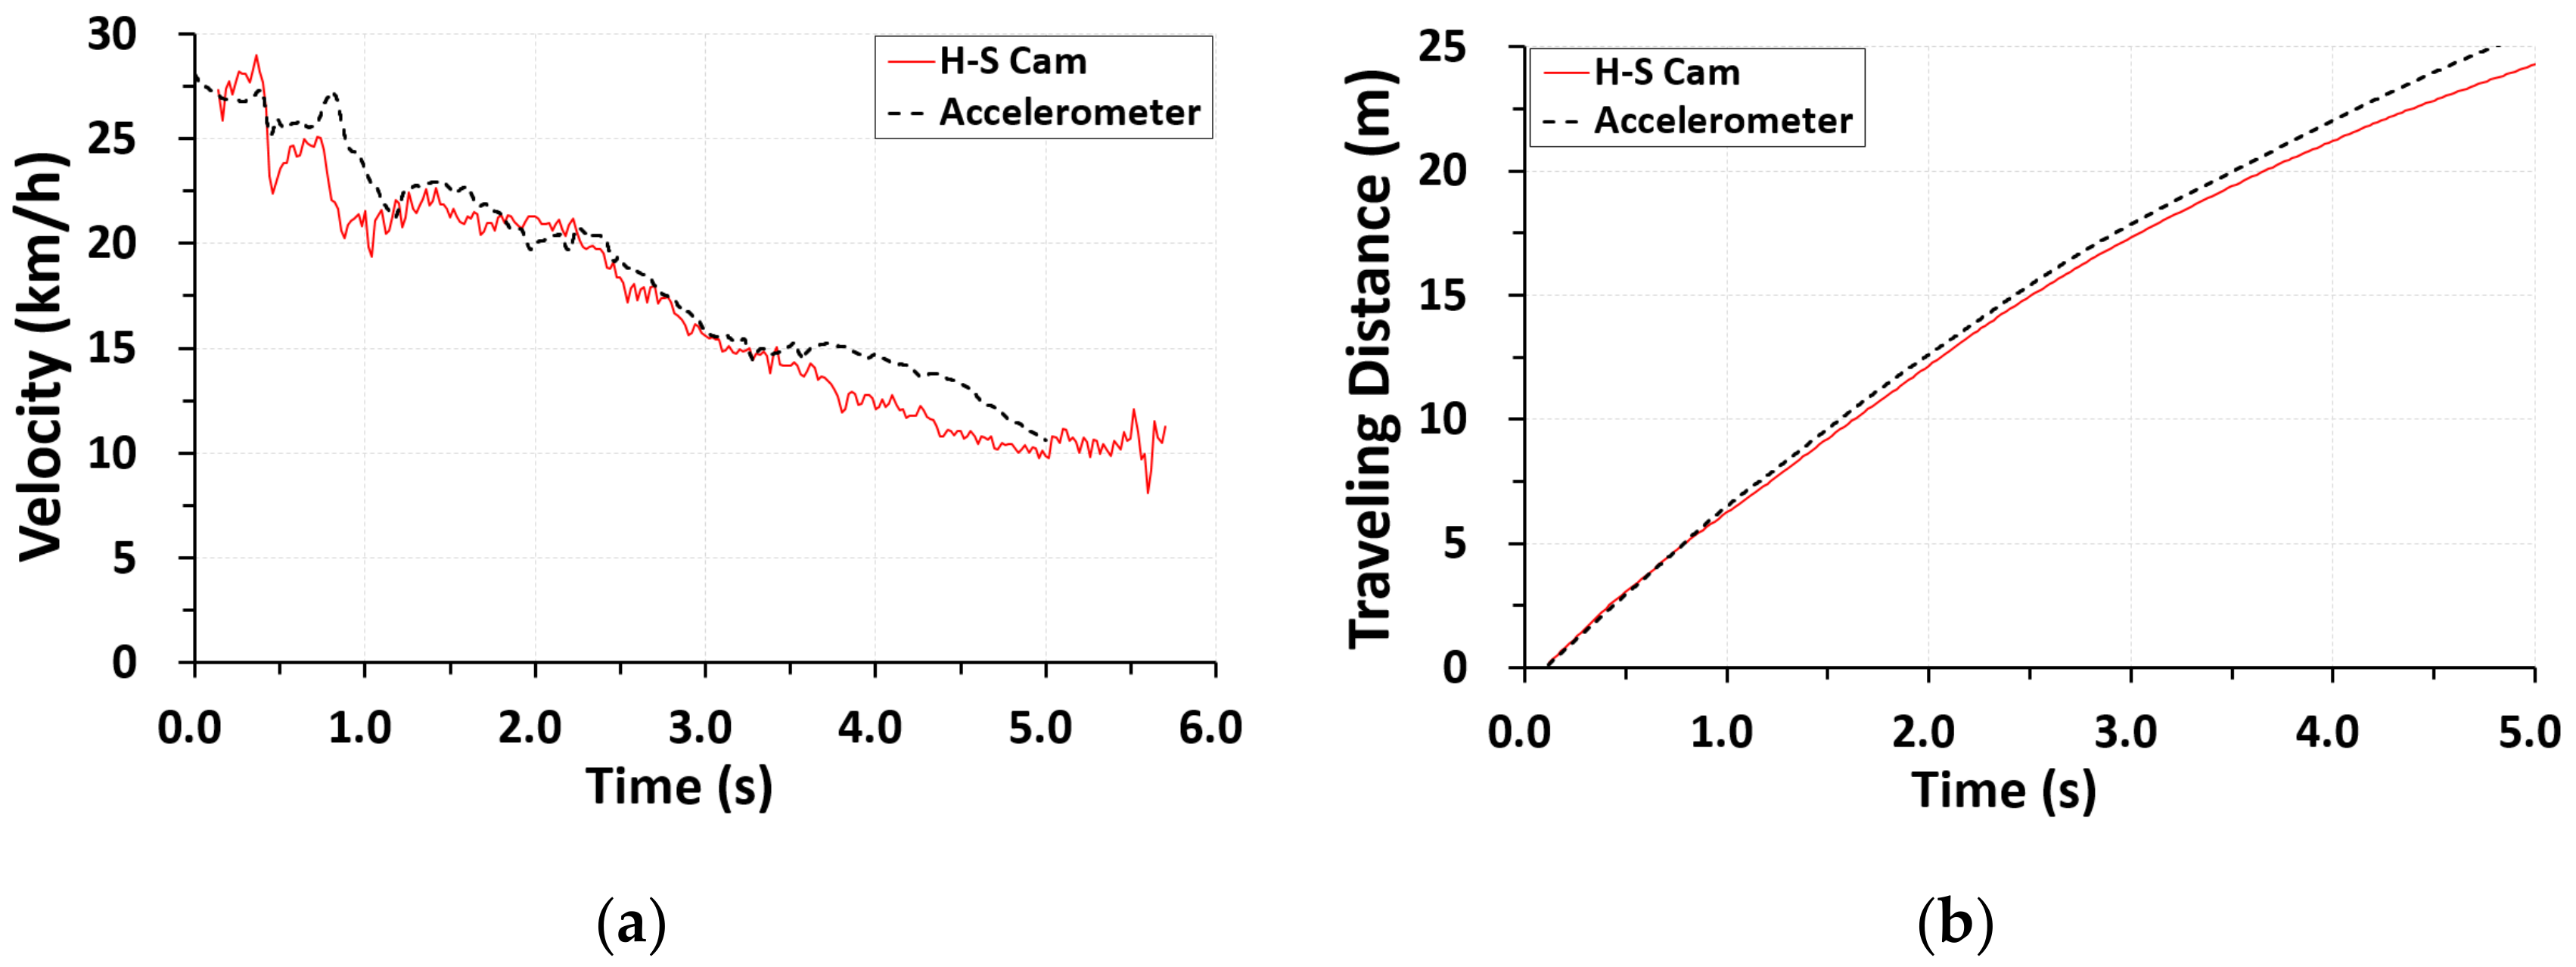
2.7. Post-Processing of Data

It is necessary to conduct a filtering process on raw data since raw data may contain unexpected noise, especially in the case of impact or collision testing. In the case of car collision testing, the data are analyzed after filtering the raw data obtained at a 1000 Hz or 10,000 Hz frequency. Usually, the moving average method is used for the filtering [17,18]. The moving average method is used not only for the smoothing of the data, but also for the evaluation of equivalent static design force. A previous study reported that the moving average method gave a reasonable estimation of the equivalent static design load [19]. Thus, the 50 ms moving average method was applied with 10,000 Hz data sampling in this study.

3. Experimental Results

3.1. Test Cases

After derailment, wheel–rail interaction disappears, and the train runs along the top surface of the track. In this case, various contact and impact conditions, such as gear box–rail, wheel–rail fastener, and wheel–sleeper, arise. These various conditions affect the post-derailment behavior. The post-derailment behavior is an important consideration for the design of derailment protection facilities. In this study, full-scale train bogie derailment tests were conducted. The test bogie and test methodologies are detailed in Section 2. The main test parameter of this study was the derailment velocity. Two different derailment velocities were considered. For Cases #1 and #2, the derailment speeds were 28.08 km/h and 55.05 km/h, respectively.

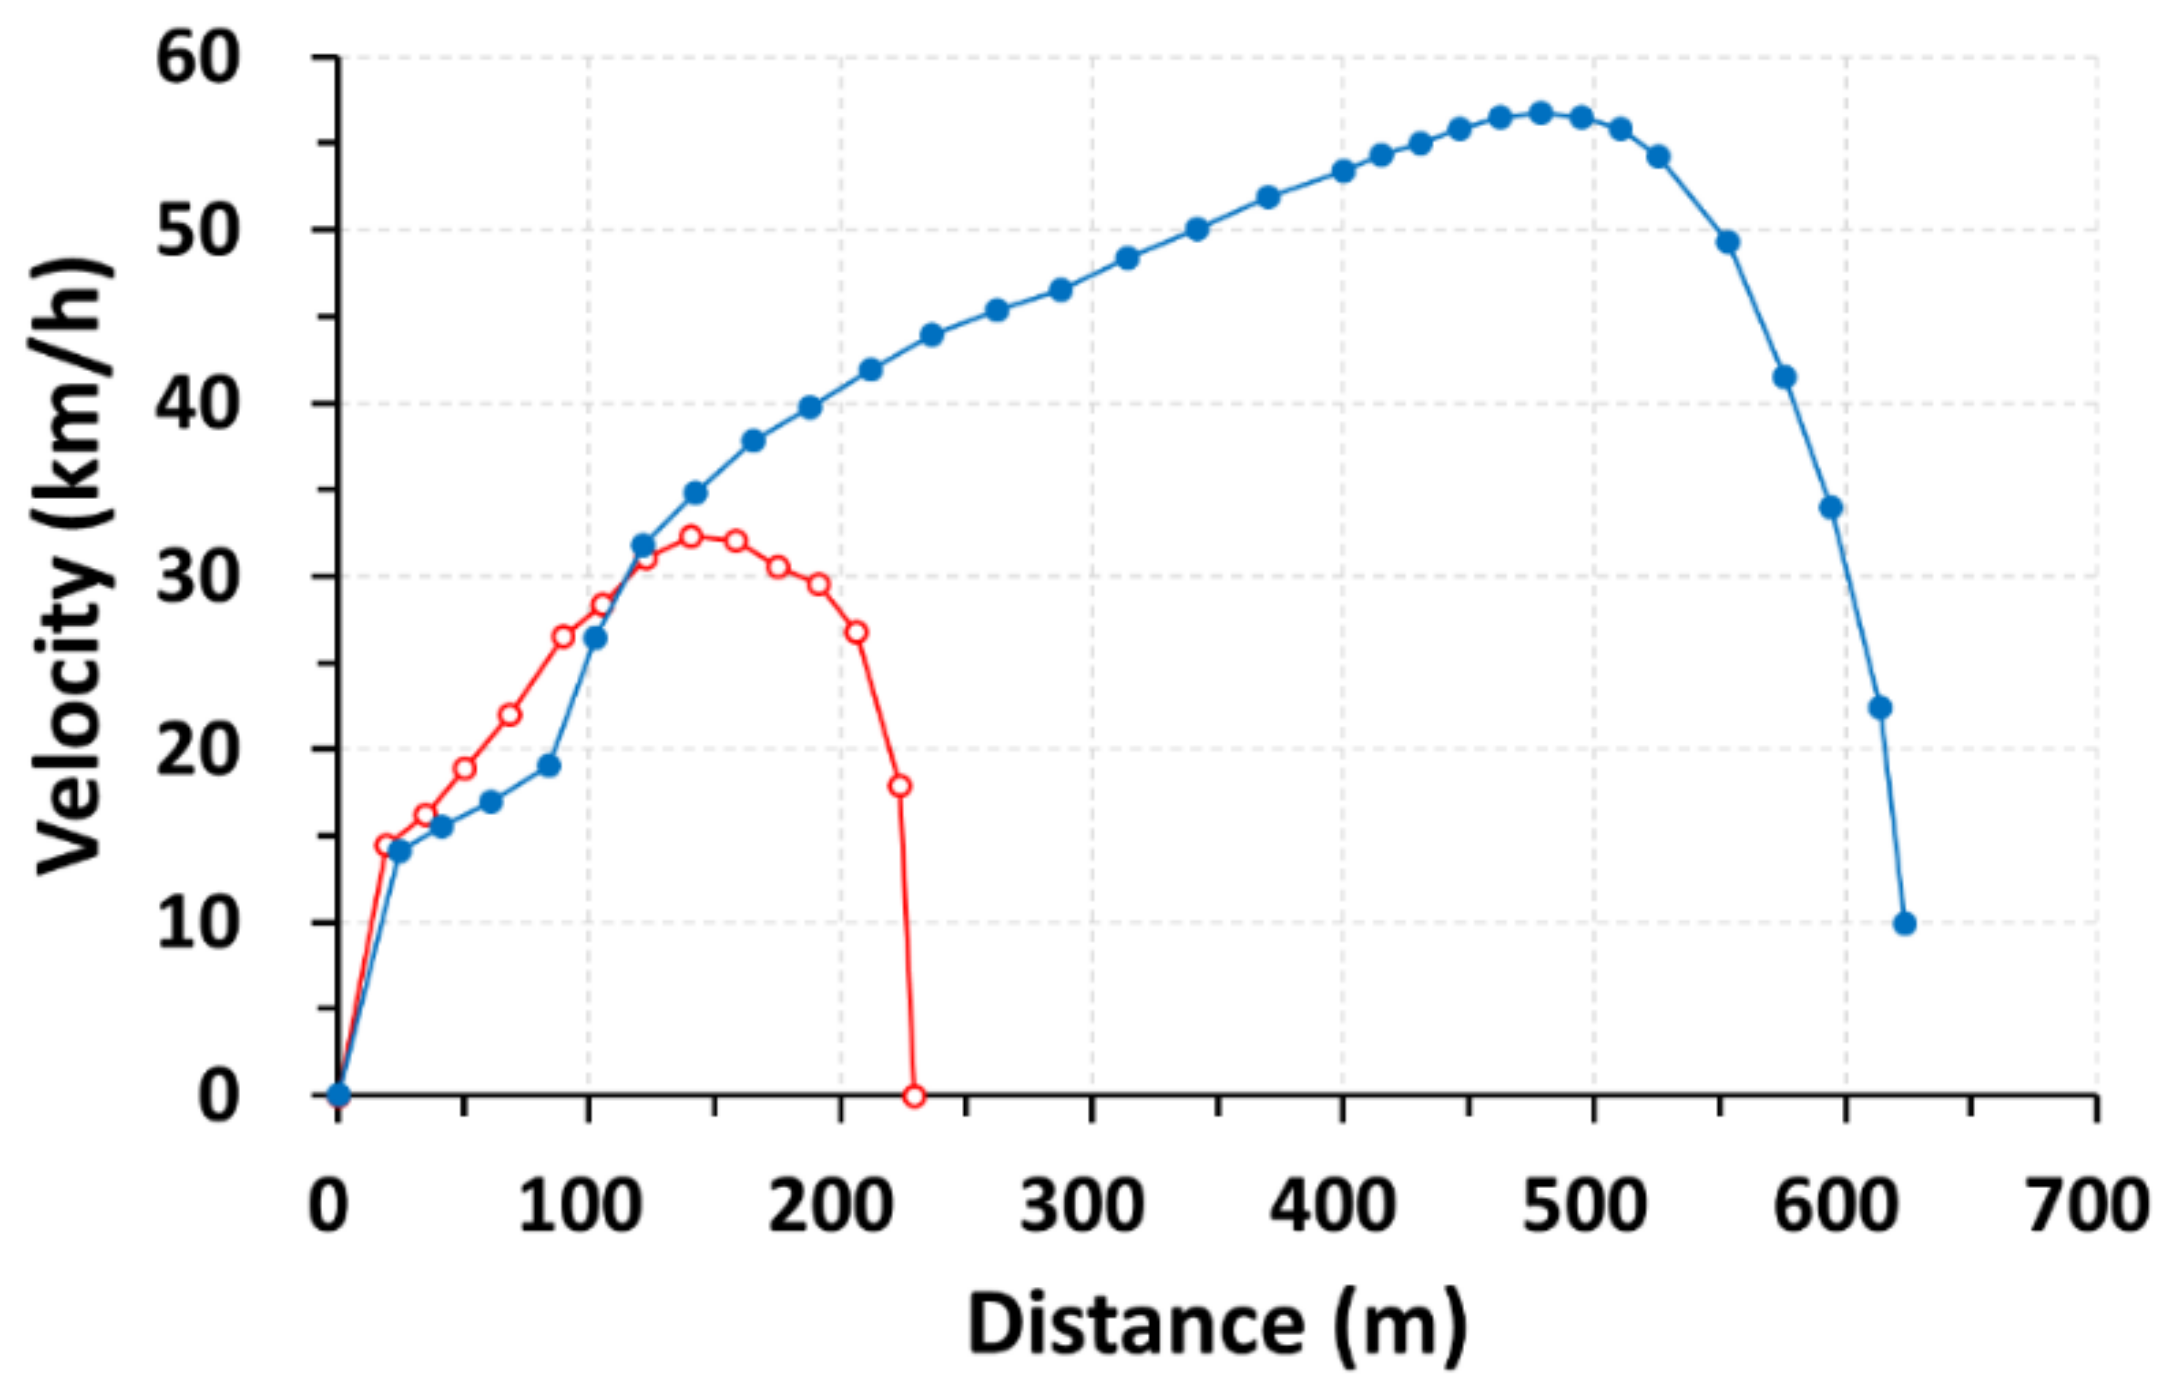
3.2. Case #1 (Derailment Velocity of 28.08 km/h)

For Case #1, the target speed range was 25–30 km/h. The measured derailment velocity was 28.08 km/h. Figure 16 shows a front view of the post-derailment behavior in Case #1. It can be seen that the bogie ran in the right lateral direction after derailment (0.410–1.810 s), and the left wheel continuously contacted the hump of the concrete track (1.810–3.570 s). Then, the bogie moved to the left direction without contact between the right rail and left wheel (3.570–5.630 s). The direction was changed due to the effect of the hump in this case. In this study, the Rheda 2000 type concrete track was used, and the hump in this track affected the post-derailment behavior.
The acceleration data were analyzed to calculate the velocity and traveling distance of the test bogie. The analysis results were compared with the results obtained in the image data from the high-speed cameras for cross-validation of the data. It is known that the image analysis offers a certain potential for the dynamic investigation [20]. The velocity and traveling distance of the test bogie were also calculated by target mark tracking from the image data, as shown in Figure 17. The results are shown in Figure 18 as a solid line. It can be seen that the velocity obtained from the high-speed camera showed initial fluctuation. However, the overall trend of the velocity was similar to that from the accelerometer. The velocity decreased almost linearly, as shown in Figure 18a. The slope of Figure 18a represents the deceleration, and it was approximately −0.97 m/s2. By integrating the acceleration data twice, the traveling distance could be calculated, as shown in Figure 18b. The traveling distances obtained from the accelerometer and high-speed cameras were similar to each other. The discrepancy may come from accumulated error during the integration or distortion of the image by the use of a wide-angle lens.
The longitudinal, lateral, and vertical acceleration data of the test bogie were analyzed with the video images together. The first impact was observed at 0.410 s after derailment, as shown in Figure 19. It can be seen that there were sudden changes in acceleration at the time of the first impact, as shown in Figure 19a. The maximum acceleration was found in the vertical direction, and it was 5.07 g (49.78 m/s2). If the total mass of the bogie is included in the calculation of the impact force, it is equivalent to approximately 207 kN of impact force. The first impact occurred between the left wheel and hump, as shown in Figure 19b. Figure 19c shows the damage to the hump and rail fastener due to the first impact.
Similar to Figure 19, information about the second and third impacts is presented in Figure 20. The second and third impacts were observed at 0.750 s and 0.810 s, respectively. In the second impact, the right and left rear wheels impacted the fourth hump, as shown in Figure 20b,c. The maximum vertical acceleration was approximately 5.57 g—larger than that from the first impact. This may be attributed to the pitching moment of the bogie after the first impact. In the case of the third impact, the front right wheel contacted the sixth and seventh humps in succession. At the third impact, the peak of the vertical acceleration was markedly decreased.
After the third impact, the test bogie ran the track without any further significant impact with track components. However, considerable lateral displacement was observed. For example, at 1.170 s, the front left wheel was located at almost the center of the track, as shown in Figure 21a. The lateral displacement continuously increased at 1.170–1.810 s, and the front left wheels contacted the humps in the left rail at 1.810 s. Then, the test bogie returned to the center of the track at 3.750–5.630 s, as shown in Figure 21b.
In summary, for Case #1, where the derailment velocity was 28.08 km/h, the derailed test bogie ran the track with considerable lateral movement. The lateral movement was restrained by contact with the humps in the concrete track. Then, the test bogie returned to the center of the track. The whole trace of the test bogie is shown in Figure 22. The maximum vertical acceleration was approximately 5.57 g at the second impact with the humps. The maximum lateral acceleration was approximately 2.62 g at the first impact with the humps. From the results, it can be seen that the effect of the humps on the post-derailment behavior was significant when the Rheda 2000 track system was used. Thus, the type of track must be considered when evaluating the post-derailment behavior of a derailed train.

3.3. Case #2 (Derailment Velocity of 55.05 km/h)

In Case #1, the derailed wheel was not guided by the rail or containment wall. However, it was guided by the humps on the track. To identify the effects of the rail and containment wall, the derailment velocity was increased for Case #2. The target derailment velocity range was 50–55 km/h. The measured derailment speed was 55.05 km/h. Figure 23 presents the variation in the velocity and longitudinal traveling distance after derailment for Case #2. The data were obtained by the accelerometer as well as the high-speed cameras. However, the data from the high-speed cameras cannot be interpreted well after 2 s since the test bogie left the camera range due to the increased speed of the test bogie. The deceleration of the test bogie was approximately −1.48 m/s2. The traveling length was approximately 38 m at 3 s.
Figure 24 shows the test bogie at derailment. It was found that the test bogie seemed to jump, bypassing the derailment device as shown in Figure 24a. Then, the front left wheel contacted with the third hump and rail fastener at 0.240 s due to the roll of the test bogie, as shown in Figure 24b. When the test bogie passed through the derailment device, the vertical acceleration in Case #2 was much greater than that in Case #1 before the first wheel contact with the track (0.242 s), as shown in Figure 24c. If higher-speed experiments are carried out, the derailment device should be improved because excessive jumping is expected.
The main impact to the track was observed around from 0.4 s to 0.7 s, as shown in Figure 25. At 0.460 s, the front right wheel came into contact with the eighth rail fastener. Then, the front right wheel impacted the ninth hump and the rear right wheel immediately came into contact with the seventh rail fastener. The maximum vertical acceleration was found at this time, and it was approximately 3.53 g. The maximum acceleration in Case #2 was smaller than that in Case #1. This is because increased velocity is related with the longitudinal direction and vertical impact force is mainly a function of the velocity in the vertical direction.
After 0.7 s, the test bogie ran the track with considerable lateral movement, similar to Case #1. However, for Case #2, the wheel flange was in contact with the rail as shown in Figure 26b. Then, the test bogie impacted the containment wall at 1.910 s, as shown in Figure 26c. The lateral acceleration was increased due to the impact with the rail and containment wall, as shown in Figure 26a. The lateral acceleration values were approximately 1.17 g (11.51 m/s2) and 0.75 g (7.36 m/s2) for the rail and containment wall impact, respectively. Thus, it was expected that the impact force on the containment wall would be reduced approximately 36% by the first guide by the rail for Case #2. Finally, the test bogie returned to the track center direction after containment wall impact, as shown in Figure 27.
As mentioned in the introduction, the basic concept of DCP type III is that the derailed train is first guided by the rail and the containment wall, preventing excessive lateral movement [8,21,22]. The containment wall installed in this test is DCP type III, and it was seen that the derailed train was effectively guided by DCP type III in test Case #2.

4. Conclusions

This study presented full-scale train bogie derailment test methodologies and post-derailment behavior based on the test results. The derailment tests were conducted at the bogie level, and the test speeds were 28.08 km/h and 55.05 km/h. The major findings of this study are as follows:
  • Train bogie derailment tests can be successfully conducted by using the methodologies proposed in this study. A push system and automatic release device for the test bogie were proposed. Also, a derailment device to induce wheel-climbing derailment and a simultaneous trigger system to synchronize different pieces of equipment were suggested. The proposed methodologies may be applicable to other types of full-scale derailment tests.
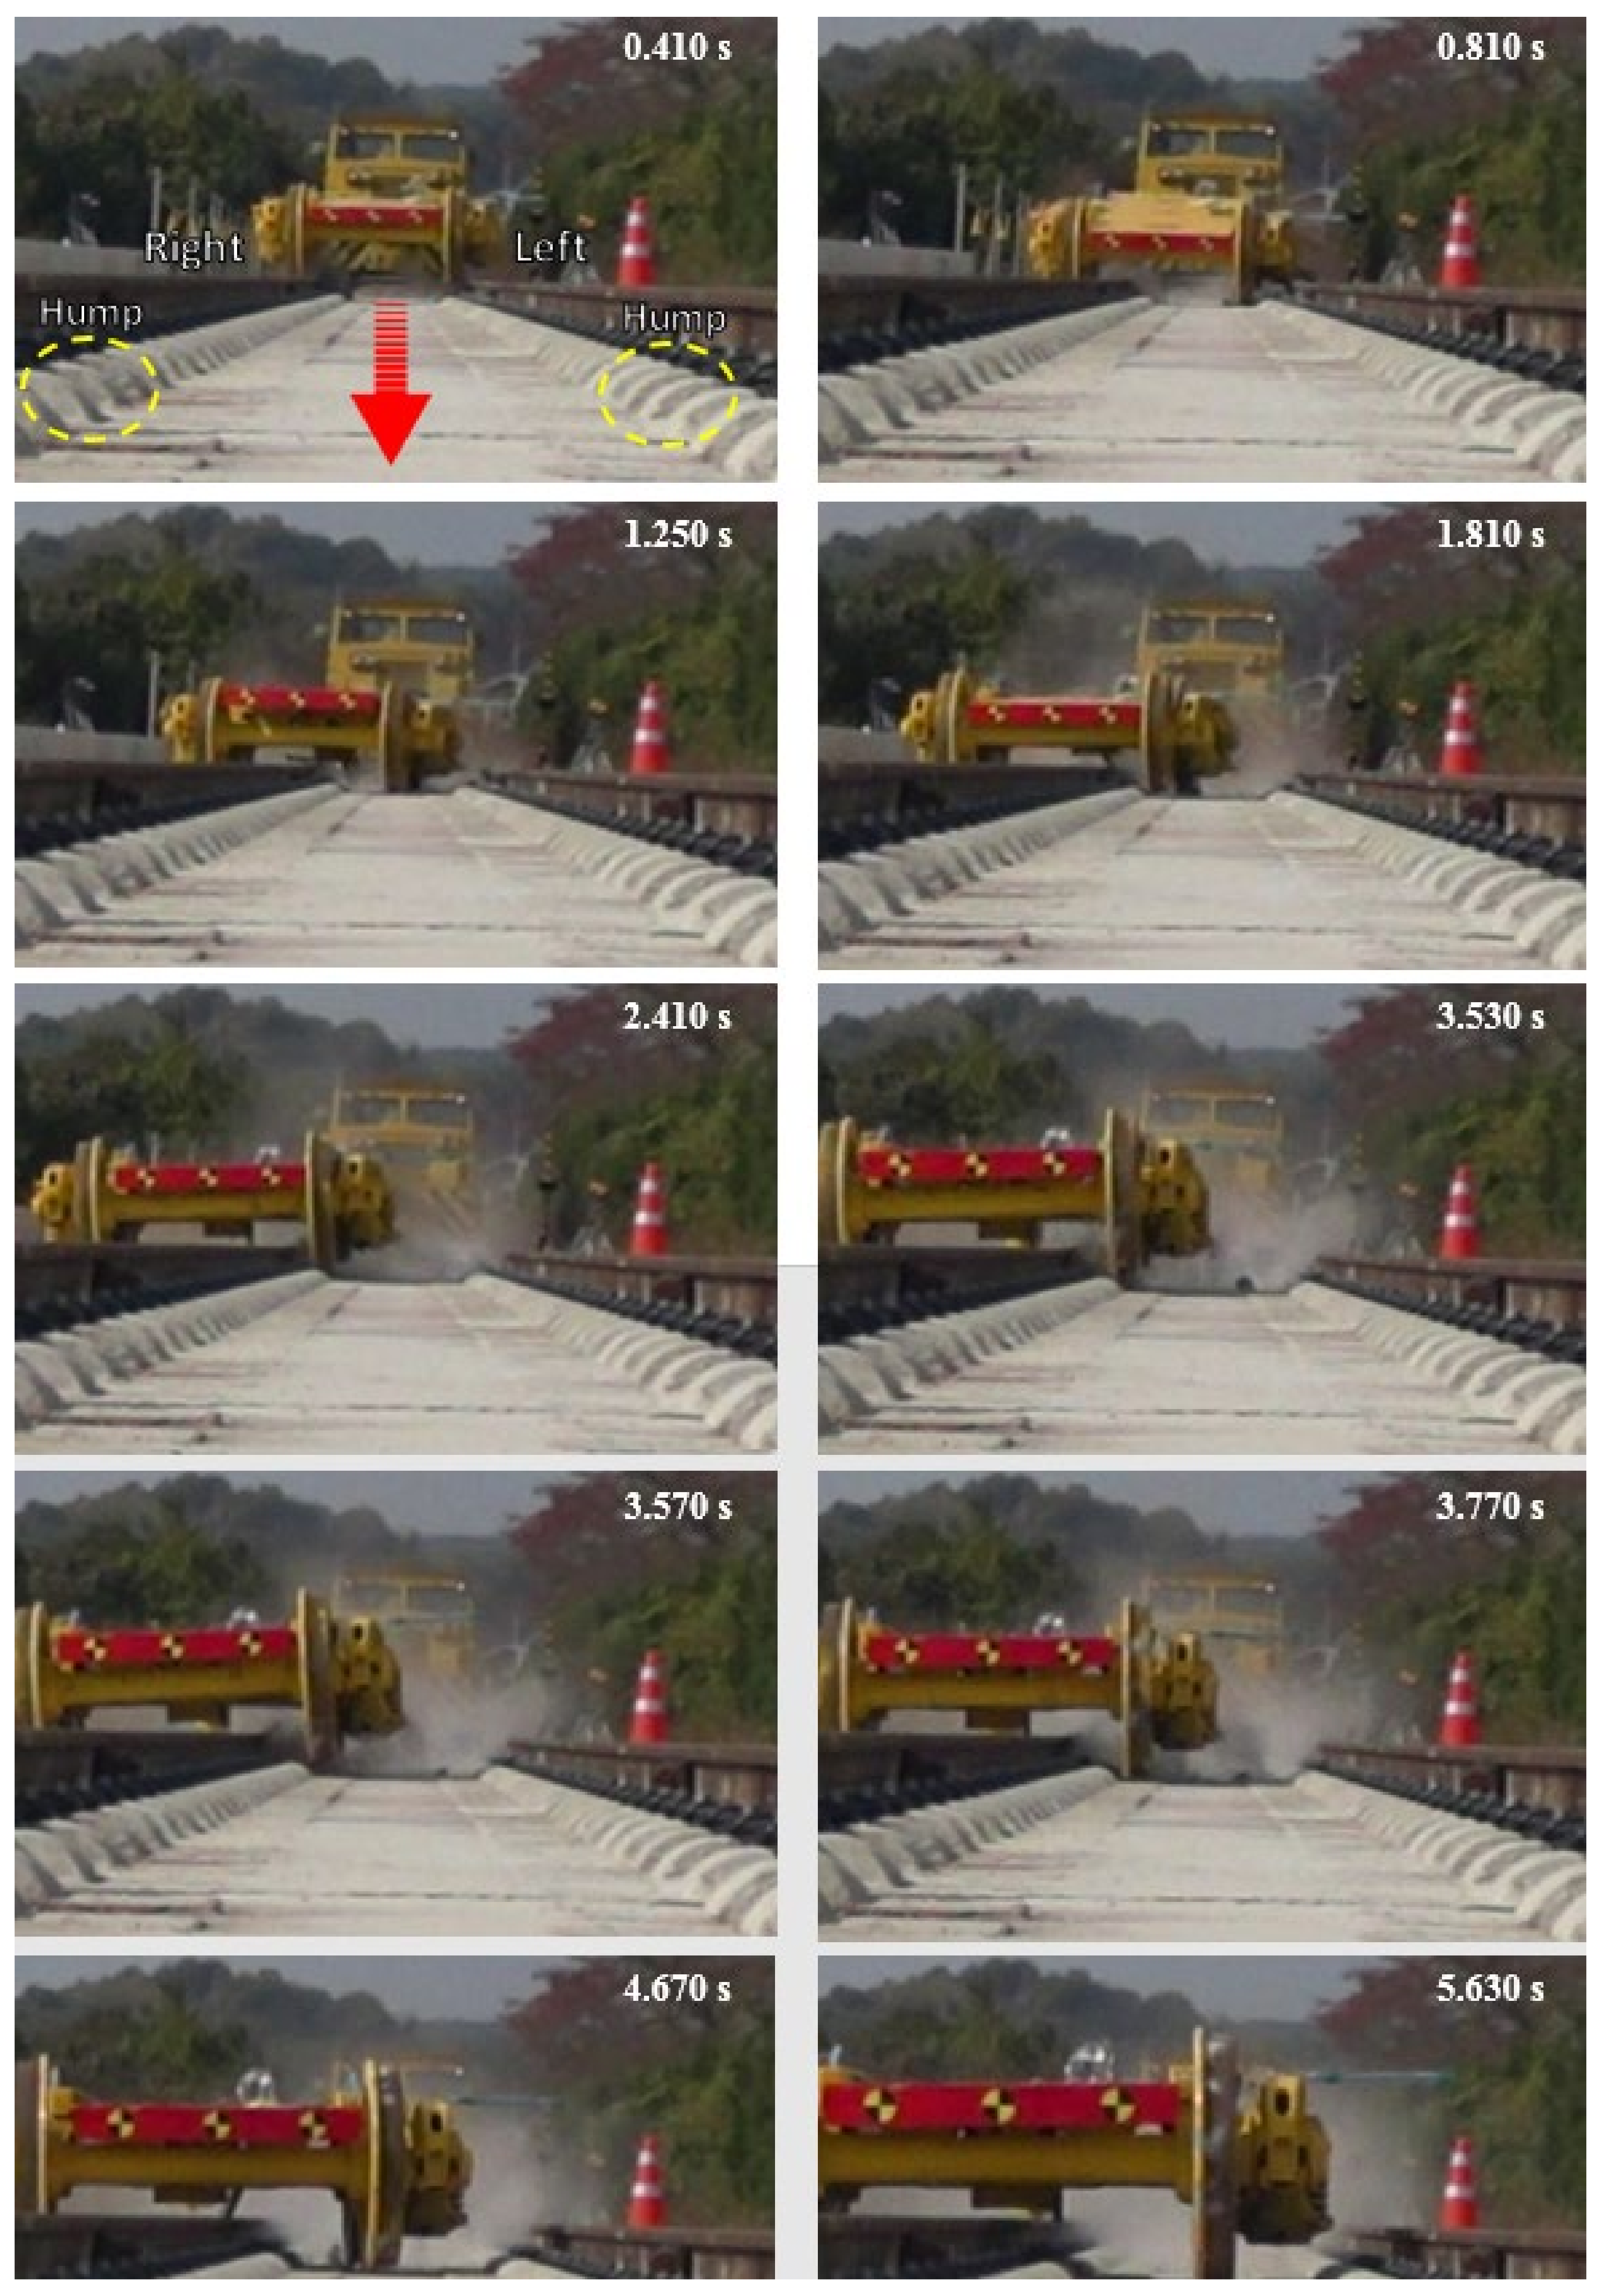
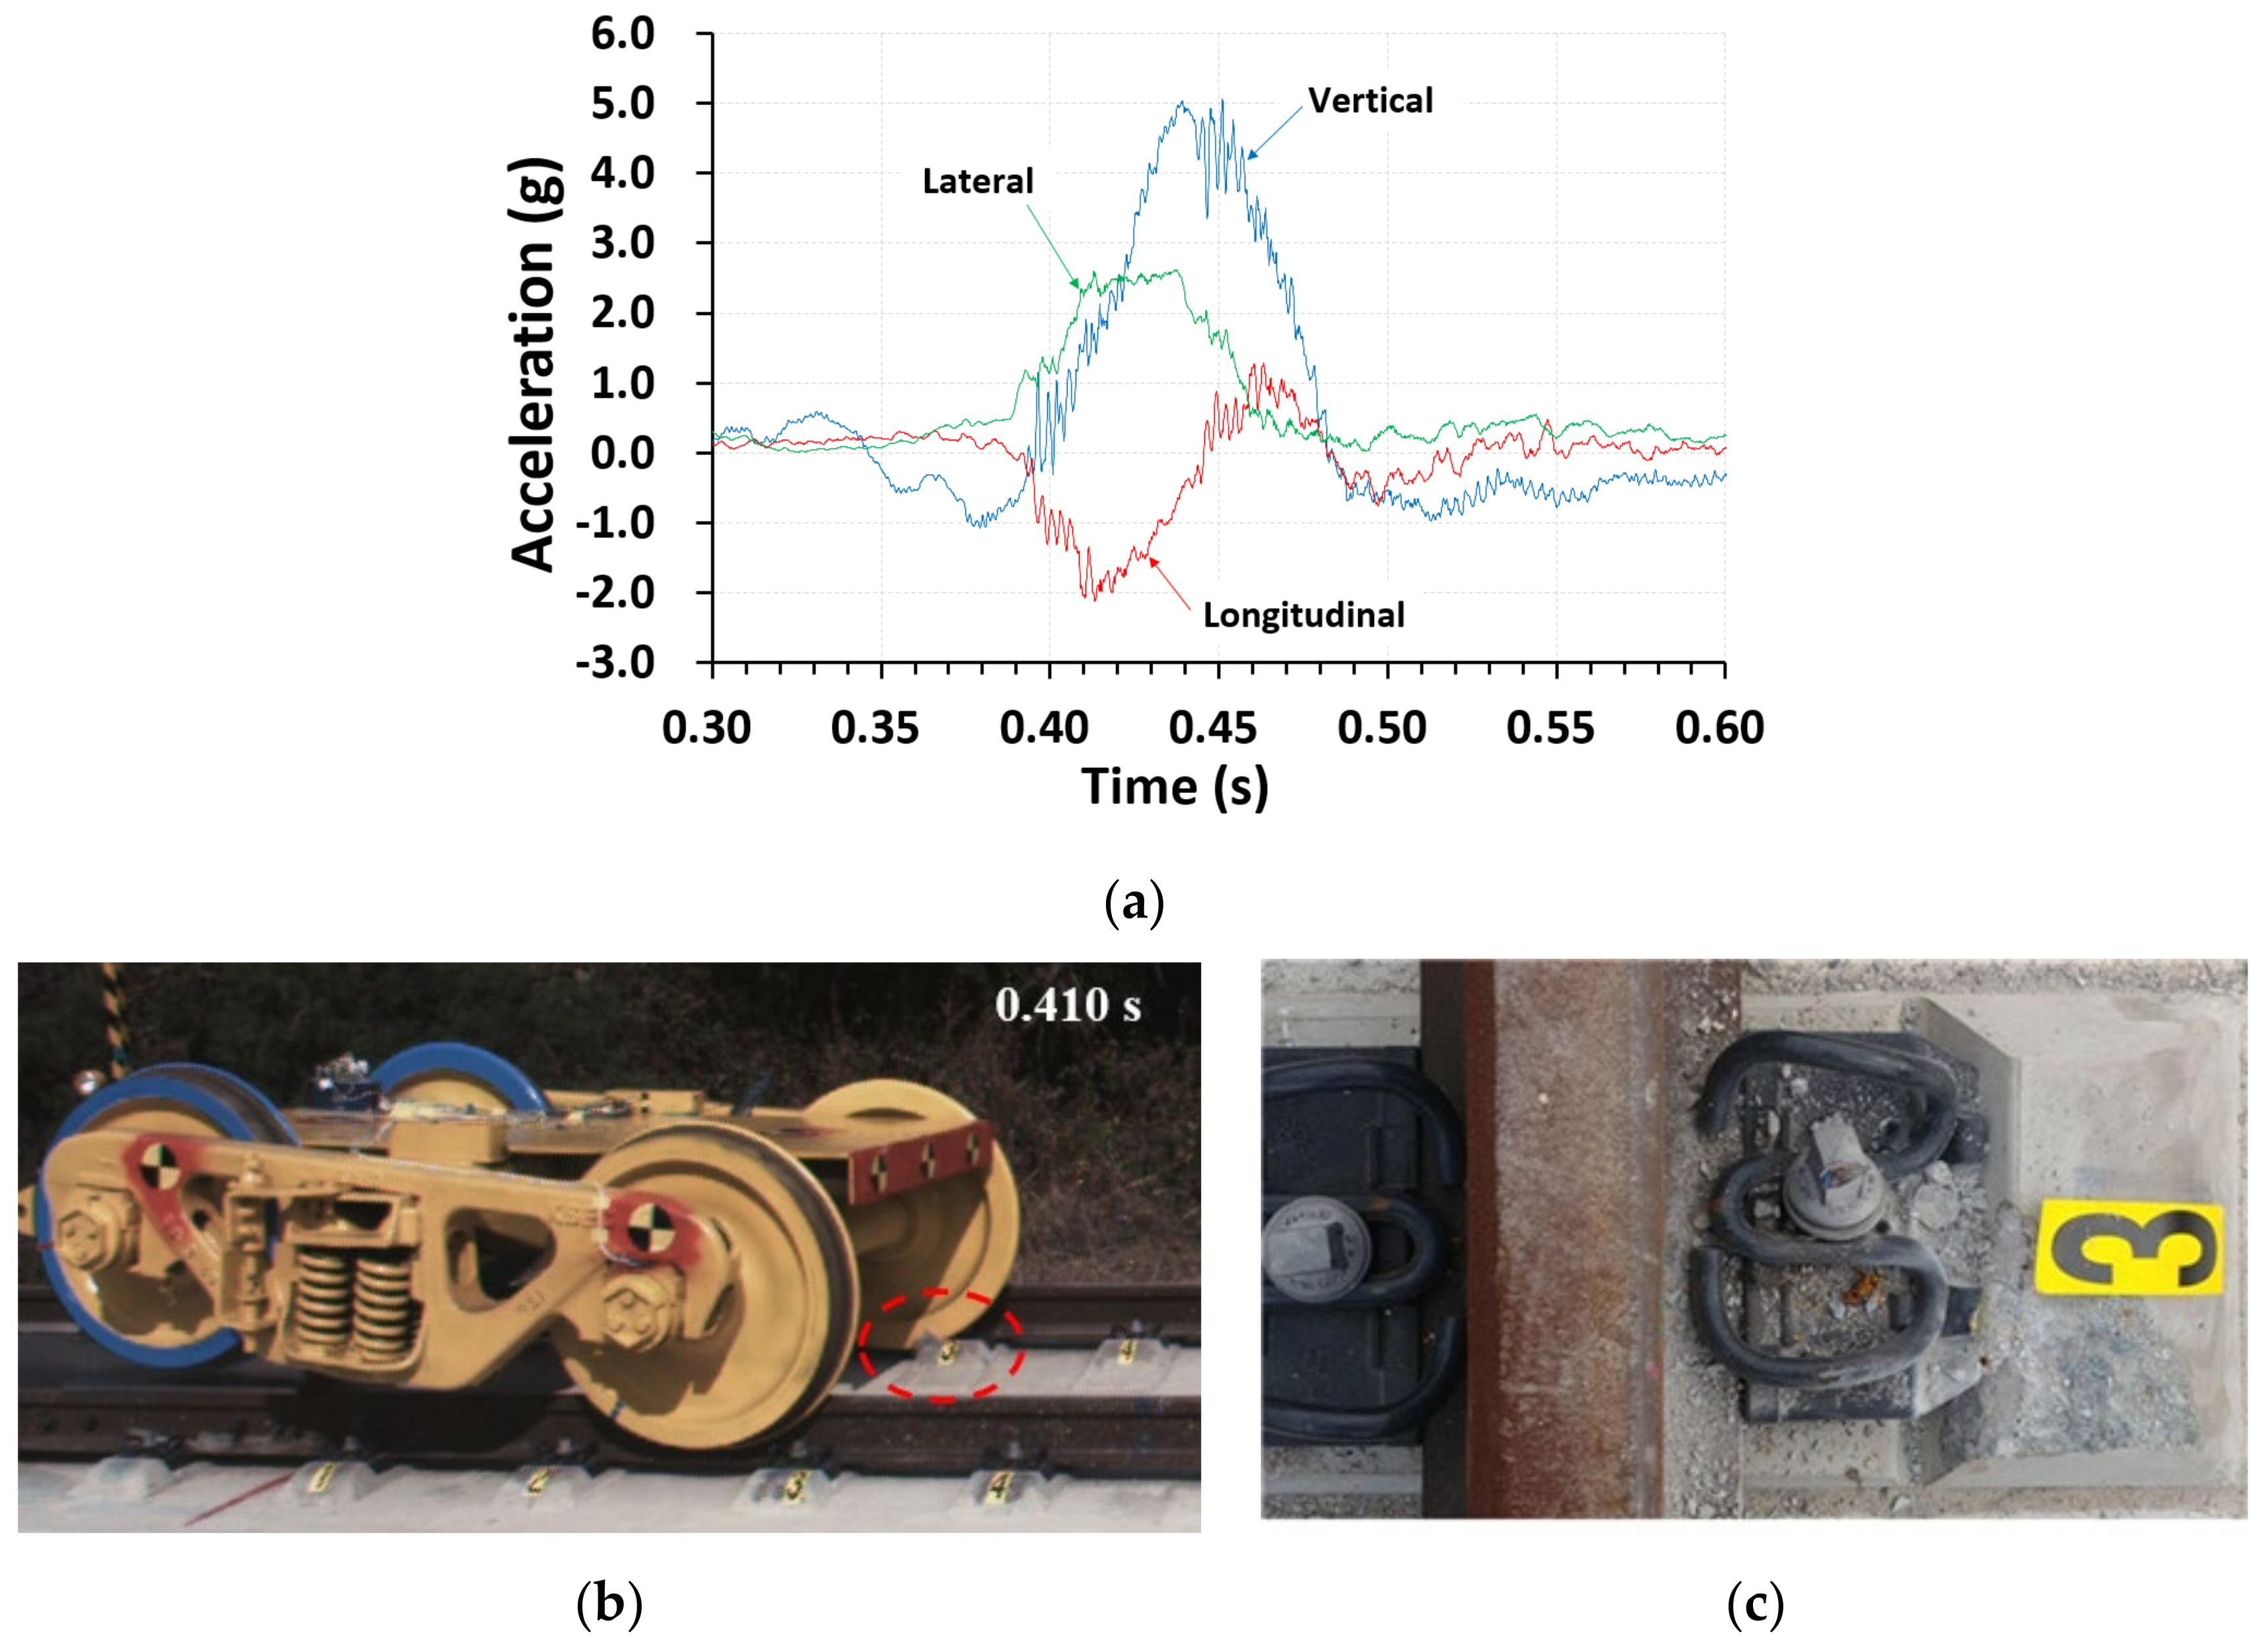
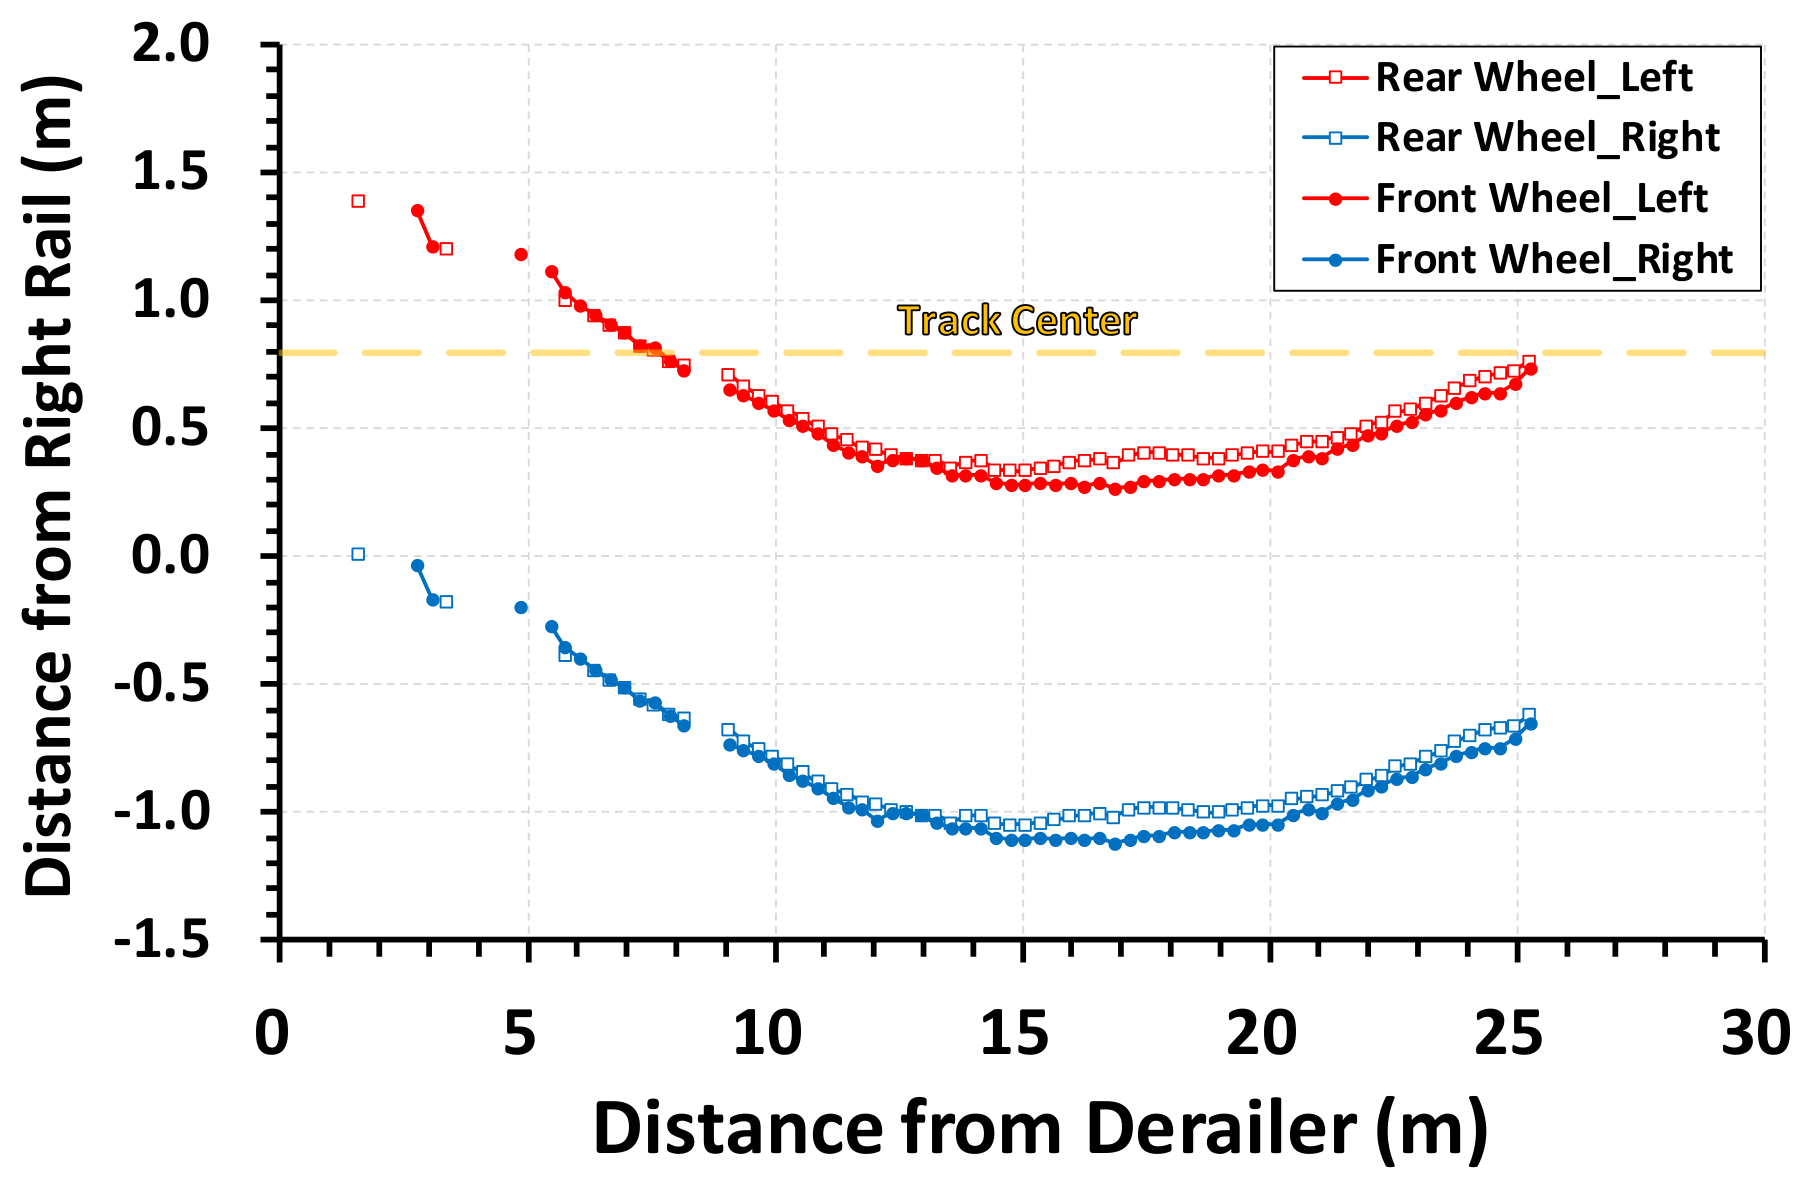
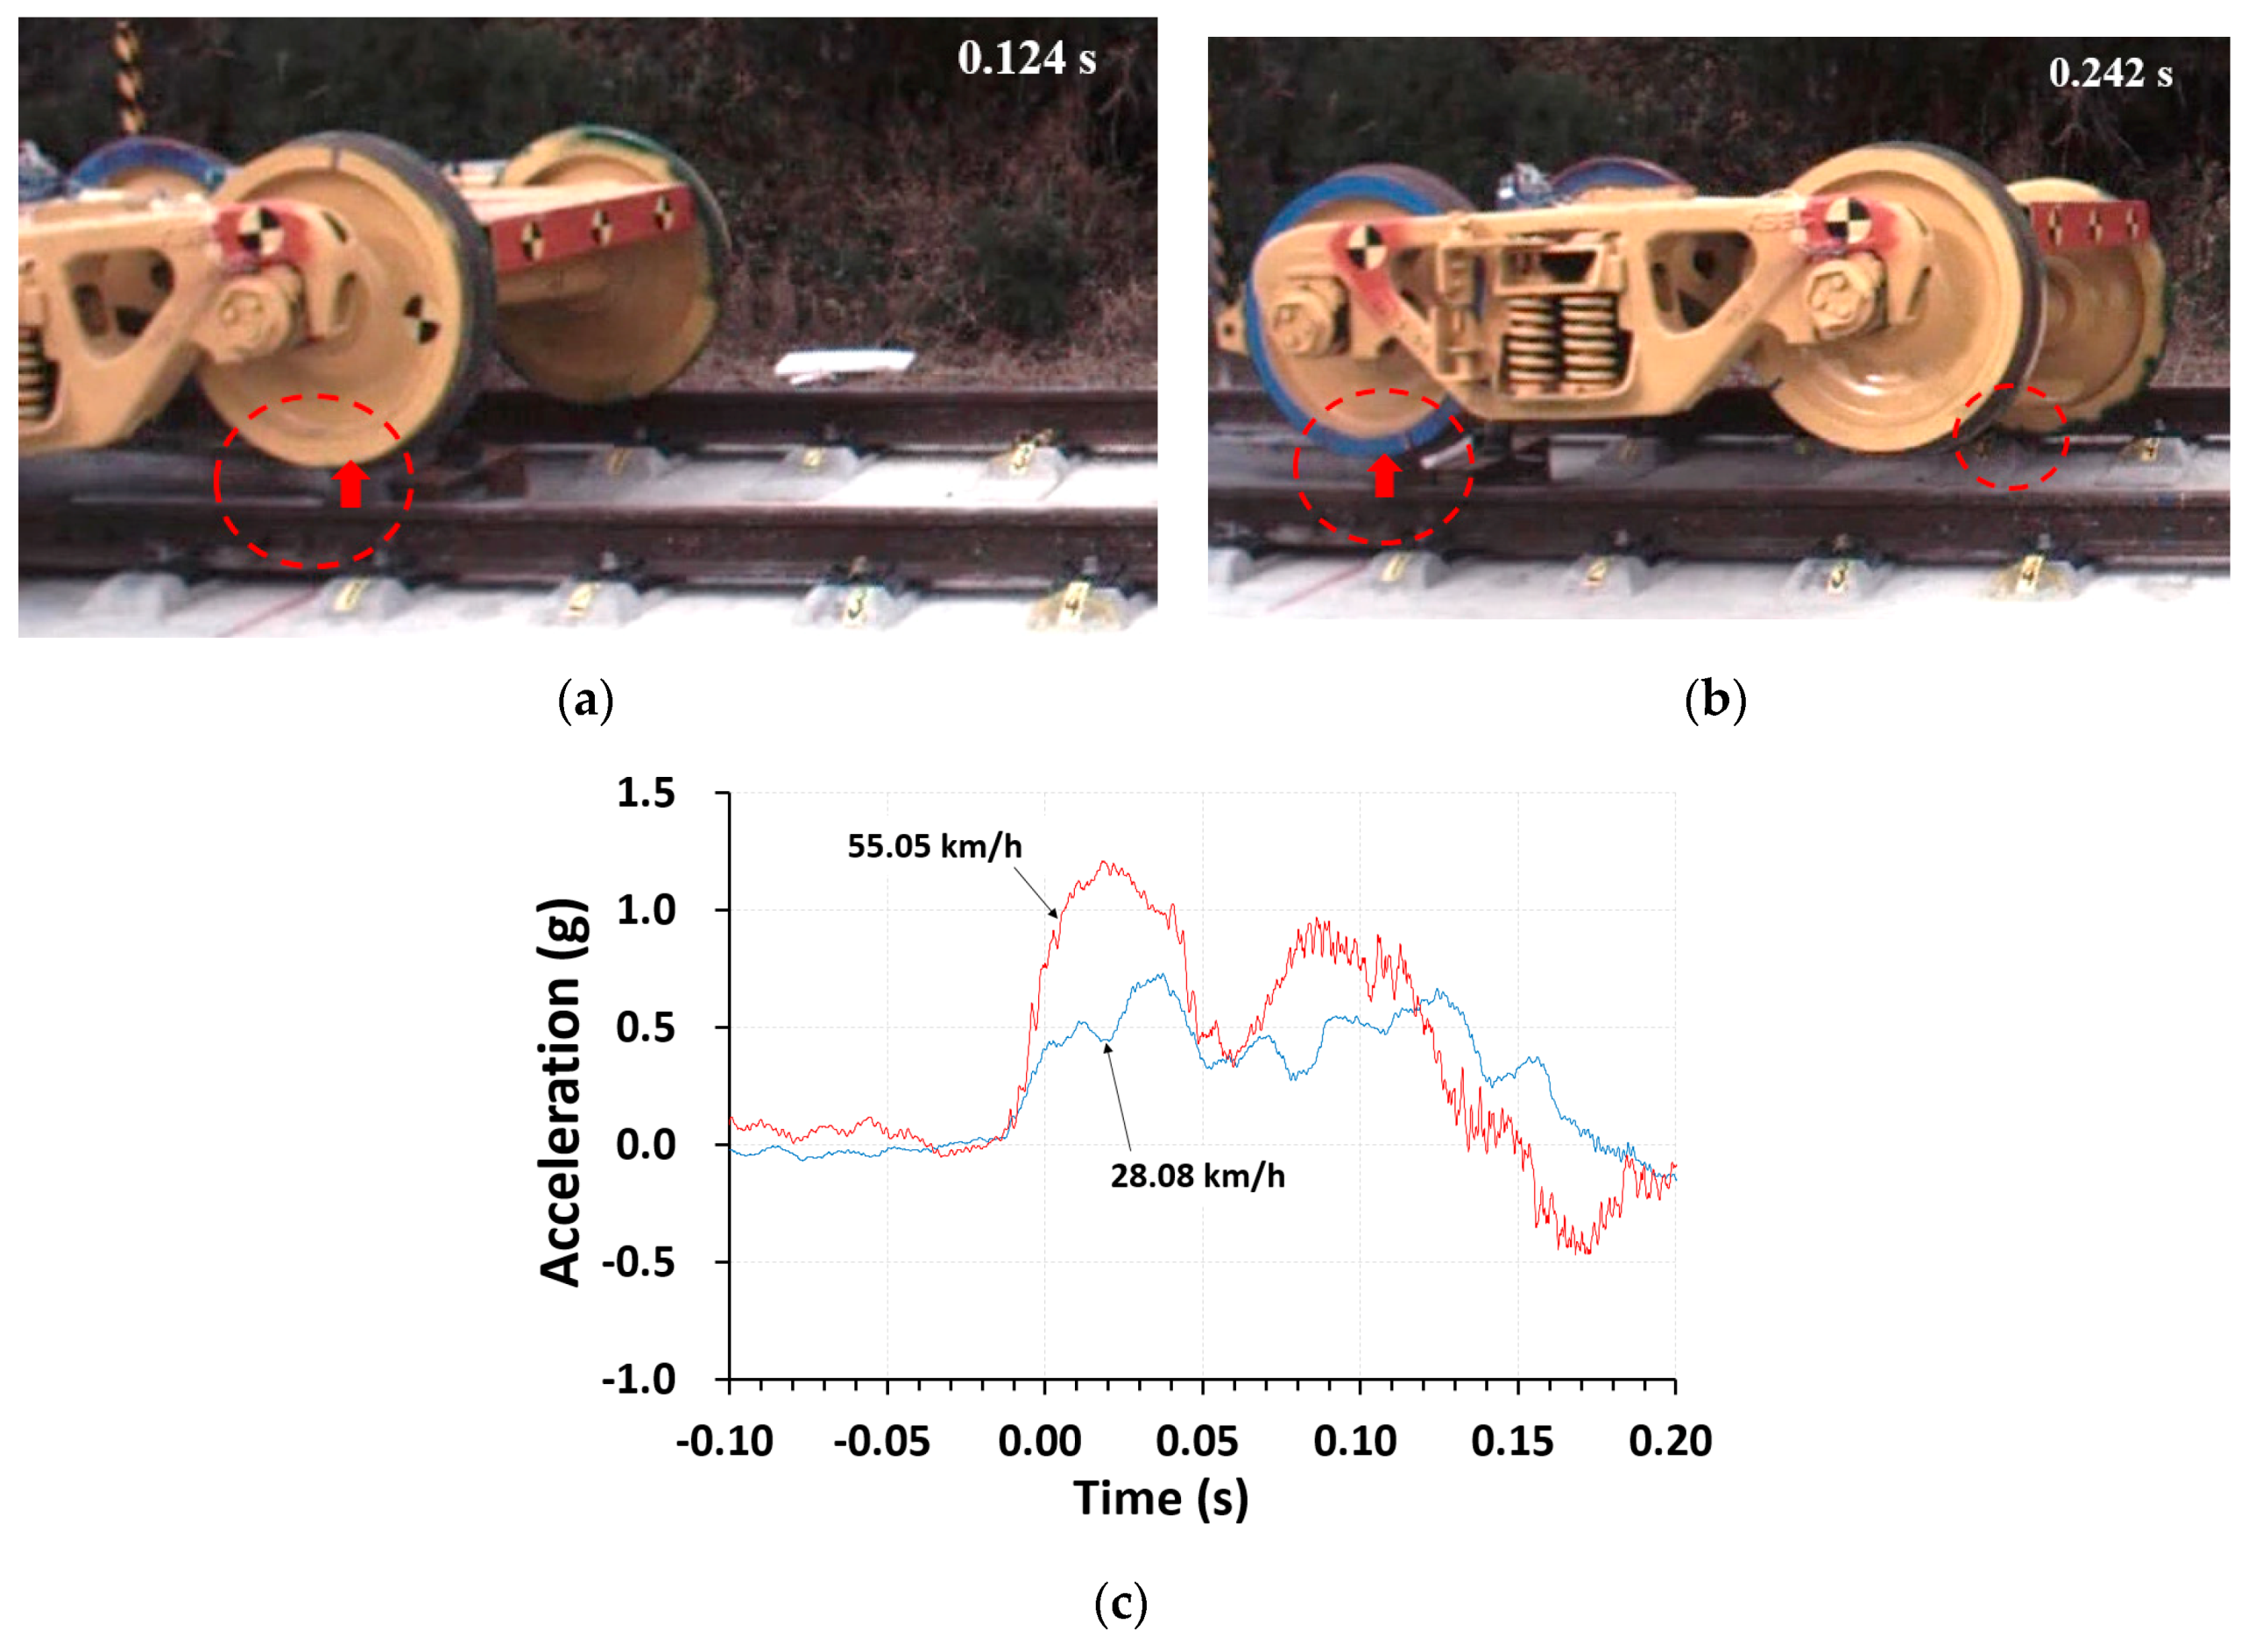
  • For the test in Case #1 (derailment velocity of 28.08 km/h), the derailed bogie ran the track with significant right (direction of derailment) lateral movement, and the left (opposite direction to derailment) wheel continuously came into contact with the hump of the concrete track. Then, the bogie moved to the left without contact between the right rail and left wheel. This indicates that the lateral movement for Case #1 was controlled by the humps, and the humps in this track significantly affected the post-derailment behavior of the derailed bogie. In Case #1, the maximum vertical acceleration was approximately 5.57 g at the second impact with the hump. The maximum lateral acceleration was approximately 2.62 g at the first impact with the hump.
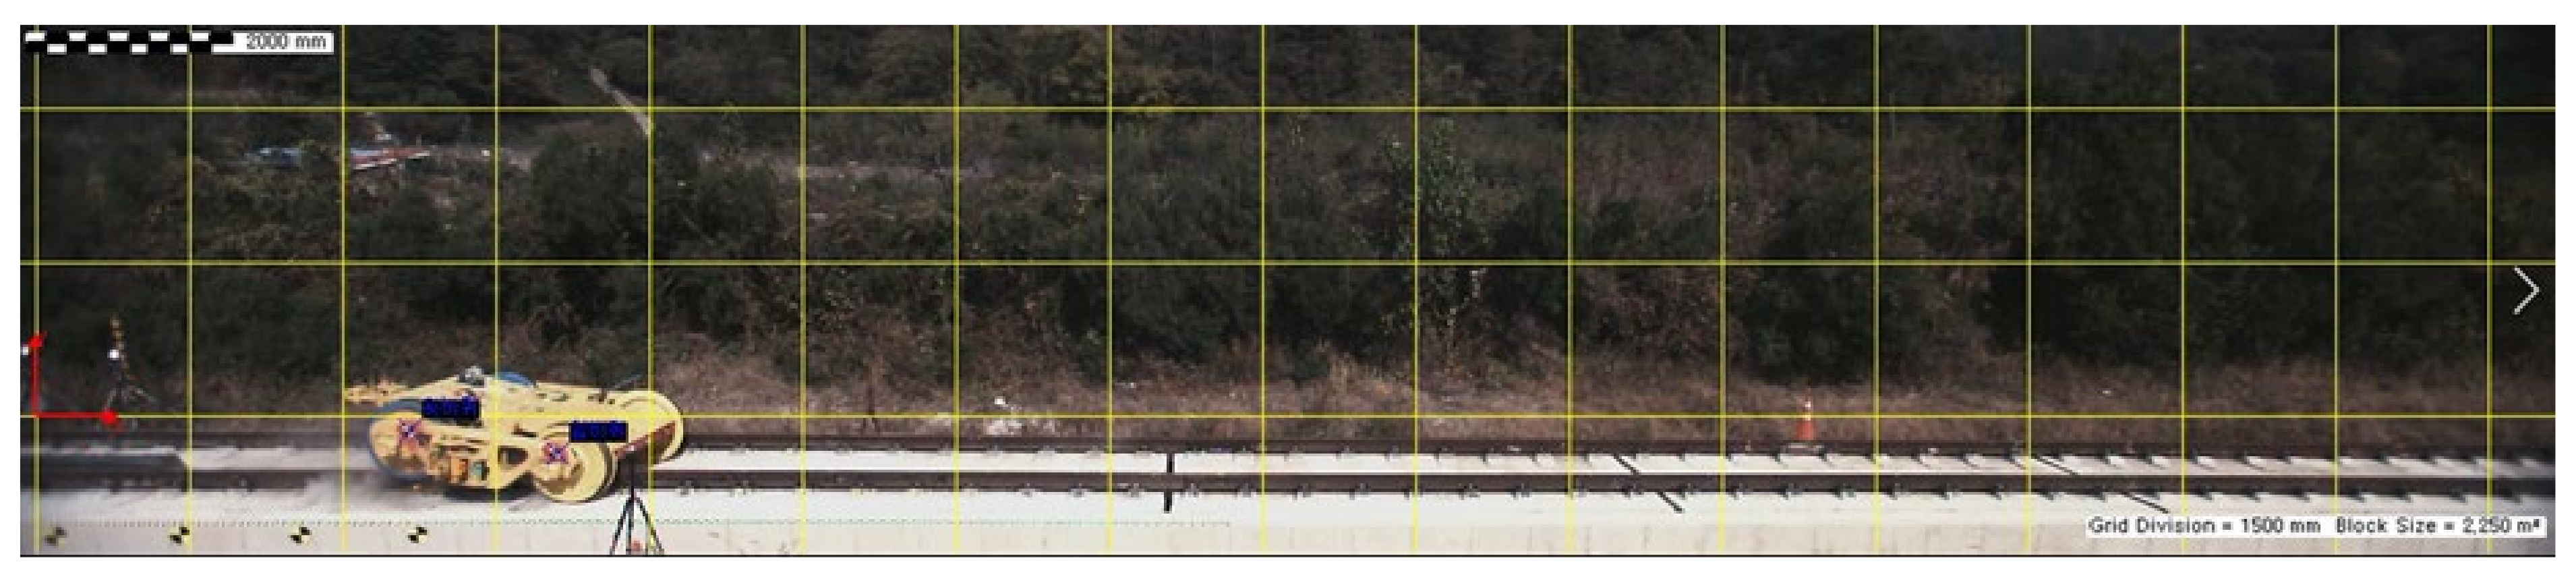
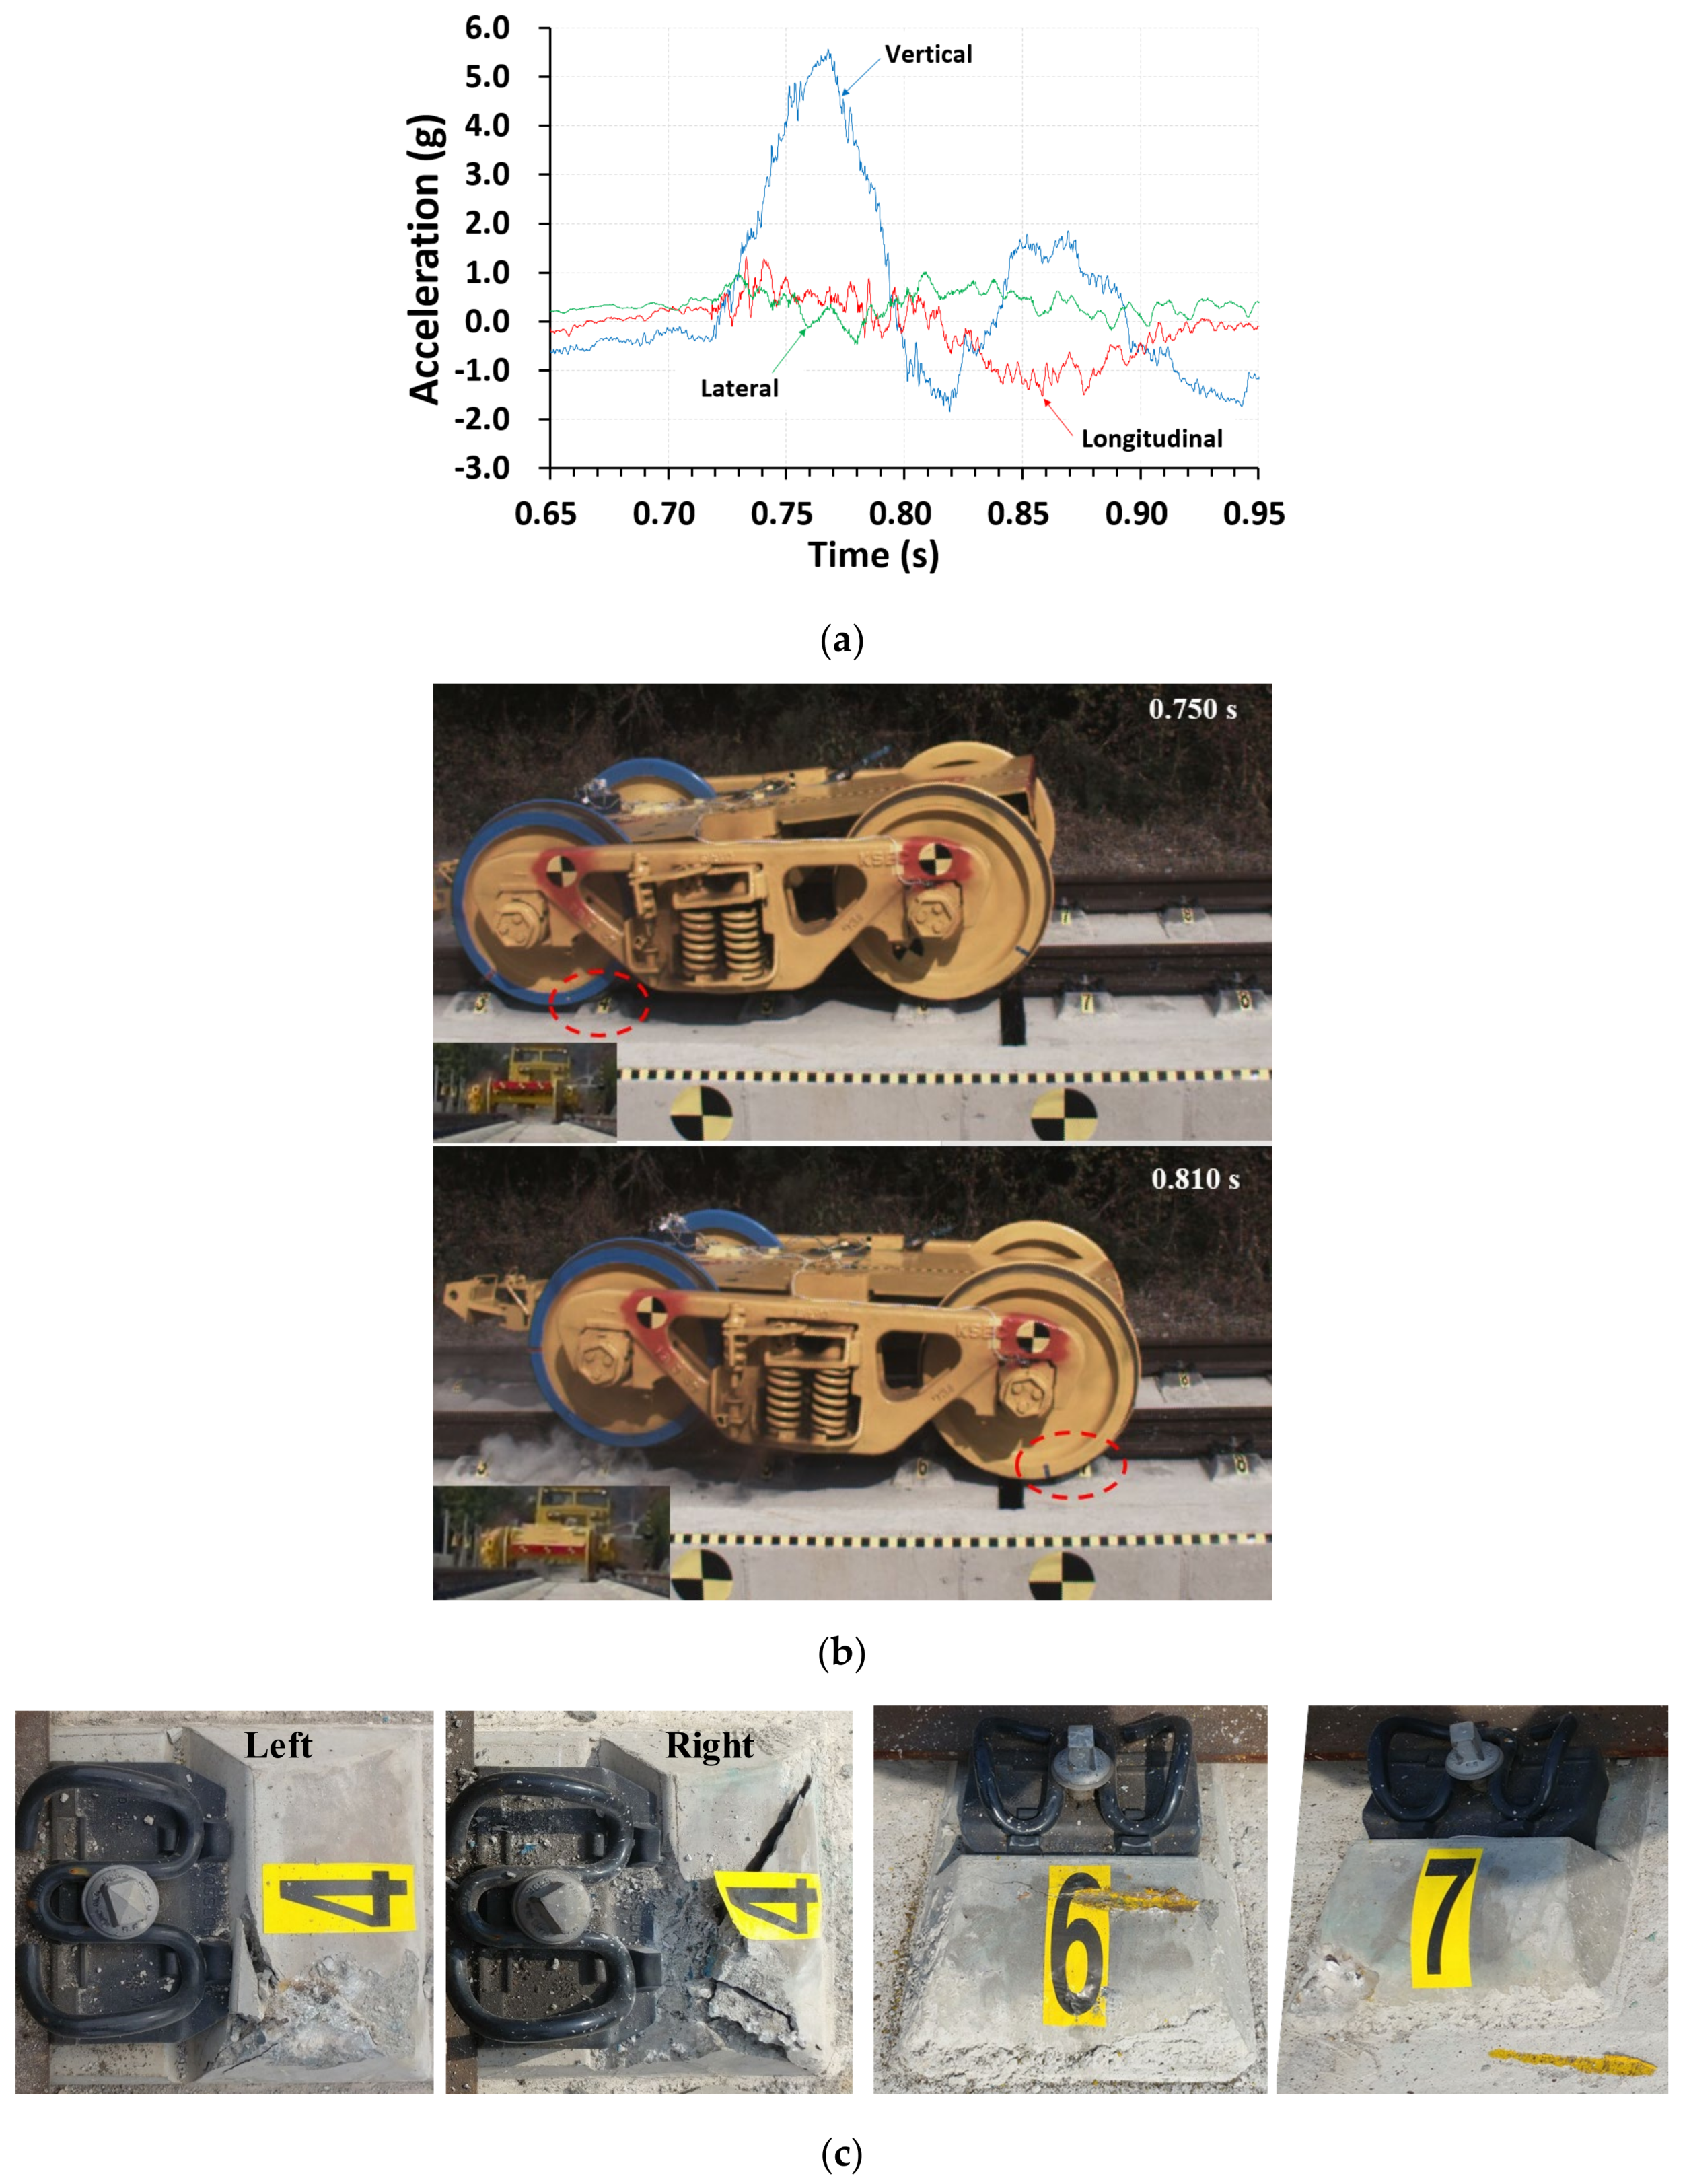
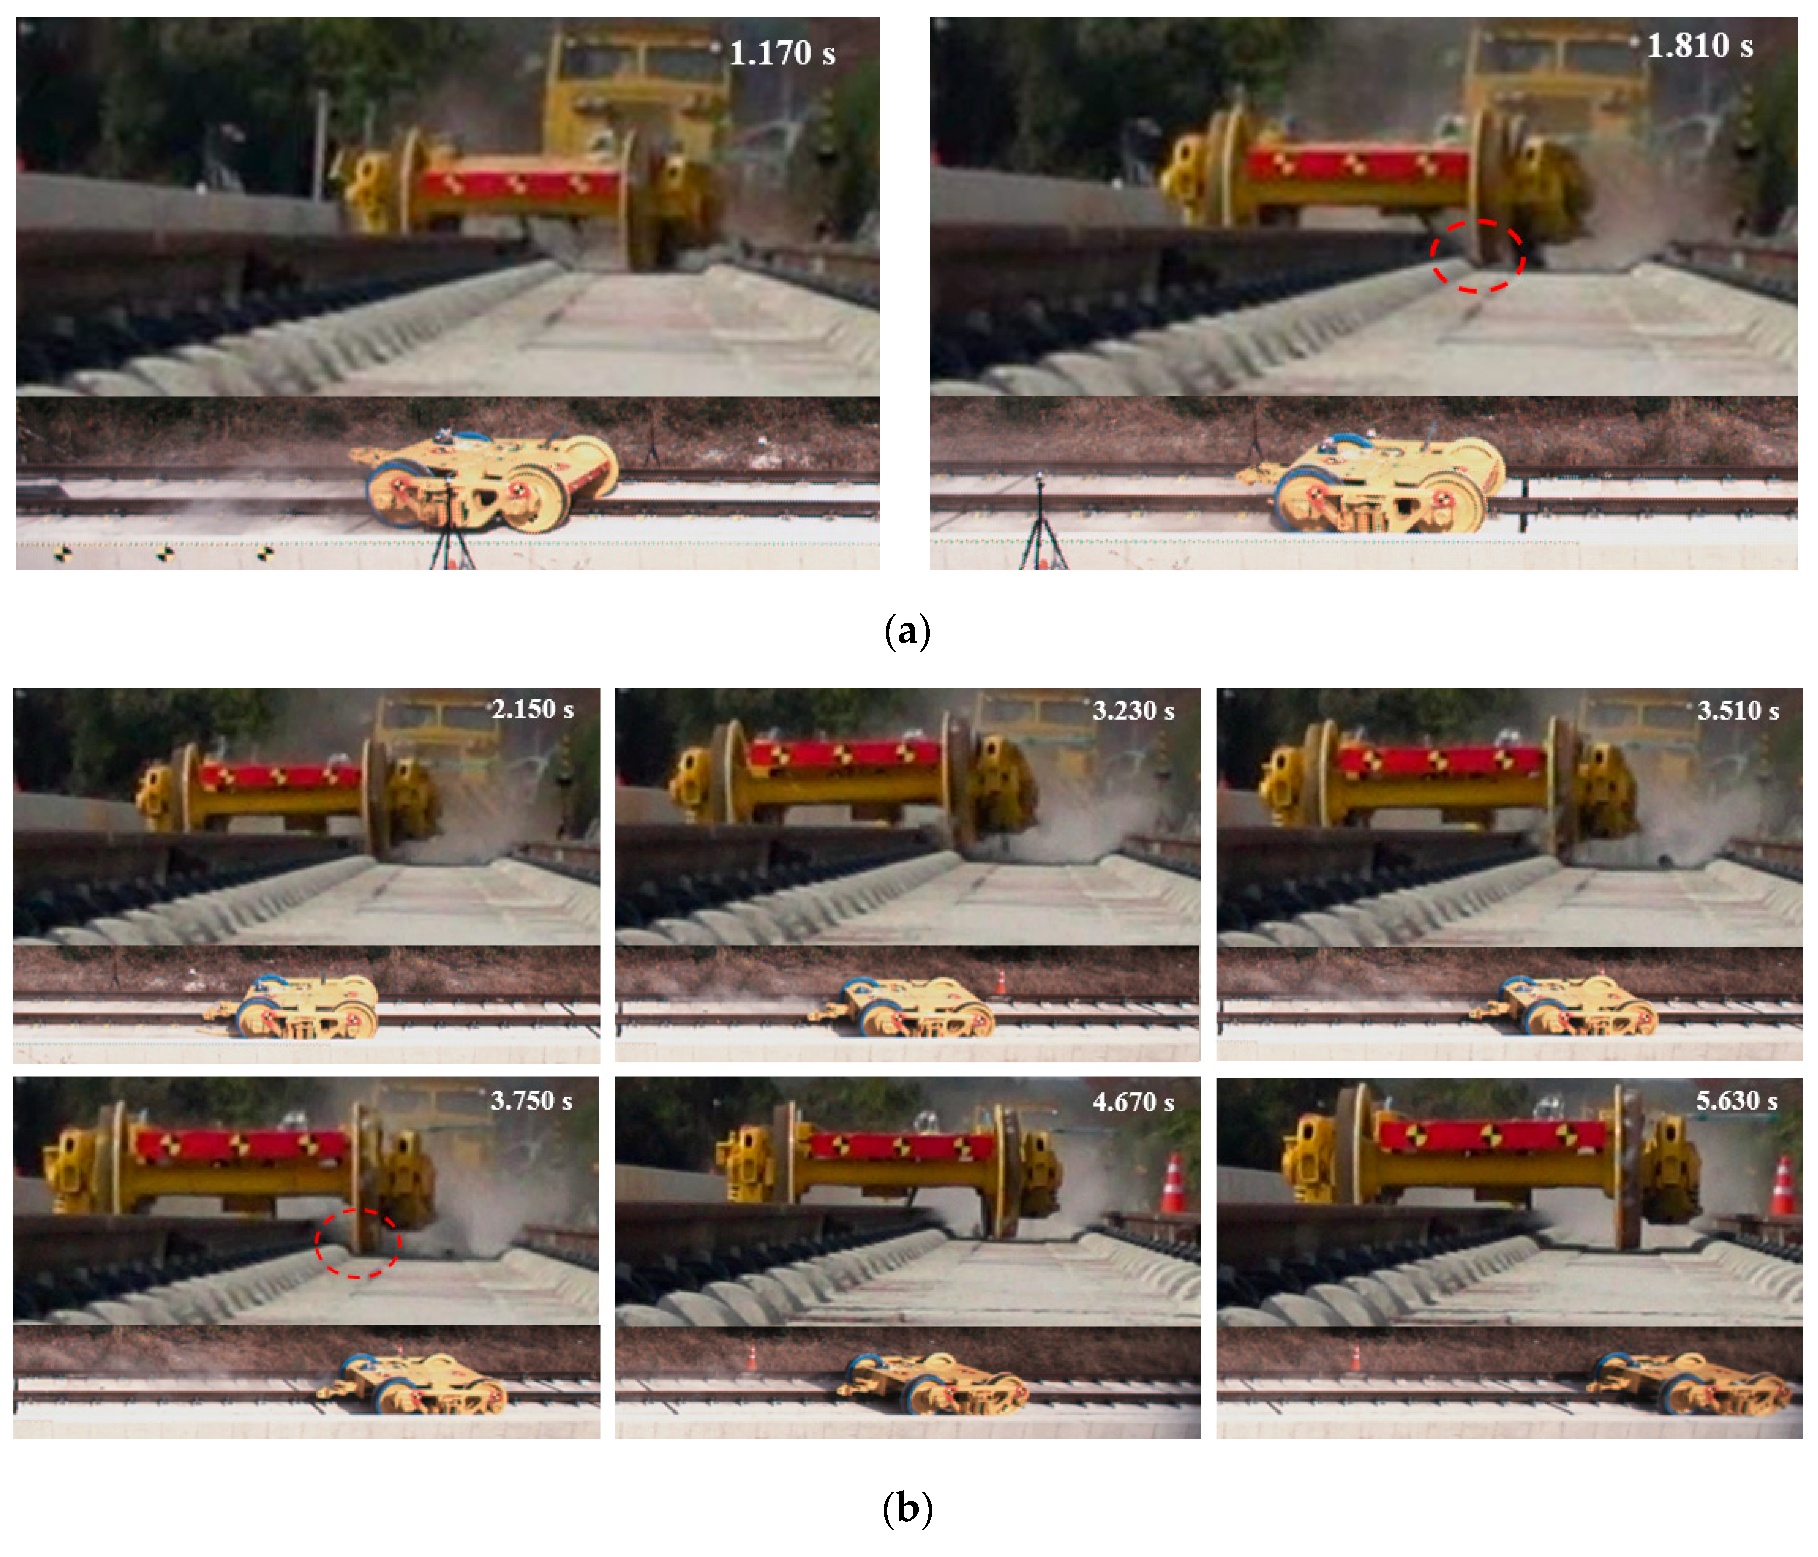
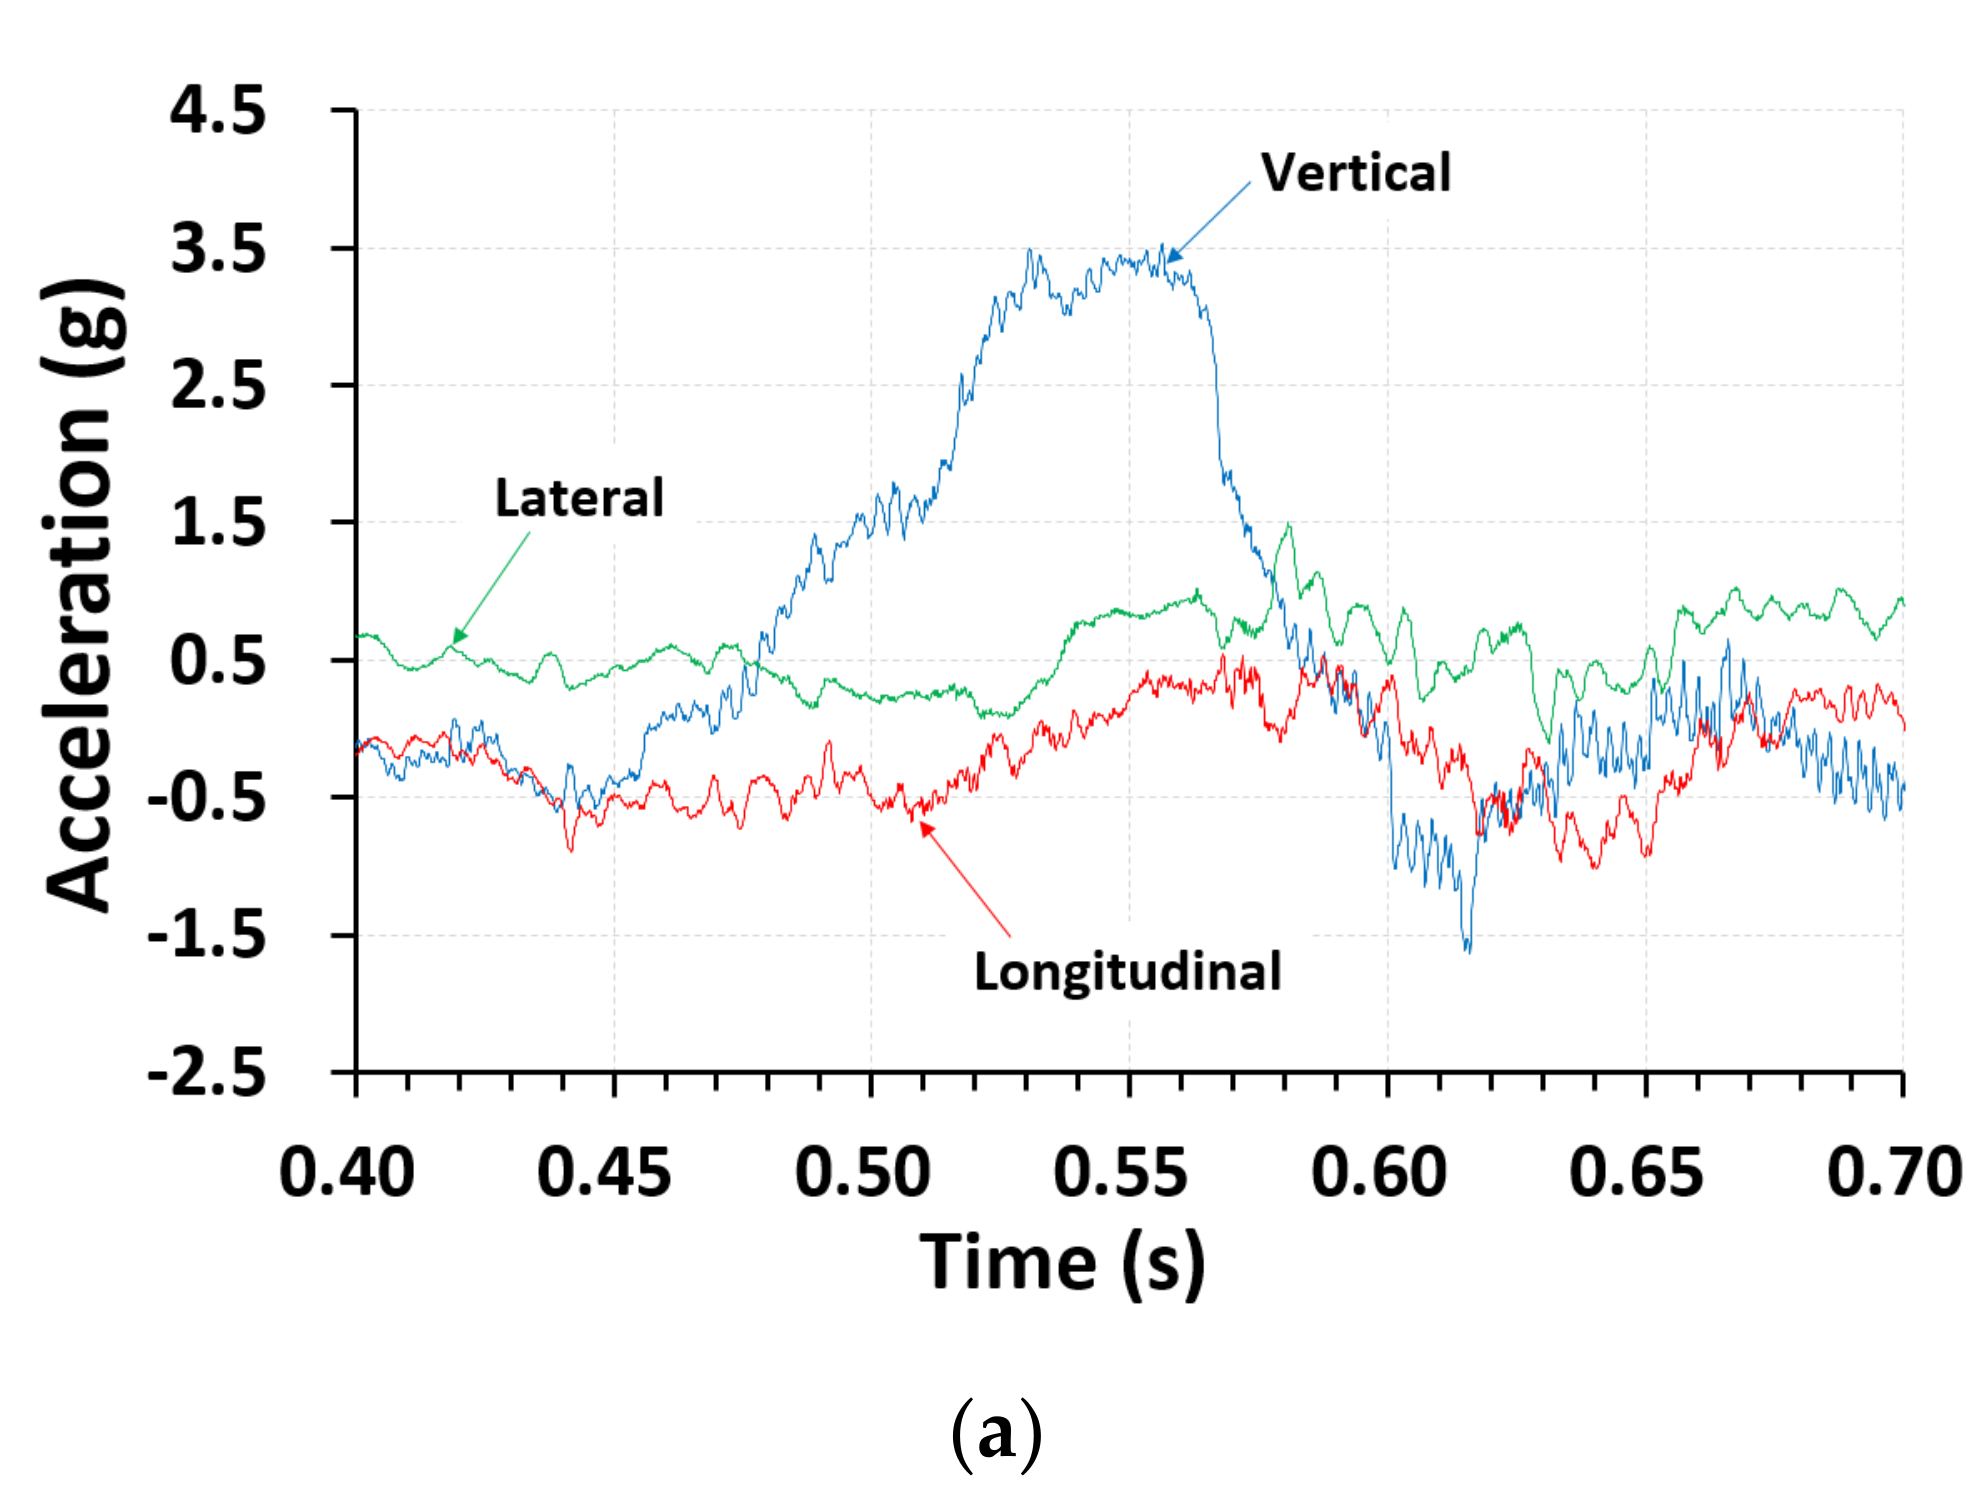
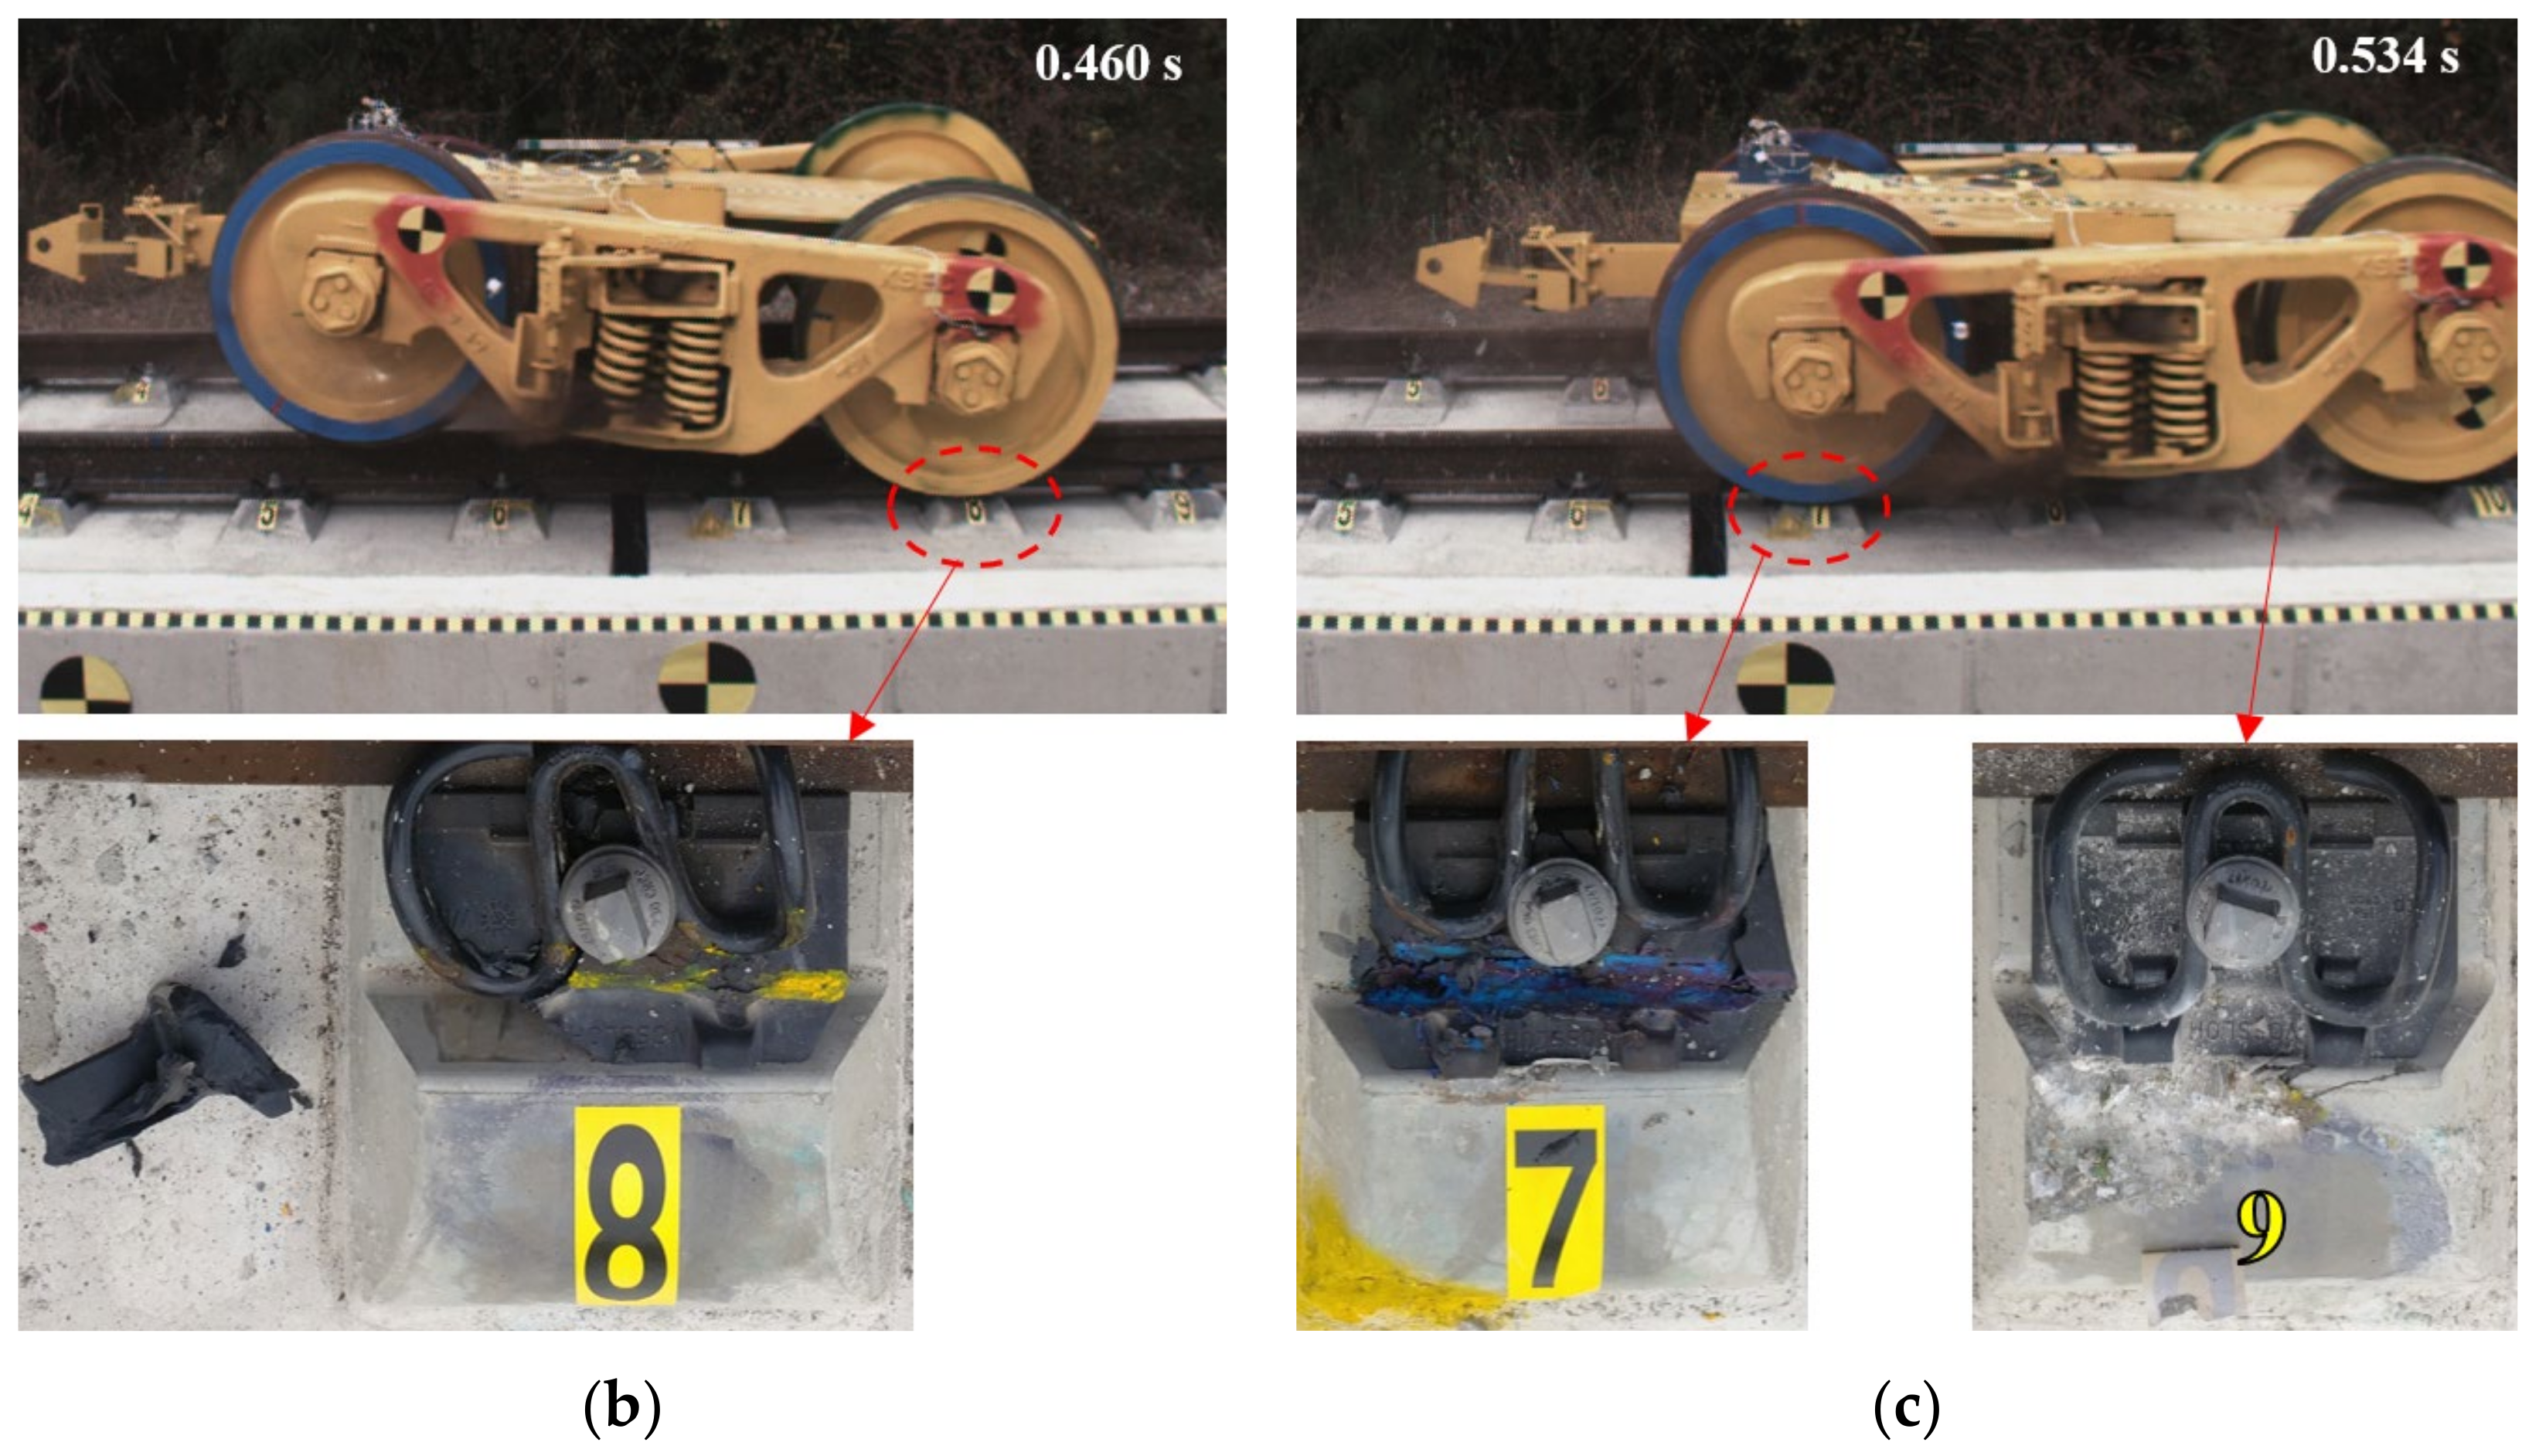
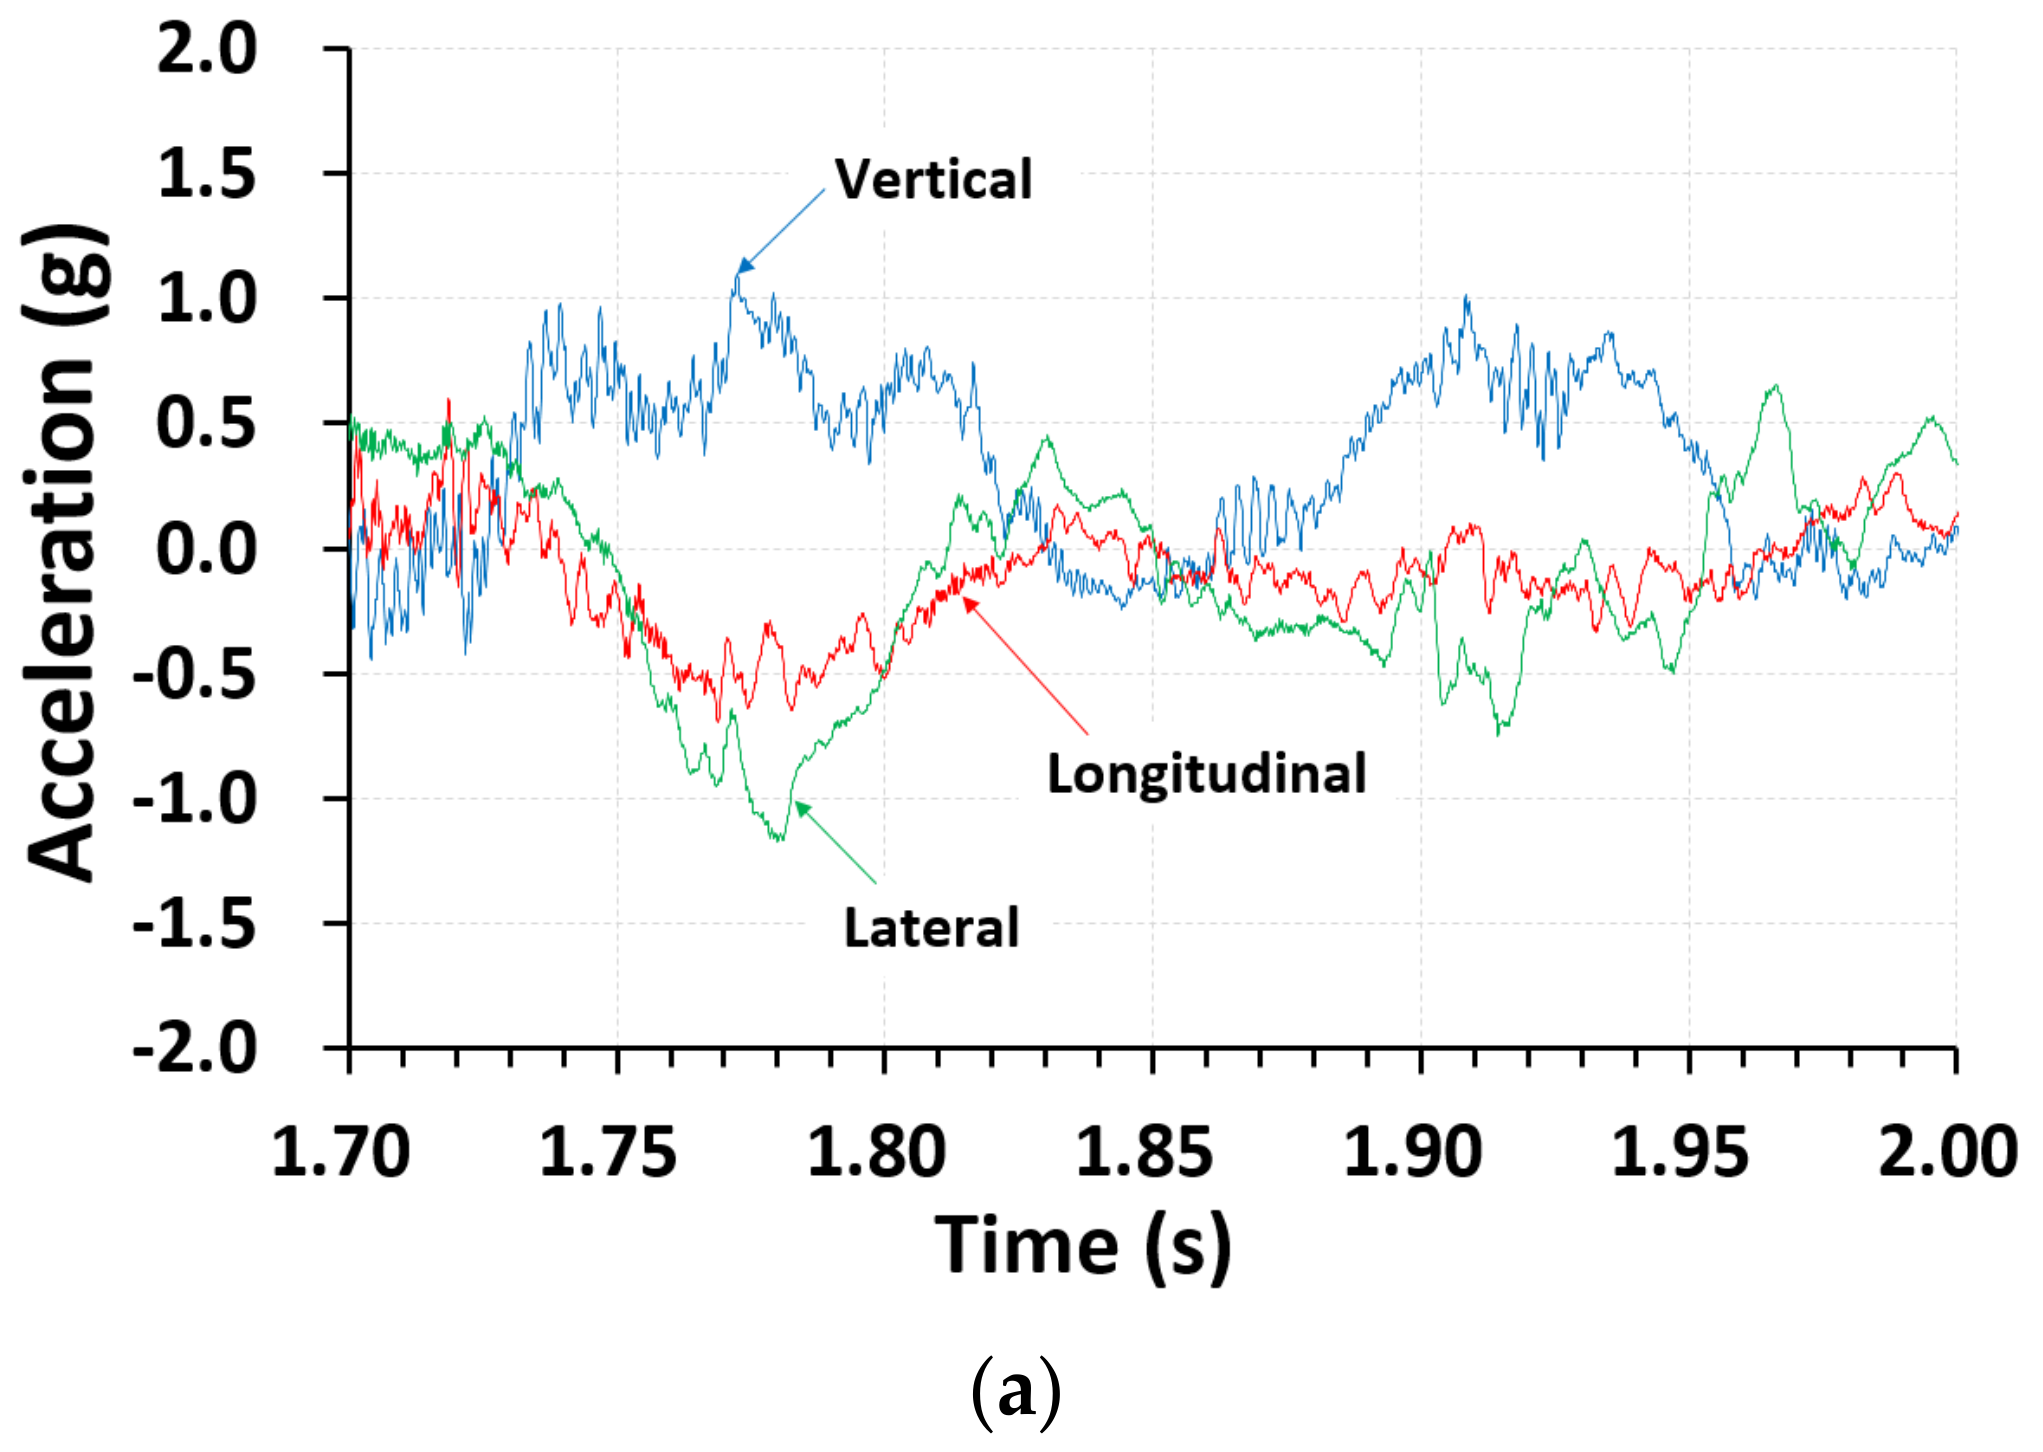
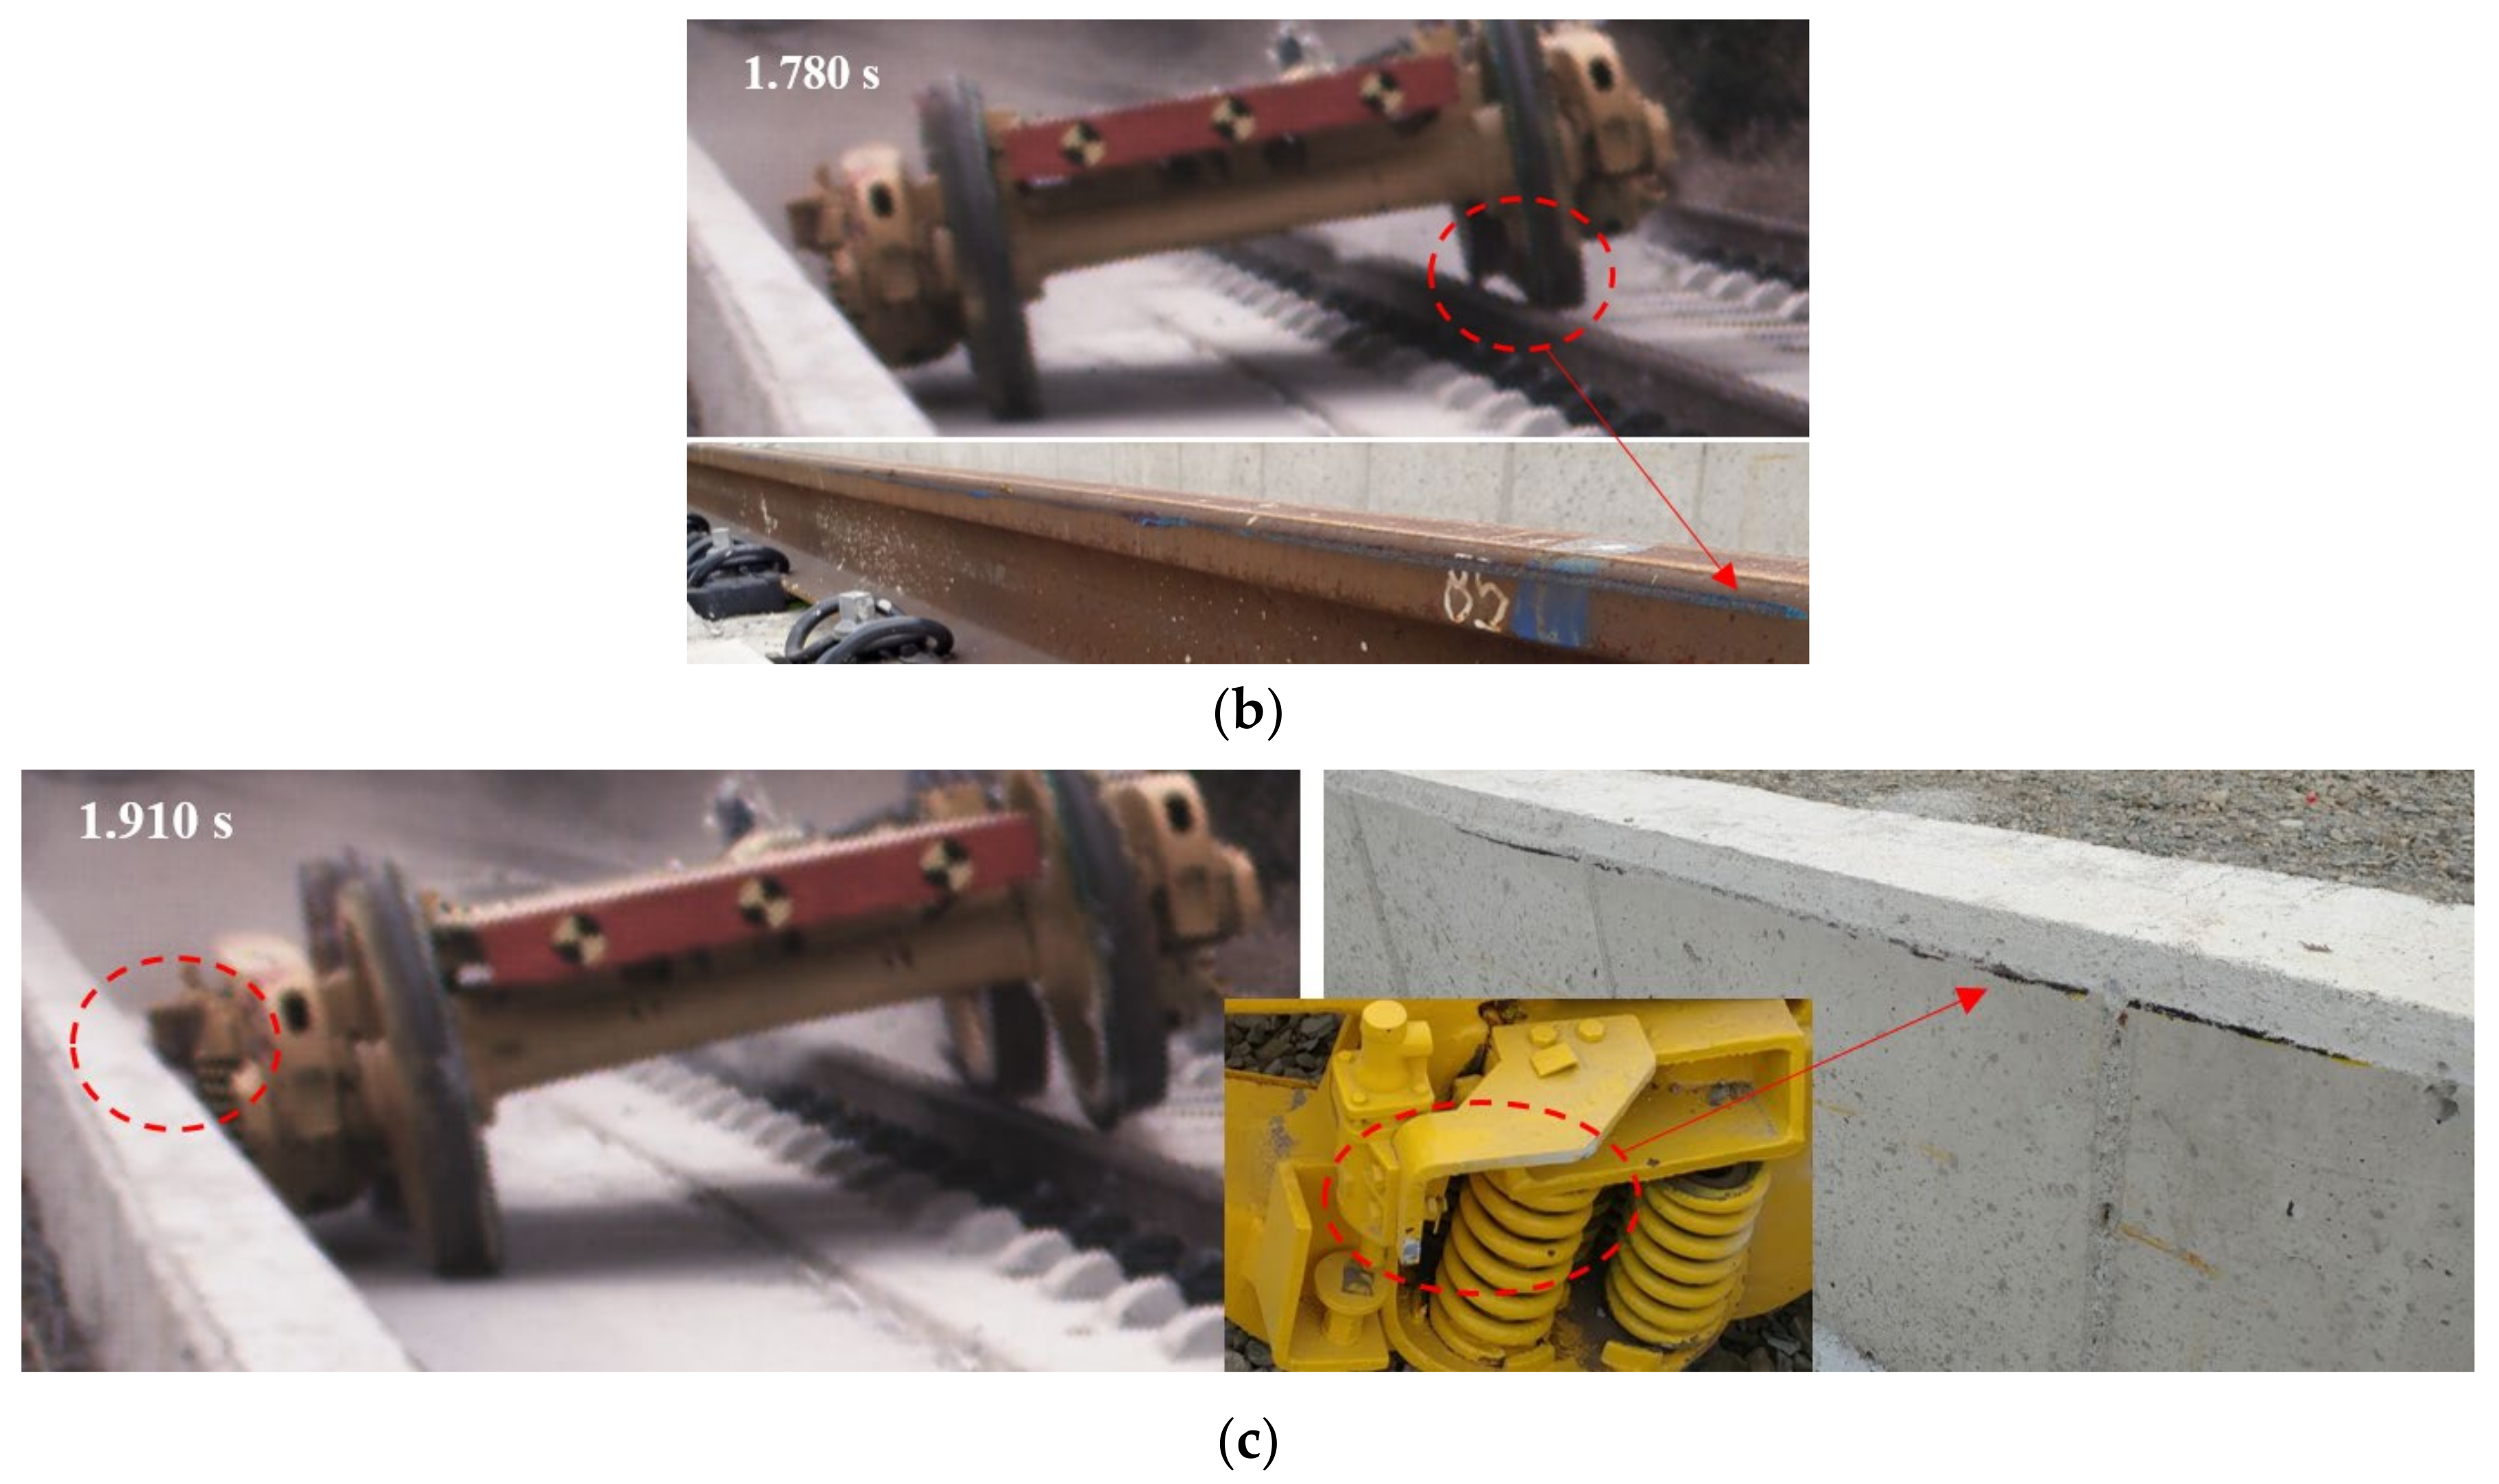
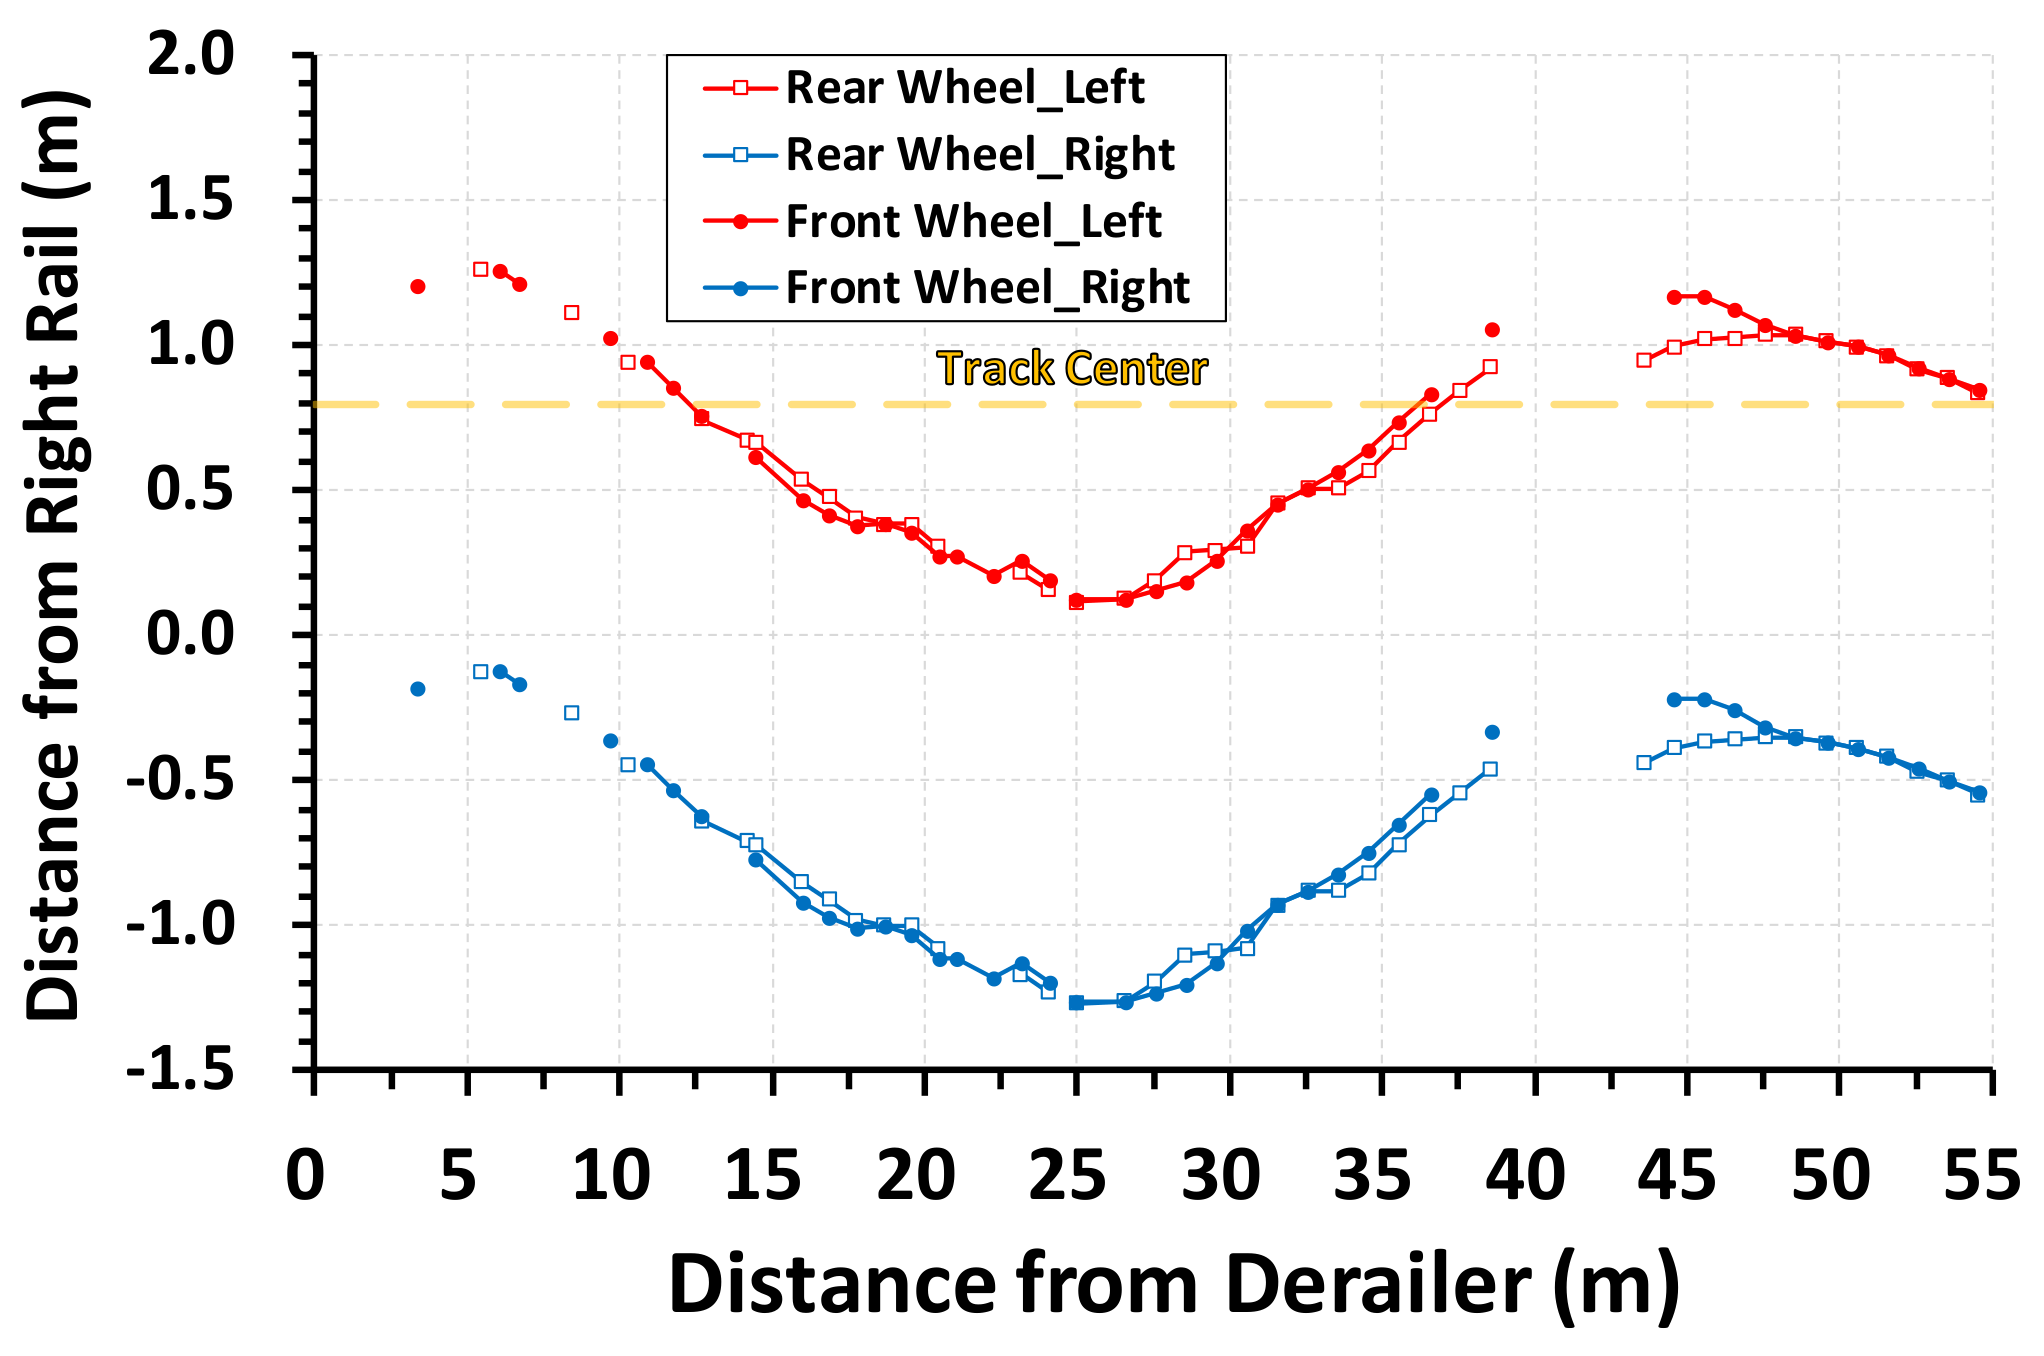
  • For the test in Case #2 (derailment velocity of 55.05 km/h), the maximum vertical impact to the track was observed at 0.460–0.560 s, and the maximum vertical acceleration was approximately 3.53 g. The test bogie ran the track with considerable lateral movement, similar to Case #1. However, in Case #2, the wheel flange came into contact with the rail, and then the test bogie impacted the containment wall. The lateral acceleration values were approximately 1.17 g and 0.75 g for the rail and containment wall impacts, respectively. Thus, it was found that the impact force on the containment wall was reduced by approximately 36% by the first guide by the rail. Finally, the test bogie returned to the track center direction after containment wall impact.

Author Contributions

Investigation, Conceptualization, Methodology, Data Curation, Project Administration, Supervision, Writing (original draft, review & editing) from H.-U.B., J.M. and N.-H.L.; Experiment, Data processing from S.-J.L. and J.-C.P. All authors have read and agreed to the published version of the manuscript.

Funding

This research was supported by a grant (19RTRP-B122273-04) from the Railway Technology Research Program, funded by the Ministry of Land, Infrastructure, and Transport of the Korean government.

Conflicts of Interest

The authors declare no conflict of interest.

References

  1. Korea Transportation Safety Authority. Railway Accident and Safety Performance Analysis Report; Korea Ministry of Land, Infrastructure, and Transport, ASPR (Annual Safety Performance Report); Korea Transportation Safety Authority: Ansan-si, Korea, 2017.
  2. Bae, H.U. Advanced Design Concept of Derailment Containment Provisions Using Collision Simulation after Train Derailment. Ph.D. Thesis, Chungnam National University, Daejeon, Korea, 2015. [Google Scholar]
  3. Bae, H.U.; Yun, K.M.; Lim, N.H. Containment capacity and crashworthiness estimation of derailment containment wall on high-speed train. Proc. Inst. Mech. Eng. Part F 2018, 232, 680–696. [Google Scholar] [CrossRef]
  4. Bae, H.U.; Yun, K.M.; Moon, J.; Lim, N.H. Impact force evaluation of the derailment containment wall for high-speed train through a collision simulation. Adv. Civ. Eng. 2018. [Google Scholar] [CrossRef] [Green Version]
  5. Korea Legal Information Center. Railroad Safety Act; Korea Ministry of Government Legislation: Sejong, Korea, 2018; p. 15404.
  6. Korea Rail Network Authority. Track Maintenance Guidelines; Korea Rail Network Authority: Daejeon, Korea, 2016. [Google Scholar]
  7. Korea Rail Network Authority. Railway Design Guideline and Handbook—Subsidiary and Safety Facilities for Main Lined; KR C-02060; Korea Rail Network Authority: Daejeon, Korea, 2017. [Google Scholar]
  8. Booz, A. Hamilton Report on the Findings of: Current Practice and Effectiveness of Derailment Containment Provisions on High Speed Lines; HSL-Zuid Organisation: Zoetermeer, The Netherlands, 2004. [Google Scholar]
  9. Brabie, D. Wheel-sleeper impact model in rail vehicles analysis. J. Syst. Des. Dyn. 2007, 1, 468–480. [Google Scholar] [CrossRef]
  10. Brabie, D.; Andersson, E. High-speed train derailments—Minimizing consequences through Innovative design. In Proceedings of the 8th World Congress of Railway Research (WCRR 2008), Seoul, Korea, 19–21 May 2008; Union Internationale Des Chemins De Fer (UIC): Paris, France, 2008. [Google Scholar]
  11. Wu, X.; Chi, M.; Gao, H. Post-derailment dynamic behavior of a high-speed train under earthquake excitations. Eng. Fail. Anal. 2016, 64, 97–110. [Google Scholar] [CrossRef]
  12. Wu, X.; Chi, M.; Gao, H.; Ke, X.; Zeng, J.; Wu, P.; Zhu, M. Post-derailment dynamic behavior of railway vehicles travelling on a railway bridge during earthquake. Proc. Inst. Mech. Eng. Part F 2016, 230, 418–439. [Google Scholar] [CrossRef]
  13. Wu, X.; Chi, M.; Gao, H.; Zhang, D.; Zeng, J.; Wu, P.; Zhu, M. The study of post-derailment measures to limit the extent of a derailment. Proc. Inst. Mech. Eng. Part F J. Rail Rapid Transit 2016, 230, 64–76. [Google Scholar] [CrossRef]
  14. Wu, X.; Chi, M.; Gao, H. The study of post-derailment dynamic behavior of railway vehicle based on running tests. Eng. Fail. Anal. 2014, 44, 382–399. [Google Scholar] [CrossRef]
  15. Han, H.H.; Kim, J.W.; Song, I.H.; Bae, H.U.; Koo, J.S.; Lim, N.H. Study on derailment test of bogie using fixed derailer. J. Korean Soc. Railw. 2018, 21, 957–968. [Google Scholar] [CrossRef]
  16. Chiara, B.; Enrico, B.; Matteo, I.; Salvatore, N. Prototyping and Validation of MEMS Accelerometers for Structural Health Monitoring—The Case Study of the Pietratagliata Cable-Stayed Bridge. J. Sens. Actuator Netw. 2018, 7, 30. [Google Scholar]
  17. Kim, D.S. Design of Roadside Safety Features Using Vehicle Velocity-Time History. Ph.D. Thesis, Kongju National University, Gongju, Korea, 2012. [Google Scholar]
  18. Kim, K.J. Evaluation of Collision Force by Impact Simulations and Its Application to the Design of Bridge Piers. Ph.D. Thesis, Kongju National University, Gongju, Korea, 2014. [Google Scholar]
  19. Beason, W.L.; Hirsch, T.J.; Campise, W.L. Measurement of Heavy Vehicle Impact Forces and Inertia Properties; Final Report, FHWA/RD-89/120; Texas Transportation Institute: College Station, TX, USA, 1989.
  20. Chiara, B.; Marco, F.; Claudio, A. Vibration Analysis and Dynamic Characterization of Structural Glass Elements with Different Restraints Based on Operational Modal Analysis. Buildings 2019, 9, 13. [Google Scholar]
  21. Railtrack PLC (Safety & Standards Directorate). Recommendations for the Design of Bridges; Railtrack Approved Code of Practice, GC/RC5110; Railtrack PLC: London, UK, 2000. [Google Scholar]
  22. Network Rail. Design of Bridges (Design Loading for Accommodation and Occupation Overbridges); Network Rail Kings Place, NR/L3/CIV/020; Network Rail: London, UK, 2011. [Google Scholar]
Figure 1. Examples of derailment protection facilities: (a) guard rail and (b) containment wall.
Applsci 10 00059 g001aApplsci 10 00059 g001b
Figure 2. Concept of derailment containment provisions (DCPs).
Applsci 10 00059 g002
Figure 3. Overview of the test site.
Applsci 10 00059 g003
Figure 4. The concrete track used in the test region.
Applsci 10 00059 g004
Figure 5. Test bogie (casting bogie for a freight train).
Applsci 10 00059 g005
Figure 6. Concept of the push system to accelerate the test bogie.
Applsci 10 00059 g006
Figure 7. Release and braking system for the test.
Applsci 10 00059 g007
Figure 8. Power car to accelerate the test bogie.
Applsci 10 00059 g008
Figure 9. Derailment device: (a) overview, (b) wheel entrance part, and (c) derailment part.
Applsci 10 00059 g009aApplsci 10 00059 g009b
Figure 10. Data acquisition system for the bogie: (a) layout, (b) accelerometer and angular velocity sensor, and (c) a shock-resistance data logger for collision testing.
Applsci 10 00059 g010aApplsci 10 00059 g010b
Figure 11. Speed measuring system: (a) system conceptual diagram; (b) photoelectric tube speedometer.
Applsci 10 00059 g011
Figure 12. High-speed cameras: (a) side view; (b) top view.
Applsci 10 00059 g012
Figure 13. Simultaneous trigger system by a tape switch: (a) trigger for the high-speed cameras; (b) trigger for the data logger.
Applsci 10 00059 g013
Figure 14. A schematic view of the running diagram of the power car and test bogie.
Applsci 10 00059 g014
Figure 15. Examples of running diagrams of the power car.
Applsci 10 00059 g015
Figure 16. Post-derailment behavior of the bogie for Case #1, front view.
Applsci 10 00059 g016
Figure 17. Example of image analysis by target mark tracking.
Applsci 10 00059 g017
Figure 18. Data analysis results, Case #1: (a) velocity, (b) traveling distance.
Applsci 10 00059 g018
Figure 19. First impact, Case #1: (a) acceleration vs. time (0.3–0.6 s); (b) test bogie at first impact; (c) damage to the hump and rail fastener due to the first impact.
Applsci 10 00059 g019
Figure 20. Second and third impacts, Case #1: (a) acceleration vs. time (0.65–0.95 s); (b) test bogie at the second and third impacts; (c) damage to the hump and rail fastener due to the second and third impacts.
Applsci 10 00059 g020
Figure 21. Position of the test bogie: (a) 1.170–1.810 s, (b) 2.150–5.630 s.
Applsci 10 00059 g021
Figure 22. Trace of the left and right wheels for Case #1.
Applsci 10 00059 g022
Figure 23. Data analysis results, Case #2: (a) velocity, (b) traveling distance.
Applsci 10 00059 g023
Figure 24. Test bogie at derailment for Case #2: (a) 0.124 s; (b) 0.242 s (first impact); (c) vertical acceleration when derailed (0–0.20 s).
Applsci 10 00059 g024
Figure 25. Impact of the test bogie after derailment for Case #2: (a) acceleration vs. time (0.4–0.7 s), (b) 0.460 s; (c) 0.534 s.
Applsci 10 00059 g025aApplsci 10 00059 g025b
Figure 26. Impact of the test bogie after derailment for Case #2: (a) acceleration vs. time (1.7–2 s), (b) 1.780 s; (c) 1.910 s.
Applsci 10 00059 g026aApplsci 10 00059 g026b
Figure 27. Trace of the left and right wheels for Case #2.
Applsci 10 00059 g027
Table 1. Specifications of the test bogie.
ClassificationSpecification
Frame structure3-piece cast steel
Fixed wheel base1676 mm
Wheel diameter860 mm
Suspension systemCoil spring between bolster and side frame
Friction deviceFriction wedge between bolster and side frame
BearingAAR D class tapered roller bearings
Test weight40.91 kN (4.17 tonf)

