1. Introduction
Fault diagnosis is a basic problem in reliability analysis [
1]. Fault diagnosis is divided into fault detection and fault isolation [
2]. Fault detection is to find out whether there is a fault in the system or equipment using various inspection and testing methods. Fault isolation requires locating the location of the fault. Therefore, fault diagnosis can determine the type and location of equipment failure so as to maintain the equipment and reduce the loss caused by the long downtime of equipment [
3].
There are several steps for fault diagnosis in reliability engineering [
4]. Firstly, we can determine whether the equipment has a fault or not. Then, we can analyze the reasons and determine the fault types. Finally, we can divide the fault categories and diagnose the specific fault location and causes of the equipment, so as to prepare for the recovery of the failed equipment [
5,
6]. At present, the methods of fault diagnosis are also roughly divided into three categories: the fault diagnosis method based on the analytic model, the fault diagnosis method based on signal processing, and the fault diagnosis method based on artificial intelligence [
7].
The research on bearing fault diagnosis methods based on an analytical model has lasted more than half a century [
8]. In the last 10 years, due to the development of science and technology and the change of bearing application environment, the speed and temperature of bearings are much higher than in the past [
9]. The rapid development of modern computers has led to the updating of relevant software, which provides conditions for the dynamic simulation of rolling bearings, and the advanced dynamic model of rolling bearing has replaced the simple static balance model [
10]. Although the static model and dynamic model can be used to simulate the performance of rolling bearings, it mainly considers the static and moment balance equation.
At present, fault diagnosis technology based on signal processing is widely used [
11]. The signal characteristics of nonlinear and nonstationary signals are relatively poor, and empirical mode decomposition (EMD) decomposes the signal into finite signal characteristics according to the characteristics of the signal itself [
12]. These intrinsic modal functions are local detail components of the original signal at different time scales and can approximate the original signal very well. So, the EMD method is suitable for nonstationary signals and linear nonstationary signals. The original acquisition signals of bearings are nonlinear and nonstationary signals, so EMD is widely used in bearing fault diagnosis [
13].
With the progress of the times, in the era of big data, more and more importance has been attached to the fault diagnosis method based on artificial intelligence [
14,
15,
16]. This method can overcome the drawback of excessive dependence on the model and can be used to diagnose potential faults, which significantly improves the accuracy of fault diagnosis [
17,
18,
19]. Machine learning mainly obtains new experience and knowledge by autonomously learning the rules that exist in a large number of data and thus realizing the learned behavior of humans. Almost all fault diagnosis methods based on artificial intelligence are achieved through a machine learning algorithm [
20,
21]. Based on the different learning forms, machine learning algorithms can be divided into supervised learning, unsupervised learning and reinforcement learning.
Support vector machine (SVM) is a kind of supervised learning in machine learning [
22]. The application and research of SVM arithmetic in engineering appear in the fault diagnosis of rolling bearings [
23]. In recent years, with the development of machine learning in fault diagnosis, clustering, as another classification algorithm, has attracted more and more attention [
24]. As one of the important research contents in pattern recognition and data mining, clustering analysis plays a vital role in identifying the intrinsic structure of data and is widely used in many fields such as biology, economics, medicine, computer science, and so on [
25,
26,
27]. The k-means algorithm and fuzzy c-means (FCM) algorithm are the two most famous clustering algorithms of this type. Compared with the k-means algorithm, the introduction of fuzzy information in the FCM algorithm makes the division of data samples more flexible, thus gaining wider attention [
28,
29]. In the past years, based on the FCM algorithm, many scholars have proposed many improved FCM from various aspects and have achieved a series of new research results [
30,
31,
32,
33].
These publications have achieved a lot of positive results in fault diagnosis, but there are still some problems. On the one hand, the vibration signals on the surface of machinery and equipment often contain sufficient information about the running status of parts. At the same time, because of the complexity of the working process of equipment, the vibration signals have obvious nonstationarity, and the dynamic signals and characteristic parameters of most equipment are often ambiguous. Thus, the differences in evaluation and discrimination between objective things are indistinct. So, the operating state can only be estimated in a specified range. On the other hand, many scholars have successfully improved the traditional FCM algorithm and achieved good results, but there are also some limitations, which are as follows. (1) Fuzziness exists at any sample point, which makes these improved methods vulnerable to noise and outliers. Additionally, the algorithm lacks robustness and the extensiveness of the algorithm is not obvious. (2) It is easy to lead to the equipotential partition of data, and it is greatly affected by uneven sampling and differences in the distribution characteristics of different data clusters. These two reasons lead to unsatisfactory results in fault diagnosis using the machine learning algorithm.
Based on the analysis of the latest research progress, a fault diagnosis method based on ensemble empirical mode decomposition, permutation entropy, and Gath–Geva (GG) clustering is proposed in this paper. Firstly, the vibration signal of the rolling bearing is decomposed by the EEMD method, and then the permutation entropy value is calculated. For the obtained entropy feature vector, which has a high dimension and the data cannot be visualized, linear discriminant analysis (LDA) is used for dimensionality reduction. Since the data collected in the actual project is unlabeled data, the Gath–Geva clustering, as an improvement of the FCM clustering algorithm and Gustafson–Kessel (GK) clustering algorithm, is used for fault identification. The example of fault diagnosis shows that the method can effectively diagnose the fault of the bearing.
The remaining part of this paper is organized as follows.
Section 2 is about methods. In
Section 2.1, the EEMD algorithm is introduced and discussed.
Section 2.2 introduces the permutation entropy. The Gath–Geva clustering algorithm is discussed in
Section 2.3. In
Section 2.4, the steps and description of the proposed fault diagnosis method are described in detail. A clustering evaluation index is introduced in
Section 2.5.
Section 3 provides the data experiment of the proposed method. The analysis of the results is presented in
Section 4. Finally, the conclusions are drawn in
Section 5.
2. Methods
2.1. Ensemble Empirical Mode Decomposition (EEMD)
EEMD is an adaptive signal processing method improved by EMD [
34]. It inherits the advantage that EMD can realize the corresponding time-frequency decomposition according to the local characteristics of the signal and effectively solve the phenomenon of mode aliasing, so that the decomposed intrinsic mode function (IMF) components have more concentrated frequency information, especially for the research of nonlinear and nonstationary signals. The core of the EEMD algorithm is to make use of the statistical characteristics of the zero mean of Gauss white noise [
35]. The specific steps of the algorithm are as follows:
(1) Assuming that
is the signal to be analyzed, a Gaussian white noise with an amplitude coefficient of
is added to it, and the number of iterations is set to
times, that is
where
is the white noise sequence added for the
time, and
is the noise-contaminated signal.
(2) Decomposing using EMD to obtain IMF components.
(3) Repeat steps (1) and (2) for times, using a different white noise sequence for each time.
(4) Compute the average of all IMF components. Namely
where
is the
-layer IMF component obtained by the
decomposition.
(5) The decomposition results of EEMD are as follows:
where
is the mean of the
decomposition trend term.
2.2. Permutation Entropy
For a one-dimensional time series
, let the embedding dimension and delay time be
,
, respectively. Restructuring the phase space of X based on Takens theorem [
36], we can obtain the reconstruction matrix shown in Equation (4), which is as follows:
where
.
The matrix has a total of
rows, each of which is a reconstructed component. If
represents the index of the column of each element in the reconstructed component, then some of the reconstructed components in Equation (4) can be rearranged as presented in Equation (5) in ascending order.
If there are equal sizes in the reconstructed components, sort them by comparing the values of
and
. When
,
. Therefore, for any reconstruction component, there is a set of symbol sequences
,
, and
. It means that there can be
kinds of mappings in the m-dimensional phase space, and
is the
kind of arrangement. Calculate the probability
of occurrence of each symbol sequence. Then, in the form of Shannon entropy, the permutation entropy of
ties of different symbol sequences of time series
can be defined as
when
,
will reach the maximum value
. Normalize
, i.e.,
Obviously,
can represent the randomness of
; the larger
is, the higher the degree of randomness of
is; otherwise, the
is more regular [
37].
2.3. Gath–Geva Clustering Algorithm
The calculation steps of the GG clustering algorithm are as follows [
38].
(1) Suppose the data sample matrix
, and each sample has
attributes. Let the number of initialized cluster classes be
. Divide
samples into
clusters. Then, the membership degree partition matrix is
, and it satisfies the following conditions
where
represents the subordination degree of the
k-th sample belonging to the
i-th cluster class.
(2) Set the termination tolerance and to randomly initialize the classification matrix .
(3) Compute the cluster center points.
where
.
(4) Compute the fuzzy maximum likelihood estimation distance.
where
is the a priori probability of class
.
The minimization objective function is
(5) Update the classification matrix of membership degree
until
.
2.4. Proposed Fault Diagnosis Method
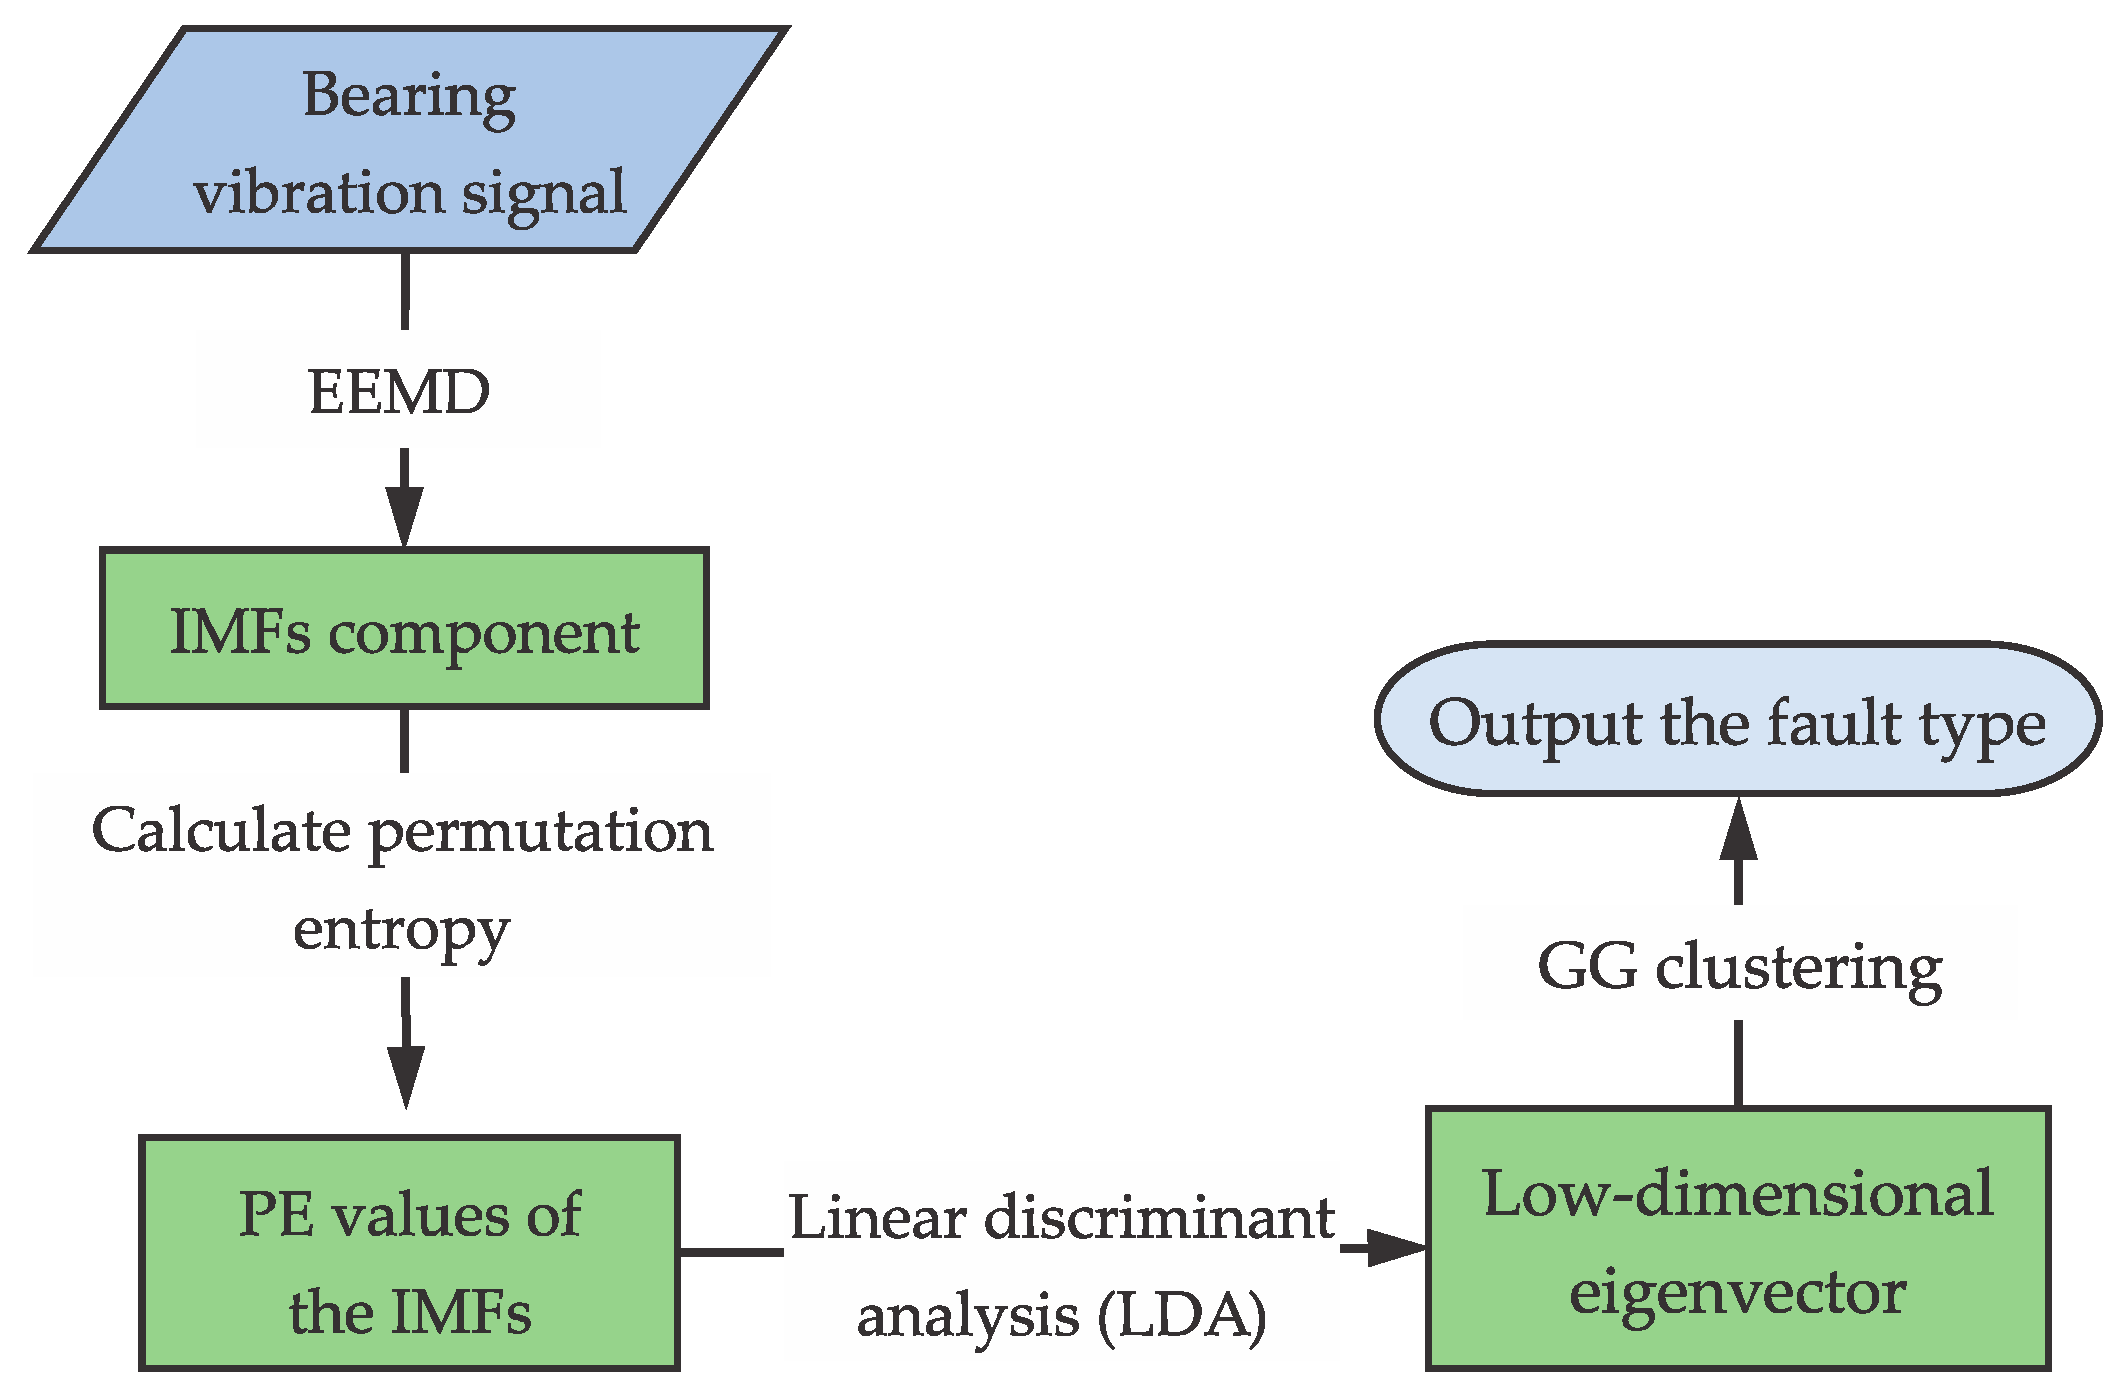
The new fault diagnosis method, which combines EEMD, permutation entropy, and the GG clustering algorithm, has the following characteristics. It makes full use of the characteristics of EEMD, which can restrain mode confusion in the EMD decomposition process. Besides, permutation entropy has a low requirement for data length. Aiming at the new problem of high dimension and data visualization in the entropy eigenvectors obtained by this method, the linear discriminant analysis (LDA) is used to reduce the dimension of the eigenvectors. Finally, the main eigenvectors with low dimensions, high sensitivity, and low classification error rates are input into the GG clustering algorithm for cluster analysis.
The algorithm steps designed for the above process are as follows.
Step 1: Decompose the vibration signal by EEMD to obtain several IFMs;
Step 2: Calculate the permutation entropy of the IFM components. Each IFM component will have a permutation entropy. Arranging the entropy of each component in order, we will obtain the high-dimensional permutation entropy eigenvector;
Step 3: Linear discriminant analysis is used to reduce the dimension of the eigenvector of the entropy value.
Step 4: The reduced dimension feature vectors are used as the input of the GG clustering algorithm for clustering analysis. Use the cluster evaluation index to evaluate the clustering effect.
The data processing flow corresponding to the above algorithm is shown in
Figure 1.
2.5. Clustering Evaluation Index
In this paper, we will use PC (partition coefficients), CE (classification entropy), and XB (Xie and Beni’s index) to evaluate the clustering effect of these different models.
(1) Partition Coefficients.
(2) Classification Entropy.
(3) Xie and Beni’s index.
In the formula,
is the value of membership degree. The nearer the value of PC is to 1 and the nearer the values of CE and XB are to 0, the better the clustering results [
39,
40,
41].
3. Experiments and Results
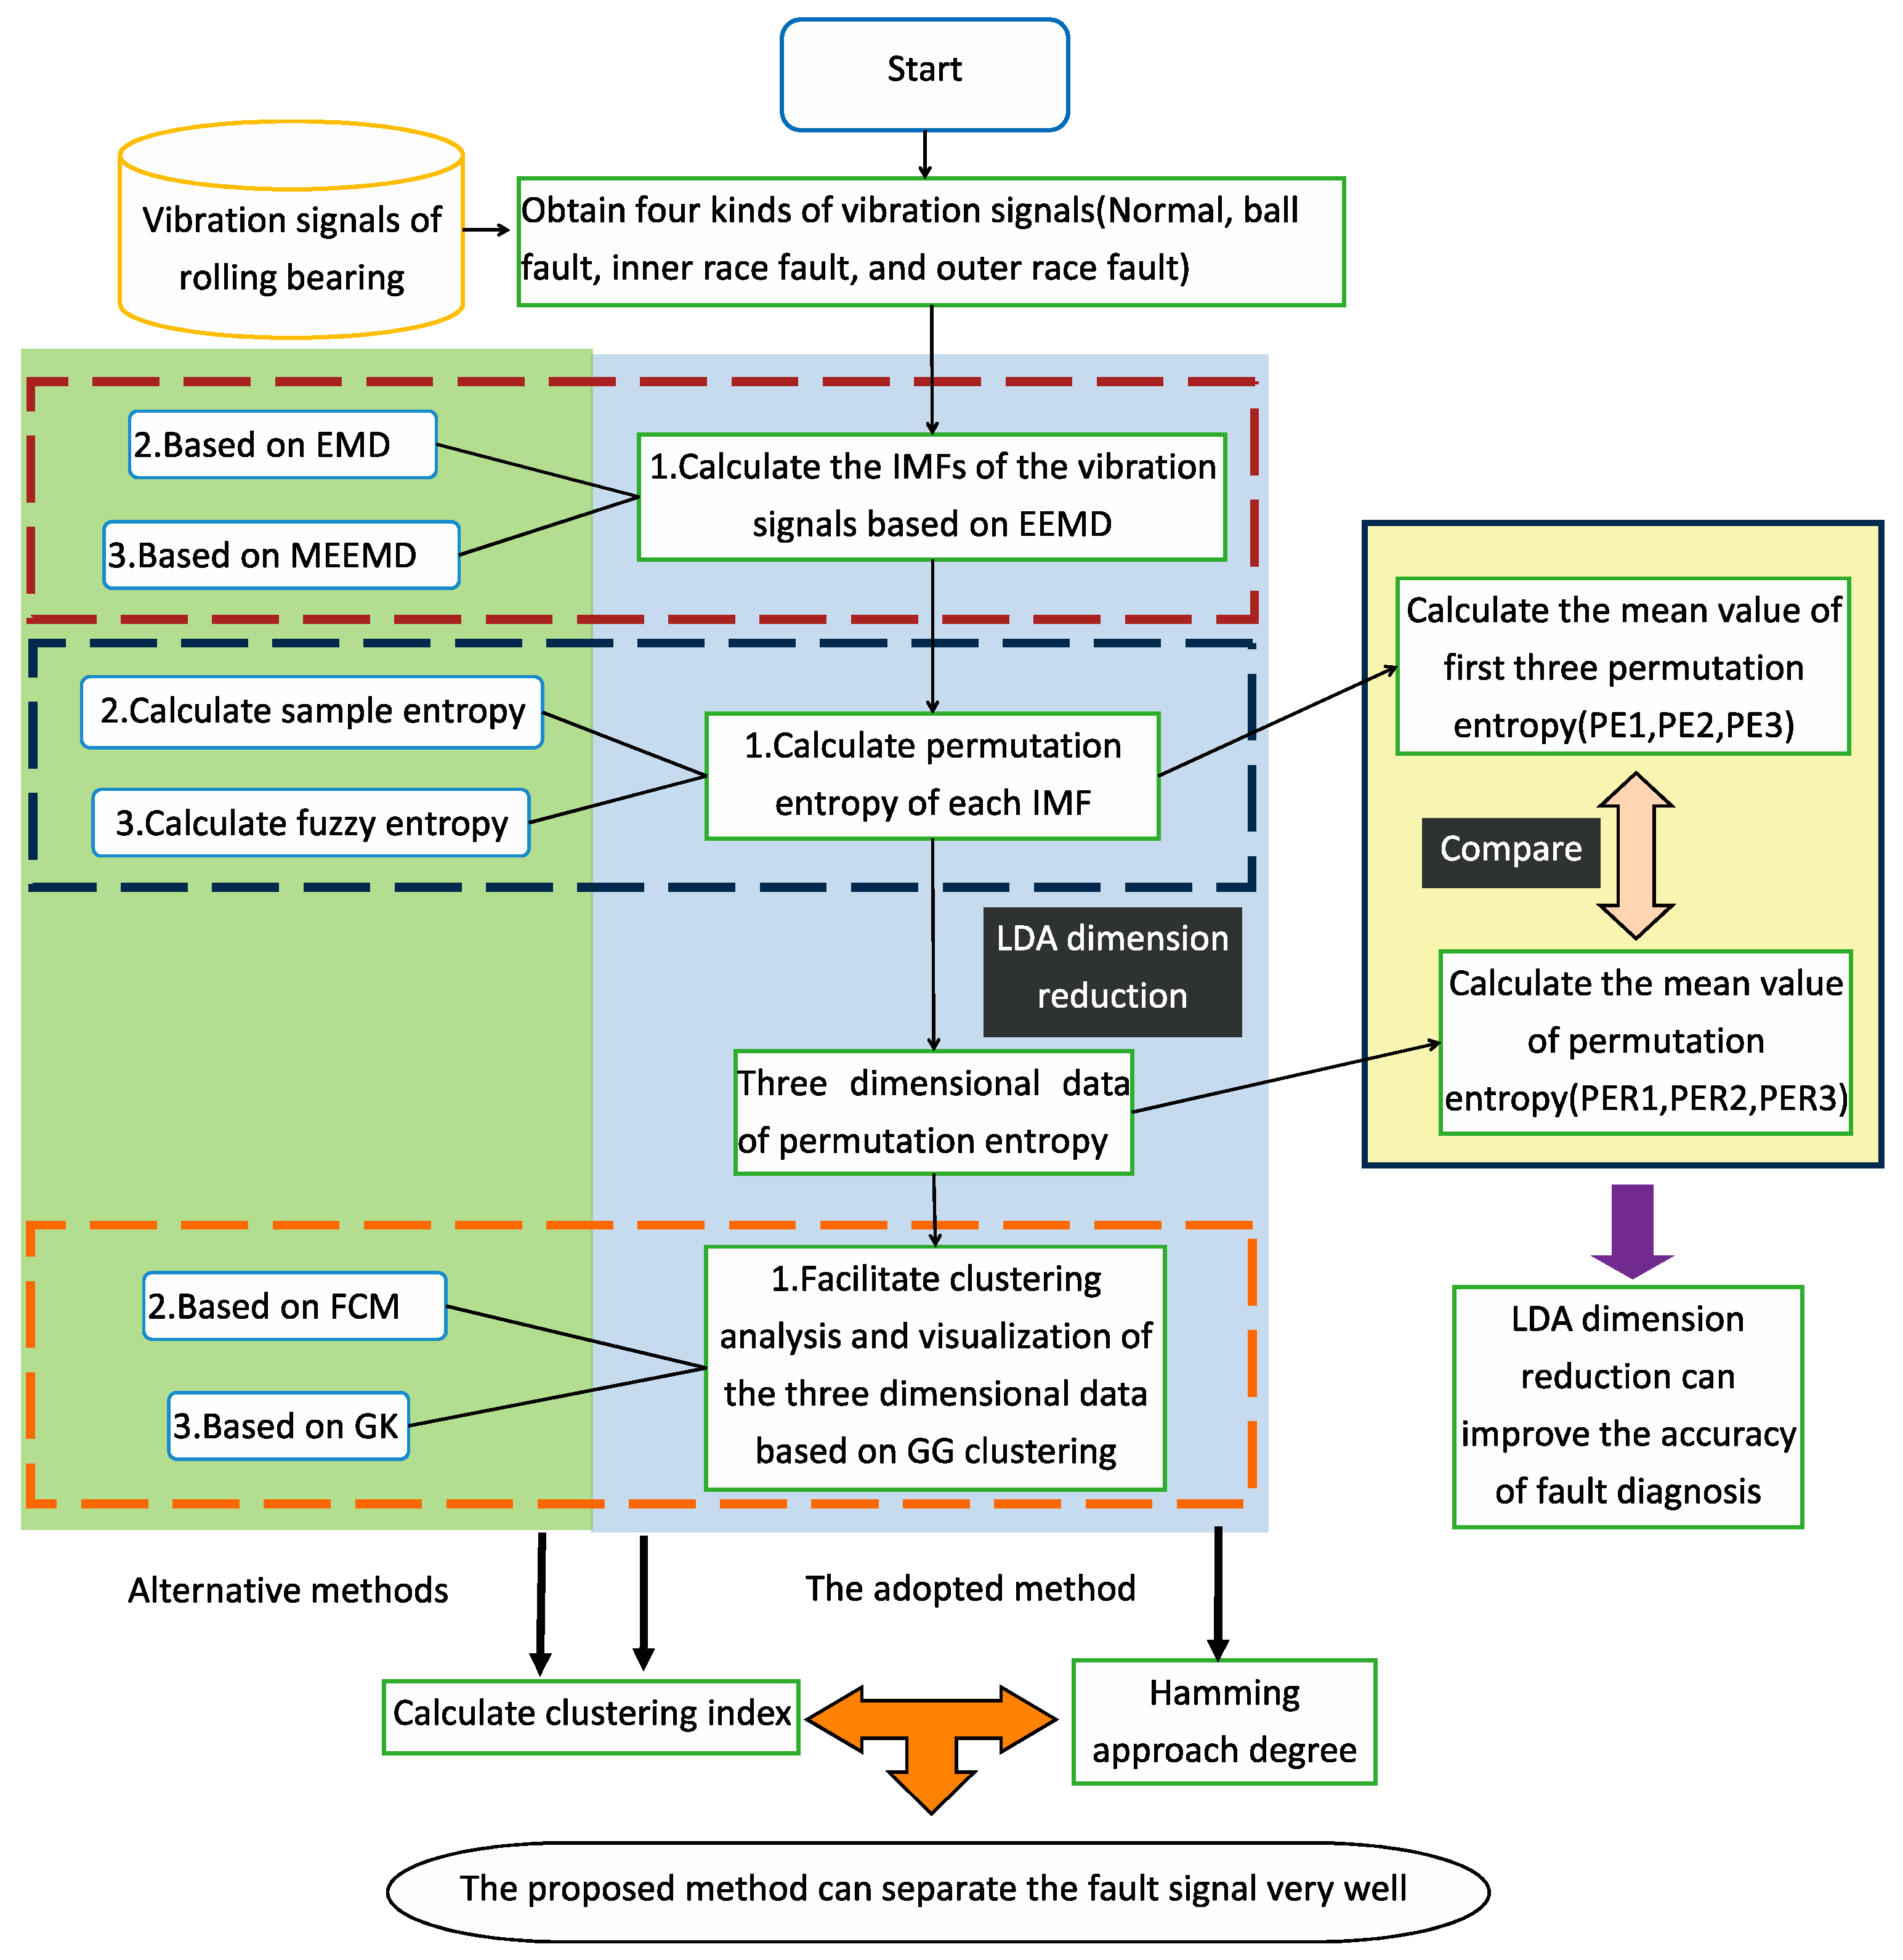
The experimental data of rolling bearings are derived from the Bearing Data Center of Case Western Reserve University. The bearing is made by Svenska Kullager-Fabriken Company(SKF), and motor power is 2 horse power(HP). The local fault of the bearing is a single point manufactured by electro-discharge machining (EDM). The specific experimental process is shown in
Figure 2.
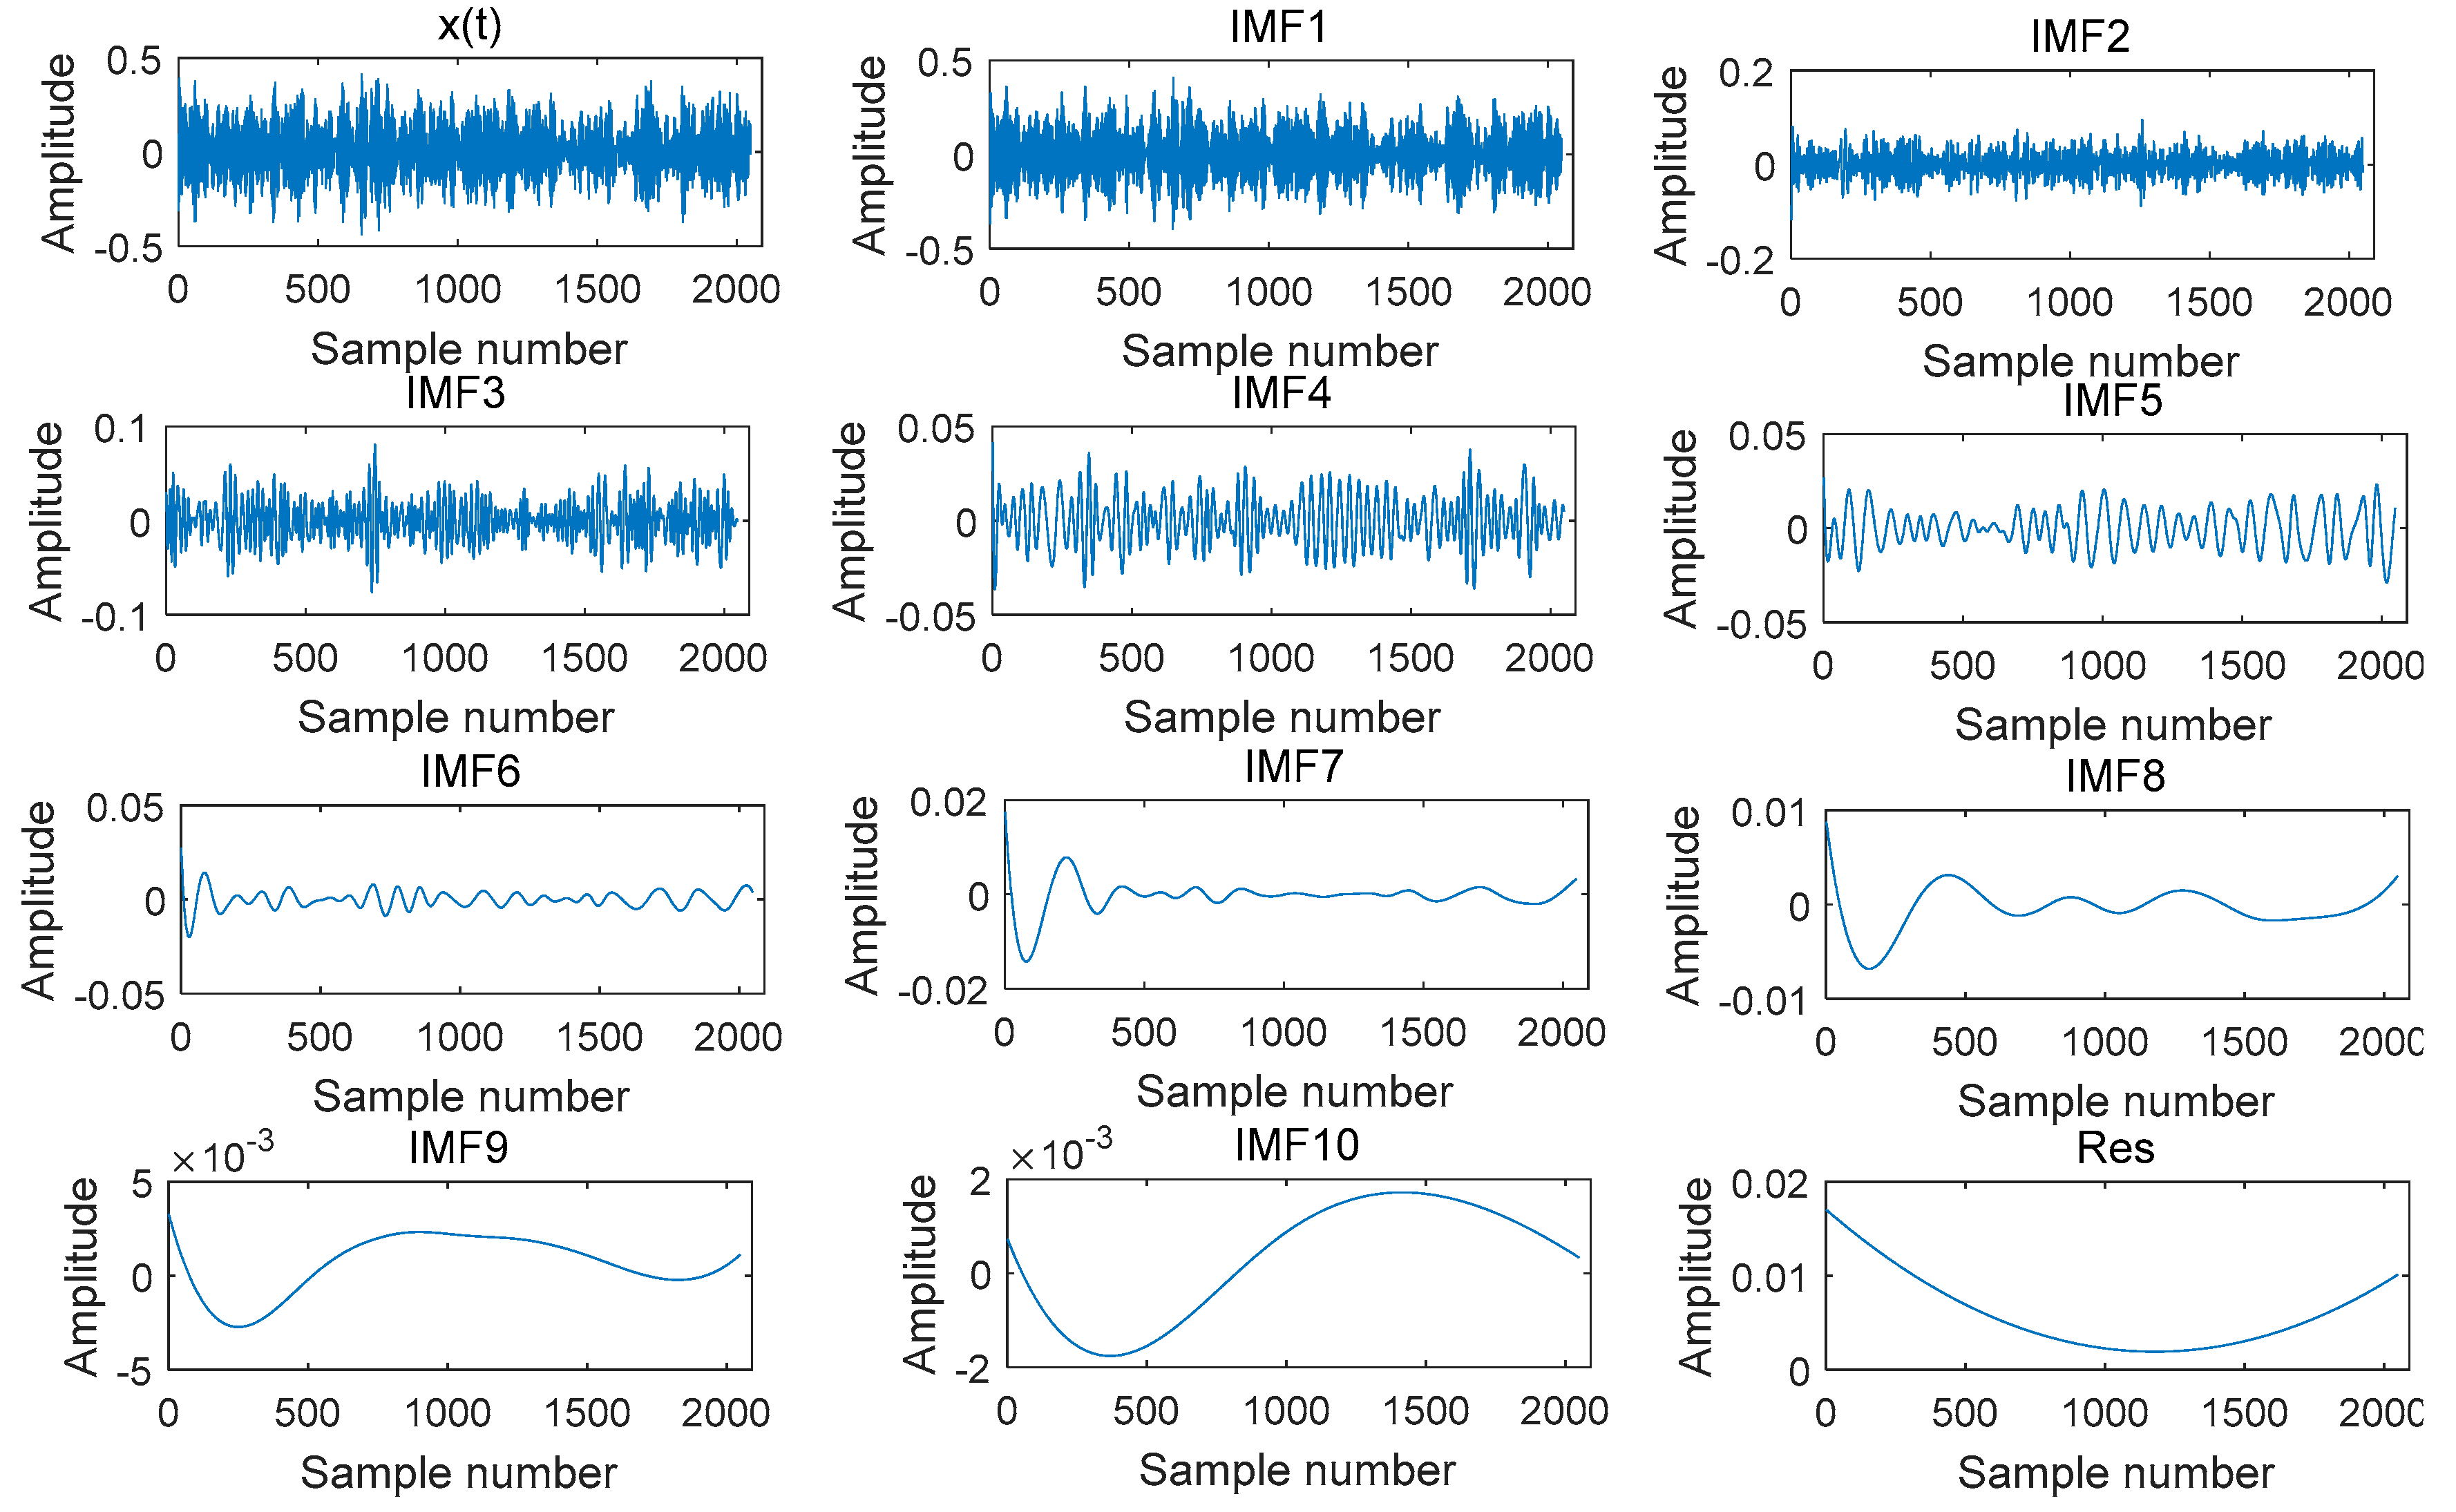
The fault types of experimental data of a vibration signal can be divided into three types: ball fault (B), inner ring fault (IF), and outer ring fault (OF). There is also a set of normal signals (N). The fault diameter is 0.1778 mm, and the sampling frequency is 12 kHz. Fifty sets of data samples are taken for each type, and the sample length is 2048. Taking one vibration signal x (t) as an example, the signal is decomposed into several IMF components, as shown in
Figure 3. Calculate the permutation entropy (PE) of each IMF component to obtain the permutation entropy eigenvectors of each signal type. Since the number of components obtained by the decomposition of each sample signal is generally more than three, the obtained permutation entropy eigenvector is a high-dimensional vector. For the sake of visualization and clustering analysis, it is necessary to reduce the high-dimension of the feature vectors into three dimensions by using the linear discriminate analysis (LDA) algorithm. So, four sets of permutation entropy eigenvectors (including the eigenvectors of a normal bearing signal) are obtained, each of which has a dimension of 3 × 50. The mean values are shown in
Table 1.
As shown in
Table 1, it can be found that the permutation entropy of IMF1 increases in turn, which indicates that their complexity increases in turn and that the permutation entropy of different types of signals is different. In other words, the complexity of different fault signals varies. Therefore, the permutation entropy can be used as the characteristic information to distinguish different types of signals, and it can serve as a basis for clustering analysis.
Corresponding to
Table 1,
Table 2 is the average value obtained after the LDA dimension reduction of the component entropy value. From the data in
Table 2, we can find that after dimension reduction, the useful information is retained, and the secondary information is removed, so that the difference of entropy values between different signals is more obvious. This will make the clustering have better compactness, improving the clustering effect, and help improve the accuracy of fault diagnosis.
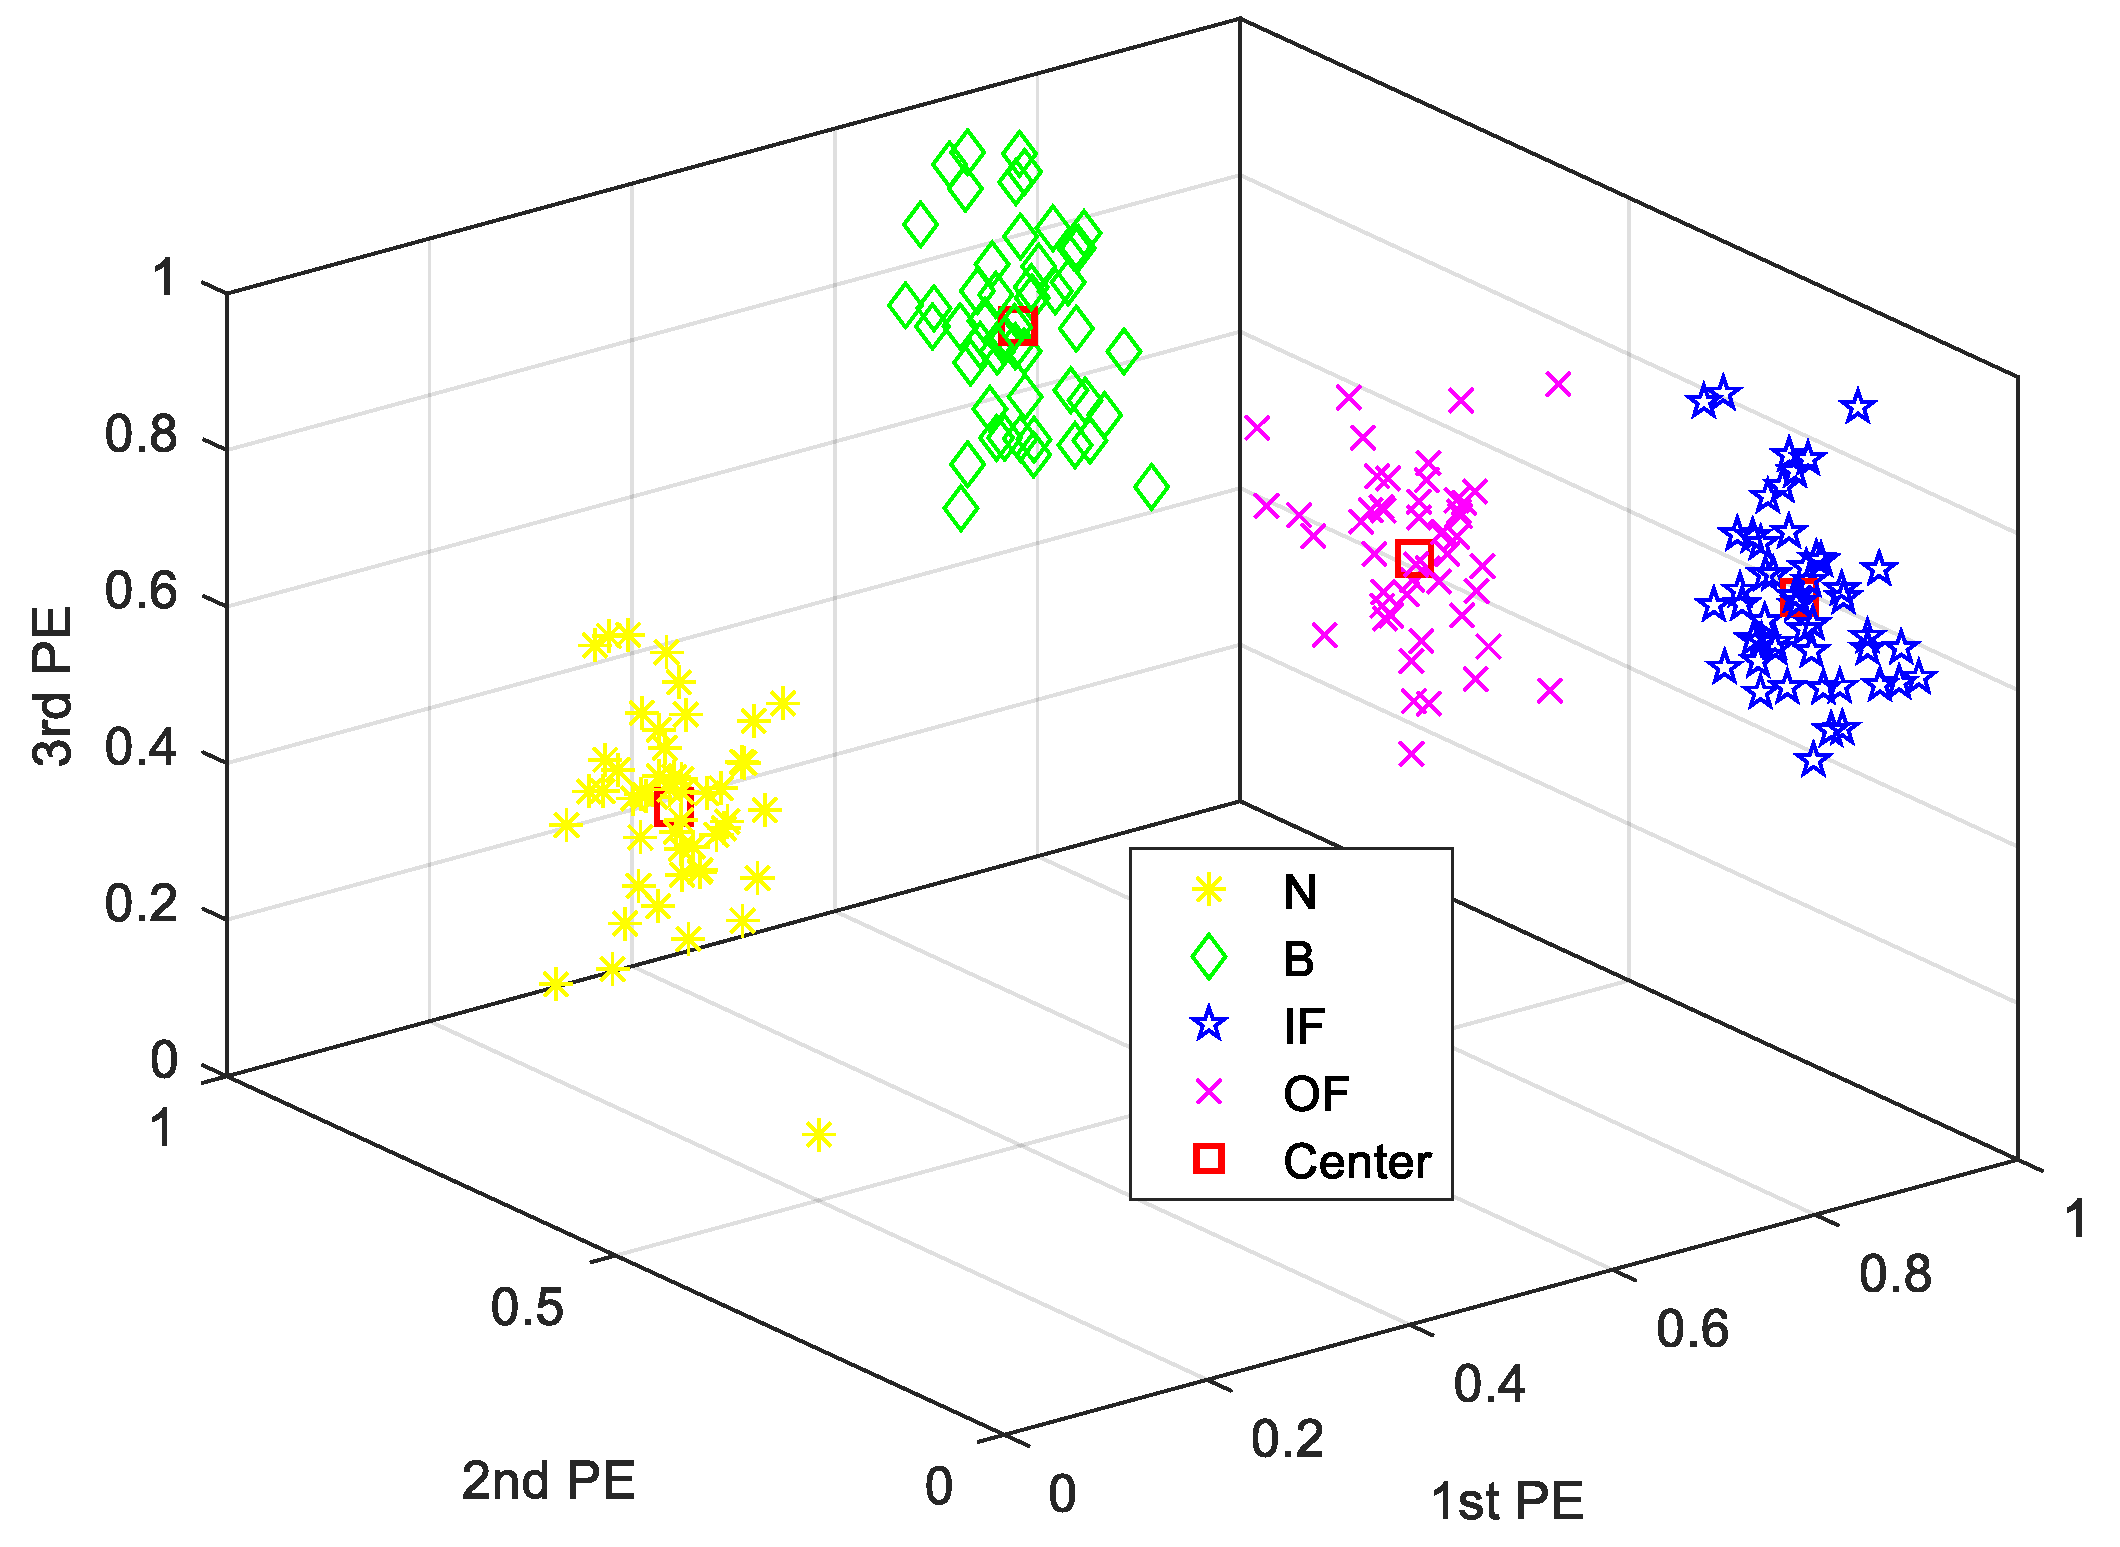
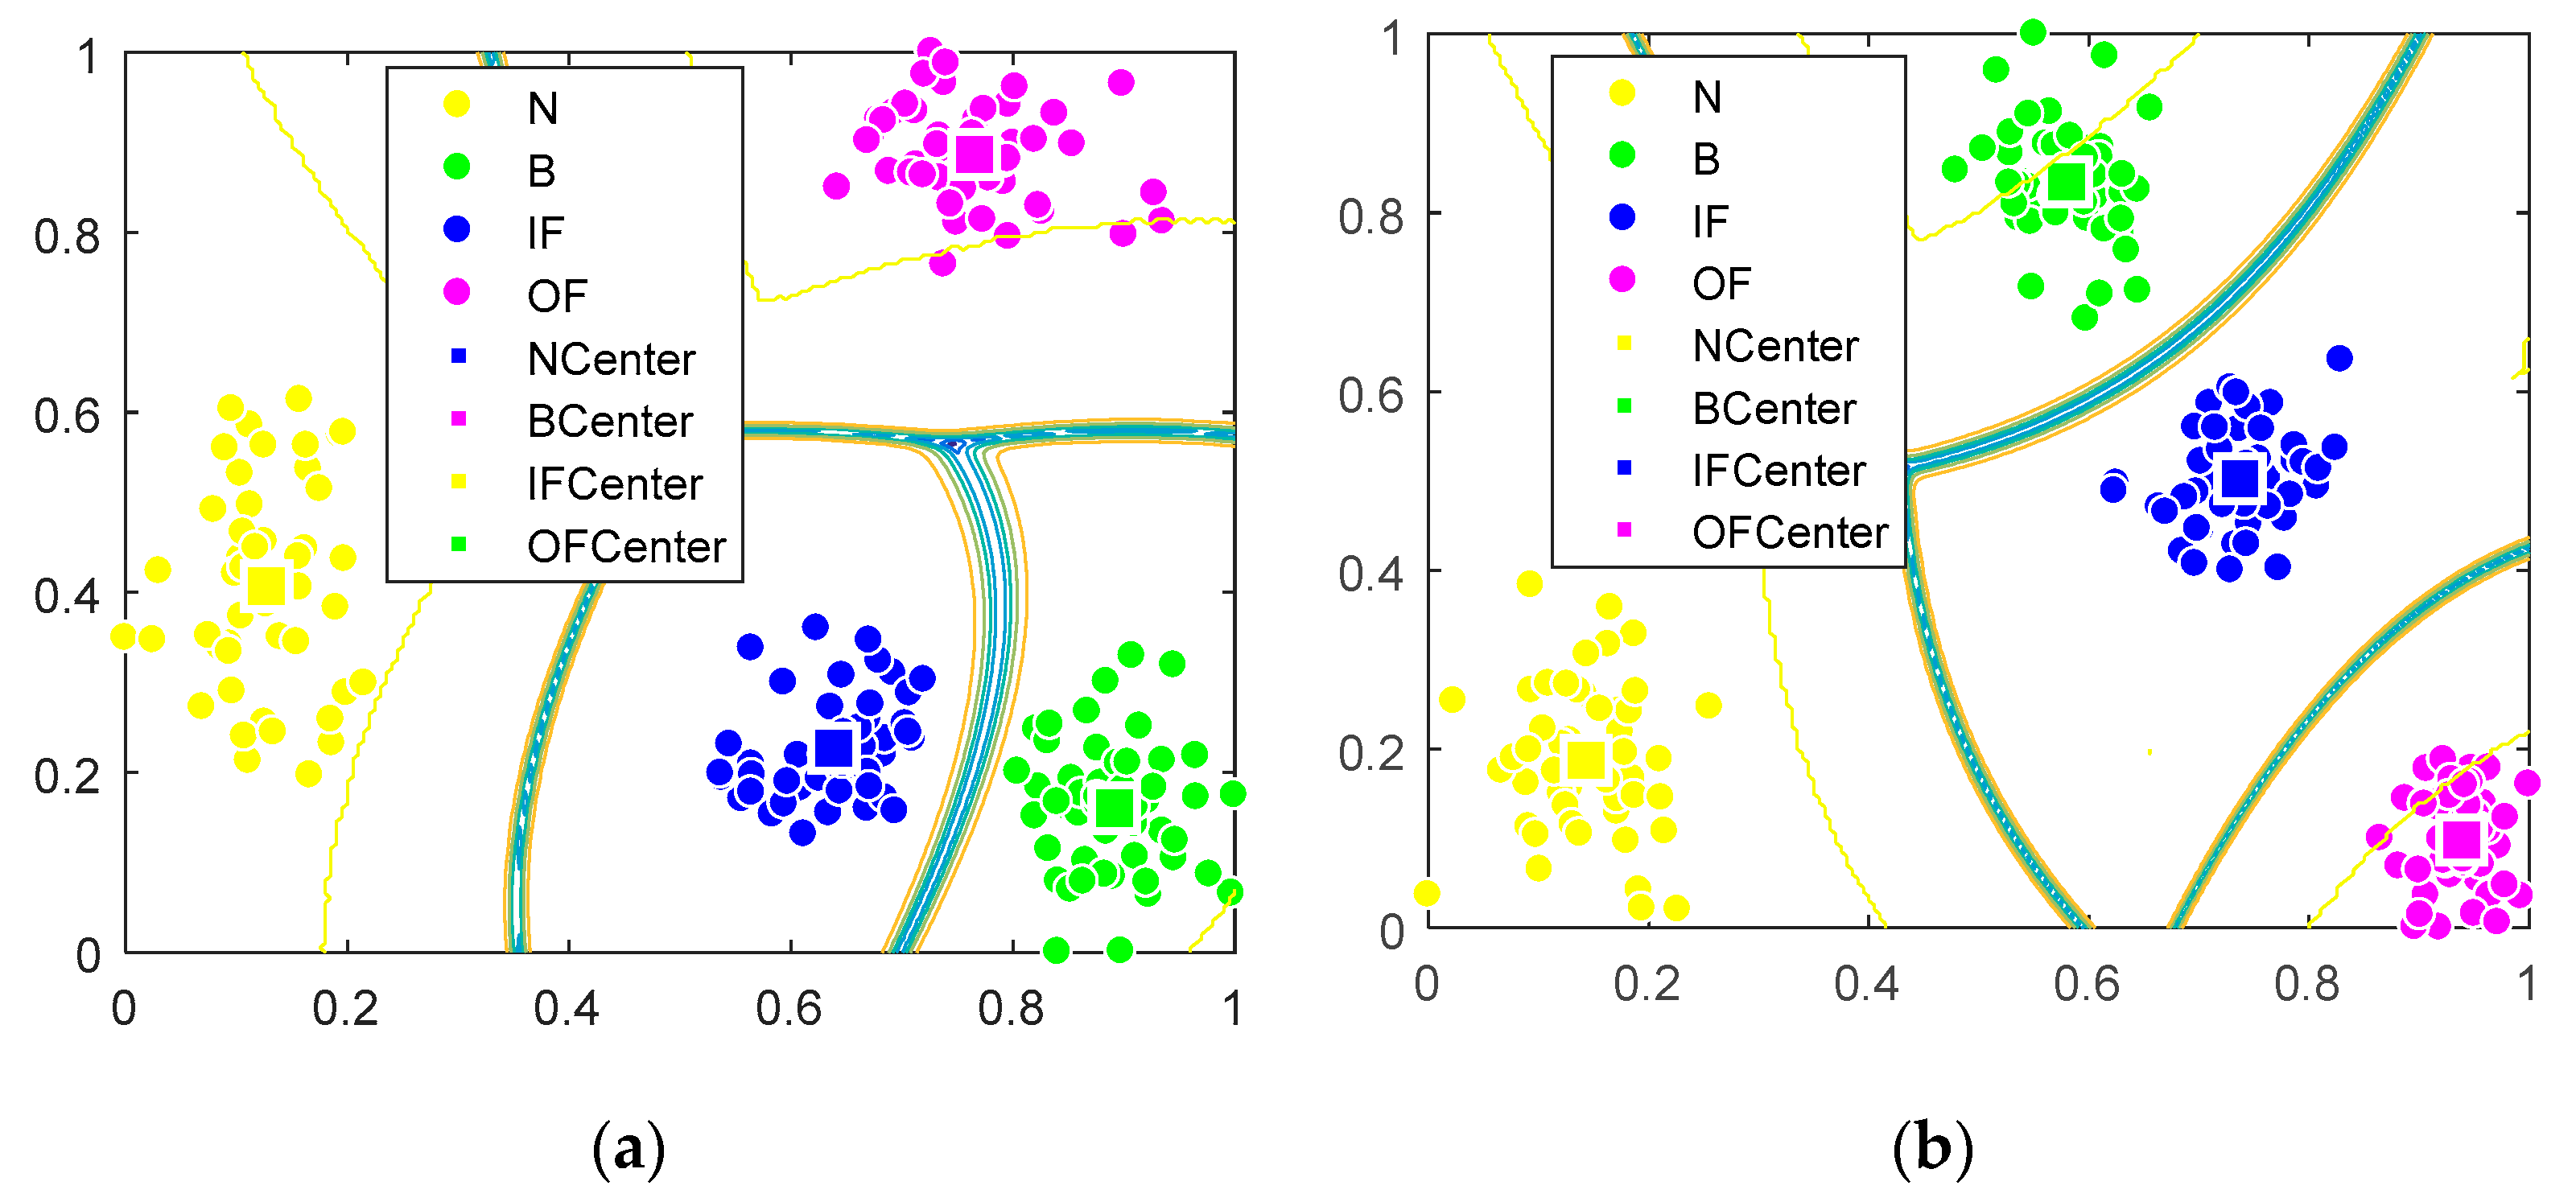
According to the data of four fault types, the number of cluster centers is initially selected as c = 4. The weighted index m = 2, and the iteration termination tolerance c = 0.0001. The results of the GG clustering analysis for four sets of permutation entropy data of eigenvectors obtained by LDA show that the four types of data are clustered near the clustering center, and they are closely clustered (shown in
Figure 4 and
Figure 5). There is no aliasing phenomenon among them, and the distance between them is large.
The clustering centers of data are shown in
Table 3. The clustering centers of the four signal types are V1–V4 in turn.
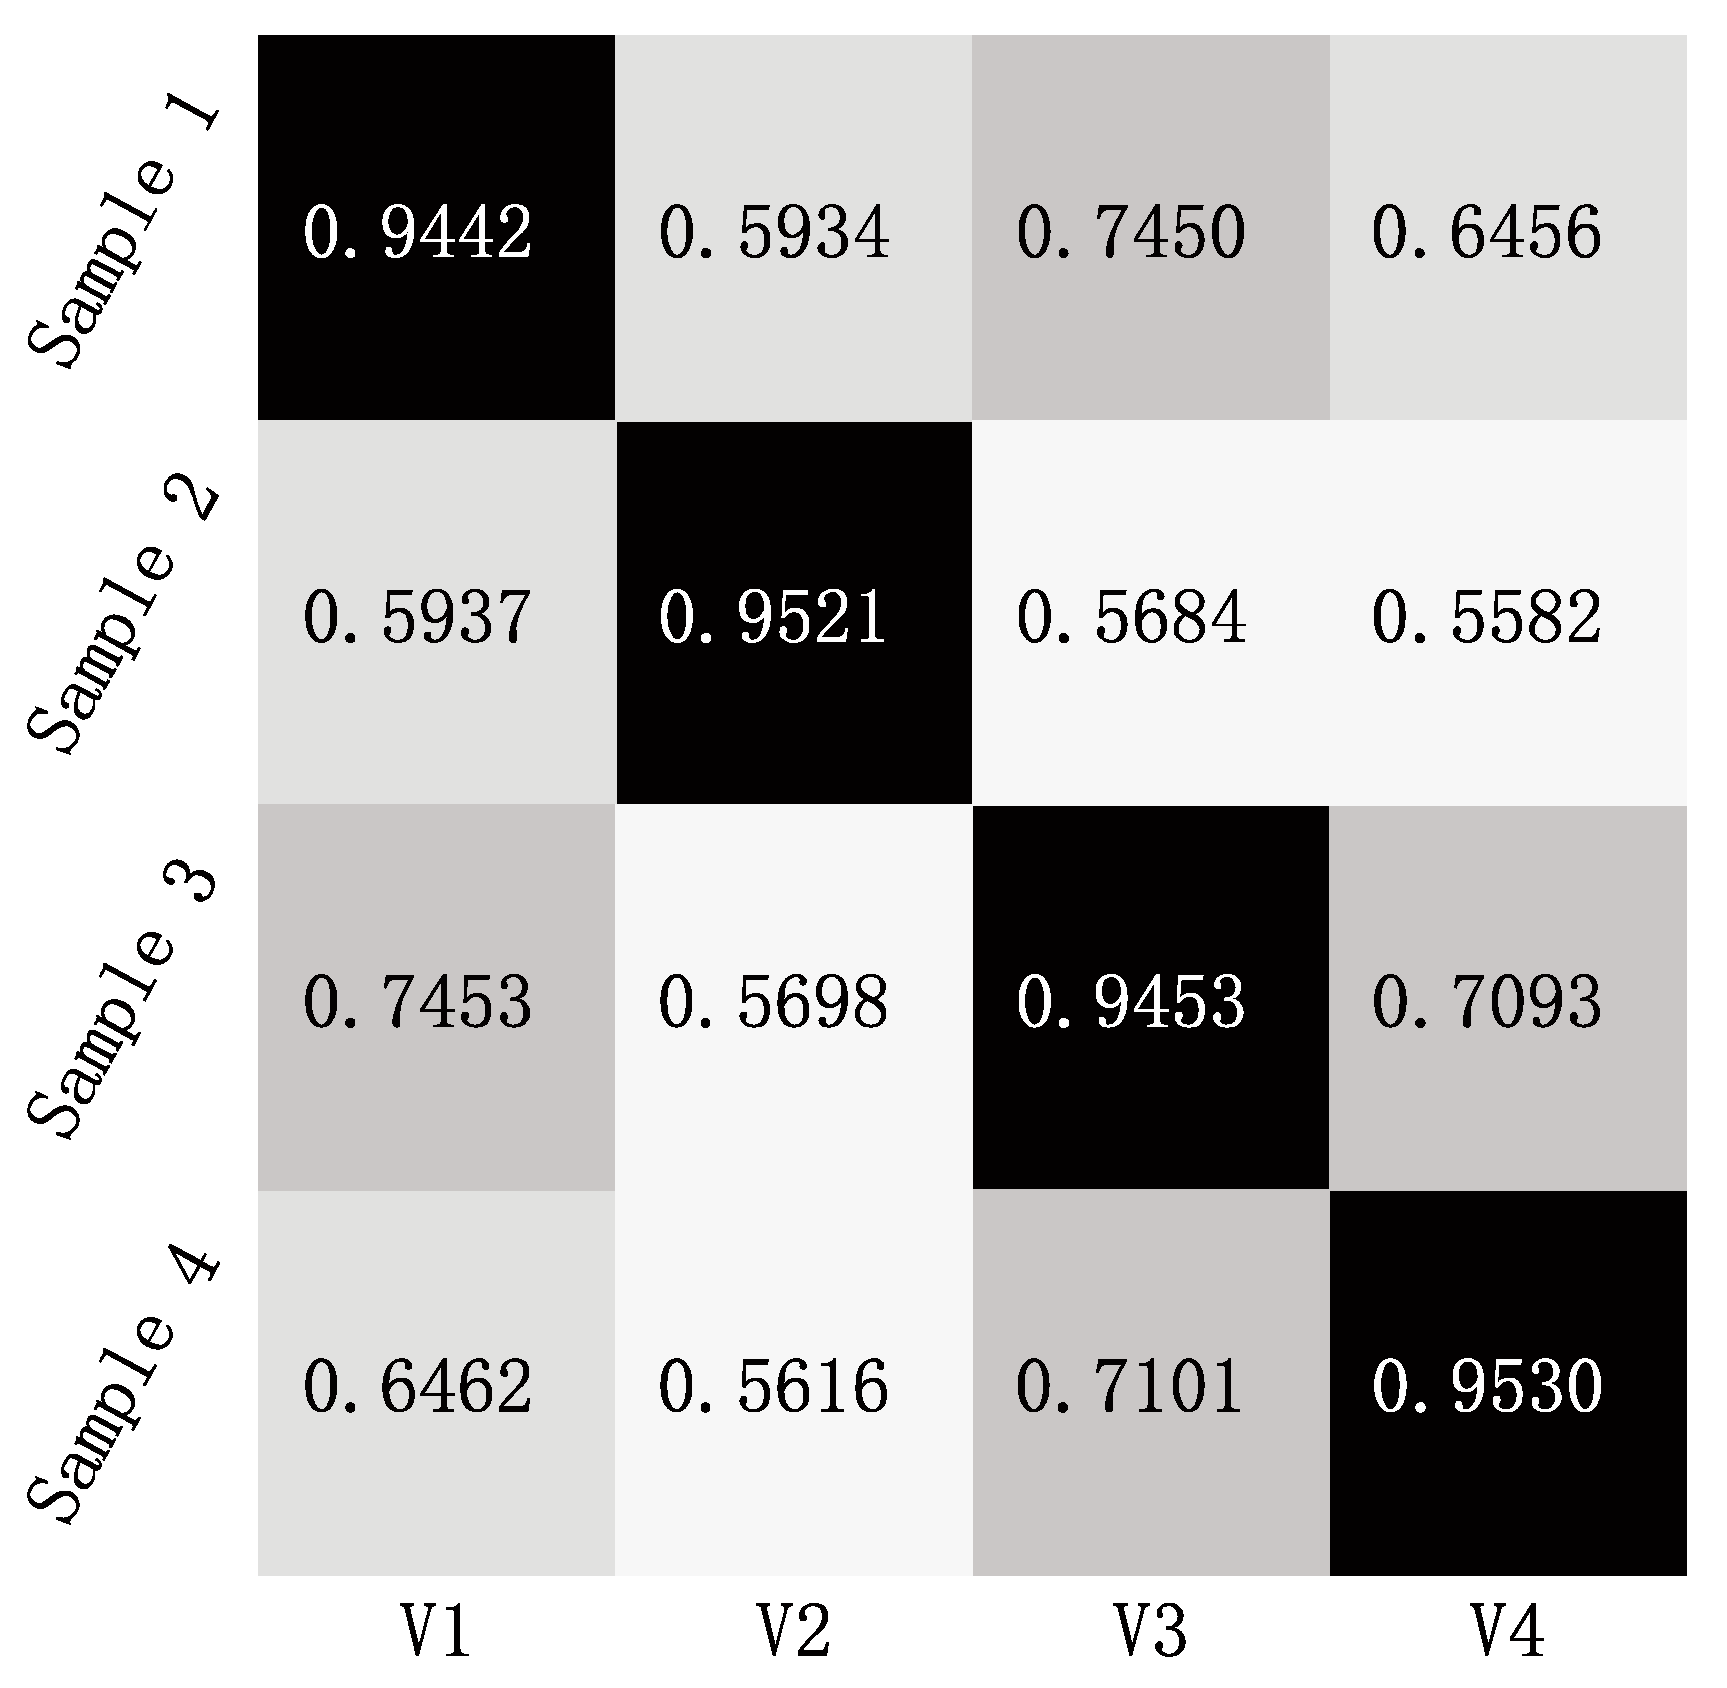
Figure 6 shows the average Hamming approach degree of each sample set. The Hamming approach degree of Group 1 relative to V1 is 0.9442, close to 1, and larger than that of the other three groups. Therefore, Group 1 belongs to V1. Similarly, Group 2 belongs to V2, Group 3 belongs to V3, and Group 4 belongs to V4. Therefore, this proposed method has good performance in the fault diagnosis of rolling bearings.
In order to further verify the superiority of EEMD over EMD and modified ensemble empirical mode decomposition (MEEMD) [
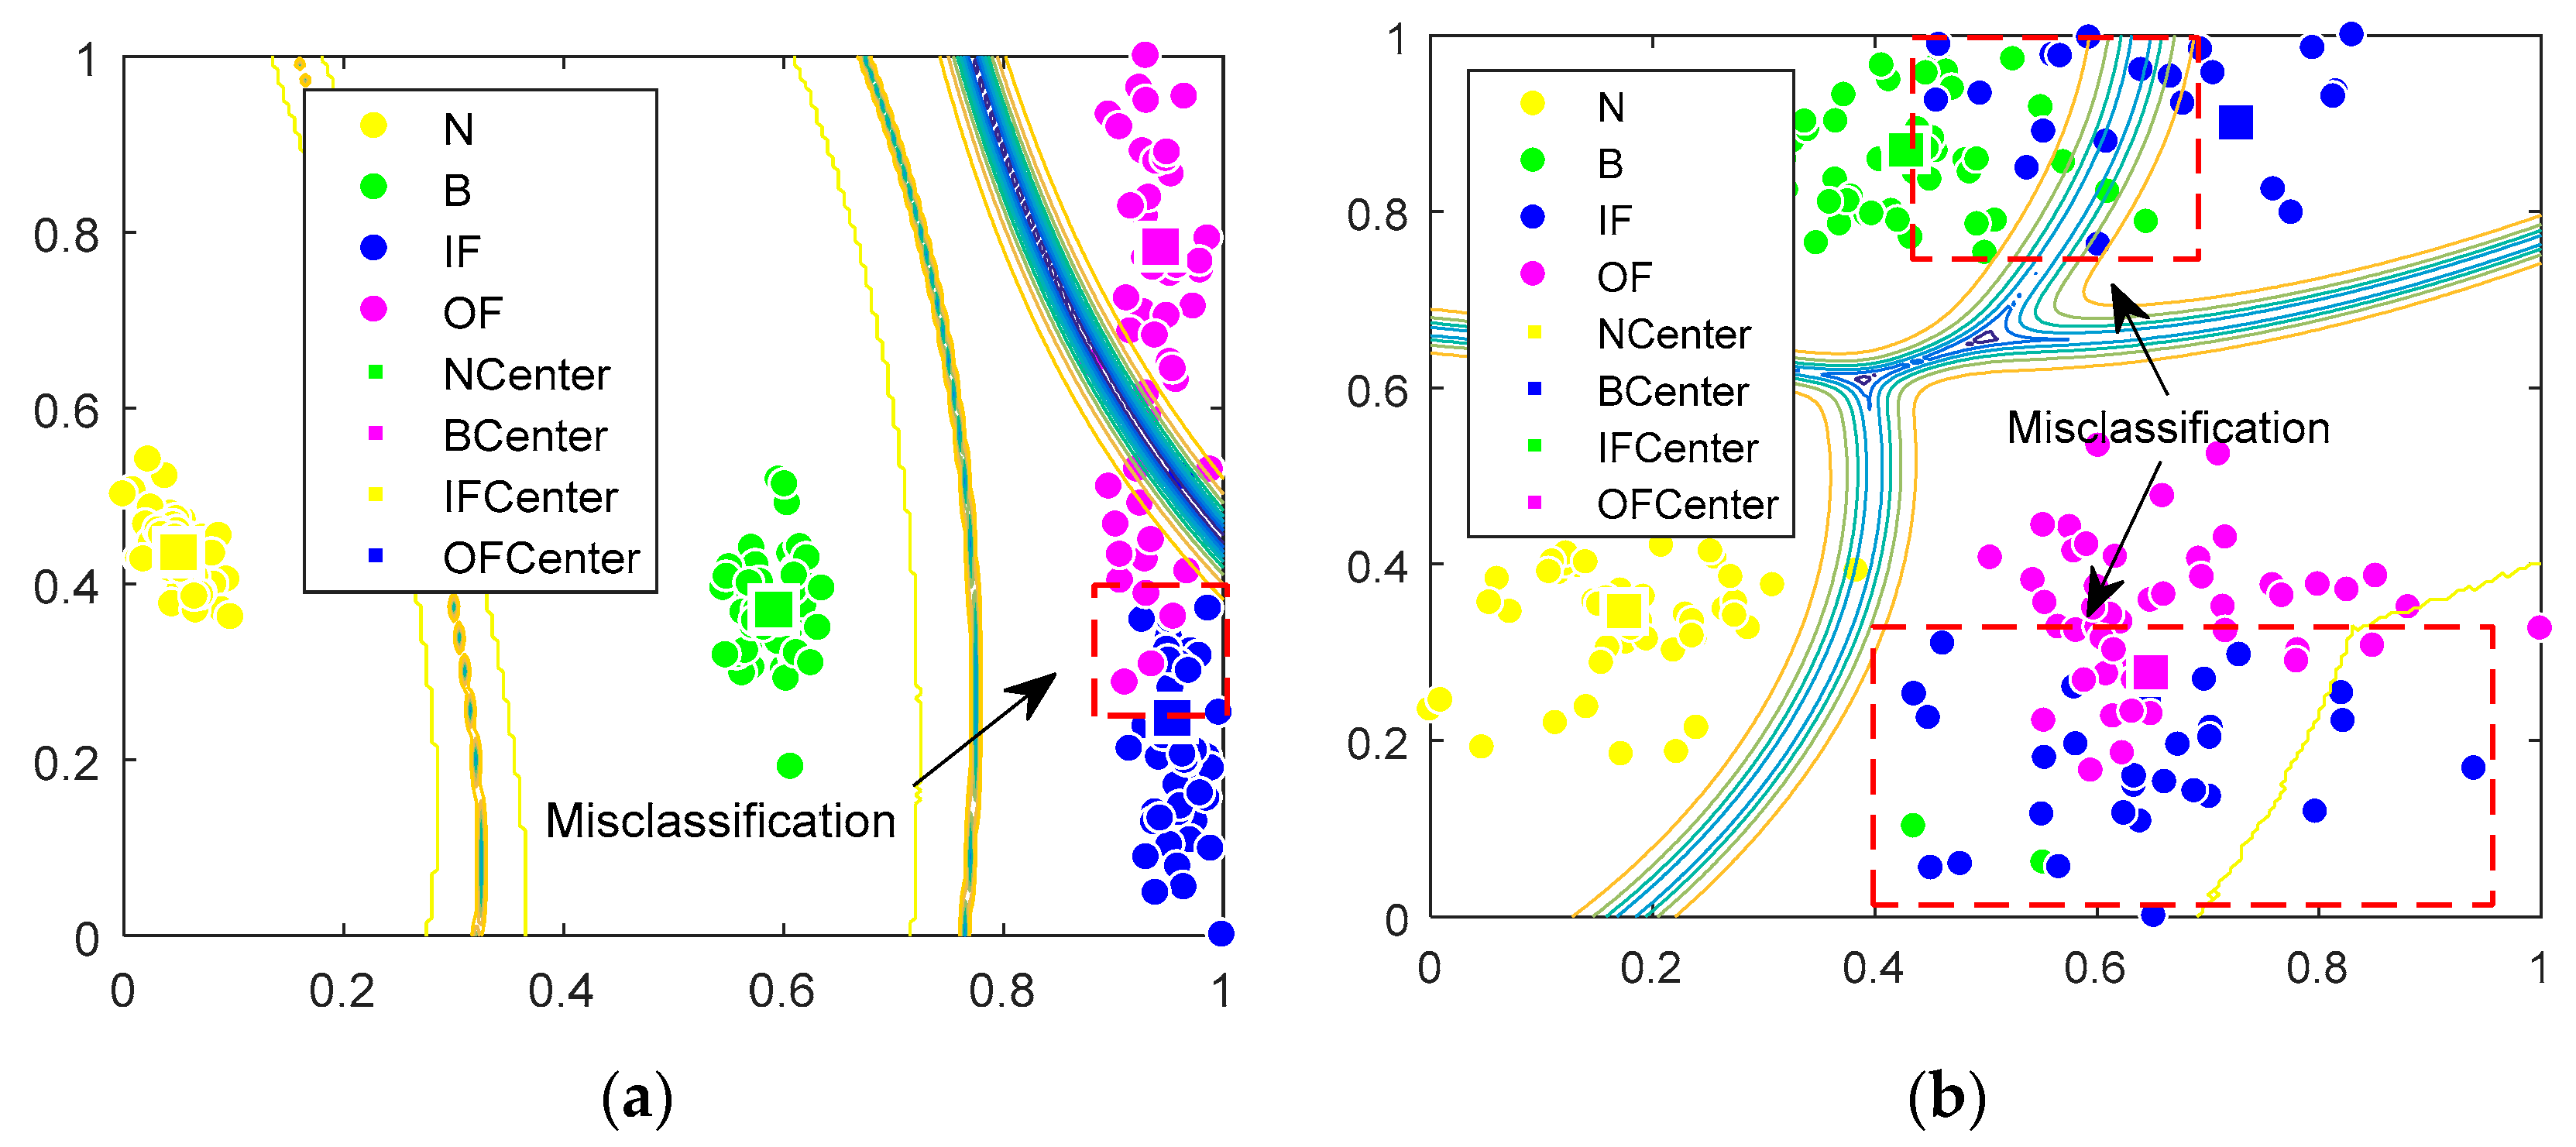
42], the four groups of signals were decomposed by EMD and MEEMD respectively, and then GG clustering analysis was carried out. The results are shown in
Table 4 and
Figure 7.
From
Figure 5 and
Figure 7, we can draw the following conclusions. (1) The clustering centers of four types of data vary over different signal decomposition methods, and there is an aliasing phenomenon with decomposition based on EMD and MEEMD. (2) The compactness of GG clustering results with EEMD is better than that of EMD and MEEMD. According to
Table 4, the index PC of the cluster analysis with EEMD is 1.0000, which is larger than EMD (0.9927) and MEEMD (0.9783). The index CE and XB with EMD and EEMD is NaN (a number approaching zero in MATLAB). It means that they are close to zero. However, the index CE and XB with MEEMD is 0.0383 and 2.5300 respectively, which is larger than EMD and EEMD. According to the three indicators above, we can see that clustering based on EEMD has better performance. Therefore, the feature extraction method based on EEMD is better than EMD and MEEMD in fault analysis and diagnosis using GG clustering.
In order to further verify the superiority of permutation entropy (PE) over sample entropy (SE) and fuzzy entropy (FE), the four groups of signals were decomposed by EEMD. Then, we calculated sample entropy and fuzzy entropy, respectively. GG clustering analysis was carried out. The results are shown in
Table 5 and
Figure 8.
From
Figure 5 and
Figure 8, we can draw the following conclusions. (1) The clustering centers of four types of data vary adopting different entropies. (2) The compactness of GG clustering results with permutation entropy is better than that of sample entropy and fuzzy entropy. According to
Table 5, the index PC of the cluster analysis with permutation entropy and sample entropy is 1.0000, which is larger than that of fuzzy entropy (0.9467). The index CE and XB with permutation entropy is NaN. It means that they are close to zero. However, the index CE and XB with sample entropy and fuzzy entropy are non-zero, which is larger than permutation entropy. According to the three indicators above, we can see that clustering based on permutation entropy has the better performance.
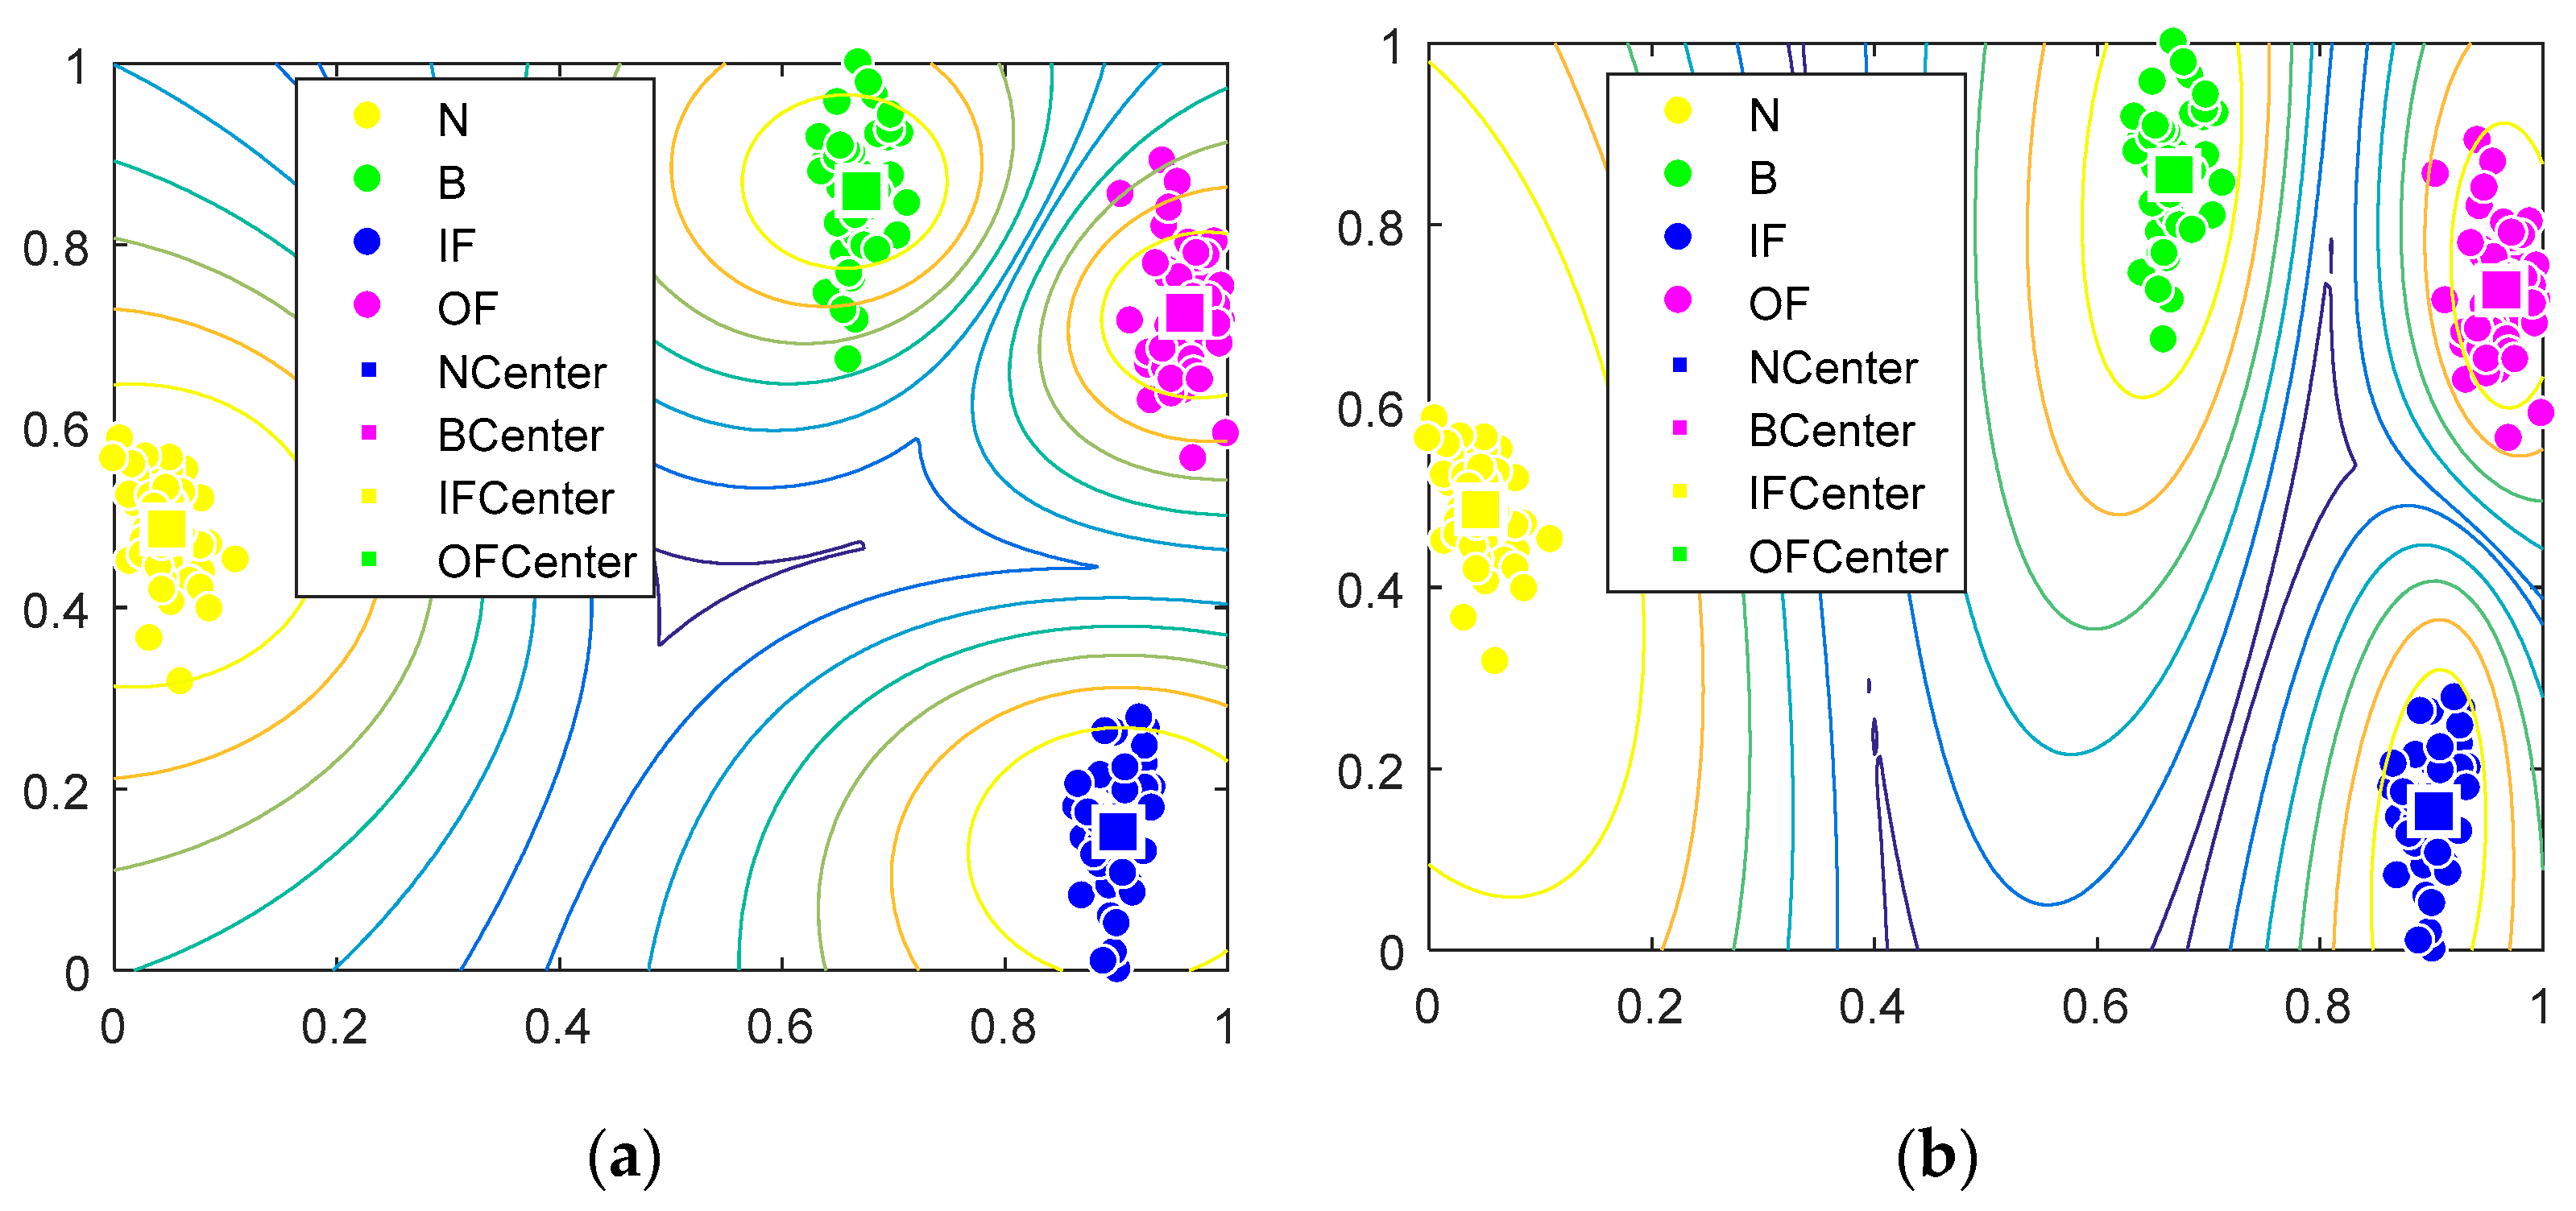
Again, to verify the superiority of the GG clustering method compared with FCM and GK, we decomposed the original signal by EEMD and calculated its permutation entropy, and then performed FCM clustering and GK clustering analysis. The results are shown in
Table 6 and
Figure 9.
According to
Table 6, the index PC of GG clustering is 1.0000, which is larger than FCM clustering (0.8434) and GK clustering (0.6392). The index CE and XB of GG clustering is NaN. It means that they are close to zero. However, the index CE values of FCM clustering and GK clustering are 0.3460 and 0.6674 respectively, which are larger than that of GG clustering. The index XB of FCM clustering and GK clustering is 9.5330 and 2.8304 respectively, which is larger than GG clustering. That is, GG clustering has better performance than FCM clustering and GK clustering.
As can be seen from
Figure 9, the clustering centers of GK clustering and FCM clustering are similar, which shows that different clustering methods have less influence on the clustering centers. At the same time, the compactness and spatial distribution of GG clustering, FCM clustering, and GK clustering are similar. However, from the contour shape, it can be seen that the contour of the FCM clustering algorithm is approximately spherical, which indicates that FCM can only reflect the standard distance specification of a hyperspherical data structure; meanwhile, the contour map of the GK clustering algorithm is improved compared with FCM, but it is still approximately spherical; in contrast, the contour map of the GG clustering algorithm has no fixed shape, which indicates that GG can reflect the degree of dispersion of mapping data in any direction or subspace. So, based on the analysis above, we can conclude that the GG clustering algorithm is superior to the FCM and GK clustering algorithm.
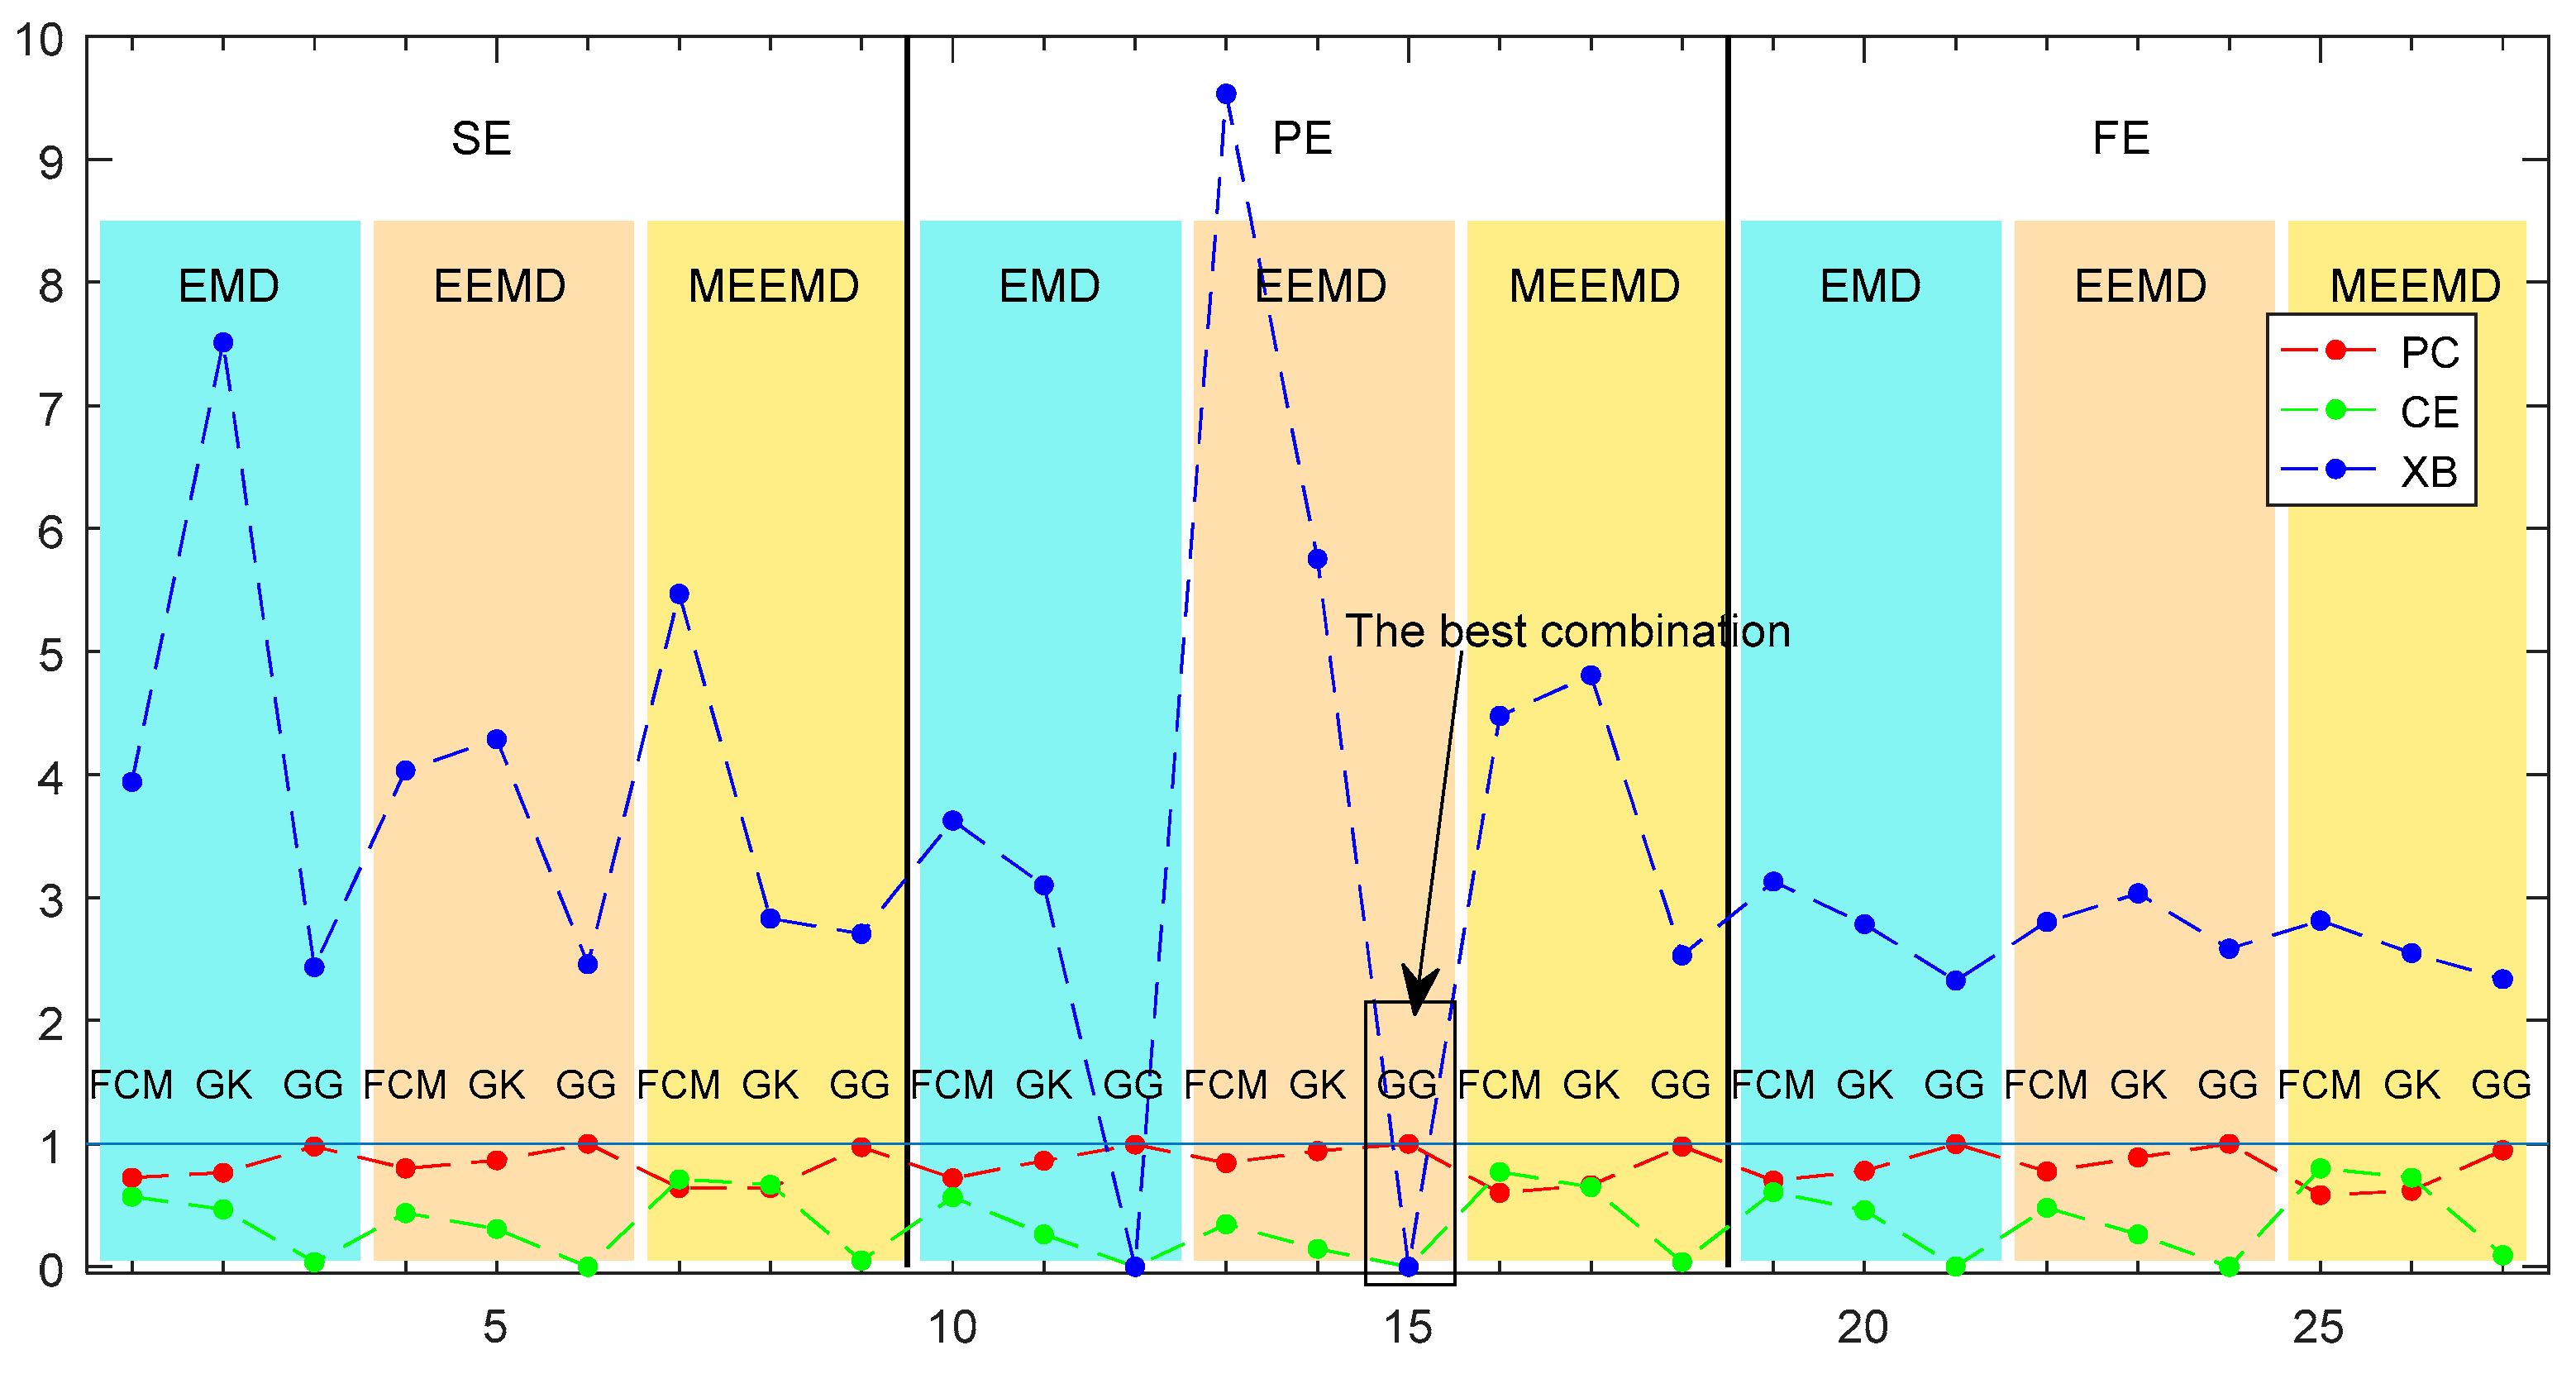
According to the fault diagnosis method proposed in this paper, if we want to analyze a piece of an original fault diagnosis signal, first, we need to perform empirical mode decomposition, getting the signal entropy value. Then, we perform LDA dimensionality reduction, which will facilitate the subsequent cluster analysis to realize the classification of signal data. In this process, there are three methods of empirical mode decomposition, such as EMD, EEMD, and MEEMD. Similarly, there are three types of entropy values, such as fuzzy entropy, sample entropy, and permutation entropy. Clustering methods usually include FCM clustering, GK clustering, and GG clustering. In the analysis and discussion above, we control the variable method to keep two processes unchanged and compare the third process to determine the optimal approach. However, this analysis is not comprehensive enough, because there are a total of 27 ways to obtain fault diagnosis through the above process. Through the above analysis, it is not fully proved that the optimal method we selected is the best among the 27 types. To confirm the superiority of our proposed fault diagnosis method, we analyze each combination, and the clustering index of each combination is obtained as shown in
Figure 10.
From
Figure 10, it can be seen that the clustering indicators PC and CE are both below 1., and the index XB is relatively large except for in Method 12 (PE + EMD + GG) and Method 15 (PE + EEMD + GG). That is to say, as far as the XB indicator was concerned, Method 12 and Method 15 are optimal. For clustering, we hope that the clustering index PC indicator is close to 1, and the CE and XB indicators are close to 0, because this shows a good clustering effect. Looking at the three indicator curves on the graph, we can clearly see that the best approach to satisfy this condition is Method 15 (PE + EEMD + GG), whose corresponding clustering index values are PC = 1, CE = NaN, XB = NaN. This further certifies our conclusion in the foregoing: through EEMD decomposition, and then the GG clustering of permutation entropy, we can separate the fault signal very well.
4. Discussion
Fault diagnosis is a basic problem in reliability analysis. Since a rolling bearing fault has nonlinearity and nonstationary characteristics, it is difficult to identify the fault category. A rolling bearing clustering fault diagnosis method based on ensemble empirical mode decomposition (EEMD), permutation entropy (PE), linear discriminant analysis (LDA), and the Gath–Geva (GG) clustering algorithm is proposed. The data experiments have shown the good fault diagnosis performance of the proposed method.
When diagnosing bearing faults, based on the data results before and after the dimensionality reduction, we can see that the difference in entropy of different fault categories is significantly improved by reducing the dimensions, which can help to distinguish different fault signals. Therefore, dimension reduction is necessary in the process of fault diagnosis. With the exception of dimensionality reduction, three other steps need to be passed when diagnosing bearing faults. For each step, three feasible methods can be selected so that there is a total of 27 combinations. According to the clustering figures above, we can intuitively see that the proposed combination method has better cluster compactness than the other combinations. The distinction between each type of fault is obvious, and there is no aliasing. It indicates that the method has better discrimination, which will help to accurately determine the type of failure in actual applications and improve the accuracy of fault diagnosis.
In order to get a more comprehensive understanding of the fault diagnosis effect of each method combination, we calculate the clustering index of each combination and obtain the results shown in
Figure 10. From the figure, we can clearly see that the clustering index PC is highly volatile. This shows that compared with the CE and XB clustering indicators, the PC indicator is better able to show the advantages and disadvantages of each combination. From
Figure 10, we can clearly see that Method 15 (EEMD + PE + GG) performs the best overall, which proves that our proposed fault diagnosis method is the best among all the possible combinations. At the same time, we can also see that Method 12 (EMD + PE + GG) is also very good. The clustering indexes of Method 12 and Method 15 are very close. Although Method 15 is slightly better, calculating EEMD takes more time than calculating EMD. In actual bearing fault diagnosis, we can select each of them as bearing fault diagnosis according to specific needs.
Based on the data experiments above, we can conclude that our proposed fault diagnosis method has a satisfactory fault diagnosis effect. However, in practical engineering problems, especially in the non-bearing fault signal fault diagnosis, the best method proposed in this article cannot be applied blindly, and the fault diagnosis method should be selected according to the characteristics of the actual engineering itself. For example, if the signal diagnosed is less noisy and the signal is relatively stable, it may be more appropriate to use EMD or EEMD. We should also adopt the fuzzy entropy or sample entropy and then perform FCM clustering. Conversely, if the signal is noisy and extremely unstable, MEEMD may have better results than EMD and EEMD. At the same time, performing GG cluster analysis and calculating permutation entropy may be the proper way to obtain satisfactory fault diagnosis results.
5. Conclusions
In this paper, a fault diagnosis method for rolling bearing based on EEMD, permutation entropy, LDA, and GG clustering is proposed.
(1) The vibration signal of the rolling bearing is decomposed by the EEMD method, and then the permutation entropy value is calculated. LDA is used for dimensionality reduction, because the obtained entropy feature vector has high dimension and data cannot be visualized. Since the data collected in the actual project has unlabeled data characteristics, the GG clustering method in data mining is used for fault identification.
(2) For the same set of data, we perform fault diagnosis digital experiments using 27 kinds of feasible combination methods. Then, we judged the effectiveness of various methods for fault diagnosis by comparing clustering indicators. The experimental results show that the proposed method is superior to the other 26 different combinations.
(3) By comparing the characteristics of the data before and after dimension reduction, we can conclude that LDA dimension reduction can improve the accuracy of fault diagnosis.
Although this article has listed more than 20 combinations, the merits of each method may be different for different engineering practices; thus, they should be analyzed and selected according to the specific situation. In addition, there are other solutions to fault diagnosis. We should compare the method proposed in the article with other fault diagnosis ideas in the future work to find a more efficient and feasible fault diagnosis method. This is a goal that we should adhere to for a long time.
