Article

Influence of Different Freezing Modes on the Base Slab Displacement of an Upper Structure

1
Mine Construction Research Branch, China Coal Research Institute, Beijing 100013, China
2
School of Civil and Mechanical Engineering, Curtin University, Perth, WA 6845, Australia
3
School of Mechanics and Civil Engineering, China University of Mining and Technology-Beijing, Beijing 100083, China
*
Author to whom correspondence should be addressed.
Appl. Sci. 2020, 10(1), 27; https://doi.org/10.3390/app10010027
Submission received: 6 October 2019 / Revised: 7 December 2019 / Accepted: 16 December 2019 / Published: 18 December 2019
(This article belongs to the Section Civil Engineering)

Abstract

:
The high risk of metro tunnels that are underneath buildings in a water-rich layer has received much attention. The base slab of an upper structure deforms due to frost heave and settlement, which needs to be predicted before freezing and excavation. In this paper, simulation experiments with a similarity ratio of 1/25 were performed based on an engineering project where two tunnels underpass a running station through an artificial ground freezing method. The displacement of upper structures was analyzed under simultaneous and sequential freezing modes, with a simple formula proposed to estimate the frost heave in closely underpassing projects. It is shown that, under freezing and excavation stages, the base slab displacement displays a zigzag shape. These results are instructive to the construction of underpassing projects in a water-rich layer.

1. Introduction

With the massive increase of the urban population, underground space has been utilized to tackle relevant problems like traffic congestion. Large-scale metro tunnels have been built in the city, underpassing roads, buildings and underground structures [1,2,3]. Specially, a lot of tunnels are placed in water-rich and soft soil layers, affecting the safety performance of buildings and road operations [4]. Thus, there has been a high-risk level of building damage and road settlement [5,6].
Generally speaking, most of underpassing tunnels were constructed by tunnel boring, artificial ground freezing (AGF), and grouting. Among these methods, tunnel boring is one of the most common methods for tunneling, with a high excavation rate and a circular tunnel profile [7]. However, due to existing of continuous retaining walls and other auxiliary structures along an excavation layer, it is not suitable for a closely underpassing construction, which may damage tunnel boring machines and pose an uncertain accident. Grouting is a construction process by means of a highly erratic permeability and a homogenized deformability of soil [8], aiming to seal and stabilize strata. Whereas a grouting method can only reduce the natural permeability of soil, and solidification after grouting may not be homogeneous enough to be against groundwater [9], resulting in tunneling water inrush and mud gushing.
In contrast, AGF is a safe technique that converts soil pore water to ice, creating a strong, impervious frozen soil wall which is used as temporary excavation support and groundwater control. AGF has the advantages of excellent impermeability, high strength, no pollution, and recyclability. Meanwhile, it can reduce the disturbance to soil in comparison with other consolidation methods. Thus, AGF has been widely used in underground engineering projects, for example, the tunnel construction [10,11], cross-passage construction [12], recovering collapsed tunnels [13] and other projects [14].
AGF is also an attractive solution in the case of where a tunnel is built at a limited distance below or close to existing buildings [15,16]. However, migration and freezing of water in soil cause expansion of the soil volume in a construction process [17,18]. As a result, the strata deformation and ground heave may threaten the safety of upper structures.
In recent years, there have been more underpassing projects with a shorter vertical underpass distance, which put forward a tremendous challenge on the freezing design and construction. It is tough and difficult to ensure both the serviceability of existing structures and the safety of new tunnels [19]. A significant amount of research has been conducted on the ground surface movements induced by AGF [20,21,22,23,24,25]. Several empirical formulas of ground surface deformation were presented. However, it is worth noting that, to the best of our knowledge, there are few studies that focus on the deformation of an upper building during a tunnel underpassing project.
For example, in a twin-tunnel underpassing metro station by AGF with zero distance up to a base slab, the upper base slab is easily damaged under the effect of frost heave. That is, it is necessary to strengthen upper structures [26], and some measures for reducing frost heave have been applied. A length of 60 m twin-tunnel was built in Germany, located 5 m below the foundation of a building. The measured maximum heave and settlement were 20 and 10 mm, respectively. In Vienna, two tunnels under-passed the foundation of a building with a 1.6 m cover at the minimum in a water-rich layer and a frost heave of 13 mm was measured. With the development of frozen soil excavated, the frost heave reduced to 3.0–8.5 mm. A metro station platform enlarged by AGF, located in the center of the city, is 10 m beneath a building, and the heave and settlement were measured with a total deformation of 12 mm [27].
Although these studies are instructive for the construction of underpassing projects, there are still some significant differences. First, they paid more attention to the construction process of an engineering project, but rarely focused on the base slab deformation of upper structures. Moreover, there is little of analysis on reducing base slab heave caused by different freezing modes.
The construction of an underpassing project by AGF is a complicated process with a high risk. The safety of upper structures must be guaranteed. Otherwise, tremendous casualties and huge economic losses are caused. To limit the movement of upper structures and remain construction safety, some advanced research on frost heave has been carried out based on a prototype project. Here, a similarity simulation method is an effective means to investigate complex problems in engineering projects [28,29,30,31,32,33]. The freezing similarity simulation experiments have also been adopted for predicting frost heave and settlement in the AGF engineering cases. These studies mainly involve three areas, namely, the ground deformation behavior under heave and settlement [34,35,36], the formation of a frozen wall under high seepage-flow [37,38,39,40], and the ground deformation under freezing effect of a freeze-sealing pipe roof method [41,42,43]. The results have largely enriched the multi-field coupling similarity theory in freezing simulations and presented many useful methods and skills, indicating that the similar simulation method is an important means for solving high-risk freezing problems in extreme engineering environments [44,45,46,47]. However, there is still lack of a good understanding on the frost heave of an upper-structure and the deformation of a base slab under different freezing modes. Thus, to prevent engineering accidents, it is pivotal for us to systematically investigate frost heaving of an upper structure in a construction process.
This paper is organized as follows. First, as a case-study, a brief overview is given on a closely underpassing freezing engineering project. Next, based on the project, a similar simulation experiment is made, and then, the measured parameters and observed phenomenon are discussed in more detail. Finally, several main conclusions are summarized.

2. Similarity Simulation Experiment

2.1. Engineering Background

As illustrated in Figure 1, a twin-tunnel with a diameter of 7.7 m and a length of 42 m underpasses an existing metro station. It is situated in an intensely urbanized area at the center of Shanghai, China. AGF was chosen as the construction method of the twin-tunnel to consolidate soil and mining excavation. The twin-tunnel is located about 22.8 m beneath the ground and 1.4 m directly under a base slab of the station (see Figure 1).
Before construction of the twin-tunnel, an initial in-situ investigation was accomplished, with soil parameters as listed in Table 1. In this project, refrigerant was chilled brine, and temperature was −28 °C [31]. According to the indoor experimental results, the thickness of a frozen wall was set to be 2 m. A total of 76 horizontal freezing pipes were drilled with a diameter of 108 mm, which were arranged in a circle with a radius of 4.9 m.
Here it is worth noting that, a massive amount of soil was frozen during the construction process. The frozen soil was directly contacted with a base slab of the station, frost heave may easily cause lifting of the base slab and damaging of the station. Thus, a systematic study on construction schemes is conducive to the implementation of construction.

2.2. Modeling Test

As is well known, a correct physical model must satisfy a series of similarity laws that consist of temperature, humidity, stress and displacement. By using the AGF method, the physical process of a tunnel underpassing upper structures can be divided into the following three stages.
(i) Chilled brine extracts heat from soil, and then, pore water is frozen to ice. The similarity principle of a temperature field [48,49] can be represented as:
F ( Q c T , a t r 0 2 , T y T 0 , T c T 0 , r f r 0 ) = 0
where Q is the latent heat of soil, c is the specific heat of soil, T is temperature. a is the thermal diffusivity of soil, t is time, r0 is a radial coordinate, rf is the outer radius of a freezing pipe, T0 is the initial temperature, Ty is the freezing point of soil, and Tc is the surface temperature of a freezing pipe [50].
The testing soil was collected from the site. Then, the compactness and water content of soil were adjusted to be consistent with the undisturbed soil. The experimental temperature was also chosen as the in-situ one. Therefore, other parameters such as the internal friction angle, Poisson’s ratio, and void ratio can be considered the same as the in-situ soil.
The similarity principle of a humidity field can be written as:
Θ = w w 0
where w is the initial water content of soil and w0 is the unfrozen water content of frozen soil. Because the process of water migration is similar to thermal conduction [49], the similarity ratio of a humidity field is approximately equal to that of a temperature field.
(ii) Freezing and excavation cause the deformation of soil. Here, the stress-displacement field can be expressed in a dimensionless form [49,51], that is:
F ( σ E , P E , P r H , d u , ν ) = 0
where σ is stress, E is the elastic modulus, P is load, r is the bulk density, H is the tunnel depth, d is the thickness of frozen soil, u is displacement, and ν is Poisson’s ratio of soil.
(iii) The upper structure is deformed by frost heave or settlement. In terms of the linear elastic mechanics, deflection is inversely proportional to stiffness, and we have:
us ∝ 1/K,
where us is the displacement of a base slab causing by the frost force and K = EI is the stiffness of upper structures, with I the static moment of a base slab.
Based on these similarity laws, the similarity ratios of relevant parameters can be represented as:
CT = Cs = 1,
Ct = n2,
CL = Cρ = Cd = n.
where n is a constant, CT, Cs, Ct, CL, Cρ and Cd are the similarity ratios of temperature, stress, time, length, density and displacement, respectively.
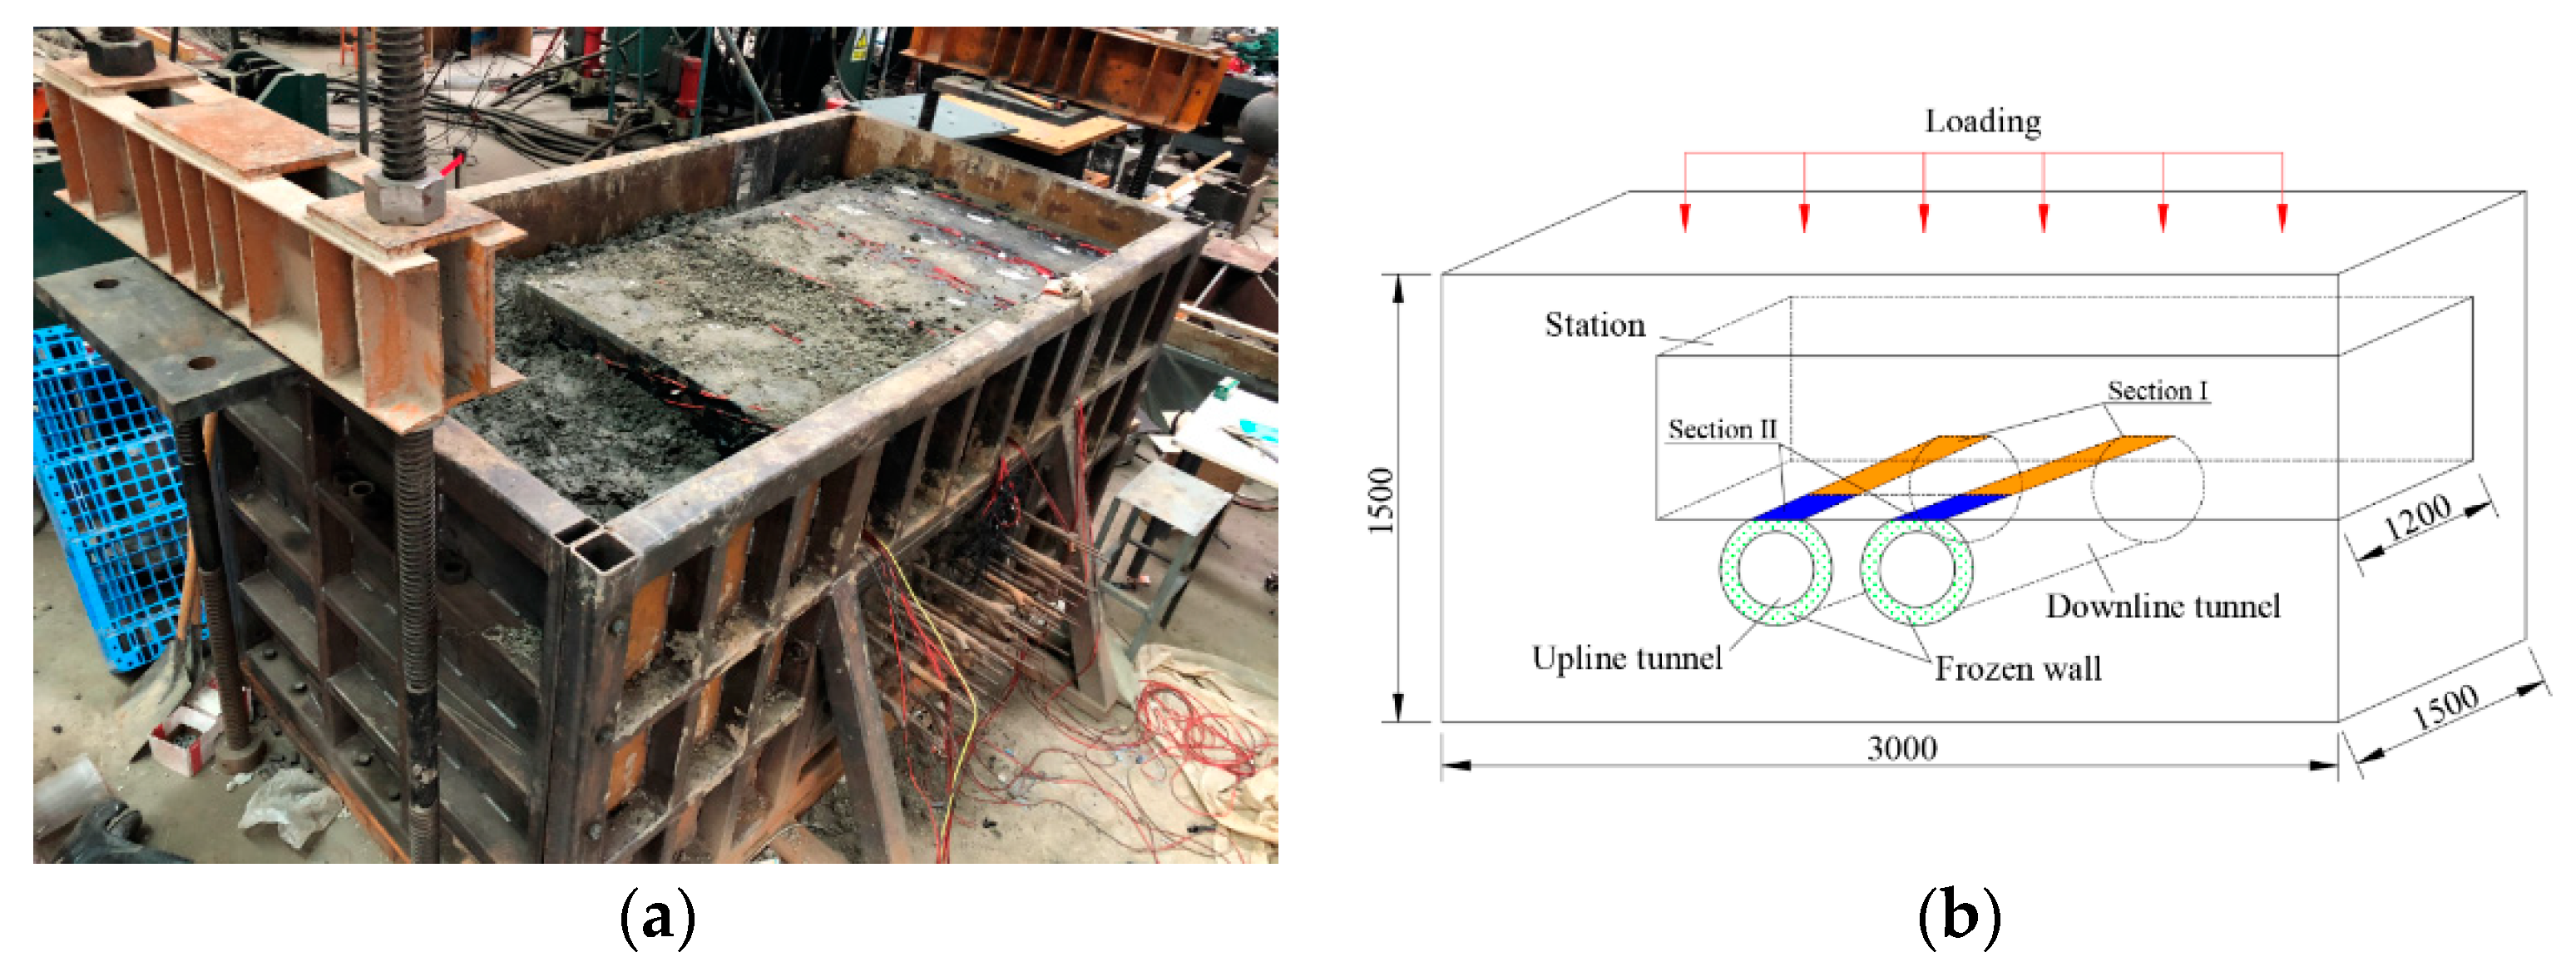
Taking the boundaries of the station and frozen walls, the size of a laboratory and the operability of a model into account, the geometric similarity ratio CL was set to be n = 1/25. Then, a steel chamber was established with a length of 3 m, a height of 1.5 m, and a width of 1.5 m on a three-dimensional platform, as shown in Figure 2a.
To do testing, a soil layer was packed in the steel chamber. The soil samples with a filled layer of 100 mm were collected by a standard circular knife. The density, compactness and water content of remolded soil were consistent with the site soil, which were controlled by a steel plate under an overburden pressure.
According to the similarity law, the density of soil should be 25 times of that in the field. It can be simulated by a centrifugal method [52,53]. However, the model dimension is usually strictly restricted by the centrifuge power and laboratory size. It is not suitable for a large-scale model. Therefore, a uniform load was applied to soil in order to meet the similarity ratio of density [49,51]. In addition, in consideration of the overlying weight, a required loading force was determined to be 800 kN, as shown in Figure 2b. Two 50 t hydraulic cylinders were installed on the counterforce frame, with the load being evenly distributed across soil through the two 1500 × 1500 × 200 mm3 steel plates.
The station plays a crucial role in experiments, and it should be pre-formed during the construction of a physical model. Based on the similarity ratio, the station model was made of concrete and steel bars, with a size of 2280 × 1200 × 560 mm3. In the in-situ project, the thickness of a base slab was 1 m, and it can be deduced that the corresponding thickness of concrete was 40 mm. However, it is difficult to lay small steel bars and to pour concrete in the model.
To prevent the concrete station model from being crushed under a uniform load, the experimental material of the station model was changed from the C35 concrete to steel according to the stiffness equal principle. The base slab thickness was also adjusted to ensure the equal stiffness. The elastic moduli of concrete and steel are 31.5 and 210 GPa, respectively. The static moment of a rectangle section can be written as:
Ih3,
where h is the thickness of base slab. The calculated thickness of steel was 21 mm. The modeling station was placed in a chamber, and thus boundary friction effect could be reduced by smeared wax on the inside plate of the chamber. Here, it is worth noting that the thermal expansion coefficient of steel is similar to that of concrete. Based on the elasticity theory, the stress field is independent of Poisson’s ratio of the material under stress boundary conditions with a constant body force. Thus, for a given load, the in-situ deformation field can be approximately simulated.
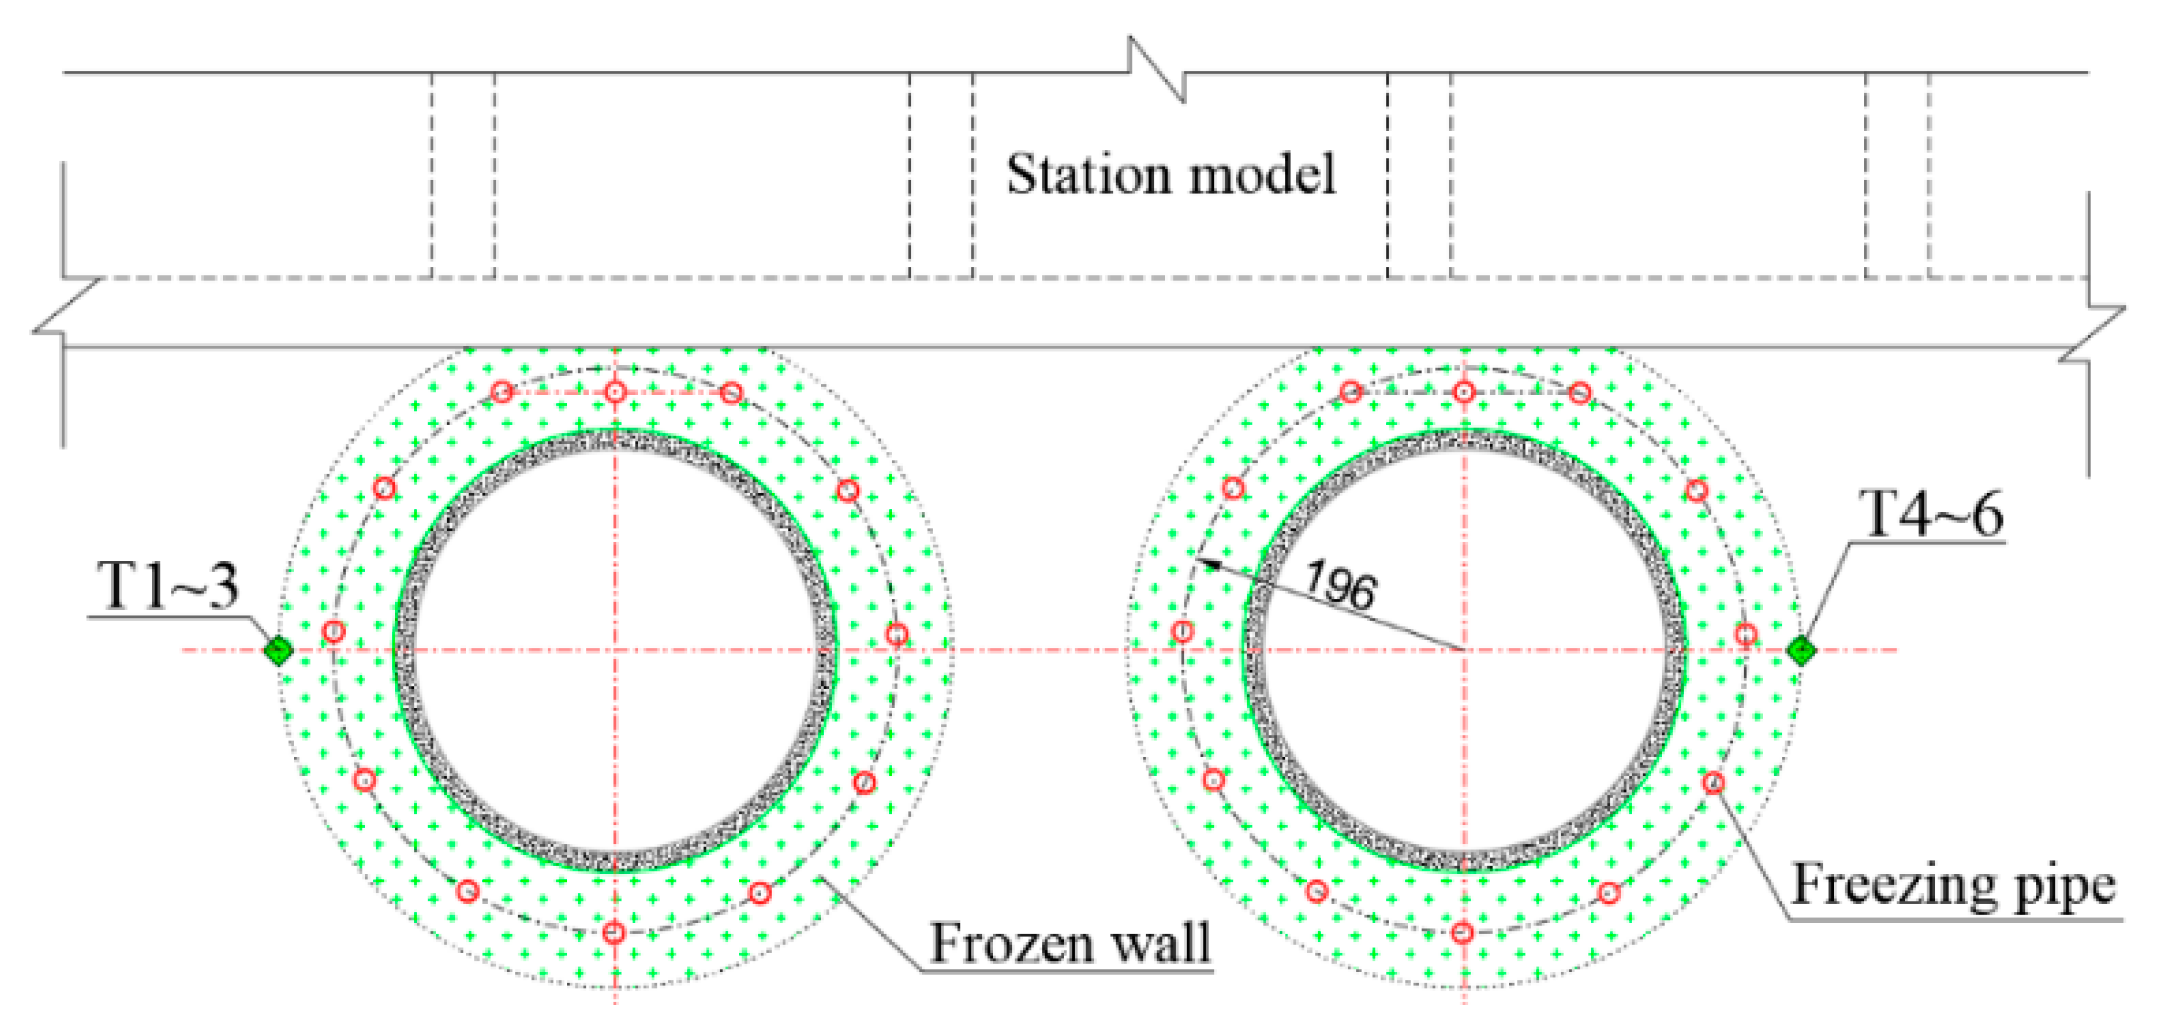
The frozen wall was formed by freezing pipes, which circulated chilled brine inside. For convenience, it is necessary to simplify the arrangement of freezing pipes in modeling experiments. Based on the principle of an equivalent heat dissipation capacity of freezing pipes, 12 freezing pipes with a diameter of 18 mm were placed around each tunnel, as illustrated in Figure 3. The laying radius of freezing pipes in experiment was 196 mm. Here, chilled brine was produced by a refrigeration system, which can meet testing requirements.
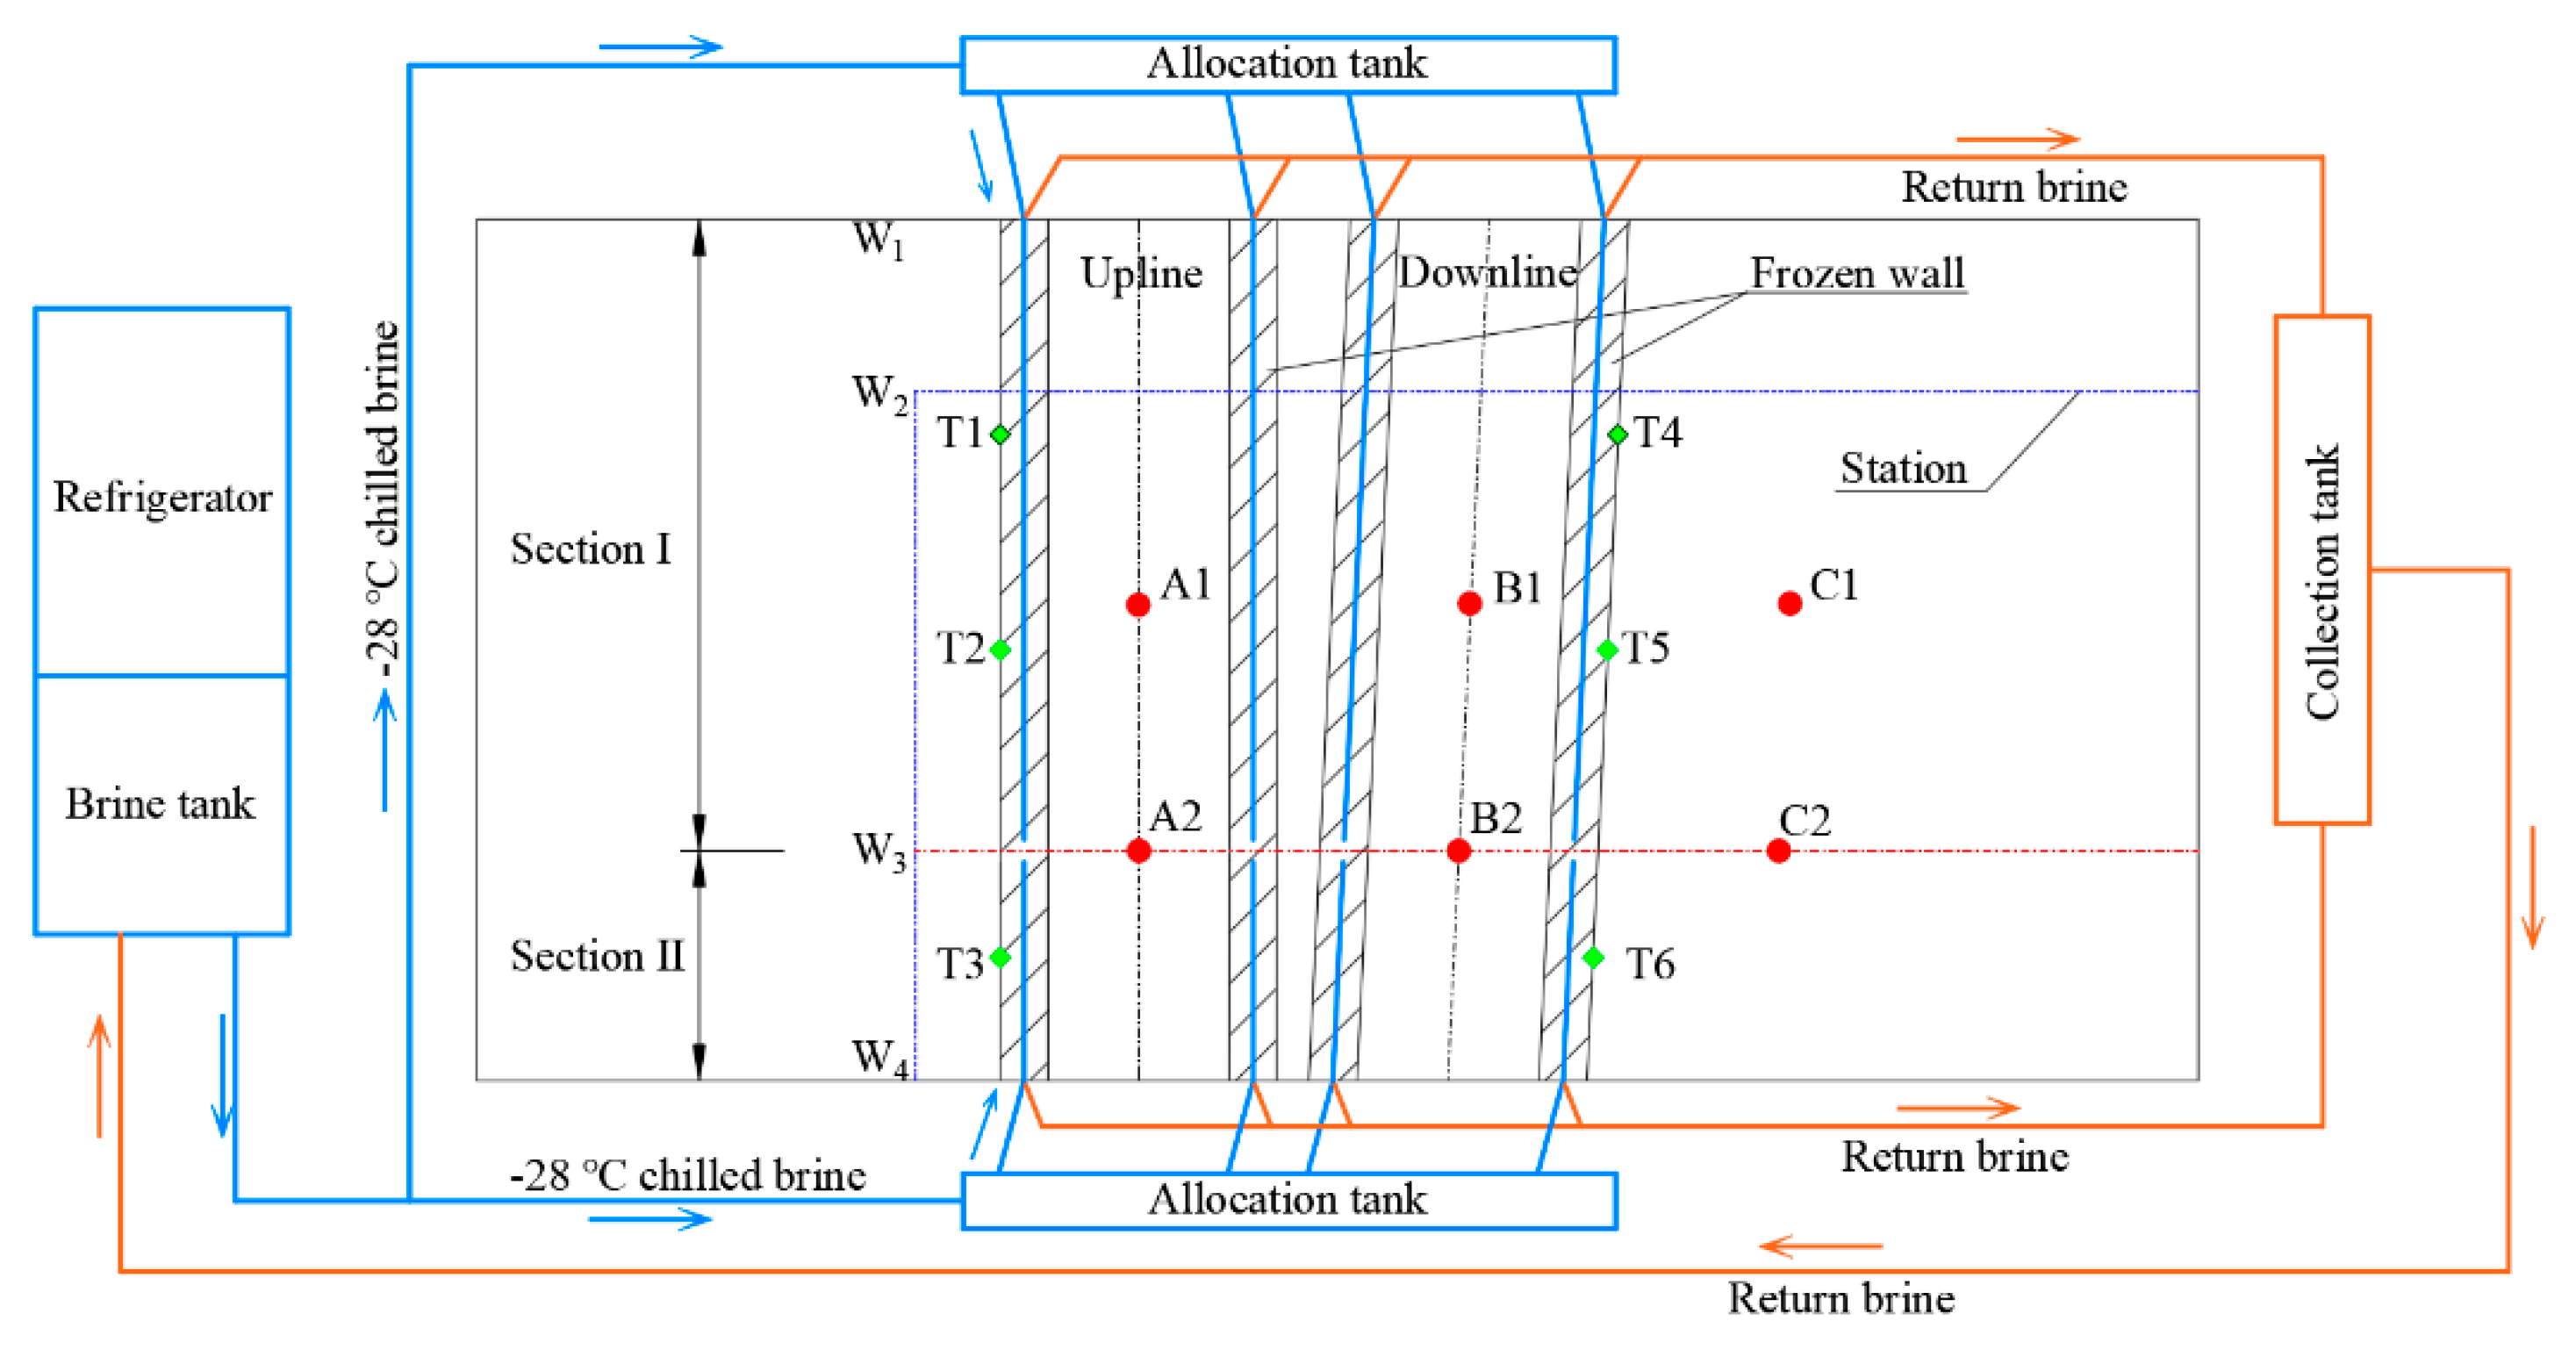
The tunnels passed through the starting point (W1 in experiments) of excavation, the east side of a continuous retaining wall (W2), the west side of a continuous retaining wall (W3), and the end point (W4) of excavation. Based on actual conditions of the project, the construction area can be divided into two sections (i.e., I and II). Here, Section I involves the area from W1 to W3, and Section II is from W3 to W4, as illustrated in Figure 2b and Figure 4.

2.3. Construction Scheme

In a construction process by using AGF, the whole experimental stage was separated into three phases. The first phase is referred to as active freezing, which extracted heat from ground and a frozen wall was created with thickness and temperature set forth in the project. Frost heaving mainly occurs in this phase. The second phase is maintenance freezing, which adjusted brine flow to prevent further development of the frozen volume and avoid deterioration of strength during excavation. The third phase is related to tunnel excavation.
To reduce the frost heave of ground, some measures have been proposed in a number of studies, e.g., by using different freezing modes, controlling the freezing time, and lay-outing pressure release holes [54,55]. After weighing the feasibility against complexity of actual construction, two schemes were proposed with two different freezing modes. One is the simultaneous freezing mode, where freezing pipes were drilled from W1 to W4. The upline and downline were frozen by chilled brine simultaneously. The other is the sequential freezing mode, in which Sections I and II of the upline and downline were frozen at different times, respectively.
To optimize the procedure between freezing and excavation processes, the interval time between two construction sections was set to be 30 days in the project (i.e., 70 min in experiments). The upline Sections I and II started freezing at 0 and 30 days, respectively, and the downline Sections I and II started freezing at 60 and 90 days, as shown in Figure 2b and Figure 4. Excavation of each section was performed 45 days after the start of freezing to ensure a 2 m thickness of frozen soil. Based upon the time similarity ratios, these time points were converted and then applied in experiments.
Six displacement sensors, located on the base slab, were used to measure heave and settlement of the station. Six temperature sensors were also embedded on the horizontal plane of the tunnel centerline with 80 mm (i.e., 2 m in the project) away from the outer excavation diameter. Data were collected by an automatic data collector, and the measurement interval was set to be 30 seconds.
In terms of the two different schemes, three groups of experiments were carried out under an overlying force of 800 kN. The first group adopted a simultaneous freezing mode, where Sections I and II were simultaneously frozen in 104 min (i.e., 45 days in the project), and then the frost heave of base slab was measured.
The freezing mode of the second group was sequential, which can be divided into four sections according to construction scheme of the engineering project. These four sections were frozen in sequence. When an active freezing process of each section was completed, the freezing mode was transferred to maintenance freezing without excavation. The experiment time was 312 min, which is equivalent to 135 days in the project.
The freezing sequence of the third group is the same as the second one, but an excavation process was added. When an active freezing process was completed, excavation of the tunnel sections was conducted with a maintenance freezing mode. The simulation of excavation was done by a core drilling machine. Compared with the second group, the time increased by 15 days due to excavation of downline Section II. The testing time was 347 min, which is equivalent to 150 days in the project.
To simulate the two freezing modes in experiments, two holes on each side of the soil chamber were reserved in advance. Two allocation tanks were used to provide the chilled brine for freezing pipes of each side, as illustrated in Figure 4. Then, brine was collected by a collection tank and returned to a refrigerator. Switches were installed on the freezing pipes in each section. Thus, based on the different freezing mode, the four sections of tunnels could be frozen simultaneously or sequentially.

3. Testing Results and Discussion

According to the results obtained from three group experiments, an average temperature was chosen in order to remove the influence of accidental factors. After active freezing of 104 min (i.e., 45 days in the project), average temperatures of the first, second and third groups on the outer fringe of a frozen wall were −4.60 °C, −4.48 °C and −4.42 °C, respectively. This implies that the thickness of a frozen wall formed by a sequential freezing mode is similar to that by a simultaneous freezing mode, and the designed thickness of frozen soil can be achieved. In the three groups of experiments, deformation of the base slab was measured by six displacement sensors.

3.1. Displacement in Simultaneous Freezing Test

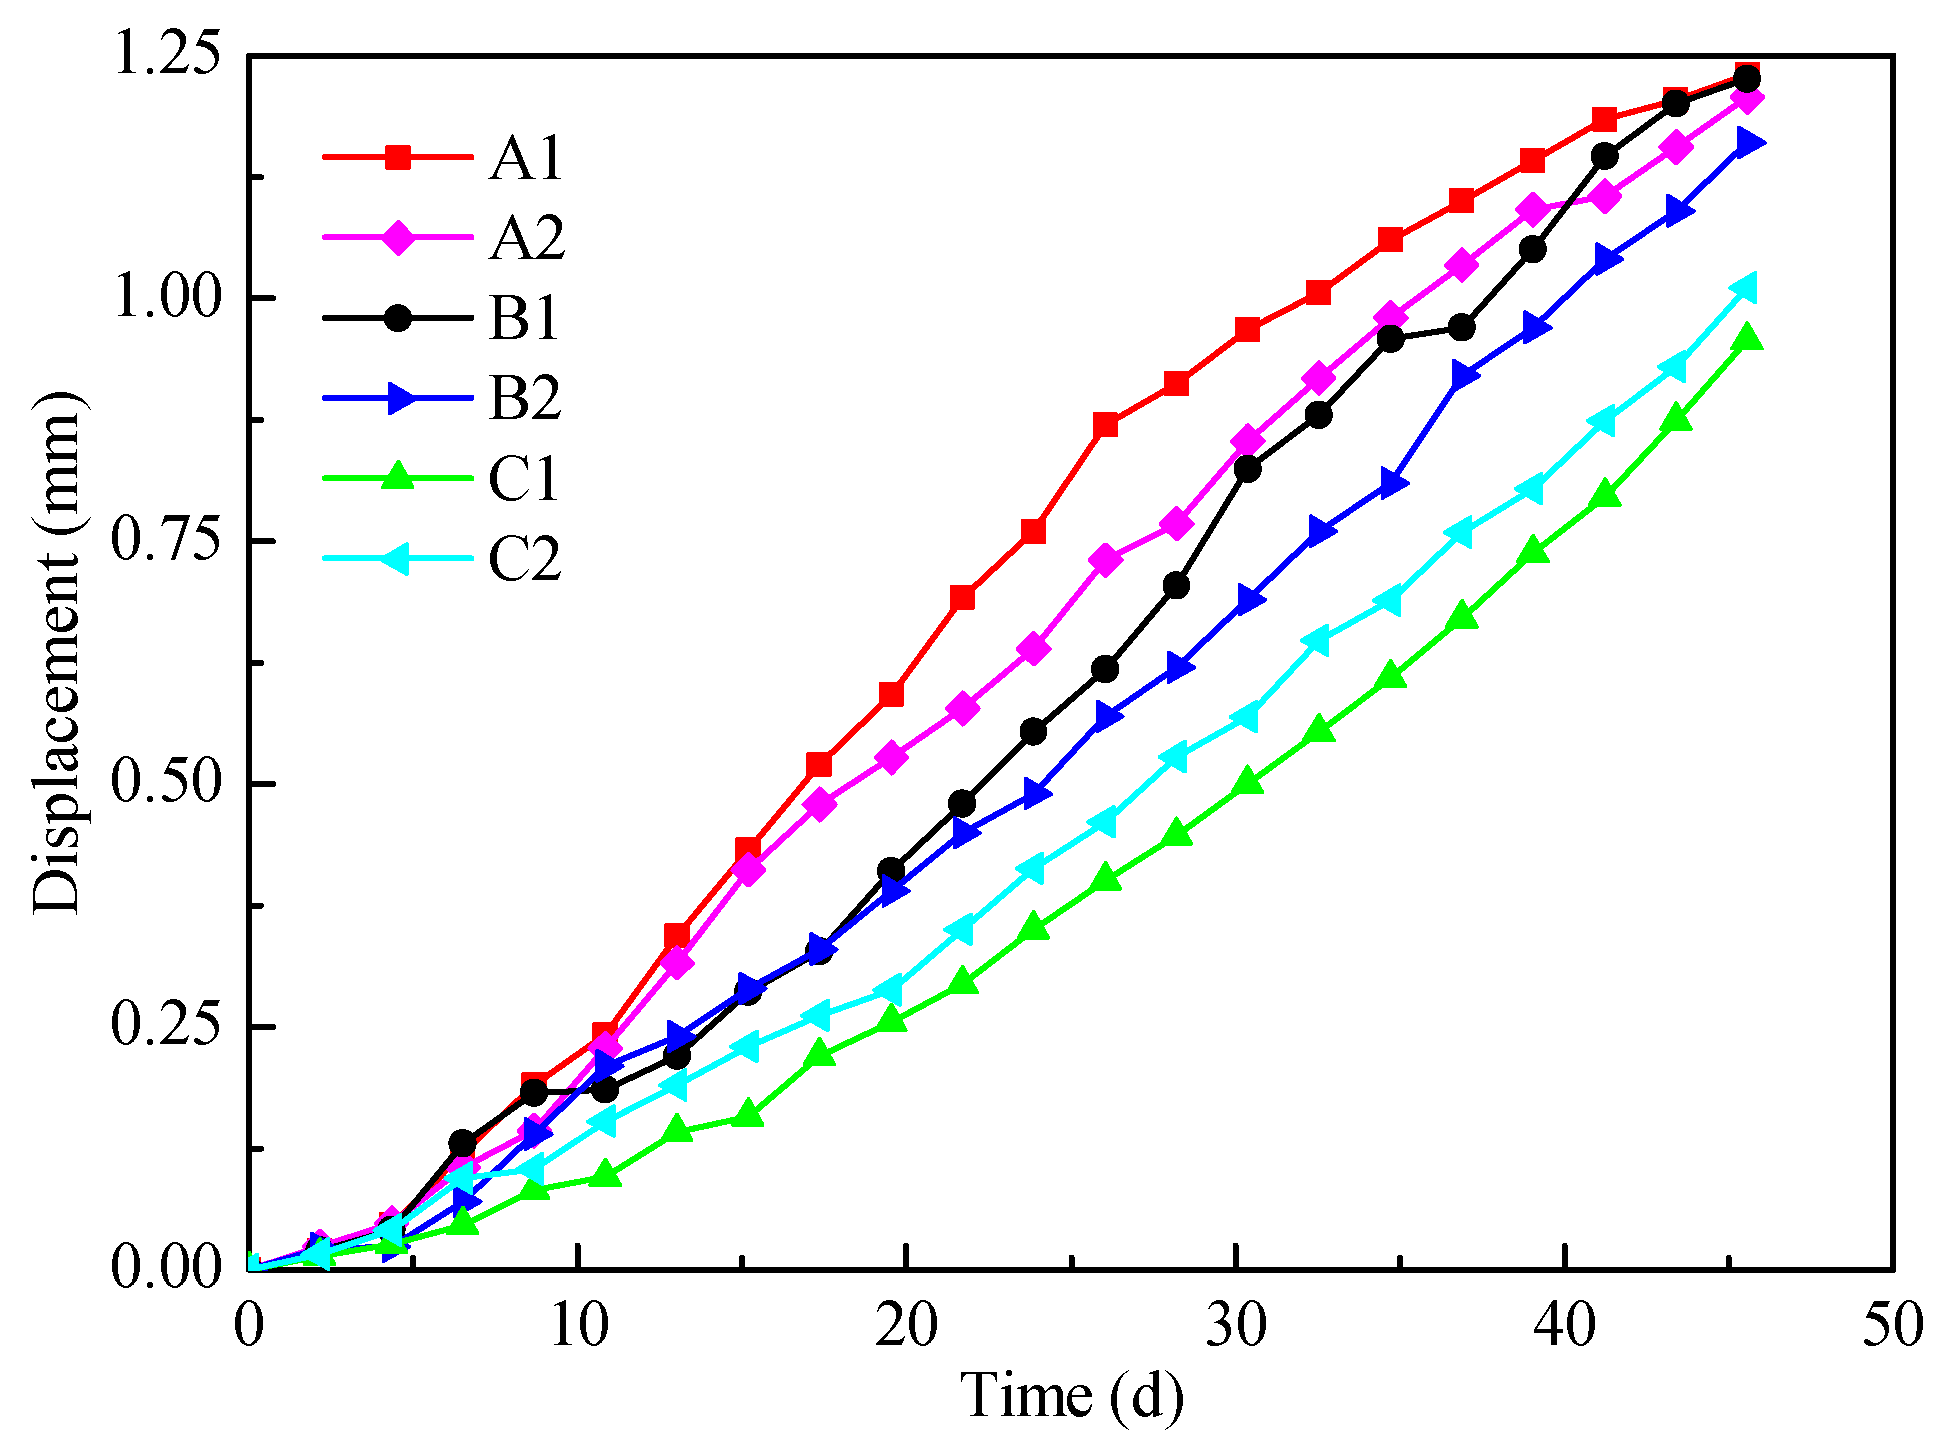
As shown in Figure 5, base slab above a frozen wall was lifted. After the process of simultaneous freezing was completed, the maximum displacement of base slab was about 1.2 mm in experiments, which is equivalent to 30 mm in the project. The deformation of base slab is larger than the permissible movement (10 mm). The lifting trends of six displacement sensors are similar. At the beginning of freezing, frost heave rises slightly, and with the freezing time increases, each frozen soil column formed by a single freezing pipe starts to connect into a frozen soil ring, causing the rapid increase of frost heave.
To approximately estimate frost heave during a freezing process, a simple method is proposed below, which can be used to calculate the lift displacement caused by a frozen wall. In the engineering project, the frozen wall is usually assumed as being uniformly expanded [56], and thus the expanded value can be determined by a frost heave ratio.
The frost heave ratio εf provides a susceptibility index for laboratory experiments on frost heave, which is defined as:
ε f = Δ h h × 100 %
where Δh is the frost heave and h is the sample height at a certain time.
Then, the frost heave of frozen soil can be calculated by:
Δl =hf · εf,
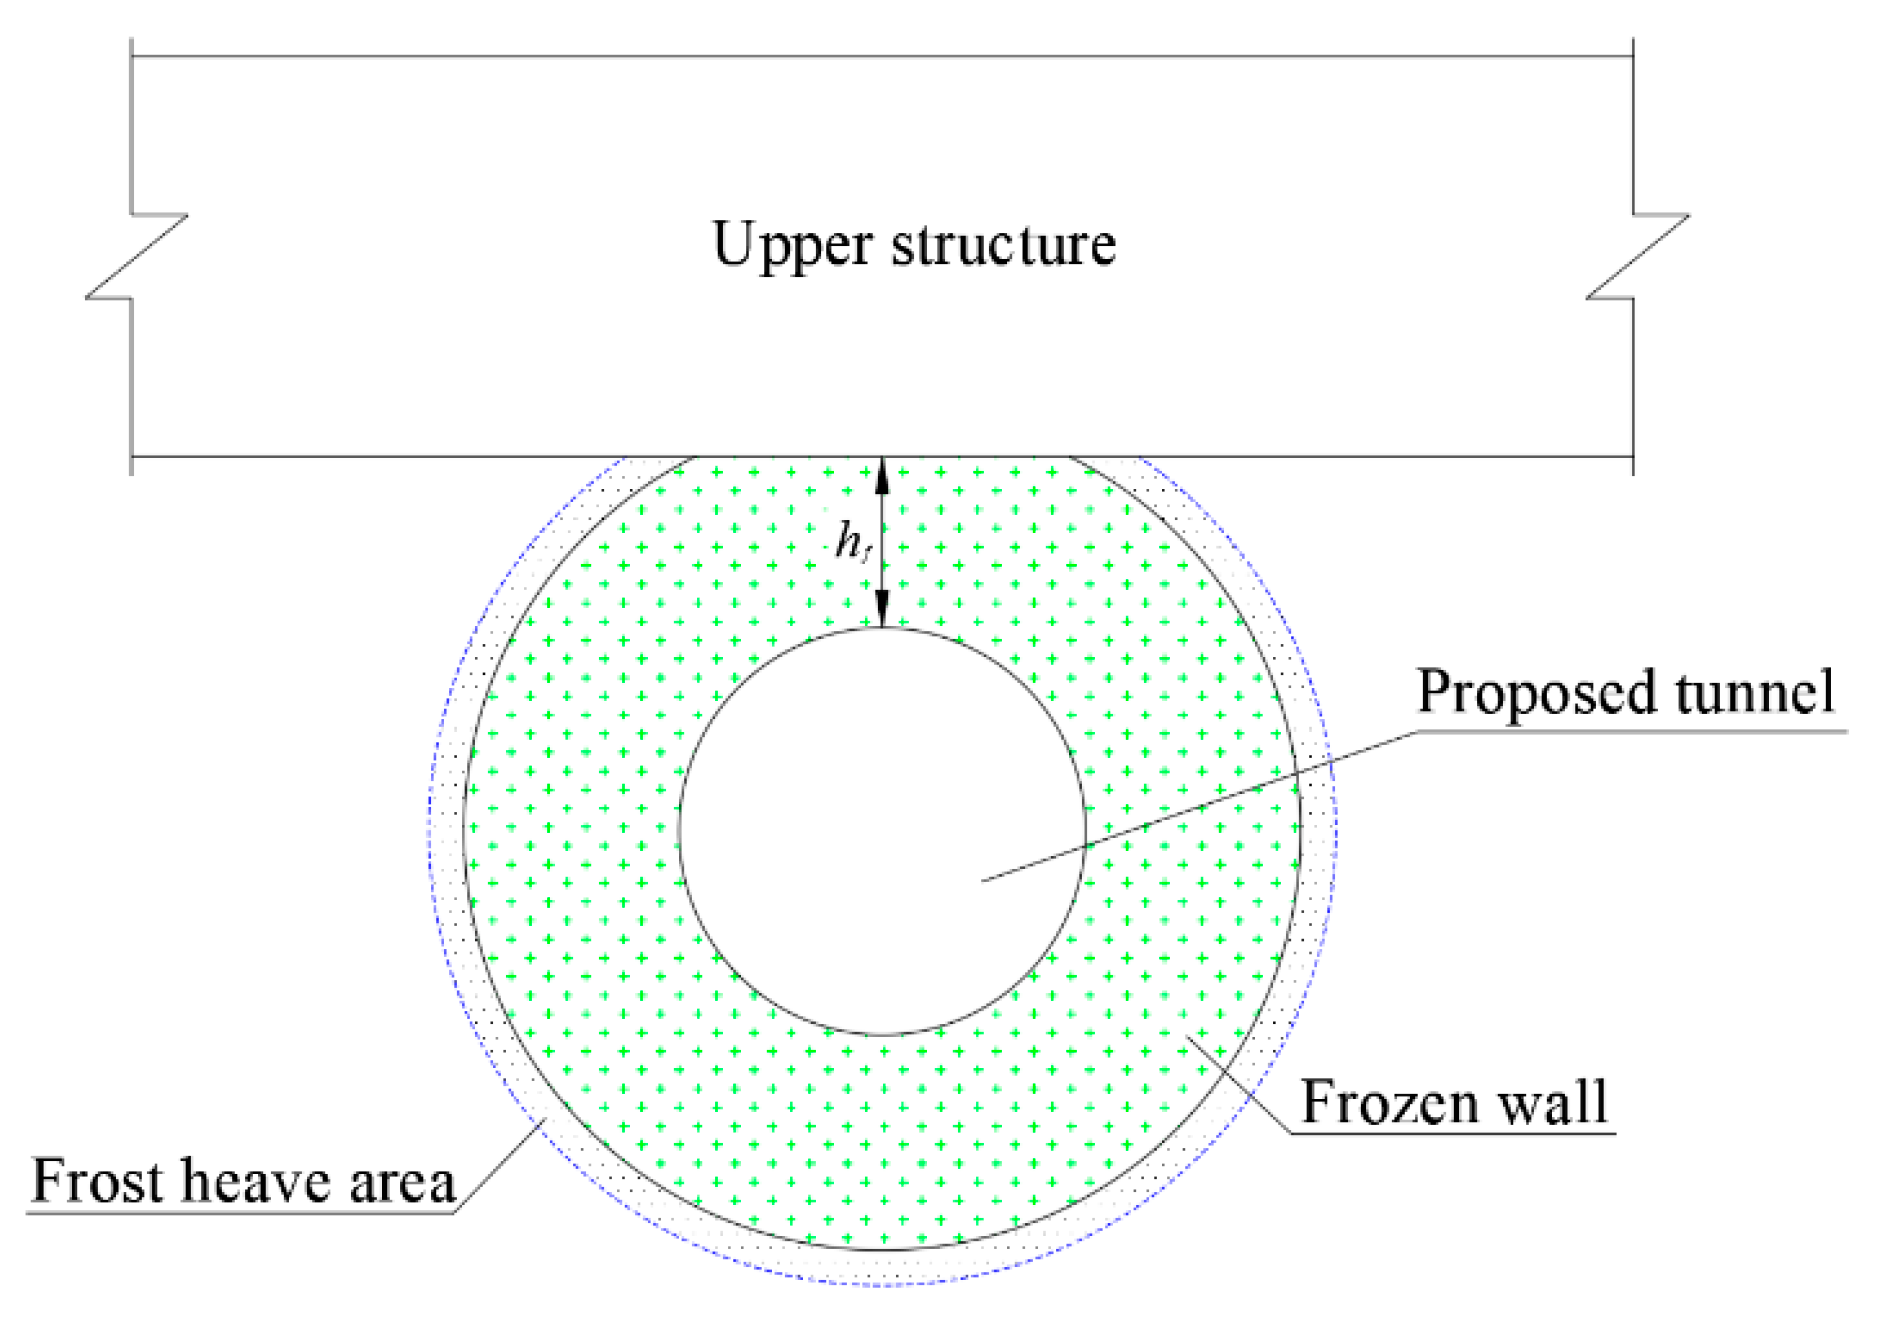
where Δl is the expanded value of a frozen wall and hf is the distance from the top of a tunnel to the base slab of upper structures, as illustrated in Figure 6.
When subjecting to the same load as that in the project, the frost heave ratio of a sample was 2.67%. Based on Equation (8), the expanded value of frozen soil was 37.4 mm, which is similar to the in-situ result.
In such an underpassing project, a frozen wall is in direct contact with the base slab of an upper structure. Considering the compressibility of frozen soil, the expanded value of the frozen wall is the maximum deformation value of base slab. Thus, Equation (8) can be applied to determine the maximum lift displacement of upper structures in an engineering project.

3.2. Displacement in Sequential Freezing Test

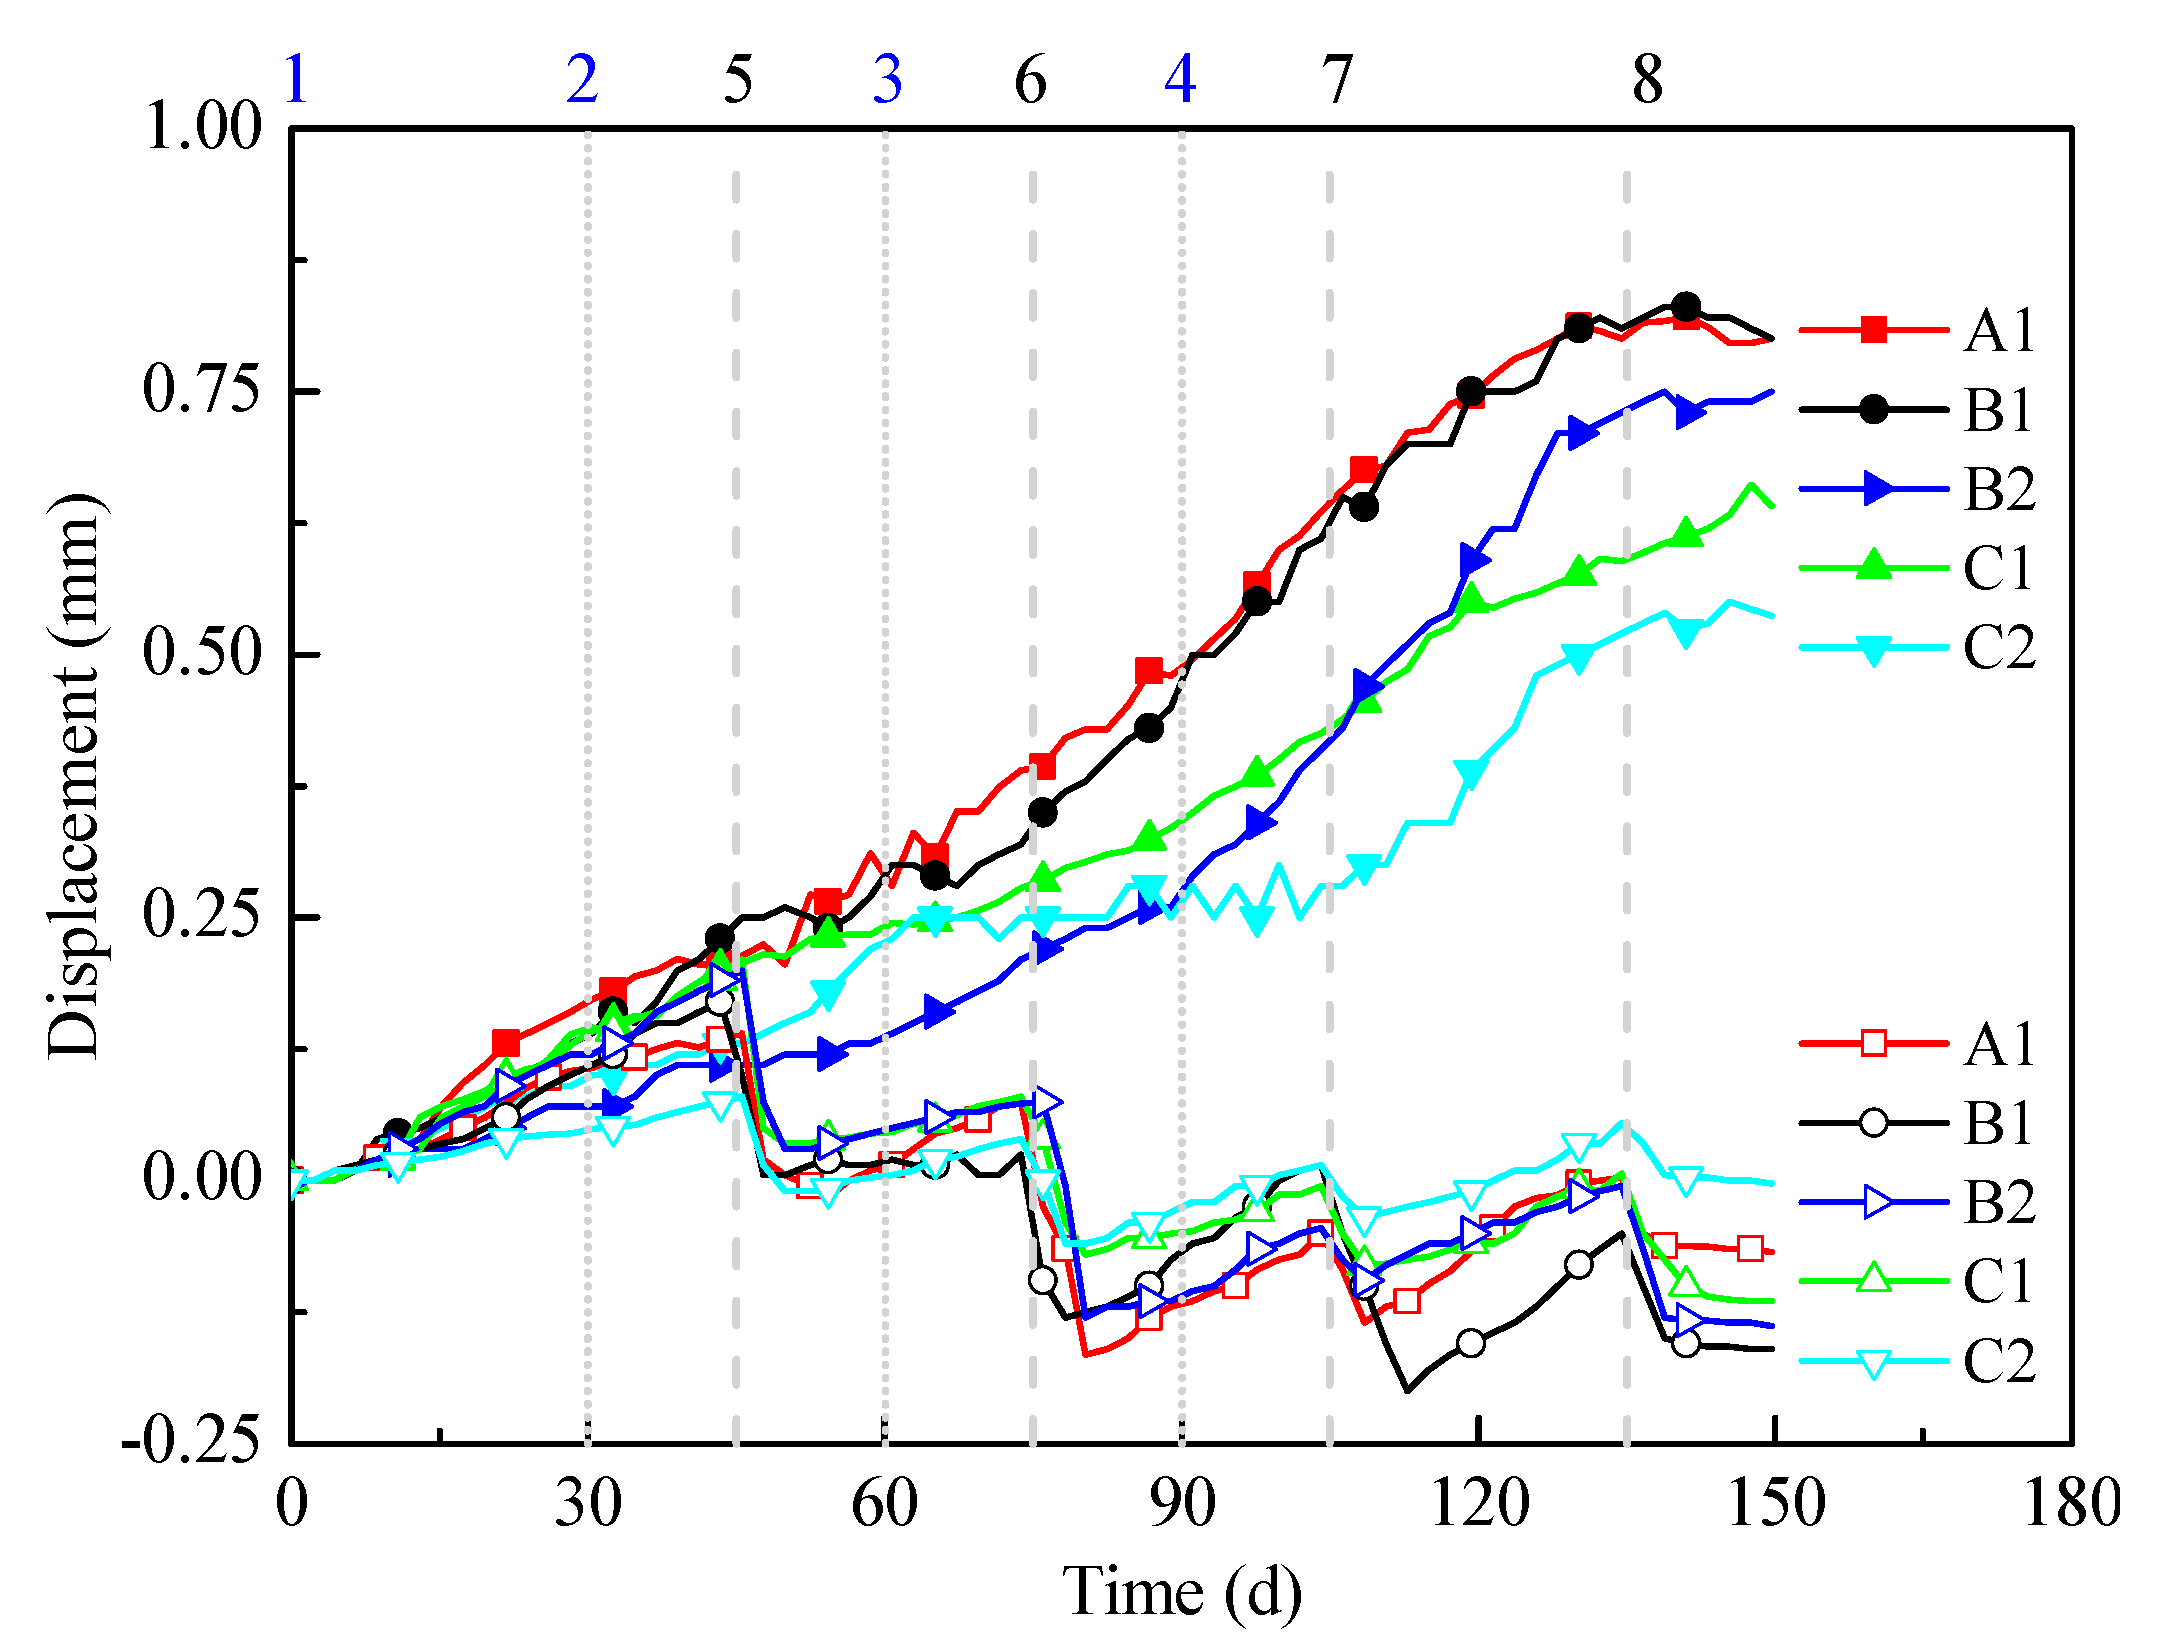
As shown in Figure 7, when the downline was not frozen, the station base slab on it was lifted. Correspondingly, when the downline was frozen, base slab above the upline, which was in a maintenance freezing phase, was also lifted. The maximum lifting displacement in experiments was 0.82 mm that is smaller than the frost heave in a simultaneous freezing mode.
According to the average temperature of three groups of experiments, the cooling volume generated by a simultaneous freezing mode was larger than that generated by a sequential freezing mode. That is, a larger cooling volume implies that more water was migrated from an area with normal temperature to a cooling area, causing a larger frost heave.
The engineering lifting displacement after conversion by a similarity ratio was 20.5 mm, and the average uplift velocity was 0.12 mm/day. Here it is worth noting that these results provide a reference for estimation of frost heave in a freezing process.
With a simultaneous freezing mode, the active freezing time was 45 days in the project, and with a sequential freezing mode, the sum time of active freezing was 135 days. Compared with the simultaneous freezing mode, it is shown that, although a construction period is extended with the increase of cost, the latter can effectively reduce the lift displacement of upper buildings and ensure their safety.
It is also observed from Figure 7 that there is an apparent settlement of base slab due to excavation. However, the settlement was lifted several times. The reason for such a phenomenon can be explained as follows. When excavation of a section causes a settlement of base slab, other sections are still in a process of active freezing. Thus, settlement after excavation slows down and lifts up again. The settlement and uplift of base slab alternately occur with a zigzag shape. It implies that sequential excavation can reduce the frost heave during a construction process.
In a sequential excavation process, frozen soil was excavated by a high-power drill, and then a circle steel plate with a thickness of 7 mm was inserted to simulate a steel tunnel segment. The average settlements of four sections in the twin-tunnel were 0.18, 0.23, 0.17 and 0.15 mm, respectively, which are equivalent to 4.5, 5.75, 4.25 and 3.75 mm in project.
The settlement tended to be stable after about eight days of excavation in the project. Based on the average sinking value, there was the largest settlement when Section II of the upline was excavated. It is due to that after soil in the upper tunnel was completely excavated, overburden pressure was entirely supported by the frozen wall and tunnel segment, resulting in a large settlement. Here is worth noting that most of the settlements of base slab were induced by excavation of the upline. Therefore, settlement after excavation of the downline was less than that after excavation of the upline.

4. Conclusions

In this paper, a similarity modeling system has been established, which was utilized to simulate the construction process of a twin-tunnel underpassing a metro station. The different deformation behaviors were observed under the two freezing modes. The main conclusions can be summarized as follows.
(1)
The experimental results show that, by the AFG method, both the maximum frost heave and the frost heaving increase velocity in a sequential freezing mode are less than that in a simultaneous freezing mode. The former can prevent and limit damage of frost heaving on sensitive and high-risk buildings.
(2)
The similarity simulation tests indicate that, by using the construction scheme of sequential freezing and excavation, deformation of base slab displays a zigzag shape under the dual action of frost heaving and excavation settlement. It implied that the sequential excavation of a tunnel can largely reduce frost heave.
(3)
Given that the frozen wall is uniformly spread in a closely underpassing projects, the maximum displacement of an upper-structure can be approximately estimated by the frost heave ratio of a soil sample.

Author Contributions

Conceptualization, F.L. and L.W.; methodology, C.L. and L.W.; formal analysis, Y.W.; resources, Z.L.; data curation, Y.W.; writing—original draft preparation, L.W.; writing—review and editing, L.W. and C.L.; visualization, C.L.; supervision, C.L. and Z.L.; funding acquisition, F.L. All authors have read and agreed to the published version of the manuscript.

Funding

This research was supported by the National Key R&D Program of China (grant numbers 2016YFC0600904 and 2016YFC0600801), the China Scholarship Council (grant number 201808110255), and the Research Fund Project for Technology Innovation and Venture of China Coal Technology & Engineering Group (grant numbers 2018QN023 and 2018MS024).

Acknowledgments

The authors would like to thank Qinshuai Sun and Yiyi Hao for collection of soil samples, and Hao Cui, Shurong Xu, Wei, Gao, Liangwen Fang, Hang Ding, Tianyuan Liu and Jiwei Zhang for preparation of simulation experiments.

Conflicts of Interest

The authors declare no conflicts of interest.

References

  1. Inose, K.; Kamegaya, I.; Ueda, A.; Imanaka, Y. Construction of the underground ventilation station while shield machines pass 1.5 m underneath. Tunn. Undergr. Sp. Technol. 2006, 21, 335–336. [Google Scholar] [CrossRef]
  2. Ercelebi, S.; Copur, H.; Ocak, I. Surface settlement predictions for Istanbul Metro tunnels excavated by EPB-TBM. Environ. Earth Sci. 2011, 62, 357–365. [Google Scholar] [CrossRef]
  3. Garner, C.D.; Coffman, R.A. Subway tunnel design using a ground surface settlement profile to characterize an acceptable configuration. Tunn. Undergr. Sp. Technol. 2013, 35, 219–226. [Google Scholar] [CrossRef]
  4. Ou, C.Y.; Teng, F.C.; Wang, I.W. Analysis and design of partial ground improvement in deep excavations. Comput. Geotech. 2008, 35, 576–584. [Google Scholar] [CrossRef]
  5. Ding, L.Y.; Yu, H.L.; Li, H.; Zhou, C.; Wu, X.G.; Yu, M.H. Safety risk identification system for metro construction on the basis of construction drawings. Automat. Constr. 2012, 27, 120–137. [Google Scholar] [CrossRef]
  6. Zhou, X.; Shen, S.; Xu, Y.; Zhou, A. Analysis of production safety in the construction industry of China in 2018. Sustainability 2019, 11, 4537. [Google Scholar] [CrossRef] [Green Version]
  7. Farrokh, E.; Rostami, J. Effect of adverse geological condition on TBM operation in Ghomroud tunnel conveyance project. Tunn. Undergr. Sp. Technol. 2009, 24, 436–446. [Google Scholar] [CrossRef]
  8. Nikbakhtan, B.; Osanloo, M. Effect of grout pressure and grout flow on soil physical and mechanical properties in jet grouting operations. Int. J. Rock Mech. Min. 2009, 46, 498–505. [Google Scholar] [CrossRef]
  9. Zhao, Y.; Li, P.; Tian, S. Prevention and treatment technologies of railway tunnel water inrush and mud gushing in China. J. Rock Mech. Geotech. 2013, 5, 468–477. (In Chinese) [Google Scholar] [CrossRef] [Green Version]
  10. Russo, G.; Corbo, A.; Cavuoto, F.; Autuori, S. Artificial ground freezing to excavate a tunnel in sandy soil. Measurements and back analysis. Tunn. Undergr. Sp. Technol. 2015, 50, 226–238. [Google Scholar] [CrossRef]
  11. Hu, J.; Liu, Y.; Li, Y.; Yao, K. Artificial ground freezing in tunnelling through aquifer soil layers: A case study in Nanjing Metro Line 2. KSCE J. Civ. Eng. 2018, 22, 4136–4142. [Google Scholar] [CrossRef]
  12. Yan, Q.; Xu, Y.; Yang, W.; Geng, P. Nonlinear transient analysis of temperature fields in an AGF project used for a cross-passage tunnel in the Suzhou Metro. KSCE J. Civ. Eng. 2018, 22, 1473–1483. [Google Scholar] [CrossRef]
  13. Hu, X.; Wang, J.; Yu, R. Uniaxial compressive and splitting tensile tests of artificially frozen soils in tunnel construction of Hong Kong. J. Shanghai Jiaotong Univ. 2013, 18, 688–692. [Google Scholar] [CrossRef]
  14. Zheng, H.; Kanie, S.; Niu, F.; Akagawa, S.; Li, A. Application of practical one-dimensional frost heave estimation method in two-dimensional situation. Soils Found. 2016, 56, 904–914. [Google Scholar] [CrossRef]
  15. Hu, X.; Deng, S. Ground freezing application of intake installing construction of an underwater tunnel. Procedia Eng. 2016, 165, 633–640. [Google Scholar] [CrossRef]
  16. Zhou, J.; Tang, Y. Practical model of deformation prediction in soft clay after artificial ground freezing under subway low-level cyclic loading. Tunn. Undergr. Sp. Technol. 2018, 76, 30–42. [Google Scholar] [CrossRef]
  17. Taber, S. The mechanics of frost heaving. J. Geol. 1930, 38, 303–317. [Google Scholar] [CrossRef]
  18. Ye, M.; Hufangfu, Y.; Mao, X. Freeze depth predicting of permafrost subgrade based on moisture and thermal coupling model. KSCE J. Civ. Eng. 2015, 19, 1707–1715. [Google Scholar] [CrossRef]
  19. Zheng, W.; Wang, D.; Li, G.; Qin, L.; Luo, K.; Liu, J. Optimizing the grouting design for groundwater inrush control in completely weathered granite tunnel: An experimental and field investigation. Sustainability 2019, 11, 3636. [Google Scholar] [CrossRef] [Green Version]
  20. Addenbrooke, T.; Potts, D. Twin tunnel interaction: Surface and subsurface effects. Int. J. Geomech. 2001, 1, 249–271. [Google Scholar] [CrossRef]
  21. Cooper, M.L.; Chapman, D.N.; Rogers, C.D.; Hansmire, W. Prediction of settlement in existing tunnel caused by the second of twin tunnels. Transp. Res. Rec. 2002, 1814, 103–111. [Google Scholar] [CrossRef]
  22. Chen, R.P.; Zhu, J.; Liu, W.; Tang, X.W. Ground movement induced by parallel EPB tunnels in silty soils. Tunn. Undergr. Sp. Technol. 2011, 26, 163–171. [Google Scholar] [CrossRef]
  23. Cai, H.; Peng, L.; Zheng, T. A duration prediction model of surface frost heave induced by tunnelling with horizontal freezing method. Rock Soil Mech. 2012, 33, 1761–1768. (In Chinese) [Google Scholar] [CrossRef]
  24. Divall, S. Ground Movements Associated with Twin-Tunnel Construction in Clay. Ph.D. Thesis, City University of London, London, UK, 2013. [Google Scholar]
  25. Ocak, I. A new approach for estimating the transverse surface settlement curve for twin tunnels in shallow and soft soils. Environ. Earth Sci. 2014, 72, 2357–2367. [Google Scholar] [CrossRef]
  26. Zhou, X.; Lin, F.; Ren, X.; Yang, G. The freezing stress and displacement field and its control technique during the tunnel construction under the metro line. Chin. Q. Mech. 2005, 26, 438–443. (In Chinese) [Google Scholar] [CrossRef]
  27. Van Dorst, A. Artificial Ground Freezing as a Construction Method for Underground Spaces in Densely Built up Areas. Ph.D. Thesis, Delft University of Technology, Delft, The Netherlands, 2013. [Google Scholar]
  28. Gioda, G.; Locatelli, L.; Gallavresi, F. A numerical and experimental study of the artificial freezing of sand. Can. Geotech. J. 1994, 31, 1–11. [Google Scholar] [CrossRef]
  29. Chen, H.; Yu, H.; Smith, M.J. Physical model tests and numerical simulation for assessing the stability of brick-lined tunnels. Tunn. Undergr. Sp. Technol. 2016, 53, 109–119. [Google Scholar] [CrossRef]
  30. Feng, Q.; Jiang, B.; Zhang, Q.; Wang, G. Reliability research on the 5-cm-thick insulation layer used in the Yuximolegai tunnel based on a physical model test. Cold Reg. Sci. Technol. 2016, 124, 54–66. [Google Scholar] [CrossRef]
  31. Sayles, F.; Baker, T.; Gallavres, F.; Jessberger, H.; Kinosita, S.; Sadovskiy, A.; Sego, D.; Vyalov, S. Classification and laboratory testing of artificially frozen ground. J. Cold Reg. Eng. 1987, 1, 22–48. [Google Scholar] [CrossRef]
  32. Yao, Z.; Cai, H.; Cheng, H. The model test study on frost heaving and melting sedimentation of subway tunnel construction with manual level freezing method. Adv. Mat. Res. 2011, 243, 3476–3483. [Google Scholar] [CrossRef]
  33. Alzoubi, M.A.; Nie-Rouquette, A.; Sasmito, A.P. Conjugate heat transfer in artificial ground freezing using enthalpy-porosity method: Experiments and model validation. Int. J. Heat Mass Transf. 2018, 126, 740–752. [Google Scholar] [CrossRef]
  34. Zhou, J.; Tang, Y. Centrifuge experimental study of thaw settlement characteristics of mucky clay after artificial ground freezing. Eng. Geol. 2015, 190, 98–108. [Google Scholar] [CrossRef]
  35. Matsuoka, N.; Abe, M.; Ijiri, M. Differential frost heave and sorted patterned ground: Field measurements and a laboratory experiment. Geomorphology 2003, 52, 73–85. [Google Scholar] [CrossRef]
  36. Eslami-nejad, P.; Bernier, M. Freezing of geothermal borehole surroundings: A numerical and experimental assessment with applications. Appl. Energy 2012, 98, 333–345. [Google Scholar] [CrossRef]
  37. Kurylyk, B.L.; McKenzie, J.M.; MacQuarrie, K.T.; Voss, C.I. Analytical solutions for benchmarking cold regions subsurface water flow and energy transport models: One-dimensional soil thaw with conduction and advection. Adv. Water Resour. 2014, 70, 172–184. [Google Scholar] [CrossRef]
  38. Hu, R.; Liu, Q.; Xing, Y. Case study of heat transfer during artificial ground freezing with groundwater flow. Water 2018, 10, 1322. [Google Scholar] [CrossRef] [Green Version]
  39. Pimentel, E.; Sres, A.; Anagnostou, G. Large-scale laboratory tests on artificial ground freezing under seepage-flow conditions. Geotechnique 2012, 62, 227. [Google Scholar] [CrossRef]
  40. Yang, X.; Ji, Z.; Zhang, P.; Qi, J. Model test and numerical simulation on the development of artificially freezing wall in sandy layers considering water seepage. Transp. Geotech. 2019, 21, 100293. [Google Scholar] [CrossRef]
  41. Hu, X.; Deng, S.; Ren, H. In situ test study on freezing scheme of freeze-sealing pipe roof applied to the Gongbei tunnel in the Hong Kong-Zhuhai-Macau bridge. Appl. Sci. 2017, 7, 27. [Google Scholar] [CrossRef]
  42. Hu, X.; Fang, T.; Chen, J.; Ren, H.; Guo, W. A large-scale physical model test on frozen status in freeze-sealing pipe roof method for tunnel construction. Tunn. Undergr. Sp. Technol. 2018, 72, 55–63. [Google Scholar] [CrossRef]
  43. Hu, X.; Wu, Y.; Li, X. A field study on the freezing characteristics of freeze-sealing pipe roof used in ultra-shallow buried tunnel. Appl. Sci. 2019, 9, 1532. [Google Scholar] [CrossRef] [Green Version]
  44. Taherdangkoo, R.; Abdideh, M. Application of wavelet transform to detect fractured zones using conventional well logs data (Case study: Southwest of Iran). Int. J. Pet. Eng. 2016, 2, 125–139. [Google Scholar] [CrossRef]
  45. Qiu, P.; Hu, R.; Hu, L.; Liu, Q.; Xing, Y.; Yang, H.; Qi, J.; Ptak, T. A numerical study on travel time based hydraulic tomography using the SIRT algorithm with Cimmino Iteration. Water 2019, 11, 909. [Google Scholar] [CrossRef] [Green Version]
  46. Taherdangkoo, R.; Abdideh, M. Fracture density estimation from well logs data using regression analysis: Validation based on image logs (Case study: South West Iran). Int. J. Pet. Eng. 2016, 2, 289–301. [Google Scholar] [CrossRef]
  47. Marwan, A.; Zhou, M.-M.; Abdelrehim, M.Z.; Meschke, G. Optimization of artificial ground freezing in tunneling in the presence of seepage flow. Comput. Geotech. 2016, 75, 112–125. [Google Scholar] [CrossRef]
  48. Cui, G. Simulation test theory of freezing method shaft sinking. J. China Univ. Min. Technol. 1989, 18, 59–68. (In Chinese) [Google Scholar]
  49. Cai, H.; Li, S.; Liang, Y.; Yao, Z.; Cheng, H. Model test and numerical simulation of frost heave during twin-tunnel construction using artificial ground-freezing technique. Comput. Geotech. 2019, 115, 1–11. [Google Scholar] [CrossRef]
  50. Liu, L.; Li, Z.; Liu, X.; Li, Y. Frost front research of a cold-region tunnel considering ventilation based on a physical model test. Tunn. Undergr. Sp. Technol. 2018, 77, 261–279. [Google Scholar] [CrossRef]
  51. Zhou, X.; Wang, M.; Tao, L.; Yang, S. Model test and prototype observation on artifical ground freezing and tunneling of Beijing subway. Chin. J. Geotech. Eng. 2003, 25, 676–679. (In Chinese) [Google Scholar] [CrossRef]
  52. Harris, C.; Murton, J.; Davies, M.C. Soft-sediment deformation during thawing of ice-rich frozen soils: Results of scaled centrifuge modelling experiments. Sedimentology 2000, 47, 687–700. [Google Scholar] [CrossRef]
  53. Zhou, J.; Tang, Y. Artificial ground freezing of fully saturated mucky clay: Thawing problem by centrifuge modeling. Cold Reg. Sci. Technol. 2015, 117, 1–11. [Google Scholar] [CrossRef]
  54. Zhou, J.; Zhou, G.; Ma, W.; Wang, J.; Zhou, Y.; Ji, S. Experimental research on controlling frost heave of artificial frozen soil with intermission freezing method. J. China Univ. Min. Technol. 2006, 35, 708–712. (In Chinese) [Google Scholar] [CrossRef]
  55. Zhou, Y.; Zhou, G. Intermittent freezing mode to reduce frost heave in freezing soils-experiments and mechanism analysis. Can. Geotech. J. 2012, 49, 686–693. [Google Scholar] [CrossRef]
  56. Cai, H.; Liu, Z.; Li, S.; Zheng, T. Improved analytical prediction of ground frost heave during tunnel construction using artificial ground freezing technique. Tunn. Undergr. Sp. Technol. 2019, 92, 103050. [Google Scholar] [CrossRef]
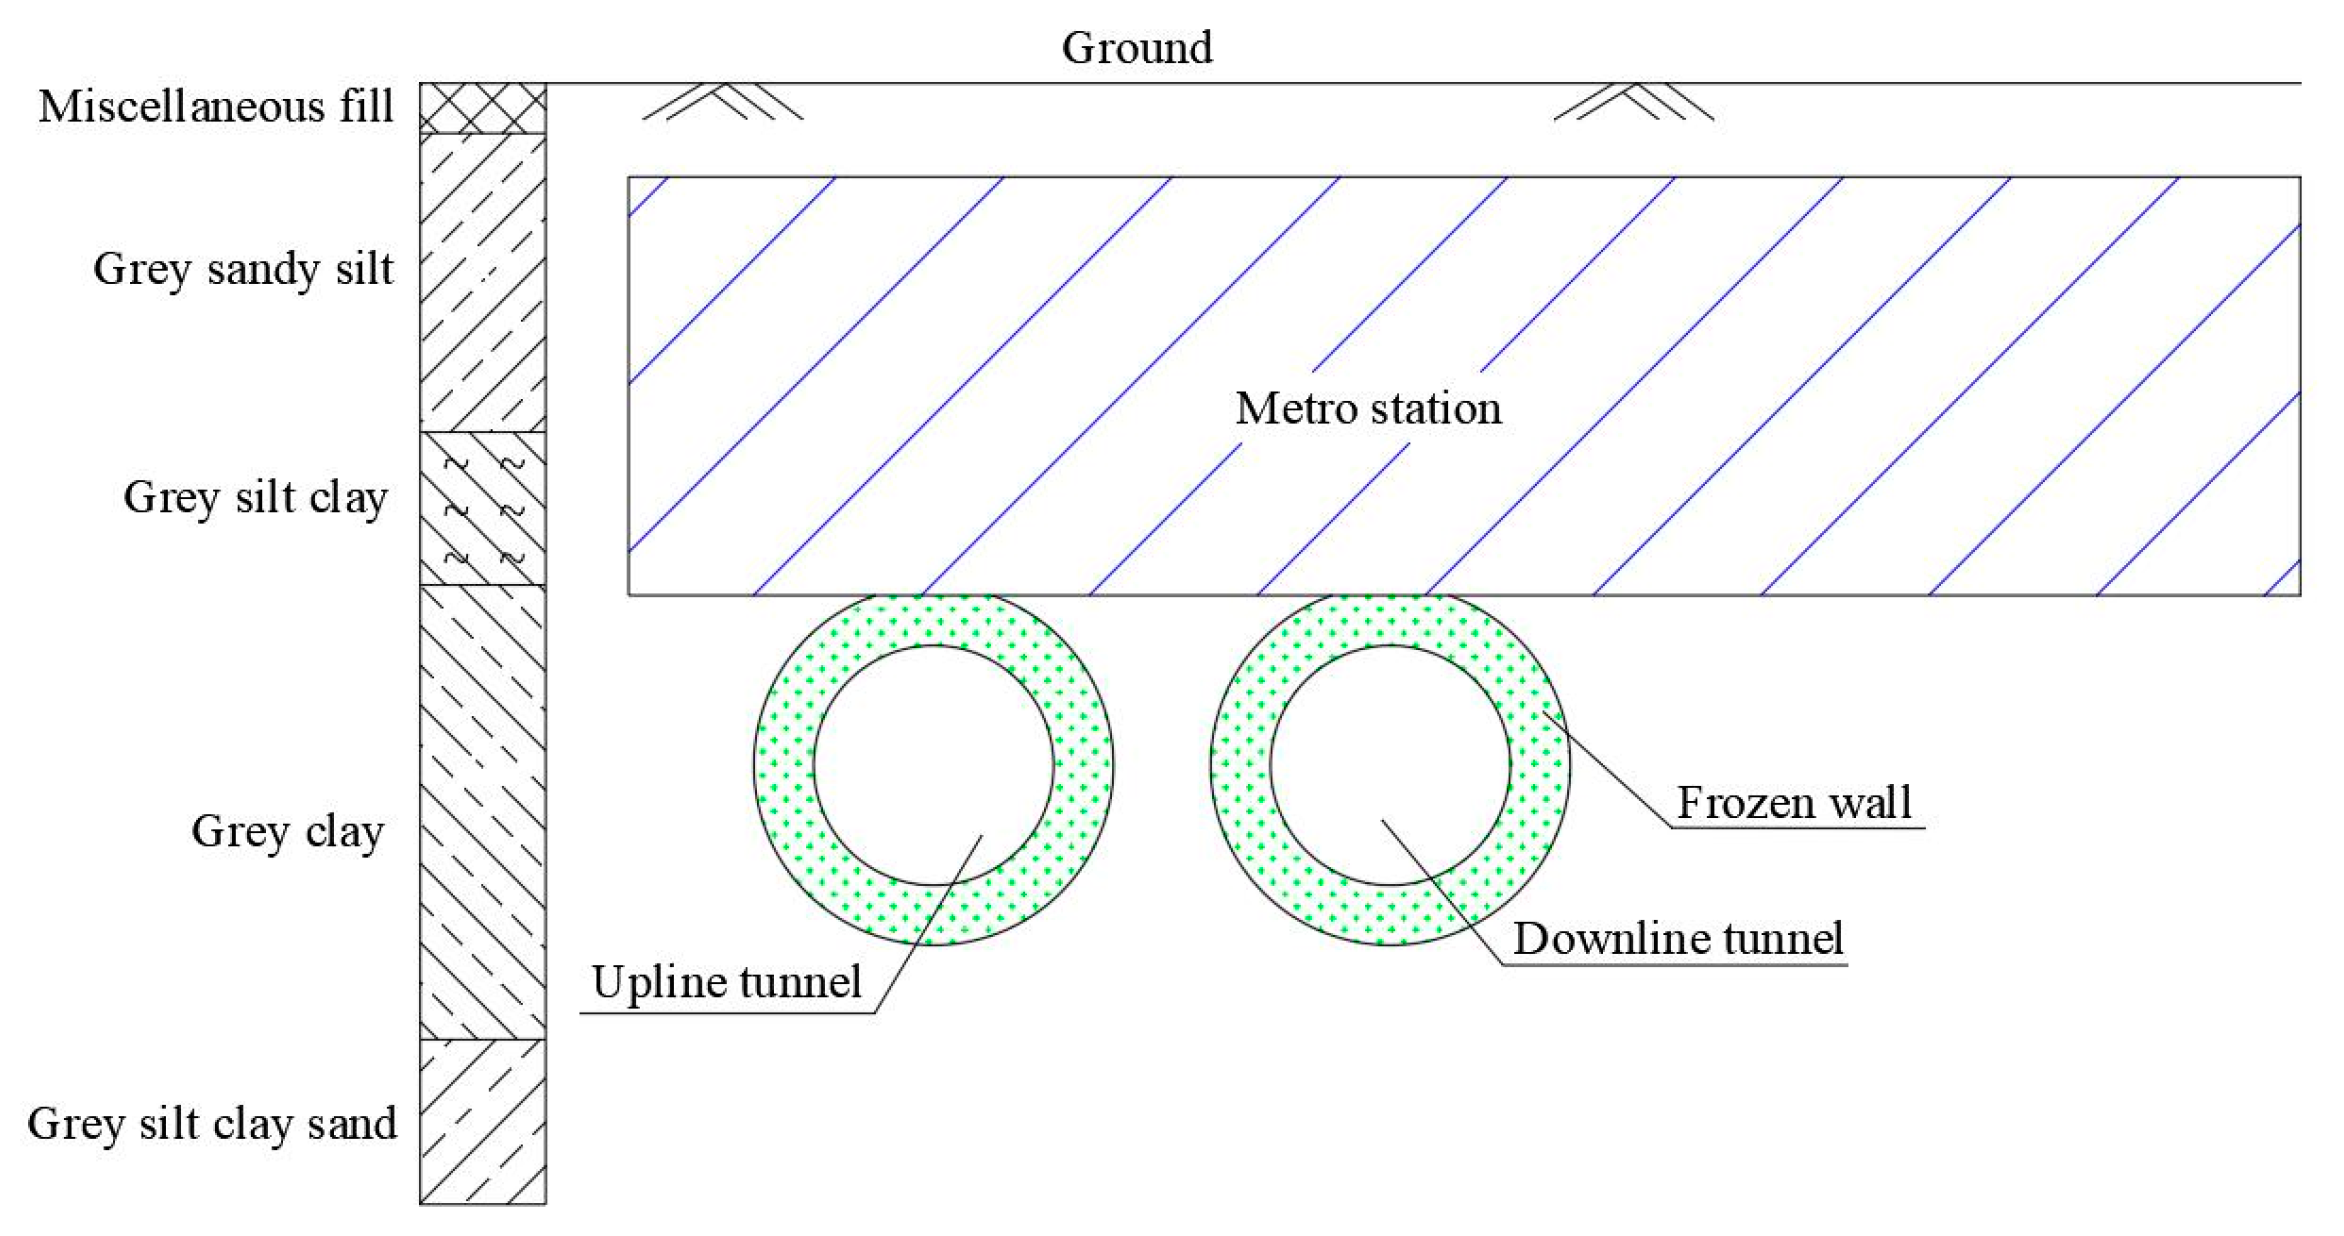
Figure 1. Schematic illustration of a closely underpassing project in Shanghai, China.
Applsci 10 00027 g001
Figure 2. (a) The in-situ experimental photograph and (b) its schematic diagram (in the unit of mm).
Applsci 10 00027 g002
Figure 3. The layout of freezing pipes and T1−6 are the measuring points of temperature (in the unit of mm).
Applsci 10 00027 g003
Figure 4. Schematic diagram of the arrangement of sensors and freezing pipes in freezing experiments. A1−C2 are displacement sensors and T1−T6 are temperature sensors. Blue and red lines indicate the pipes with −28 °C chilled brine and return brine, respectively.
Applsci 10 00027 g004
Figure 5. Displacement of base slab versus time induced by simultaneous freezing.
Applsci 10 00027 g005
Figure 6. Diagram of a simple method for the calculation of frost heave.
Applsci 10 00027 g006
Figure 7. Displacement versus time in different construction processes. The dotted lines 1−4 are the start times of freezing the upline Section I, upline Section II, downline Section I, and downline section II, and the dash lines 5−8 are the start times of excavating the upline Section I, upline Section II, downline Section I, and downline Section II, respectively. Note that the senor A2 was damaged in testing without available data.
Applsci 10 00027 g007
Table 1. The physical and mechanical parameters of grey silty clay.
MaterialDensity (g cm³)Water Content (%)Saturation (%)Freezing Temperature (°C)Specific Heat Capacity (W·m−1·°C−1)
Clay1.7838.5970.11.2