Dimension Measurement and Key Point Detection of Boxes through Laser-Triangulation and Deep Learning-Based Techniques
Abstract
1. Introduction
- (1)
- A hand-held visual sensor and online measurement system based on laser triangulation and deep learning technique for box dimension measurement are proposed.
- (2)
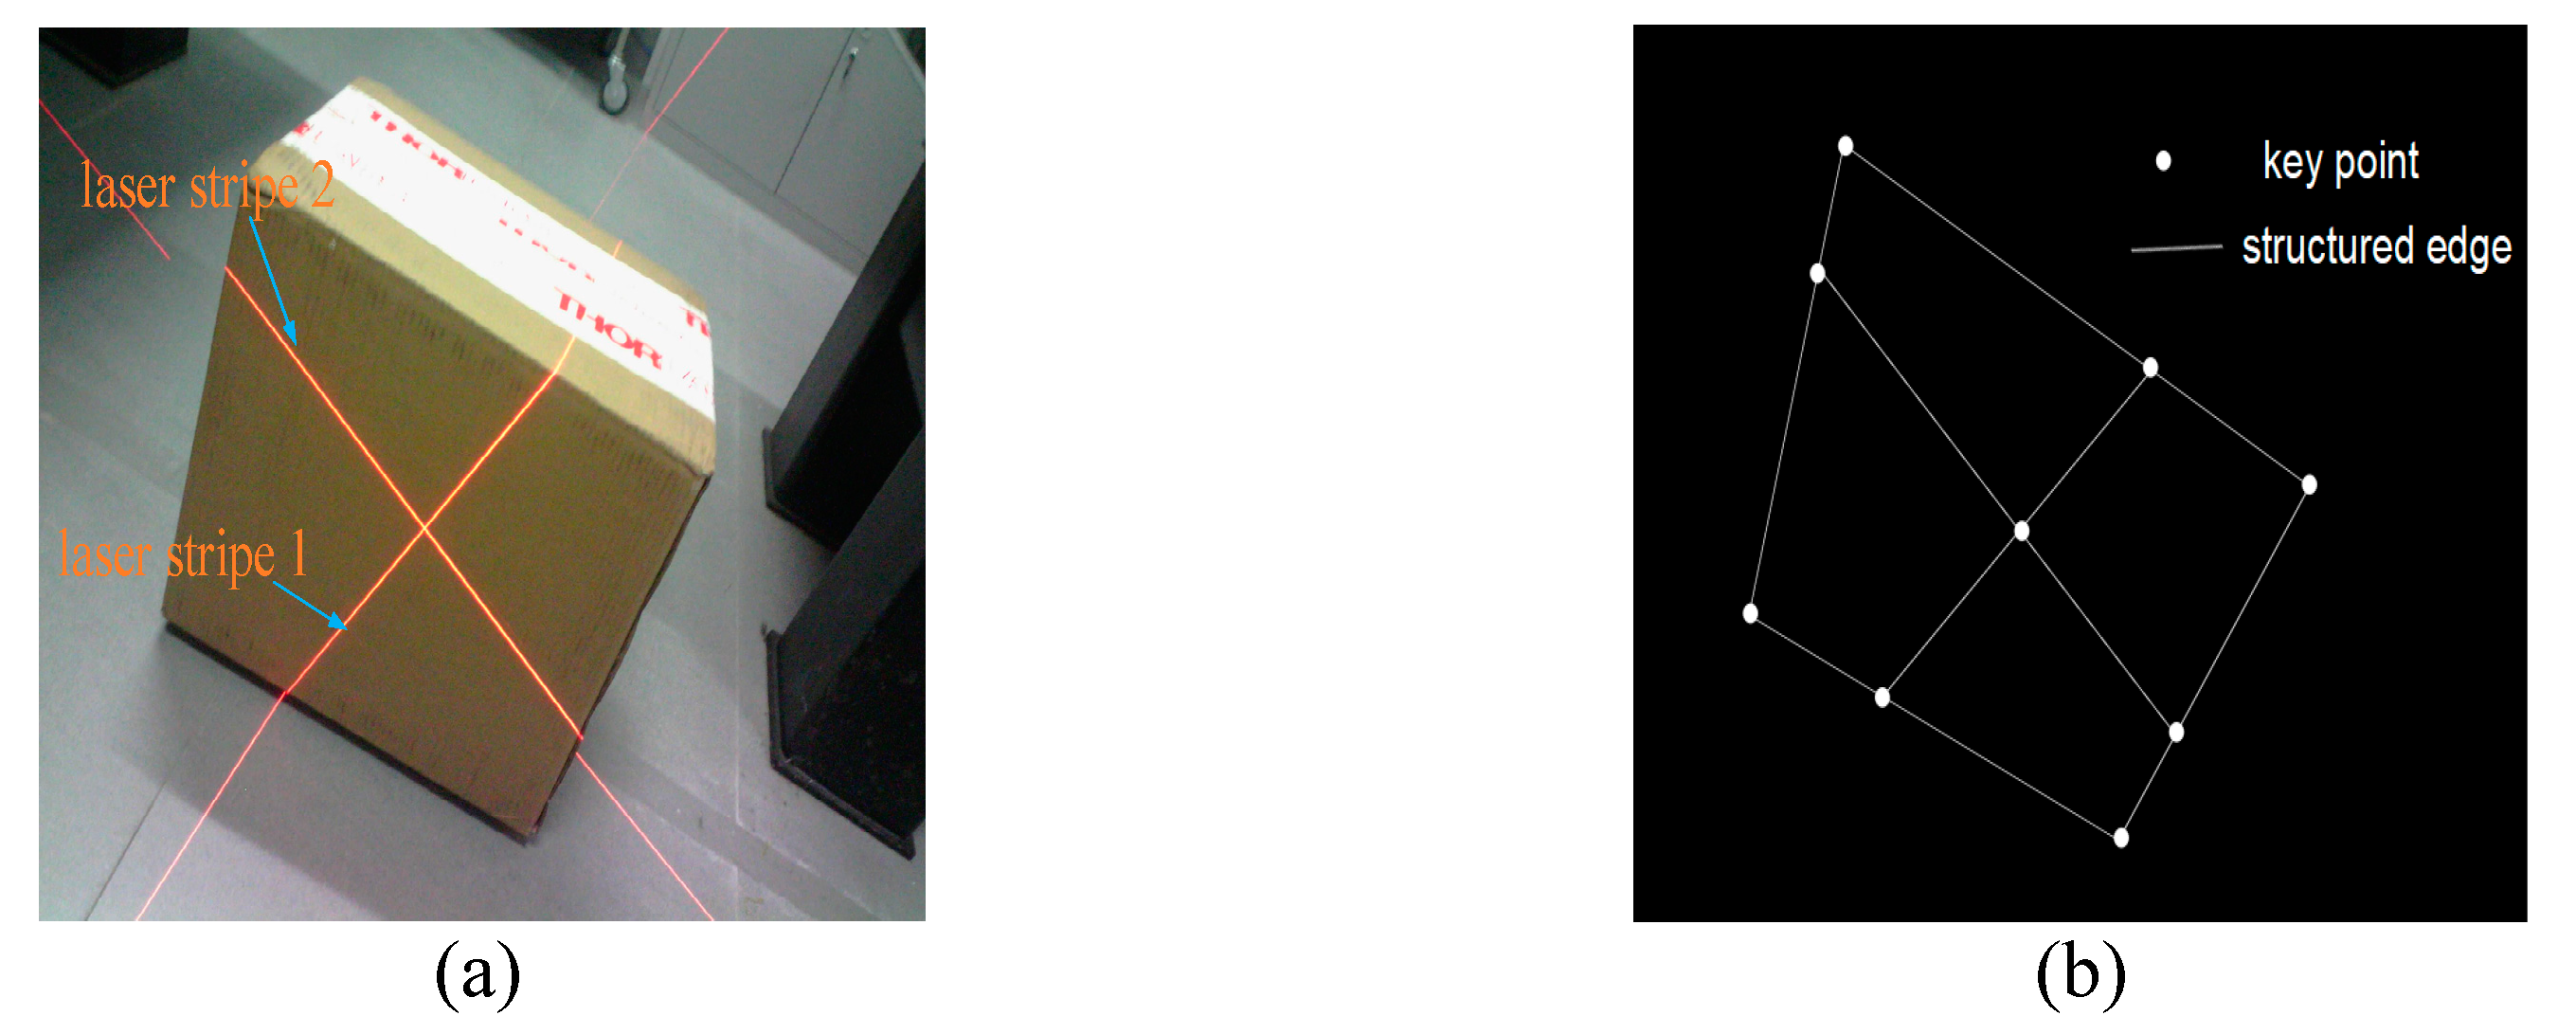
- A valid dataset of the laser-box images is created, and an effective structured edge detection and key point detection approach based on a Trimmed-HED network and straight-line processing are proposed.
- (3)
- An optimization method is proposed to achieve the robust calibration of the visual sensor.
2. Materials and Methods
3. Proposed Algorithmic Procedure
3.1. Dimension Measurement Principle
3.2. Automatic Calibration for the Visual Sensor
3.2.1. Parameter Calibration of the Visual Sensor
3.2.2. Optimization for Calibration Parameters by Analyzing the Probability Distributions and Outlier Removal
- (1)
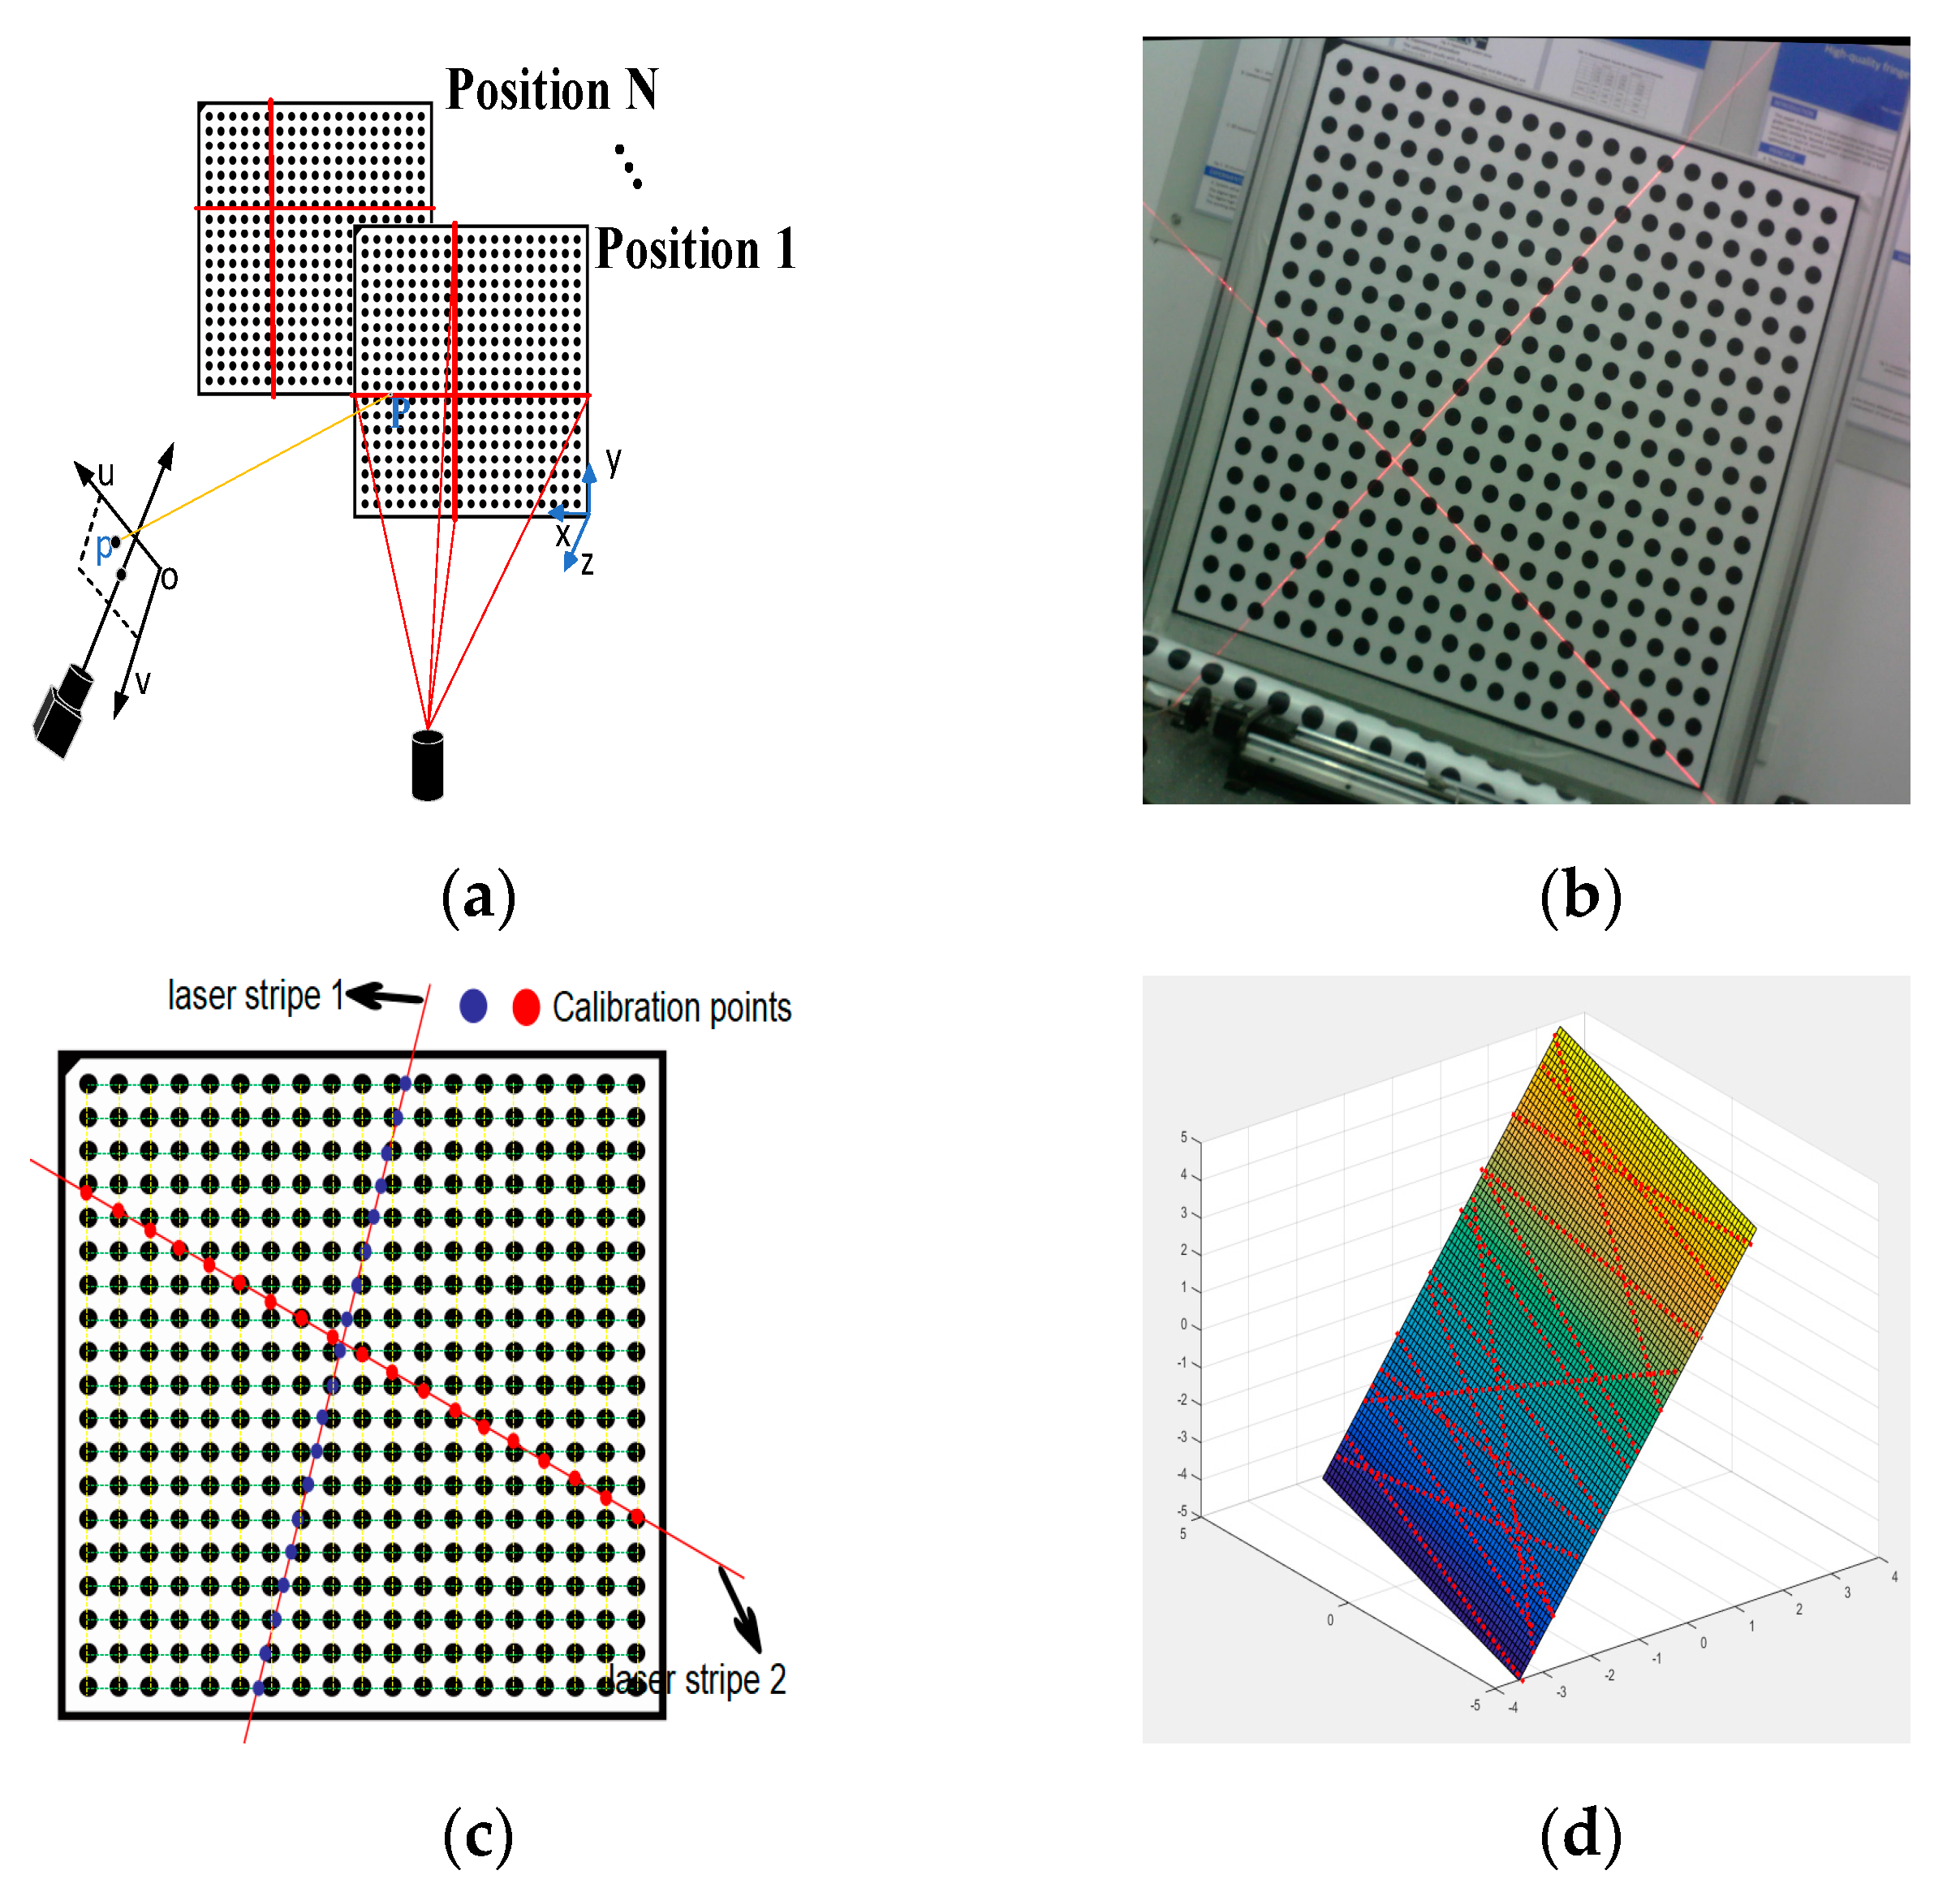
- Acquire N calibration pattern images with laser stripes in different positions, and feature points and calibration points can be detected successfully from these images.
- (2)
- Select M images from the N calibration pattern images randomly in Step (1) to form a new image set, and there would be form CN M subsets image total, where CN M is a binomial coefficient.
- (3)
- The internal and external parameters of the visual sensor by these subsets image in Step (2) are calculated respectively with the method described above. A total of CN M sets of parameter data are generated to form a matrix of Rn×12, where each row in the matrix corresponds to the parameters (α,β,u0,v0,k1,k2,a1,b1,c1,a2,b2,c2) of the device calculated by each subset of images.
- (4)
- For each column parameter of the Rn×12 matrix in Step (3), calculate the mean mp and standard deviation σp via the method of maximum likelihood estimation of a normal distribution.
- (5)
- From the matrix parameters in Step (4), remove the row in which value of at least one parameter data (α,β,u0,v0,k1,k2,a1,b1,c1,a2,b2,c2) not lie inside the range of [m − 3σ,m + 3σ] to form a new matrix and repeat the operation of Step (4) for the new matrix until no data were removed from the new matrix.
- (6)
- The nature mean of each column of the final matrix in Step (5) is used as the final internal and external parameters of the visual sensor.
3.2.3. Experimental Verification and Accuracy Assessment
3.3. Image Processing for the Laser-Box Image
3.3.1. Detecting Structured Edge Map
3.3.2. Detecting 2D Key Points via the Hough Transformation
- Step 1.
- The Hough line transform was used to detect the straight line ρ = xcos(θ) + ysin(θ) from the structured edge maps of the laser-box images and transformed from each straight line to the parameter space.
- Step 2.
- (ρ,θ) for many cells was quantified, and an accumulator for each interval area was created. For every pixel (x,y) in the structured edge map of the laser-box image, the quantized value (ρ,θ) was computed, and the nearly collinear line segments were clustered by a suitable threshold for ρ and θ.
- Step 3.
- The image space lines composed of the N first (ρ,θ) in Step 2 were obtained and fitted via the LSM. N is 6 in this study.
4. Experimental Results
4.1. Measurement Statistical Analysis Experimental of Varying Orientations of the Measurement Object
4.2. Measurement Statistical Analysis Experimental of the Changing Distance between the Visual Sensor and the Measured Box
4.3. Stability Analysis and Evaluation of Uncertainty in the Measurement Experimental of the Measurement System
4.4. Measurement Statistical Analysis Experimental for Various Boxes in Different Scenarios
4.5. Measurement Result in Real Applications
5. Conclusions
Author Contributions
Funding
Conflicts of Interest
References
- Georgousis, S.; Stentoumis, C.; Doulamis, N.; Athanasios, V. A Hybrid Algorithm for Dense Stereo Correspondences in Challenging Indoor Scenes. In Proceedings of the IEEE International Conference on Imaging Systems and Techniques, Chania, Greece, 4–6 October 2016; pp. 460–465. [Google Scholar]
- Mustafah, Y.; Noor, R.; Hasbi, H. Stereo vision images processing for real-time object distance and size measurements. In Proceedings of the International Conference on Computer and Communication Engineering, Kuala Lumpur, Malaysia, 22–27 May 2012; pp. 659–663. [Google Scholar]
- al Muallim, M.; Küçük, H.; Yılmaz, F.; Kahraman, M. Development of a dimensions measurement system based on depth camera for logistic applications. In Eleventh International Conference on Machine Vision; International Society for Optics and Photonics: Bellingham, WA, USA, 2018; Volume 11041, p. 110410. [Google Scholar]
- Park, H.; Messemac, A.; Neveac, W. Box-Scan: An efficient and effective algorithm for box dimension measurement in conveyor systems using a single RGB-D camera. In Proceedings of the 7th IIAE International Conference on Industrial Application Engineering, Kitakyushu, Japan, 26–30 March 2019. [Google Scholar]
- Ferreira, B.; Griné, M.; Gameiro, D. VOLUMNECT: Measuring volumes with Kinecttm. Int. Soc. Opt. Eng. 2014, 9013, 901304. [Google Scholar]
- Leo, M.; Natale, A.; Del-Coco, M.; Carcagnì, P.; Distante, C. Robust estimation of object dimensions and external defect detection with a low-cost sensor. J. Nondestruct. Eval. 2017, 36, 17. [Google Scholar] [CrossRef]
- Peng, T.; Zhang, Z.; Song, Y.; Chen, F.; Zeng, D. Portable System for Box Volume Measurement Based on Line-Structured Light Vision and Deep Learning. Sensors 2019, 19, 3921. [Google Scholar] [CrossRef] [PubMed]
- Gao, Q.; Yin, D.; Luo, Q.; Liu, J. Minimum elastic bounding box algorithm for dimension detection of 3D objects: A case of airline baggage measurement. IET Image Process. 2018, 12, 1313–1321. [Google Scholar] [CrossRef]
- Noll, R.; Krauhausen, M. Online laser measurement technology for rolled products. Ironmak. Steelmak. 2008, 35, 221–227. [Google Scholar] [CrossRef]
- Zhang, L.; Sun, J.; Yin, G.; Zhao, J.; Han, Q. A cross structured light sensor and stripe segmentation method for visual tracking of a wall climbing robot. Sensors 2015, 15, 13725–13751. [Google Scholar] [CrossRef] [PubMed]
- Appia, V.; Pedro, G. Comparison of fixed-pattern and multiple-pattern structured light imaging systems. Proc. SPIE 2014, 8979. [Google Scholar] [CrossRef]
- Molleda, J.; Usamentiaga, R.; García, D.; Bulnes, F.; Ema, L. Shape measurement of steel strips using a laser-based three-dimensional reconstruction technique. IEEE Trans. Ind. Appl. 2011, 47, 1536–1544. [Google Scholar] [CrossRef]
- Zhang, H.; Ren, Y.; Liu, C.; Zhu, J. Flying spot laser triangulation scanner using lateral synchronization for surface profile precision measurement. Appl. Opt. 2014, 53, 4405–4412. [Google Scholar] [CrossRef]
- Bieri, L.; Jacques, J. Three-dimensional vision using structured light applied to quality control in production line. Proc. SPIE 2004, 5457, 463–471. [Google Scholar] [CrossRef]
- Li, Y.; Li, Y.; Wang, Q.; Xu, D.; Tan, M. Measurement and defect detection of the weld bead based on online vision inspection. IEEE Trans. Instrum. Meas. 2010, 59, 1841–1849. [Google Scholar]
- Giri, P.; Kharkovsky, S.; Samali, B. Inspection of metal and concrete specimens using imaging system with laser displacement sensor. Electronics 2011, 6, 36. [Google Scholar] [CrossRef]
- Giri, P.; Kharkovsky, S. Dual-laser integrated microwave imaging system for nondestructive testing of construction materials and structures. IEEE Trans. Instrum. Meas. 2018, 67, 1329–1337. [Google Scholar] [CrossRef]
- Zhao, X.; Liu, H.; Yu, Y.; Xu, X.; Hu, W.; Li, M.; Ou, J. Bridge Displacement Monitoring Method Based on Laser Projection Sensing Technology. Sensors 2015, 15, 8444–8463. [Google Scholar] [CrossRef]
- Zhou, P.; Ke, X.; Wang, D. Rail profile measurement based on line-structured light vision. IEEE Access 2018, 6, 16423–16431. [Google Scholar] [CrossRef]
- Miao, H.; Xiao, C.; Wei, M.; Li, Y. Efficient Measurement of Key-Cap Flatness for Computer Keyboards with a Multi-line Structured Light Imaging Approach. IEEE Sens. J. 2019, 21, 10087–10098. [Google Scholar] [CrossRef]
- Xie, S.; Tu, Z. Holistically-nested edge detection. In Proceedings of the IEEE International Conference on Computer Vision, Santiago, Chile, 7–13 December 2015; pp. 1395–1403. [Google Scholar]
- Liu, Y.; Cheng, M.; Hu, X.; Wang, K.; Bai, X. Richer convolutional features for edge detection. In Proceedings of the IEEE conference on computer vision and pattern recognition, Honolulu, HI, USA, 21–26 July 2017; pp. 3000–3009. [Google Scholar]
- Shen, W.; Wang, B.; Jiang, Y.; Wang, Y.; Yuille, A. Multi-stage multi-recursive-input fully convolutional networks for neuronal boundary detection. In Proceedings of the IEEE International Conference on Computer Vision, Venice, Italy, 22–29 October 2017; pp. 2391–2400. [Google Scholar]
- He, J.; Zhang, S.; Yang, M.; Shan, Y.; Huang, T. Bi-Directional Cascade Network for Perceptual Edge Detection. In Proceedings of the IEEE Conference on Computer Vision and Pattern Recognition, Long Beach, CA, USA, 19 August 2019; pp. 3828–3837. [Google Scholar]
- Simonyan, K.; Zisserman, A. Very deep convolutional networks for large-scale image recognition. arXiv 2014, arXiv:1409.1556v6. [Google Scholar]
- Zhang, Z. A flexible new technique for camera calibration. IEEE Trans. Pattern Anal. Mach. Intell. 2000, 22, 1330–1334. [Google Scholar] [CrossRef]
- Tsai, R. A versatile camera calibration technique for high-accuracy 3D machine vision metrology using off-the-shelf TV cameras and lenses. IEEE J. Robot. Autom. 1987, 3, 323–344. [Google Scholar] [CrossRef]
- Heikkila, J. Geometric camera calibration using circular control points. IEEE Trans. Pattern Anal. Mach. Intell. 2000, 22, 1066–1077. [Google Scholar] [CrossRef]
- Zhang, Q.; Pless, R. Extrinsic calibration of a camera and laser range finder (improves camera calibration). In Proceedings of the 2004 IEEE/RSJ International Conference on Intelligent Robots and Systems, Sendai, Japan, 28 September–2 October 2004; Volume 3, pp. 2301–2306. [Google Scholar]
- Zhang, G.; Liu, Z.; Sun, J.; Wei, Z. Novel calibration method for a multi-sensor visual measurement system based on structured light. Opt. Eng. 2010, 49, 043602. [Google Scholar] [CrossRef]
- Vasconcelos, F.; Barreto, J.; Nunes, U. A minimal solution for the extrinsic calibration of a camera and a laser-rangefinder. IEEE Trans. Pattern Anal. Mach. Intell. 2012, 34, 2097–2107. [Google Scholar] [CrossRef] [PubMed]
- Dong, W.; Isler, V. A novel method for the extrinsic calibration of a 2D laser rangefinder and a camera. IEEE Sens. J. 2018, 18, 4200–4211. [Google Scholar] [CrossRef]
- So, E.; Michieletto, S.; Menegatti, E. Calibration of a dual-laser triangulation system for assembly line completeness inspection. In Proceedings of the 2012 IEEE International Symposium on Robotic and Sensors Environments Proceedings, Magdeburg, Germany, 16–18 November 2012; pp. 138–143. [Google Scholar]
- Marquardt, D. An algorithm for least-squares estimation of nonlinear parameters. J. Soc. Ind. Appl. Math. 1963, 11, 431–441. [Google Scholar] [CrossRef]
- Press, W.; Teukolsky, S.; Vetterling, W. Numerical Recipes in C: The Art of Scientific Computing; Cambridge University Press: Cambridge, MA, USA, 1995; Volume 10, pp. 176–177. [Google Scholar]


| Measurement | Value |
|---|---|
| Mean RMS calculated using 10 sets of calibration pattern images | 0.0568 |
| RMS calculated using the true parameters | 0.0215 |
| Parameters | Minimal Value | Maximal Value | True Value |
|---|---|---|---|
| α | 2345.064 | 2363.778 | 2353.85 |
| β | 2358.273 | 2377.399 | 2367.13 |
| u0 | 1244.827 | 1262.702 | 1254.69 |
| v0 | 1007.973 | 1026.720 | 1018.36 |
| k1 | −0.0241551 | −0.008247 | −0.016697 |
| k2 | 0.155643 | 0.3567460 | 0.232305 |
| a1 | 0.00905 | 0.0160500 | 0.01021 |
| b1 | −0.013303 | −0.009352 | −0.010614 |
| c1 | 0.0019727 | 0.002677 | 0.002166 |
| a2 | 0.0095584 | 0.013372 | 0.010326 |
| b2 | 0.009839 | 0.016606 | 0.010347 |
| c2 | 0.0018325 | 0.0025490 | 0.002031 |
| ODS | OIS | AP | |
|---|---|---|---|
| Original HED | 0.490 | 0.566 | 0.539 |
| Original HED (with our data set) | 0.621 | 0.662 | 0.648 |
| Trimmed-HED (with deep supervision) | 0.753 | 0.783 | 0.776 |
| Trimmed-HED (without deep supervision) | 0.803 | 0.816 | 0.809 |
| Measurement at Different Angles (The Measurement Error (mm) in Brackets) [The Relative Error (%) in Square Brackets] | |||||||
|---|---|---|---|---|---|---|---|
| Dim | Ground Truth | 90° | 75° | 60° | 45° | 30° | |
| (a) | W | 190.0 | 190.0 | 189.3 (−0.7) [0.37%] | 190.9 (+0.9) [0.47%] | 191.1 (+1.1) [0.58%] | 188.2 (−1.8) [0.95%] |
| L | 253.0 | 253.0 | 252.2 (−0.8) [0.32%] | 251.8 (−1.2) [0.47%] | 251.7 (−1.3) [0.51%] | 254.9 (+1.9) [0.75%] | |
| H | 400.0 | 400.0 | 400.9 (+0.9) [0.23%] | 401.6 (+1.6) [0.40%] | 401.9 (+1.9) [0.48%] | 396.2 (−3.8) [0.95%] | |
| (b) | W | 320.0 | 320.0 | 320.6 (+0.6) [0.19%] | 321.5 (+1.5) [0.47%] | 321.6 (+1.6) [0.50%] | 317.3 (−2.7) [0.84%] |
| L | 320.0 | 320.0 | 320.9 (+0.9) [0.28%] | 319.6 (−0.4) [0.13%] | 321.4 (+1.4) [0.44%] | 318.5 (−1.5) [0.47%] | |
| H | 620.0 | 620.0 | 621.3 (+1.3) [0.21%] | 622.4 (+2.4) [0.39%] | 617.5 (−2.5) [0.4%] | 623.5 (+3.5) [0.56%] | |
| Box | Dim | Ground Truth | Measurement at Three Box-Sensor Distances (mm) (The Measurement Error (mm) in Brackets) [The Relative Error (%) in Square Brackets.] | ||||
|---|---|---|---|---|---|---|---|
| /mm | 800 | 1200 | 1600 | 2000 | 2400 | ||
| (a) | W | 750.0 | 750.5 (+0.5) [0.07%] | 751.2 (+1.2) [0.16%] | 747.7 (−2.3) [0.31%] | 746.4 (−3.6) [0.48%] | 744.6 (−5.4) [0.72%] |
| L | 495.0 | 494.8 (−0.2) [0.04%] | 493.9 (−1.1) [0.22%] | 496.1 (+1.1) [0.22%] | 492.4 (−2.6) [0.53%] | 490.4 (−4.6) [0.93%] | |
| H | 330.0 | 330.4 (+0.4) [0.12%] | 330.8 (+0.8) [0.24%] | 329.0 (−1.0) [0.30%] | 326.9 (−3.1) [0.94%] | 333.9 (+3.9) [1.18%] | |
| (b) | W | 480.0 | 479.7 (−0.3) [0.63%] | 480.8 (+0.8) [0.17%] | 478.5 (−1.5) [0.31%] | 483.0 (+3.0) [0.63%] | 485.3 (+5.3) [1.10%] |
| L | 550.0 | 549.6 (−0.4) [0.07%] | 550.6 (+0.6) [0.11%] | 548.1 (−1.9) [0.35%] | 552.4 (+2.4) [0.44%] | 555.4 (+5.4) [0.98%] | |
| H | 380.0 | 380.4 (+0.4) [0.11%] | 379.1 (−0.9) [0.24%] | 381.3 (+1.3) [0.34%] | 382.6 (+2.6) [0.68%] | 376.3 (−3.7) [0.97%] | |
| (c) | W | 450.0 | 450.5 (+0.5) [0.11%] | 449.6 (−0.4) [0.09%] | 451.4 (+1.4) [0.31%] | 446.8 (−3.2) [0.71%] | 454.8 (+4.8) [1.07%] |
| L | 650.0 | 649.1 (−0.9) [0.14%] | 648.7 (−1.3) [0.20%] | 648.4 (−1.6) [0.25%] | 654.2 (+4.2) [0.65%] | 655.8 (+5.8) [0.89%] | |
| H | 350.0 | 350.1 (+0.1) [0.03%] | 350.5 (+0.5) [0.14%] | 348.8 (−1.2) [0.34%] | 353.3 (+3.3) [0.94%] | 346.7 (−3.3) [0.94%] | |
| No. | W (a) | L (a) | H (a) | W (b) | L (b) | H (b) | W (c) | L (c) | H (c) | W (d) | L (d) | H (d) |
|---|---|---|---|---|---|---|---|---|---|---|---|---|
| 1 | 110.5 | 410.1 | 620.3 | 391.6 | 239.9 | 530.6 | 1111.7 | 749.1 | 880.1 | 689.8 | 570.2 | 1500.9 |
| 2 | 109.4 | 409.6 | 620.4 | 390.2 | 240.1 | 529.1 | 1109.3 | 750.9 | 879.3 | 688.3 | 570.6 | 1501.2 |
| 3 | 107.6 | 411.6 | 619.6 | 390.5 | 241.9 | 531.2 | 1112.2 | 752.3 | 881.7 | 690.4 | 569.3 | 1499.7 |
| 4 | 110.2 | 411.8 | 621.1 | 389.4 | 240.7 | 531.7 | 1109.5 | 751.7 | 882.6 | 689.7 | 568.9 | 1496.5 |
| 5 | 110.3 | 410.6 | 620.2 | 388.3 | 238.6 | 529.6 | 1111.3 | 747.1 | 879.4 | 687.3 | 571.2 | 1502.3 |
| 6 | 109.8 | 408.3 | 621.8 | 390.6 | 239.9 | 528.7 | 1109.6 | 749.3 | 878.2 | 691.2 | 570.3 | 1505.3 |
| 7 | 109.2 | 410.3 | 617.6 | 391.5 | 238.9 | 529.1 | 1113.3 | 750.6 | 880.9 | 690.3 | 571.4 | 1496.8 |
| 8 | 110.7 | 408.1 | 619.7 | 391.4 | 241.6 | 530.1 | 1112.5 | 748.3 | 881.1 | 691.5 | 567.6 | 1498.3 |
| 9 | 110.6 | 409.5 | 618.3 | 388.6 | 240.1 | 527.6 | 1108.7 | 750.2 | 882.3 | 689.2 | 568.4 | 1502.4 |
| 10 | 111.3 | 410.2 | 621.8 | 391.2 | 240.9 | 528.9 | 1108.1 | 751.6 | 881.6 | 688.4 | 571.9 | 1497.9 |
| 11 | 111.5 | 411.3 | 617.4 | 390.4 | 241.5 | 529.6 | 1111.6 | 750.3 | 880.9 | 691.3 | 570.7 | 1500.8 |
| 12 | 110.1 | 412.3 | 620.5 | 389.2 | 238.6 | 530.8 | 1109.8 | 749.7 | 880.4 | 691.5 | 568.3 | 1496.3 |
| 13 | 109.6 | 408.6 | 619.7 | 388.6 | 239.2 | 530.7 | 1107.2 | 748.6 | 879.8 | 692.6 | 569.6 | 1498.4 |
| 14 | 108.3 | 409.9 | 621.9 | 389.2 | 240.5 | 531.8 | 1111.5 | 747.9 | 876.4 | 690.7 | 571.6 | 1503.6 |
| 15 | 109.2 | 410.7 | 619.5 | 391.7 | 241.1 | 528.4 | 1110.6 | 750.6 | 881.5 | 689.1 | 569.5 | 1502.7 |
| Mean | 109.88 | 410.19 | 619.98 | 390.16 | 240.23 | 529.86 | 1110.46 | 749.88 | 880.41 | 690.08 | 569.96 | 1500.20 |
| Ave_Err | 0.94 | 1.01 | 1.26 | 1.09 | 0.91 | 1.2 | 1.46 | 1.36 | 1.20 | 1.22 | 1.12 | 2.35 |
| Std | 1.01 | 1.21 | 1.36 | 1.15 | 1.03 | 1.20 | 1.68 | 1.44 | 1.57 | 1.39 | 1.26 | 2.68 |
| μA | 1.05 | 1.25 | 1.41 | 1.19 | 1.07 | 1.25 | 1.74 | 1.49 | 1.63 | 1.44 | 1.30 | 2.77 |
| No. | (a) | (b) | (c) | (d) | ||||
| Box |  |  |  |  |  |  |  |  |
| Edge map |  |  |  |  |  |  |  |  |
| Key points |  |  |  |  |  |  |  |  |
| Results | L: 99.5 (−0.5) W: 220.6(+0.6) H: 349.6(−0.4) | L: 301.2(+0.6) W: 368.3(−2.2) H: 428.5(−1.5) | L: 282.4(+0.4) W: 291.1(+1.1) H: 318.2(+2.2) | L: 294.2(+1.2) W: 312.3(+2.3) H: 349.8(−0.2) | ||||
| No. | (e) | (f) | (g) | (h) | ||||
| Box |  |  |  |  |  |  |  |  |
| Edge map |  |  |  |  |  |  |  |  |
| Key points |  |  |  |  |  |  |  |  |
| >Results | L: 256.3(+1.3) W: 500.6 (−9.4) H: 811.3(+11.3) | L: 172.3(+1.8) W: 222.7(+2.1) H: 332.6(+2.1) | L: 170.1(−0.4) W: 221.9(+1.3) H: 331.5(+1.0) | L: 319.9(−0.1) W: 318.3(−1.7) H: 623.8(+3.8) | ||||
| No. | Actual Length/mm | Measured Length/mm | Length Error/mm | Relative Error of Length (%) | Volume Error/m3 | Relative Error of Volume (%) |
|---|---|---|---|---|---|---|
| (a) | 250.5 | 250.3 | −0.2 | 0.079% | −0.00019 | 0.476% |
| 350.8 | 350.1 | −0.7 | 0.199% | |||
| 454.6 | 453.7 | −0.9 | 0.197% | |||
| (b) | 560.5 | 561.6 | +1.1 | 0.196% | 0.000130 | 0.125% |
| 430.5 | 431.3 | +0.8 | 0.185% | |||
| 430.5 | 429.4 | −1.1 | 0.255% | |||
| (c) | 400.0 | 402.3 | +2.3 | 0.575% | 0.000175 | 0.488% |
| 450.0 | 452.1 | +2.1 | 0.466% | |||
| 200.0 | 198.9 | −1.1 | 0.550% | |||
| (d) | 520.0 | 523.6 | +3.6 | 0.690% | 0.000193 | 0.164% |
| 440.0 | 438.3 | −1.7 | 0.386% | |||
| 515.0 | 513.6 | −2.4 | 0.466% | |||
| (e) | 220.4 | 220.0 | −0.4 | 0.181% | −0.00012 | 0.451% |
| 300.7 | 299.4 | −1.3 | 0.432% | |||
| 430.5 | 431.2 | +0.7 | 0.162% | |||
| (f) | 288.0 | 288.1 | +0.1 | 0.034% | −0.00001 | 0.039% |
| 288.0 | 287.6 | −0.4 | 0.138% | |||
| 310.0 | 310.2 | +0.2 | 0.064% | |||
| (g) | 1350.0 | 1354.5 | +4.5 | 0.333% | 0.000450 | 0.673% |
| 330.0 | 329.8 | −0.2 | 0.060% | |||
| 150.0 | 150.6 | +0.6 | 0.400% | |||
| (h) | 1800.0 | 1807.6 | +7.6 | 0.422% | 0.003262 | 0.503% |
| 900.0 | 904.8 | +4.8 | 0.533% | |||
| 400.0 | 398.2 | −1.8 | 0.450% |
© 2019 by the authors. Licensee MDPI, Basel, Switzerland. This article is an open access article distributed under the terms and conditions of the Creative Commons Attribution (CC BY) license (http://creativecommons.org/licenses/by/4.0/).
Share and Cite
Peng, T.; Zhang, Z.; Chen, F.; Zeng, D. Dimension Measurement and Key Point Detection of Boxes through Laser-Triangulation and Deep Learning-Based Techniques. Appl. Sci. 2020, 10, 26. https://doi.org/10.3390/app10010026
Peng T, Zhang Z, Chen F, Zeng D. Dimension Measurement and Key Point Detection of Boxes through Laser-Triangulation and Deep Learning-Based Techniques. Applied Sciences. 2020; 10(1):26. https://doi.org/10.3390/app10010026
Chicago/Turabian StylePeng, Tao, Zhijiang Zhang, Fansheng Chen, and Dan Zeng. 2020. "Dimension Measurement and Key Point Detection of Boxes through Laser-Triangulation and Deep Learning-Based Techniques" Applied Sciences 10, no. 1: 26. https://doi.org/10.3390/app10010026
APA StylePeng, T., Zhang, Z., Chen, F., & Zeng, D. (2020). Dimension Measurement and Key Point Detection of Boxes through Laser-Triangulation and Deep Learning-Based Techniques. Applied Sciences, 10(1), 26. https://doi.org/10.3390/app10010026


